Abstract
The prediction of the seismic response of non-yielding wall systems is complex. Over the years, researchers have presented numerous solutions to this problem, which often yield varying results concerning maximum forces, deformations, and the residual state of the system during a severe loading condition. In addition, few of the available methods of analysis can explicitly consider the compaction-induced lateral force when the backfill is dry, sandy soil and the wall is closer to a source of vibration. In this research, a numerical model is developed and validated by experiments to study the transient and residual dynamic responses of non-yielding walls supporting over-consolidated sand. A numerical parametric study is conducted, considering the effects of backfill soil friction angle, soil over-consolidation ratio, and wall modulus of elasticity. The response of the soil–wall system is investigated by considering the maximum and residual deformation of the wall, distribution of lateral earth pressure, as well as the magnitude and location of the resultant earth force. The findings of this study show that the maximum transient and residual forces and deflections often considerably exceed the static values in non-yielding walls subjected to ground motions. In general, increasing the backfill friction angle increases the maximum deflection and force increments. A surge in the backfill over-consolidation ratio reduces the maximum and the residual deflection and force increments. Finally, increasing the panel wall elastic modulus lowers the maximum and residual deflection increments, raises the maximum force increments, and decreases residual force increments. Results from the study on residual strength can be useful for implementation in performance-based design procedures under extreme loading conditions.
1. Introduction
Retaining walls are important geotechnical structures used in numerous civil engineering projects. Such applications include basement walls, highway bridges, culverts, and temporary soil retention structures used during excavations. Retaining walls may be classified into yielding and non-yielding structures. In a yielding structure, the wall experiences sufficient displacement, and the soil’s shear strength is mobilized so that active and passive lateral earth pressures can be achieved. In a non-yielding structure, the wall is restrained against lateral motion at its top and bottom. Thus, it does not displace laterally or rotate about its toe; hence, active and passive earth pressures do not develop. Non-yielding walls appear in bridge abutments, tunnels, and basement walls among other applications. Such walls are typically designed assuming at-rest conditions and a triangular lateral earth pressure distribution. However, this assumption is no longer valid when the soil is subjected to compaction-induced stresses.
Compaction-induced stresses behind non-yielding walls have been thoroughly investigated in previous studies [1,2,3,4,5,6]. However, the estimation of design forces becomes more complex when seismic loads are introduced. Since non-yielding walls do not allow active conditions to develop, seismic earth pressures are expected to be larger in non-yielding walls than in yielding walls. In the literature, several solutions have been proposed to estimate the seismic pressure or forces behind non-yielding walls; however, these solutions often yield conflicting results. Moreover, they generally focus on the maximum response of the soil–wall system, although the residual state of the wall is also an important aspect of the system’s seismic performance.
This study builds on the earlier work of El-Emam [6], which focused on the static behavior of a prototype non-yielding wall supporting over-consolidated sand, by addressing the dynamic performance of the soil–wall system. It also extends the preliminary dynamic study of Bigdeli and El-Emam [7] on the soil–structure interaction system. The research utilizes a finite difference model to conduct a parametric study on the seismic response of non-yielding walls. The parameters examined are the backfill soil friction angle, backfill compaction level, and wall elastic modulus. The seismic behavior of the considered model wall is discussed in terms of the lateral wall deflection, lateral earth pressure distribution, and lateral earth force magnitude and location. Both maximum and residual values are presented and discussed.
2. Literature Review
The earliest work on the seismic earth pressure on retaining walls includes the well-known work of Okabe [8] in 1926 and Mononobe and Matsuo [9] in 1929. This effort led to the development of the Mononobe–Okabe method (M-O method) for estimating the seismic earth pressure behind retaining walls. The M-O method is based on a limit equilibrium analysis in which seismic loads are considered through a pseudo-static approach, in which a rigid wedge of soil is assumed following Coulomb’s wedge theory. The total force imposed on the wall by the soil is computed considering the force equilibrium of the wedge and assuming that active earth pressures can develop. The M-O method was developed for gravity walls capable of rotating about their base; thus, may not accurately represent the actual seismic loading conditions of non-yielding walls. Other limitations of the M-O method include its use of only peak ground acceleration (PGA) [7], as well as its extreme overestimation of seismic earth pressures at large ground accelerations [10]. Seed and Whitman [11] introduced a simplified version of the M-O method that solves the issue of diverging seismic forces at large ground accelerations. In their method, the point of force application was changed from 1/3 of the wall’s height (H) from the base to 0.6 H. However, this method still only considers the case of yielding walls.
Recognizing that non-yielding walls do not sufficiently displace to allow for full plastic stress conditions in the soil, Wood [12] attempted to solve this problem by employing the theory of elasticity. Using the results of finite element analyses, an analytical solution was developed for the seismic pressure behind rigid non-moving walls sitting on hard rock. It was shown that his solution yielded accurate results when the amplification effects could be neglected and when the frequency of the motion was less than 50% of the natural frequency of the backfill soil layer. Wood found the seismic stress distribution to be parabolic, and related the point of load application to the soil Poisson’s ratio and lateral extent of the backfill. For a wide backfill, the point of load application was found to be 0.63H. Seismic forces calculated by this method, in some cases, may be 2–3 times those calculated using the M-O method.
Veletsos and Younan [13,14] conducted rigorous numerical analyses to estimate the seismic earth pressure behind yielding and non-yielding retaining walls while treating the soil as visco-elastic material. The effect of wave propagation, frequency content, and amplification of the ground motions were accounted for in their studies. Furthermore, the effects of wall flexibility and base rotational stiffness were found to significantly affect the seismic earth pressure. For a rigid wall with a fixed base, the seismic forces were found to be larger than those estimated by the M-O method. Nevertheless, for realistic wall flexibilities and more compliant foundations, seismic forces were found to significantly decrease from the case of a fixed rigid wall.
Ostadan [15] used the results of finite element analyses to develop a simplified method for estimating the seismic earth pressure on non-yielding walls. His method was developed for buried building walls, which are restrained laterally at the top and bottom due to the presence of floor diaphragms. The method assumed the wall rests on a rigid foundation. It considered the frequency content of the motion, the potential amplification of seismic waves, the interaction of the soil with the structure, and the dynamic properties of the soil. The system was represented by a single degree of freedom (SDOF) and the non-linear effects of the soil could be considered. Ostadan’s method predicts seismic forces larger than those estimated by the M-O method but smaller than those predicted by Wood’s method.
Whitman [16] presented a comprehensive literature review on the seismic response and design of soil retaining structures. He suggested that the use of the M-O method is acceptable for basement walls that can move relative to the soil. However, for walls founded on hard rock, the use of Wood’s method is reasonable. Psarropoulos et al. [17] developed and validated numerical models to predict the seismic earth pressure behind flexible and rigid walls by modeling the soil as a visco-elastic material. Results from the study showed good agreement with Wood’s method for a rigid wall fixed against rotation. Good agreement was also shown between the results of this study and those of Veletsos and Younan’s study [18] for flexible walls capable of rotating about their base. Sitar and his research collaborators [10,19,20] investigated seismic earth pressures behind model basement walls by conducting a series of centrifuge tests on three cases of basement walls. The cases included a non-displacing cantilever wall, a non-displacing basement wall, and a conventional displacing retaining wall. In their studies, it was shown that the M-O and Seed and Whitman methods provide a reasonable upper bound for seismic earth pressures, even in basement walls, when the foundation is compliant.
Richards et al. [21] used a kinematic approach to model the behavior of rigid retaining walls with different movement types. The considered cases include rotation about the base, rotation about the top, translation, and no movement. The non-linear response and plastic behavior of the soil in the free field were considered. The authors presented charts showing the expected dynamic lateral earth pressure coefficient for varying horizontal accelerations and wall movements. The locations of the resultant dynamic forces were also presented for the varying cases. They found out that, although the plastic deformations of the free field are much larger than the elastic ones, the distribution of lateral pressure with depth for cohesion-less soil is the same and depends only on the distribution of shear modulus with depth.
Kloukinas et al. [22] developed a solution for predicting the total seismic thrust and point of application on a non-yielding wall. The problem was solved considering the dynamics of wave propagation through an elastic medium. Varying parameters included soil Poisson’s ratio, soil damping, input motion’s frequency, and the rotational stiffness of the wall base. For the case of a non-compliant foundation, the method yields results that agree well with Veletsos and Younan’s solution [13].
Yi [23] conducted a pseudo-static finite element analysis to estimate the seismic thrust and its point of application on non-yielding rigid walls. He considered a rigid wall restrained against lateral movement and rotation, sitting on a rigid base; a similarly restrained wall sitting on a non-rigid base; and a rigid wall restrained only against rotation, sitting on a non-rigid base. Equations were developed to predict the seismic thrust as a function of the peak ground acceleration for each case and identify the location of the resultant seismic force. Seismic forces projected by this method were found to be approximately 15% to 17% larger than those calculated by Wood’s method [12]. Similarly, Kitsis et al. [24] conducted a parametric study on the seismic response of non-yielding walls using the finite element method with consideration of the backfill friction angle, the motion intensity, and the wall height. The purpose of the study was to determine whether the phase difference between the maximum wall inertial force and maximum soil thrust during ground shaking is significant. They concluded that the phase difference is practically insignificant.
Chen [25] developed an analytical solution using limit equilibrium to estimate seismic earth pressure on massive or non-yielding retaining walls. The boundary conditions were chosen to simulate different bridge abutment arrangements. Finite element models were created to verify the analytical solution. The analytical method produced seismic forces approximately 10% lower than those of the finite element models. It was found that for rough walls (i.e., friction angle between soil and wall not equal to zero), the M-O method underestimates the seismic thrust on massive walls.
Mansour et al. [26] employed the finite difference method to estimate the seismic earth pressure on basement walls. The interaction between the basement wall, backfill, and foundation soil was considered in the analysis. The investigated parameters include the thickness and height of the basement wall, the intensity of the ground motion, and the depth of the bedrock. It was concluded that basement walls should not be designed using available methods for seismic pressures on yielding and rigid non-yielding walls. Basement walls must instead be designed considering the deformation of the wall between its base and top. The authors provided empirical equations that give upper and lower bound values for the expected peak seismic thrust, moment, and shear.
Hushmand et al. [27] investigated seismic earth pressures on an underground reservoir structure by means of centrifuge testing. It was found that the behavior of the structure in question does not fall under the categories of yielding walls and rigid-non-yielding walls due to the flexibility of the wall structure. It was concluded that the methods available in the literature for estimating seismic earth pressures on retaining walls do not adequately predict the forces in the structure in question.
The Mononobe–Okabe (M-O) method is often employed to design yielding retaining walls. However, some studies [10,14,16,19,20] found that the method yields conservative results even for basement walls, which are often assumed to be non-yielding. Other studies [12,13,15,23,25] found the M-O method to be unconservative for non-yielding walls. The explanation for this discrepancy lies in the foundation assumption employed by both groups of researchers. Non-yielding walls sitting on stiff foundations tend to develop larger seismic earth pressures than non-yielding walls sitting on soft soil. This conclusion was pointed out by several researchers [10,16] and is included in the NEHRP guidelines [28].
More recently, Jaiswal and Chauchan [29] used finite element analysis to study the static and dynamic response of geosynthetic layers with complete wraparound ends as a horizontal reinforcement layer underneath the foundation. The outcome of the study showed that the bearing capacity ratios of reinforced to unreinforced loose and dense soils are, respectively, equal to 1.61 and 1.17 under static load conditions, and 1.86 and 1.36 under seismic load conditions. Halder and Chakraborty [30] appraised the seismic active earth pressure on reinforced retaining walls by combining the finite element limit analysis with the modified pseudo-dynamic method. They found out that soil reinforcement behaves like a composite block for relatively smaller reinforcement spacing and maximum tensile resistance is developed when a fully rough interface condition exists between the soil and reinforcement. Zhang et al. [31] researched the influence of seismic loadings on the whole-field average displacement and failure mode of slopes by means of shaking table tests using sine waves having amplitudes of 0.10–0.20 g and frequencies of 3–8 Hz. Findings from the study showed that with the progression of vibration, the slope changes from an initial shallow linear sliding to overall circular arc sliding. The amplitude of seismic loading has a larger effect on slope deformation than its frequency. Chen et al. [32] studied the active earth pressure on a firm slope on gravity walls rotating about their base using adaptive finite element limit analysis. Findings from the research demonstrated that the backfill progressively fails from top to bottom and the backfill above the failure surface goes through a plastic state. Compared with the traditional limit analysis method, the seismic slip line method does not need to pre-assume the failure mechanisms. Panah and Ramezani [33] proposed a new method for estimating the horizontal seismic acceleration coefficient for reinforced soil walls adjacent to the rock slopes, using outcomes from shaking tables and pushback pressure tests. The obtained results showed that there is conservatism in the AASHTO’s formulations for non-yielding walls and agreement with the AASHTO’s formulations for flexible walls. A comprehensive literature review that addressed experimental tests and numerical studies on the subject has recently been carried out by Khan et al. [34].
The conducted literature review in this study has shown that most studies on this subject tend to focus on the maximum response of non-yielding walls but do not address the state of the wall at the end of a seismic event. Although the use of an appropriate level of residual strength for the design and analysis of foundation and retaining structures is still controversial, the residual strength has a major impact on the cost of remediation following a severe earthquake. This is because post-failure soil stability and displacements of earth structures are controlled primarily by the residual strengths of the failed soils. Thus, this investigation fills the research gap by providing more insight into the case of a non-yielding wall resting on a stiff foundation in terms of both the maximum and the residual seismic response.
3. Methodology
The parametric study herein is conducted using a validated model developed with the help of the finite difference software FLAC Version 6.0 [35]. The dimensions and configuration of the model, shown in Figure 1, were chosen to replicate the reduced-scale (1/4 scale) experimental model utilized in the primary author’s earlier research on the subject [6]. However, in the numerical model of this study, the scale was reverted to the prototype-scale. The results of El-Emam’s experimental program were used to validate the numerical model [6]. Details of the experimental model, numerical model, and its validation are described in this section.
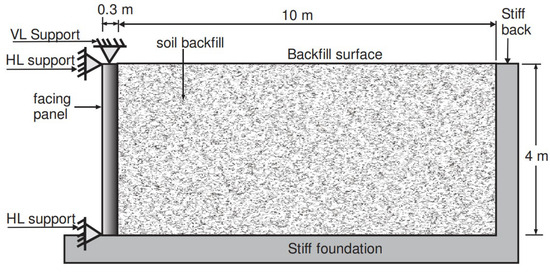
Figure 1.
Configuration and dimensions of prototype non-yielding wall.
3.1. Experimental Program
The physical model shown in Figure 2 was used to validate the FLAC model of this study. The physical model had dimensions of 1.0 m, 1.4 m, and 2.4 m for height, width, and length, respectively. The thickness of the non-yielding wall was 76 mm. These dimensions are representative of a 4 m-high prototype wall according to the Iai Similitude rule for a 1 g scale model [36]. The non-yielding retaining wall and backfill were held by a rigid box. This box was attached to a shaking table platform with dimensions 2.7 m by 2.7 m. The shaking table was used to apply vibratory compaction to the soil during the construction stages. A rigid reaction beam was used to laterally restrain the top and bottom of the wall, creating a non-yielding wall condition. Load cells at the top and bottom of the wall were used to measure the horizontal forces applied by the backfill soil. Vertical load cells were used to measure the vertical force at the wall footing. The wall was supported vertically by 3 sliders, which allowed the vertical and horizontal reactions to be decoupled [37,38]. Wall deflection at mid-height was measured by means of a cable-extension position transducer attached to the rigid reaction beam. The backfill soil was placed in 8 layers of 0.125 m thickness. This was performed to control the volume change in the soil during vibratory compaction. Each layer of soil was compacted via vibration before the next layer was placed. The soil used was a uniform sand containing sharp angular and subangular particles. The peak friction angle of the sand was 51° from the direct shear test. A thin layer of this sand was glued to the bottom of the backfill container to prevent the slippage of sand particles relative to the base. Sidewall friction was minimized by lining the walls with transparent polyethylene sheets and Perspex.
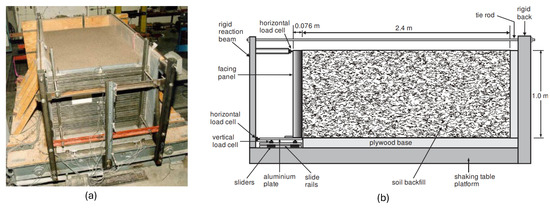
Figure 2.
Set-up of an experimental model in the laboratory. (a) Photo, (b) Schematic diagram [6].
3.2. Numerical Modeling
Before constructing the prototype-scale numerical model, a FLAC model was first developed with the dimensions of the reduced-scale physical model. The depth, length, and wall thickness of the model were the same as the physical model. The width of the box was not modeled since plane strain conditions were assumed, and a 2D analysis was carried out. The back side of the box was modeled as a rigid boundary similar to the rigid back of the physical model. The boundary condition at the toe of the wall was modeled using one-dimensional two-node beam elements with 3 hinges, as shown in Figure 3. This boundary condition facilitates the output of vertical and horizontal forces developed at the base.
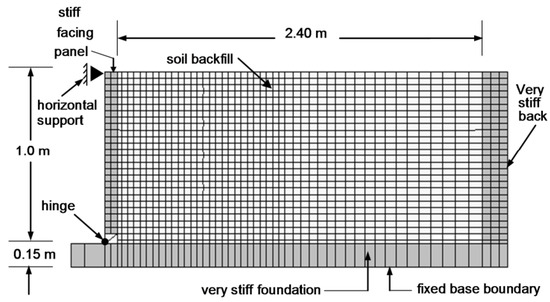
Figure 3.
FLAC numerical model used for validation by El-Emam’s experiments.
The boundaries around the soil, namely, the front non-yielding wall, the rigid foundation, and the rigid back wall were defined using 4-noded linear elastic zones. The facing panel was modeled as a linear and elastic material with a unit weight of 17.24 kN/m3. Panel shear (Gw) and bulk (kw) moduli of 1000 MPa and 1100 MPa, respectively, were adopted and the failure stress of the panel was set to be unlimited. These properties were used to ensure the high stiffness of the wall. The interface friction angle (δ) between the uniform wall was back-calculated from the experimental results. An average interface friction angle of 0 was obtained; however, a value of 2° was adopted for the FLAC model to maintain numerical stability. A rigid interface was defined at the base to prevent the slipping of soil particles along the foundation. This was performed to simulate the effect of gluing a thin sand layer to the base of the container. A mesh convergence study was carried out to determine the optimum number of mesh elements for the model. Figure 4 shows the variation in vertical and horizontal force on the wall with a changing number of mesh elements, indicating that a minimum of 1288 soil elements is adequate.
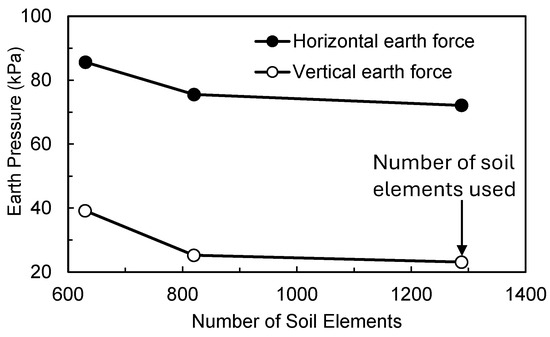
Figure 4.
Mesh convergence study outcome.
The soil was modeled as an elastoplastic material following the Mohr–Coulomb constitutive model. The cohesion of the soil was assumed 0, while the friction angle was taken as the “true” peak plane strain friction angle. The peak plane strain friction angle of the sand in the experimental study was back-calculated by El-Emam et al. [39] using experimental and numerical direct shear tests. The friction angle in the numerical model was taken as 58°, according to their findings. This friction angle was found to be consistent with Bolton’s [40] equation for predicting the plane strain friction angle of soil. The shear modulus (G) and bulk modulus (K) of the sand was also back-calculated by El-Emam et al. [39] using the same procedure and found to be equal to 7 MPa and 6 MPa, respectively. Material properties of the numerical model are summarized in Table 1.

Table 1.
Material properties of validation model.
The numerical model was built following the compaction sequence of the experimental model, i.e., compaction was carried out for each soil layer for 8 layers. Compacting soil layers using vibration in the numerical model proved to be time-consuming; thus, a different approach was utilized. After the placement of each soil layer, the soil was compacted by applying a horizontal stress equivalent to the stress calculated using Ko, as defined by Mayne and Kulhawy’s equation [41]:
where ‘ϕ’ is the soil friction angle and OCR is the soil over-consolidation ratio. The soil is then taken to equilibrium prior to the placement of the next soil layer. This method of compaction was successfully employed by Seed and Duncan [5]. The OCR of the soil in the experimental model was found to be equal to 4 [6] and used in the validation model when calculating Ko in Equation (1). In the numerical model, horizontal stresses were applied after the placement of each layer by matching the Ko value corresponding to OCR = 4. The comparison between the horizontal and vertical forces on the wall and the location of the resultant force at each construction stage, provided in Figure 5, confirms the validity of this method with the experimental observations.
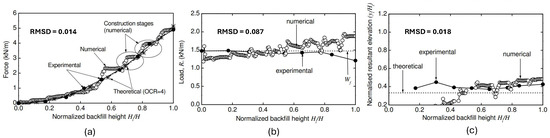
Figure 5.
Comparison between experimental and numerical results. (a) Lateral earth force, (b) vertical earth force, and (c) lateral earth force resultant elevation.
3.3. Model Validation
The validation of the numerical model was analyzed, and the total horizontal force, vertical force at the wall foundation, and location of the resultant horizontal force at each construction stage (after compaction of each soil layer) were recorded and compared to those of the experimental model [6]. The theoretical values of these outputs were calculated for reference. Figure 5a shows the total lateral earth force applied on the wall at different heights (during the construction stages). Good agreement can be observed between the experimental and numerical results. The total vertical force on the wall foundation (Figure 5b) was found to be very close to the theoretical and experimental values. Due to the smooth interface between the wall and backfill soil, the total vertical force is equal to the weight of the wall panel. The largest deviation in the numerical results occurs at the full height stage of the wall. This difference could be the result of using a small interface angle of 2° instead of the theoretical value of 0. A comparison of the location of the resultant lateral earth force can be seen in Figure 5c. At a height ratio greater than 0.5, the numerical and experimental results are relatively close. At height ratios lower than 0.5, the numerical results slightly underestimate the location of the resultant force. This may be due to the effect of the rigid interface condition at the base of the numerical model. Overall, the numerical results follow the proper trends and show good quantitative agreement with the experimental results.
To overcome the scattering of numerical points, Root Mean Square Deviation (RMSD) is used to validate the numerical model results versus the experimental model results. The RMSD aggregates the magnitudes of the errors in predictions for various data points into a single measure. An RMSD value of 0 (almost never achieved in practice) indicates a perfect fit to the data, while a lower RMSD is better than a higher one. The RMSD for the three measured responses is shown in Figure 5, with very low values indicating excellent agreement between the numerical and experimental results.
3.4. Analysis of Prototype Model
After validation, the numerical model was scaled up to the prototype dimensions, as shown in Figure 1, following Iai’s scale factors for 1 g models [36]. The same modeling procedure used in the validation study was utilized to create the prototype model. The geometry of the control FLAC numerical model is shown in Figure 6, while the adopted control material properties are presented in Table 2, together with Iai’s scale factors λ = 4. A parametric study was conducted on this model by subjecting it to the 14 s of real seismic base excitation shown in Figure 7. This real ground acceleration record was chosen due to its predominant high-frequency content, which can be critical for the short-period structure considered in this study.
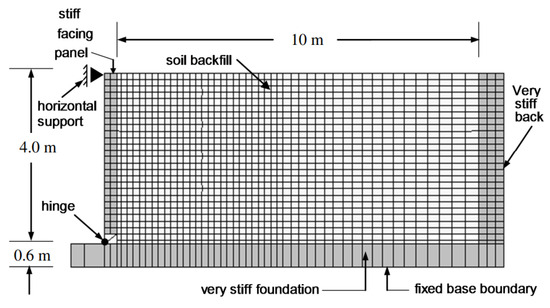
Figure 6.
FLAC numerical model of the prototype-scale wall.
Table 2.
Material properties of the prototype-scale model.
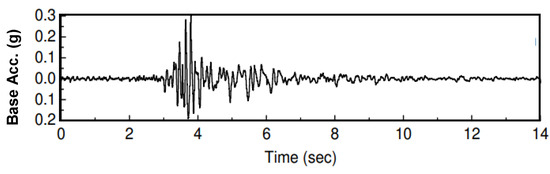
Figure 7.
Seismic base excitation used in the study.
The selected ground motion record, Figure 7, mainly includes high-frequency content, which aligns with the expected natural frequencies of stiff, short-period structures, such as the non-yielding wall modeled in this study. The validation of the numerical model developed based on the experimental model contains the relatively shallow and dense backfill soil with an OCR as high as 4 (Section 3.2), resulting in higher shear wave velocities and, thus, a higher natural frequency of the soil deposit. It is expected that the coupled system (wall + backfill) will have a natural frequency within a short-period range, making the chosen seismic input suitable for capturing the dynamic behavior of both the wall and the surrounding soil.
The values of the investigated parameters that include the backfill friction angle, ϕ, over-consolidation ratio, OCR, and wall elastic modulus, Ew, are summarized in Table 3. The seismic performance of each run is examined by considering the output parameters shown in Figure 8: (a) the incremental lateral deformation of the wall at mid-height (Δx), (b) the seismic pressure distribution (c), the total lateral earth force (RH), and (d) the elevation of the resultant earth force (yR). Note that the incremental deflection refers to the difference between the deflection due to seismic action only, after subtracting the static deflection. The displacement of the base due to excitation is subtracted from the total displacement at the wall’s mid-height to obtain the deflection of the wall with respect to its bottom support. The elevation of the resultant lateral earth force was calculated using the recorded forces at the top and bottom of the wall (RHT and RHB, respectively). Both peak and residual values of these outputs are considered, and the base excitation is applied after the wall has been subjected to the compaction effort and its own weight. The initial conditions of the dynamic analysis are based on the state of the wall after static deflections and stresses have been developed. The following assumptions are made for the parametric study: (1) the foundation of the soil–wall system is rigid and the backfill surface is horizontal, (2) the backfill soil is purely frictional (i.e., cohesion = 0), and (3) the base excitation is only applied in the horizontal direction (i.e., vertical acceleration = 0).
Table 3.
Parameters varied in this study.
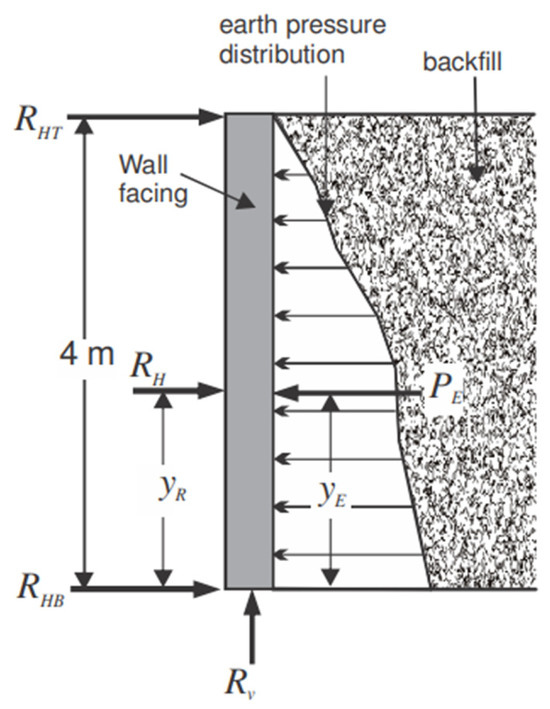
Figure 8.
Force diagram showing labeled outputs.
4. Results
The results of the parametric study are discussed in this section; for each test run, time histories for several outputs are obtained and analyzed. The maximum transient and the residual value of each response are used to investigate the effect of each parameter on the seismic response of the non-yielding wall. The residual response is taken as the average value during the last second of base excitation. Sample time histories for the control test run are shown in Figure 9. It can be seen that the transient deflections, lateral earth pressures, and lateral earth forces can significantly differ from the static values (Figure 9a–c). Furthermore, residual deflections, stresses, and forces can be seen at the end of the base excitation. Figure 9d shows the variation in the location of the resultant lateral earth force. The location of the transient resultant force ranges between 0.1 H and 0.6 H from the base. Even at the end of the ground motion, the elevation of the resultant force remains distinct from the elevation of the static resultant (0.5 H from the base). These results suggest that the stress distribution can considerably differ from the static value both during the seismic event and aftershock. The qualitative description of the time histories shown in Figure 9 is applicable to most test runs in this study.
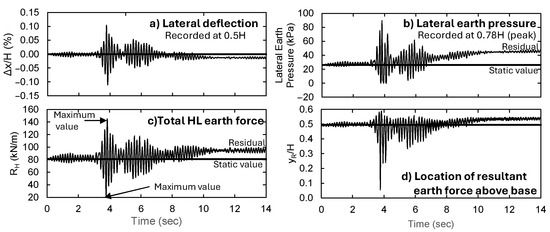
Figure 9.
Time history for the control test run. (a) Lateral deflection, (b) lateral earth pressure, (c) total earth force, and (d) location of resultant earth force.
4.1. Effect of Backfill Soil Friction Angle
The effect of the backfill friction angle on the seismic response of the non-yielding wall was investigated by analyzing the control model at five different friction angles. The internal soil friction angles considered were 30°, 35°, 40°, 45°, and 50°. Figure 10 shows the variation in maximum and residual normalized incremental deflections at mid-height with backfill friction angle. The figure shows that an increase in backfill friction angle causes a clear rise in the maximum incremental deflection with little impact on the residual incremental deflection. This is a surprising outcome since increasing the friction angle is expected to improve the soil’s stability. This trend can be explained by observing the response accelerations of the walls in question.
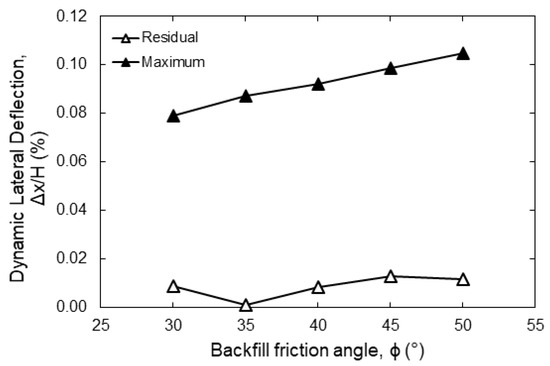
Figure 10.
Variation in maximum and residual wall lateral deflection with backfill friction angle.
Although not explicitly clear, the unexpected drop in residual deflection at ϕ = 35° may be linked to lower amplification of seismic energy within the soil–wall system at that specific friction angle. In other words, the system’s natural frequency and the dominant frequency content of the input motion at ϕ = 35°, may have caused less resonance and consequently smaller accumulated residual deformations. However, more investigations are required to confirm this finding.
Response accelerations of the non-yielding wall at mid-height for three backfill friction angles are shown, together with the base acceleration in Figure 11, which shows the 1 s time increment with the highest response. It can be seen from the figure that the maximum response acceleration in all three cases was larger than the base excitation. The extent of motion amplification can be defined in terms of an amplification factor, which is the ratio of the maximum response acceleration amplitude to the base acceleration amplitude.
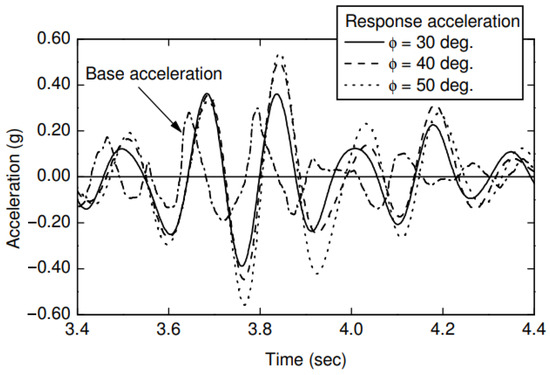
Figure 11.
Base and response accelerations at mid-height at different backfill friction angles.
Figure 12 shows the amplification factors for the soil and the wall at mid-height. It is clear that the amplification of response is more pronounced for soil–wall systems with larger friction angles. In the models investigated, increasing the soil friction angle could have caused the natural frequency of the soil–wall system to approach the dominant frequencies of the chosen ground motion record. Thus, the surge in the maximum deflection increment with friction angle may be attributed to the larger amplification effects at larger friction angles. Residual deflections above the static values are observed for all friction angles, except for the case of ϕ = 35°. The residual deflection increment did not show a consistent trend as the backfill friction angle varied.
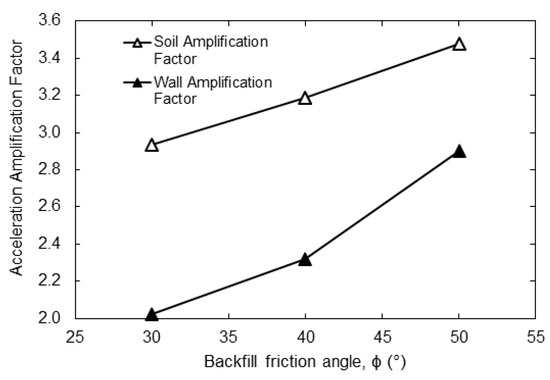
Figure 12.
Wall and soil acceleration amplification factors at different backfill friction angles.
Figure 13 shows the maximum transient and residual earth pressures for the non-yielding wall at different backfill friction angles. Static pressures are also shown for comparison. It can be seen in Figure 13a that for all friction angles, the maximum earth pressure exceeded the static soil pressure along most of, or the entire, wall height. Models with ϕ = 40°, 45°, and 50° developed higher maximum pressures in the upper half of the wall compared to the lower half. Models with ϕ = 30° and 35° showed a different trend in which pressures did not decrease at the bottom half of the wall. The models with higher friction angles (40°, 45°, and 50°) showed maximum pressures larger than those of the models with lower friction angles (30° and 35°) at the upper half of the wall. At the bottom half of the wall, the models with higher friction angles (40°, 45°, and 50°) showed maximum pressures lower than those of the models with lower friction angles (30° and 35°). Residual earth pressures (Figure 13b) were lower than the static values at the upper half of the wall for all friction angles. At the bottom half of the wall, residual pressures were larger than the static values. Figure 13b confirms that redistribution of stresses occurs in a non-yielding wall system at the end of a seismic event.
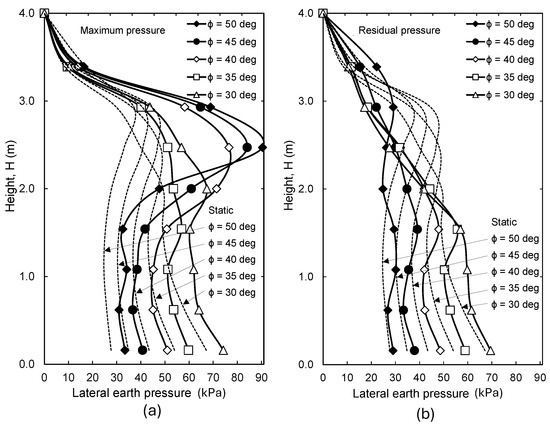
Figure 13.
Variation in critical lateral earth pressure with backfill friction angle. (a) Maximum pressure, (b) residual pressure.
Figure 14 shows the maximum, residual, and static resultant earth forces on the wall at varying backfill friction angles. As seen in the figure, the maximum total earth force during base shaking decreased as the backfill friction angle increased. However, the maximum dynamic force increment, which is the change in force above the static condition, increased with increasing friction angle. This suggests that the decrease in total earth force is attributed to the lower static forces associated with stronger soils (larger friction angles). The increase in maximum dynamic force increment can be attributed to the system’s amplification of the base signal as explained before. The residual earth force follows a trend similar to the maximum earth force. The total residual earth force decreased with an increasing friction angle, while the residual dynamic force increment increased with an increasing friction angle, except when ϕ was changed from 45° to 50°. It is important to note that both the maximum and residual forces exceeded the static values at all backfill friction angles considered. On average, the increase from the static force to the residual force was 12.5%. This suggests that non-yielding walls that have experienced earthquakes may develop permanent earth forces beyond the static values. These forces may be critical if the wall is subjected to subsequent seismic events or if the wall is to be analyzed again for future modification or maintenance. Finally, the dynamic amplitude, which is the difference between the total maximum and minimum transient lateral force, increased when the friction angle increased.
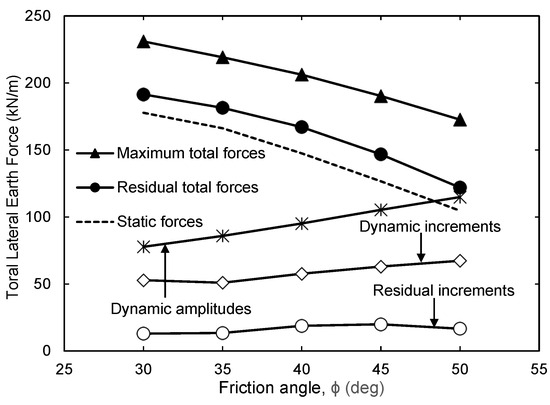
Figure 14.
Variation in maximum and residual lateral earth forces with backfill friction angle.
The elevation above the base of the maximum, minimum, residual, and static resultant lateral earth force is illustrated in Figure 15 for different backfill friction angles. The location of the resultant force is important in the structural design of non-yielding walls, as it allows for the calculation of the critical shear and bending moments acting on the wall. For a wall restrained at the top and bottom, a resultant earth force located at mid-height is expected to produce the largest bending moments. Figure 14 shows that the elevation of the maximum transient force above the base was larger than that of the static force at all friction angles. This increase was slightly more pronounced at larger friction angles. For example, at ϕ = 30°, the elevation of the total lateral force increased from 0.39H (static) to 0.42H (static + dynamic), an increase of 7.7%. At ϕ = 50°, the elevation of the total lateral force increased from 0.48H (static) to 0.54H (static + dynamic), an increase of 12%. As an average, the location of the total earth force (static + dynamic) may be taken as 0.05H above that of the static case with the same friction angle. The elevation of the minimum transient force was significantly lower than the corresponding static value at all friction angles considered in this study. The location of the residual force was found to be slightly below that of the static force for lower friction angles and was closer to the static force at higher friction angles.
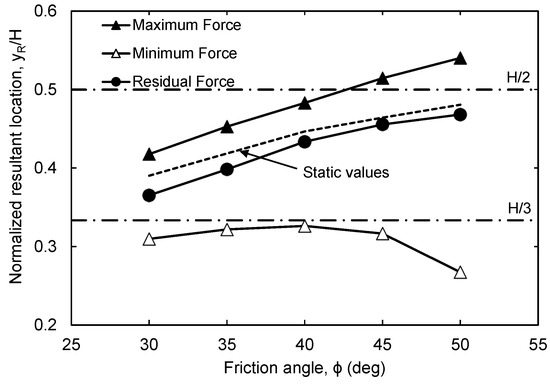
Figure 15.
Variation in maximum, minimum, and residual resultant force elevation with friction angle.
4.2. Effect of Backfill Over-Consolidation Ratio
The effect of compaction effort on the seismic response of the non-yielding wall is examined by varying the OCR of the backfill. Changing the backfill OCR alters the lateral earth pressure to be applied for compaction in accordance with Equation (1), which simulates soils with different degrees of compaction. Figure 16 shows the dynamic, incremental lateral deflection of the wall at mid-height, normalized to the height of the wall. Maximum and residual deflections are shown. The figure shows that increasing the OCR ratio of the backfill results in a consistent decrease in the maximum and residual deflection increments of the wall. This suggests that a higher compaction effort, which yields a larger OCR ratio in the backfill, leads to lower wall deflections during and after ground shaking. The effect of backfill OCR on the dynamic deflection increments is more pronounced for OCR values less than 3.
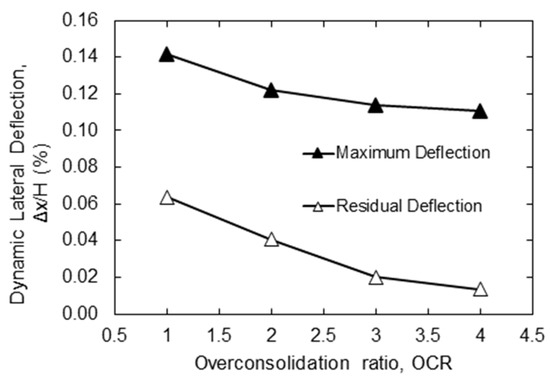
Figure 16.
Variation in maximum and residual lateral wall deflection at mid-height with backfill OCR.
Figure 17 shows the maximum and residual total lateral earth pressures subjected to the wall during base shaking at different backfill OCR values. Static earth pressures prior to dynamic loading for each case are also shown for comparison. Figure 17a shows that for all OCR values, the base excitation significantly increased the lateral earth pressure beyond the static conditions within the top half of the wall. This increase was less significant within the bottom half of the wall. The large increase in pressures in the upper half of the wall may be attributed to the amplification of response as waves travel upward along the soil–wall system. Figure 17a also shows that the total earth pressure increased with increasing backfill OCR. Figure 17b shows that within the top half of the wall, all cases retained pressures larger than the static condition at the end of the excitation. Within the bottom third of the wall, backfill soils with OCR = 1 and 4 retained earth pressures larger than their corresponding static values. Backfill soils with OCR = 2 and 3 retained pressures lower than their corresponding static values within the bottom third of the wall.
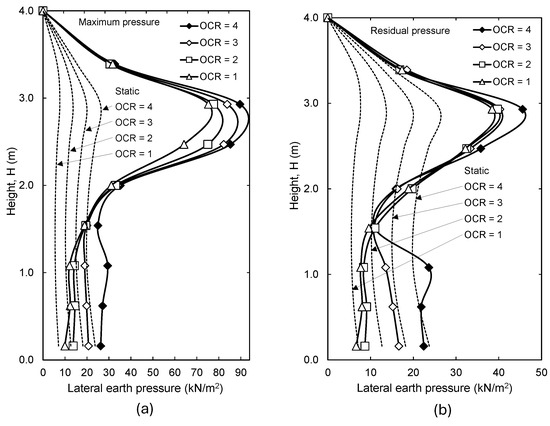
Figure 17.
Variation in critical lateral earth pressure with backfill OCR. (a) Maximum pressure, (b) residual pressure.
Figure 18 shows the maximum and residual forces acting on the wall due to base excitation for different backfill OCR values. The lateral earth force on the wall in static conditions is also shown. It is clear from the figure that the total maximum and residual forces increased with increasing backfill OCR. However, this increase in total pressure corresponds to the increase in static earth pressure due to compaction [6]. The dynamic force increment is more representative of the effect of OCR on the dynamic response of the wall. It can be seen in Figure 18 that the dynamic maximum and residual force increments decreased with increasing OCR values. This suggests that a higher compaction effort causes the non-yielding wall system to develop larger lateral static forces but lower dynamic lateral forces during and after seismic events. Finally, the dynamic amplitude was found to increase with an increasing backfill OCR. An increase in dynamic amplitude of 13% was observed from the case of OCR = 1 to the case of OCR = 4.
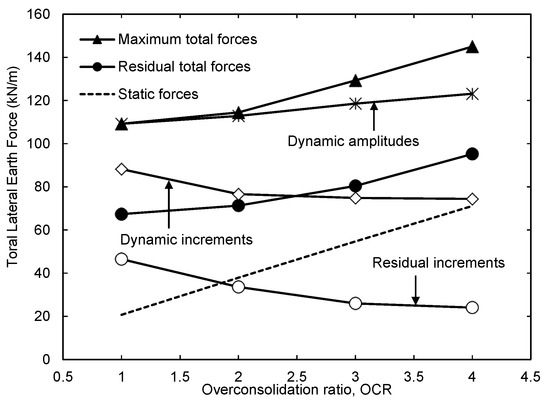
Figure 18.
Variation in maximum, minimum, and residual lateral earth forces with backfill OCR.
The location of the total maximum, minimum, and residual forces on the wall are shown in Figure 19. It can be observed that the elevation of the maximum and residual forces increased from the static value of approximately 0.5H to the range of 0.54 H–0.7 H. As the backfill OCR increased, the location of the total maximum and residual forces became closer to the middle of the wall. Since the location of the static resultant force was practically the same at all backfill OCR values, this change in resultant location is attributed to the dynamic effects only. The location of the minimum total forces was found to be at the base of the wall for all backfill OCR values except OCR = 4, in which the elevation of the resultant force rose slightly above the base.
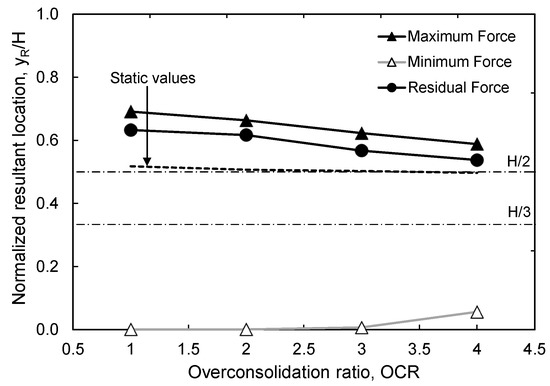
Figure 19.
Variation in maximum, minimum, and residual resultant elevation with backfill OCR.
4.3. Effect of Wall Panel Modulus of Elasticity
The influence of the elastic modulus of the non-yielding wall is investigated by applying the base excitation to models with varying wall stiffnesses. The considered wall modulus values are Ew = 2.1, 21, 34, and 47 GPa, which correspond to wood, low-strength concrete, medium-strength concrete, and high-strength concrete, respectively. The concrete non-yielding walls in this study may represent some types of basement walls and bridge abutments. The wooden walls in this study may represent braced excavation panels that are used with medium- to shallow-depth excavations. Figure 20 depicts the variation in incremental dynamic deflections at mid-height with different values of wall panel elastic modulus. As expected, the maximum incremental deflection is highest in the case of a wood wall, in which the deflection was more than four times that of the average-strength concrete. In the case of concrete wall panels, increasing the elastic modulus within the typical range of concrete decreased the deflection increments. Increasing the wall rigidity from that of the low-strength concrete wall by 62% and 114% resulted in a maximum incremental deflection decrease of 29% and 44%, respectively. The residual incremental deflections were found to be significantly lower than the maximum incremental deflections. In the cases of medium-strength and high-strength concrete panels, the residual incremental deflections were almost zero.
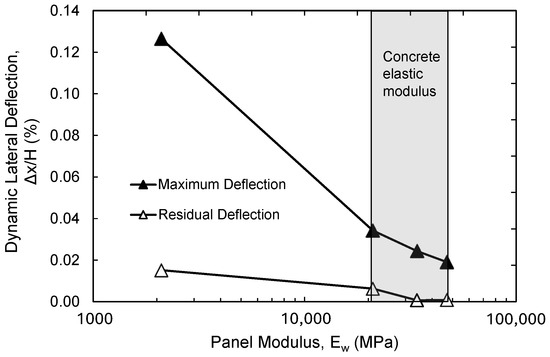
Figure 20.
Variation in maximum and residual lateral wall deflection (mid-height) with wall elastic modulus.
Maximum and residual total earth pressures due to base excitation are shown in Figure 21 for varying wall elastic modulus values. Figure 21a indicates that within the top 1/3 H, the maximum earth pressures increased significantly above the static values in all panel types. Moreover, in this region, the magnitude and distribution of the maximum pressure were found to be similar regardless of the panel material. Within the bottom 2/3 H, the maximum pressure on the wood panel was lower than that on the concrete panels. The maximum pressure behind all concrete panels was comparable within the bottom 2/3 H. Nevertheless, panels of higher-strength concrete experienced slightly larger pressures than panels of lower-strength concrete. Figure 21b shows that the walls with high rigidities (i.e., concrete) did not develop significant residual pressures at the end of the excitation. The case of the wooden panel is different, where the pressure is larger than the static case in some locations and lower in others. This suggests that consideration of residual stresses is more critical in a non-yielding wall with lower rigidity.
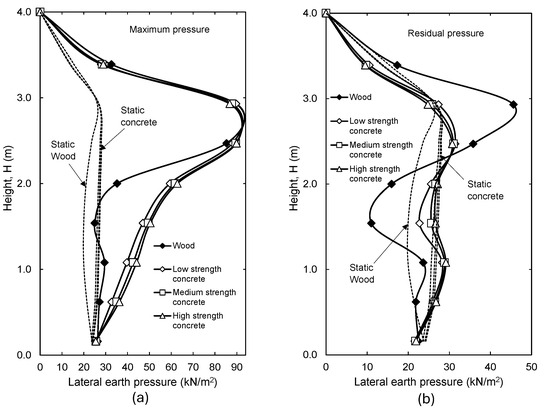
Figure 21.
Variation in critical lateral earth pressure with wall elastic modulus. (a) Maximum pressure, (b) residual pressure.
Maximum and residual total earth forces acting on the wall due to base shaking at varying wall elastic moduli are shown in Figure 22. Forces developed in static condition are shown for comparison. The figure shows that a significant increase in maximum total force occurred when the wall material was changed from wood to concrete. The larger forces in the concrete walls may be attributed to their lateral dynamic deflections (Δx), which are lower than the case of a wood panel (Figure 20). Within the concrete cases, increasing the wall elastic modulus had a limited impact on the maximum total forces. A slight increase in maximum force was observed when higher-strength concrete was used. The dynamic force increment was almost unaffected when different concrete strengths were used. Residual total forces increased when the wood panel was replaced by concrete panels. However, medium-strength and high-strength concrete panels experienced lower residual total forces than the low-strength concrete panels. The residual dynamic increment decreased as the panel elastic modulus decreased. It is important to note that, in all cases of wall modulus of elasticity, the residual earth force exceeded that of the static condition. Finally, the dynamic amplitude increased significantly from the case of a wooden panel to a concrete panel and was practically unaffected when the concrete stiffness was changed.
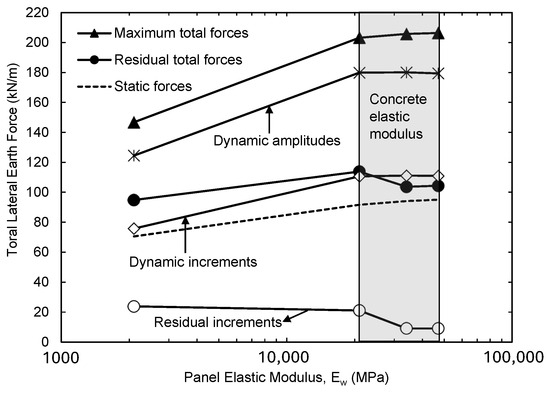
Figure 22.
Variation in maximum dynamic, static, and residual lateral earth forces with wall elastic modulus.
The location of the maximum, minimum, and residual earth force at varying panel elastic modulus is shown in Figure 23. It can be observed that the location of the maximum earth force ranged from approximately 0.55 H to 0.6 H from the base of the wall. The lower locations correspond to the stiffer walls. Similarly, the elevation of the residual earth force decreased with increasing wall elastic modulus. The location of the residual earth force was lower than that of the maximum force at all the walls’ elastic modulus values (it ranged from approximately 0.47 H to 0.53 H). The elevations of both the maximum and residual earth forces were found to be larger than the static case for all panel elastic moduli. The elevation of the minimum earth force was significantly lower than that of the static conditions. Moreover, it increased when the wall stiffness increased.
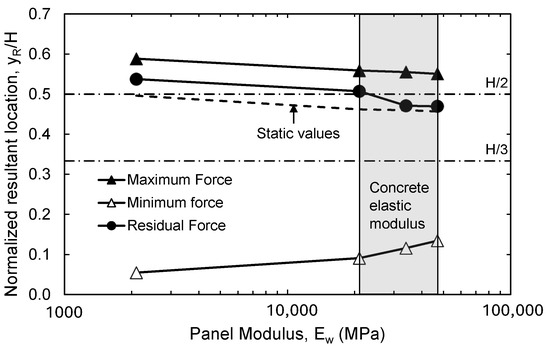
Figure 23.
Variation in maximum, minimum, and residual resultant elevation with wall elastic modulus.
Results from the study on residual strength can be useful for implementation in performance-based design procedures under extreme loading conditions, such as severe earthquakes. Performance-based design approaches consider the ultimate functional goal and establish objectives and performance criteria that would result in achieving that ultimate objective. For the study at hand, it commonly assesses the seismic performance of a retaining wall by comparing the earthquake-induced residual displacements with allowable displacements. Such an approach is more suitable than conventional design procedures because some parameters (e.g., ductility) cannot be properly quantified in a pseudo-static limit-equilibrium analysis [42]. The performance-based design allows for the attainment of desired performance levels that satisfy the stakeholders’ needs with greater assurance and reliability because the emphasis is on the damage state, without imposed limits and requirements to conform to pre-specified solutions.
The two important soil parameters used in this study are the sand friction angle, ϕ, and the sand over-consolidation ratio, OCR. The normal range of the sand backfill friction angle varies between 28° and 50°, with the lower values corresponding to normally consolidated sand and the higher values to over-consolidated sand [37]. The over-consolidation ratio of sand depends on the degree of compaction and sand’s relative density. In the current study, the largest OCR for sand is not measured, rather it was calculated using Mayne and Kulhawy theory [34]. Details of how Mayne and Kulhawy’s theory is used to calculate OCR from experimental results can be found in El-Emam [6].
Except for the first very low value of 2.1 GPa, the ranges of the moduli of elasticity of the wall (Ew = 21–47 GPa) represent values corresponding to a wide range of concrete strength f’c, from as low as 19MPa to as high as 96 MPa.
5. Summary and Conclusions
In this paper, a validated numerical model was utilized to study the dynamic transient and residual behavior of a non-yielding wall supporting over-consolidated sand. The model was subjected to 14 s of real base excitation, and the response of the system was recorded. A parametric study was conducted to investigate the effects of backfill friction angle, soil over-consolidation ratio (degree of compaction), and panel elastic modulus on the seismic behavior of the soil–wall system. The recorded outputs include the deflection of the wall at mid-height, the earth pressure along the wall height, the total earth force, and the location of the resultant earth force. Both the maximum transient and the residual values were obtained and discussed. The key findings of this study can be summarized as follows:
- In a non-yielding wall system, seismic events can produce transient forces and deflections significantly larger than the static values.
- In a non-yielding wall system, residual deflections and forces at the end of seismic events can be considerably larger than the static values. This highlights the importance of considering the residual state of non-yielding walls during design and future analysis.
- The maximum deflection increment, dynamic force increment, and resultant force elevation increased with increasing backfill friction angle. Larger maximum pressures were developed within the top half of the wall when larger backfill friction angles were used. Within the bottom half of the wall, maximum pressures were lower for models with higher friction angles.
- Residual deflection increments did not show a consistent trend with the increasing backfill friction angle. Residual force increments generally increased with the increasing friction angle. For all friction angles, residual deflections and forces were larger than the static values. The location of the resultant residual force was lower than the static value for all backfill friction angles. Residual earth pressures were larger than the static values for all friction angles and along most of the wall height.
- The maximum deflection increment, dynamic force increment, and resultant force elevation decreased with increasing over-consolidation ratio (degree of compaction). Residual values followed the same trend. Moreover, residual values were larger than the static values in all cases.
- In general, maximum and residual total earth pressures increased with increasing backfill OCR. In most cases, these pressures exceeded the static values.
- The maximum deflection increment decreased with increasing wall elastic modulus. The dynamic force increment increased when the panel material was changed from wood to concrete. Within the different concrete strength cases, the dynamic force increment was unaffected. The elevation of the maximum resultant force decreased with increasing panel elastic modulus. Within the top half of the wall, all panel material types showed similarly high maximum pressures. Within the bottom half of the wall, the wood panel experienced pressures lower than those of the concrete panels.
- Residual deflection increments decreased with increasing wall elastic modulus. Medium- and high-strength concrete panels showed almost zero residual deflection increments. The residual force increment and the elevation of the resultant force decreased with increasing panel elastic modulus. The residual pressure in the concrete panel cases was close to that of the static conditions. The residual pressure in the wood panel case was larger than the static conditions in some locations of the wall and lower in others.
The authors caution that the above conclusions are limited to the range of parameters considered in the study. Hence, overgeneralization of the recommendations to untested conditions should be avoided.
Proposed future research on the subject may address the effect of wall material type on the extent of cracking (prismatic reinforced concrete walls, non-prismatic reinforced concrete walls, masonry walls, and steel), as well as different seismic base excitations and blast loading of various intensities and durations.
Author Contributions
Conceptualization, A.B. and M.E.-E.; Methodology, M.E.-E.; Software, A.B.; Validation, M.E.-E. and A.B.; Formal analysis, S.W.T. and Y.E.B.; Investigation, S.W.T.; Resources, M.E.-E.; Data curation, S.W.T.; Writing—Original draft preparation, Y.E.B.; Writing—Review and editing, S.W.T.; Visualization, Y.E.B. and S.W.T.; Supervision, M.E.-E.; Project administration, M.E.-E.; Funding acquisition, M.E.-E. and S.W.T. All authors have read and agreed to the published version of the manuscript.
Funding
The work in this paper was supported, in part, by the Open Access Program from the American University of Sharjah and the College of Engineering. The opinions expressed in the paper are those of the authors and do not represent the views of the sponsor.
Institutional Review Board Statement
Not applicable.
Informed Consent Statement
Not applicable.
Data Availability Statement
The original contributions presented in this study are included in the article. Further inquiries can be directed to the corresponding author.
Acknowledgments
The authors would like to express their thanks and deepest gratitude to the American University of Sharjah and College of Engineering Open Access Program, as well as the Civil Engineering Department for providing the financial support required to complete this project.
Conflicts of Interest
Author Amin Bigdeli was employed by the company WSP Canada. Author Youcef El Berizi was employed by the company ADEC Engineering Consultancy, UAE. The remaining authors declare that the research was conducted in the absence of any commercial or financial relationships that could be construed as a potential conflict of interest.
References
- Sherif, M.A.; Fang, Y.-S.; Sherif, R.I. Ka and Ko Behind Rotating and Non-Yielding Walls. J. Geotech. Eng. 1984, 110, 41–56. [Google Scholar] [CrossRef]
- Duncan, J.M.; Seed, R.B. Compaction-Induced Earth Pressures Under Ko-Conditions. J. Geotech. Eng. 1986, 112, 1406–1408. [Google Scholar] [CrossRef]
- Peck, R.B.; Mesri, G. Discussion on Compaction-Induced Earth Pressures Under Ko-Conditions. J. Geotech. Eng. 1987, 113, 1406–1408. [Google Scholar] [CrossRef]
- Rehnman, S.E.; Broms, B.B. Lateral pressure on basement wall: Results from full-scale tests. In Proceedings of the 5th European Conference on Soil Mechanics and Foundation Engineering, Madrid, Spain, 10–13 April 1972; pp. 189–197. [Google Scholar]
- Seed, R.B.; Duncan, J.M. FE analysis: Compaction-induced stresses and deformations. J. Geotech. Eng. 1986, 112, 22–43. [Google Scholar] [CrossRef]
- El-Emam, M. Experimental and Numerical Study of At-Rest Lateral Earth Pressure of Overconsolidated Sand. Adv. Civ. Eng. 2011, 2011, 524568. [Google Scholar] [CrossRef]
- Bigdeli, A.M.; El-Emam, M.M. Effect of Material Properties on Seismic Response of Non-Yielding Retaining Walls. In Proceedings of the 8th European Conference on Numerical Methods in Geotechnical Engineering, Delft, The Netherlands, 18–20 June 2014; pp. 1093–1098. [Google Scholar]
- Okabe, S. General theory of earth pressure. J. Jpn. Soc. Civ. Eng. 1926, 12, 123–134. [Google Scholar]
- Mononobe, N.; Matsuo, M. On determination of earth pressures during earthquakes. In Proceedings of the World Engineering Conference, Tokyo, Japan, October 1929; pp. 179–187. [Google Scholar]
- Sitar, N.; Mikola, R.G.; Candia, G. Seismically Induced Lateral Earth Pressures on Retaining Structures and Basement Walls. In Geotechnical Engineering State of the Art and Practice; American Society of Civil Engineers: Reston, VA, USA, 2012; pp. 335–358. [Google Scholar]
- Seed, H.B.; Whitman, R.V. Design of Earth Retaining Structures for Dynamic Loads. In ASCE Specialty Conference, Lateral Stresses in the Ground and Design of Earth Retaining Structures; American Society of Civil Engineers: Reston, VA, USA, 1970; pp. 103–147. [Google Scholar]
- Wood, J.H. Earthquake-Induced Pressures on a Rigid Wall Structure. Bull. N. Z. Soc. Earthq. Eng. 1975, 8, 175–186. [Google Scholar] [CrossRef]
- Veletsos, A.S.; Younan, A.H. Dynamic Modeling and Response of Soil-Wall Systems. J. Geotech. Eng. 1994, 20, 2155–2179. [Google Scholar] [CrossRef]
- Veletsos, A.S.; Younan, A.H. Dynamic Response of Cantilever Retaining Walls. J. Geotech. Geoenviron. Eng. 1997, 123, 161–172. [Google Scholar] [CrossRef]
- Ostadan, F. Seismic soil pressure for building walls: An updated approach. Soil Dyn. Earthq. Eng. 2005, 25, 785–793. [Google Scholar] [CrossRef]
- Whitman, R.V. Seismic Design of Earth Retaining Structures. In Proceedings of the Second International Conference on Recent Advances in Geotechnical Earthquake Engineering and Soil Dynamics, St. Louis, MO, USA, 11–15 March 1991; pp. 1767–1778. [Google Scholar]
- Psarropoulos, P.N.; Klonaris, G.; Gazetas, G. Seismic earth pressures on rigid and flexible retaining walls. Soil Dyn. Earthq. Eng. 2005, 25, 795–809. [Google Scholar] [CrossRef]
- Younan, A.H.; Veletsos, A.S. Dynamic Response of Flexible Retaining Walls. Earthq. Eng. Struct. Dyn. 2000, 29, 1815–1844. [Google Scholar] [CrossRef]
- Sitar, N.; Wagner, N. On Seismic Response of Stiff and Flexible Retaining Structures. Soil Dyn. Earthq. Eng. 2016, 91, 284–293. [Google Scholar]
- Mikola, R.G.; Candia, G.; Sitar, N. Seismic Earth Pressures on Retaining Structures and Basement Walls in Cohesionless Soils. J. Geotech. Geoenviron. Eng. 2016, 142, 04016047. [Google Scholar] [CrossRef]
- Richards, R.; Huang, C.; Fishman, K.L. Seismic Earth Pressure on Retaining Structures. J. Geotech. Geoenviron. Eng. 1999, 125, 771–778. [Google Scholar] [CrossRef]
- Kloukinas, P.; Langousis, M.; Mylonakis, G. Simple Wave Solution for Seismic Earth Pressures on Nonyielding Walls. J. Geotech. Geoenviron. Eng. 2012, 138, 1514–1519. [Google Scholar] [CrossRef]
- Yi, F. Seismic Design of Restrained Rigid Walls. In Proceedings of the 18th International Conference on Soil Mechanics and Geotechnical Engineering, Paris, France, 2–6 September 2013; pp. 1–4. [Google Scholar]
- Kitsis, V.G.; Vlachakis, V.S.; Athanasopoulos, G.A.; Athanasopoulos-Zekkos, A. Seismic Thrust vs Wall Inertia in Non-Yielding Retaining Walls Under Earthquake Loading: Synchronous or Asynchronous Action? In IFCEE 2015; American Society of Civil Engineers: Reston, VA, USA, 2015; pp. 1513–1521. [Google Scholar]
- Chen, Y.F. Rational and practical method for determination of seismic-induced earth pressure on non-yielding walls. J. Struct. Integr. Maint. 2017, 2, 48–59. [Google Scholar] [CrossRef]
- Mansour, M.F.; Abdel-Motaal, M.A.; Elsaba, A.A. Seismic response of basement walls as partially-yielding retaining walls. Ain Shams Eng. J. 2021, 12, 181–193. [Google Scholar] [CrossRef]
- Hushmand, A.; Dashti, S.; Davis, C.; Hushmand, B.; Zhang, M.; Ghayoomi, M.; McCartney, J.S.; Lee, Y.; Hu, J. Seismic Performance of Underground Reservoir Structures: Insight from Centrifuge Modeling on the Influence of Structure Stiffness. J. Geotech. Geoenviron. Eng. 2016, 142, 04016020. [Google Scholar] [CrossRef]
- Building Seismic Safety Council. NEHRP Recommended Seismic Provisions for New Buildings and Other Structures (FEMA P-2082-2); Part 3 Resource Papers; Building Seismic Safety Council: Washington, DC, USA, 2020; Volume II. [Google Scholar]
- Jaiswal, S.; Chauchan, V.B. Assessment of seismic bearing capacity of a strip footing resting on reinforced earth bed using pseudo-static analysis. Civ. Environ. Eng. Rep. 2021, 31, 117–137. [Google Scholar] [CrossRef]
- Halder, K.; Chakraborty, D. Estimation of seismic active earth pressure on reinforced retaining wall using lower bound limit analysis and modified pseudo-dynamic method. Geotext. Geomembr. 2023, 51, 100–116. [Google Scholar] [CrossRef]
- Zhang, W.; He, X.; Xu, Q.; Wang, L.; Zhu, X.; Wang, P.; Sun, W. Investigation on internal evolution process of slope under seismic loading: Insights from a transparent soil test and shaking table test. Transp. Geotech. 2024, 49, 101399. [Google Scholar] [CrossRef]
- Chen, F.-Q.; Chen, C.; Kang, W.-Z.; Xu, L.; Li, X.-B. Slip-line solution to seismic active earth pressure of narrow c-ϕ soils on gravity walls rotating about the bottom. Soil Dyn. Earthq. Eng. 2024, 181, 108625. [Google Scholar] [CrossRef]
- Panah, A.K.; Ramezani, M.S. Experimentally comparison of shaking table and pseudo-static parameters of polymeric-strip reinforced-soil walls. Jpn. Geotech. Soc. Spec. Publ. 2024, 10, 1600–1605. [Google Scholar]
- Khan, S.A.; Karray, M.; Paultre, P. Seismic Behavior of Retaining Walls: A Critical Review of Experimental and Numerical Findings. Geotechnics 2025, 5, 25. [Google Scholar] [CrossRef]
- FLAC, Fast Lagrangian Analysis of Continua; User’s Manual, Version 6.0; Itasca Consulting Group: Minneapolis, MN, USA, 2013; Volume I.
- Iai, S. Similitude for Shaking Table Tests on Soil-Structure-Fluid Model in 1g Gravitational Field. Soils Found. 1989, 29, 105–111. [Google Scholar] [CrossRef]
- El-Emam, M.M.; Bathurst, R.J. Experimental Design, Instrumentation and Interpretation of Reinforced Soil Wall Response Using a Shaking Table. Int. J. Phys. Model. Geotech. 2004, 4, 13–32. [Google Scholar]
- El-Emam, M.M.; Bathurst, R.J. Facing contribution to seismic response of reduced-scale reinforced soil walls. Geosynth. Int. 2005, 12, 215–238. [Google Scholar] [CrossRef]
- El-Emam, M.M.; Attom, M.F.; Khan, Z.H. Numerical prediction of plane strain properties of sandy soil from direct shear test. Int. J. Geotech. Eng. 2012, 6, 79–90. [Google Scholar] [CrossRef]
- Bolton, M.D. The strength and dilatancy of sands. Geotechnique 1986, 36, 65–78. [Google Scholar] [CrossRef]
- Mayne, P.W.; Kulhawy, F.H. Ko-OCR relationships in soil. J. Geotech. Eng. Div. ASCE 1982, 108, 851–872. [Google Scholar] [CrossRef]
- Nakajima, S.; Koseki, J.; Watanabe, K.; Tateyama, M. A Simplified Procedure to Evaluate Earthquake-Induced Residual Displacements of Conventional Type Retaining Walls. Soils Found. 2009, 49, 287–303. [Google Scholar] [CrossRef]
Disclaimer/Publisher’s Note: The statements, opinions and data contained in all publications are solely those of the individual author(s) and contributor(s) and not of MDPI and/or the editor(s). MDPI and/or the editor(s) disclaim responsibility for any injury to people or property resulting from any ideas, methods, instructions or products referred to in the content. |
© 2025 by the authors. Licensee MDPI, Basel, Switzerland. This article is an open access article distributed under the terms and conditions of the Creative Commons Attribution (CC BY) license (https://creativecommons.org/licenses/by/4.0/).