Article

Effects of Surface Water Treatment for Drinking Water Production, Distribution and Heating on Biological Stability

IWW Water Research Institute gGmbH, Moritzstrasse 26, 45476 Mülheim an der Ruhr, Germany
*
Authors to whom correspondence should be addressed.
Appl. Sci. 2025, 15(11), 5843; https://doi.org/10.3390/app15115843
Submission received: 28 March 2025 / Revised: 11 May 2025 / Accepted: 14 May 2025 / Published: 22 May 2025
(This article belongs to the Special Issue New Approaches to Water Treatment: Challenges and Trends)

Abstract

:
Drinking water treatment, from a microbiological perspective, efficiently removes hygienically relevant microorganisms, making the water safe for human consumption. The water quality is strictly regulated. An aspect that is often overlooked, however, is biological stability. In this study, we assessed the effect of drinking water treatment of surface waters on biological stability. Biological stability was assessed as the difference between the actual cell concentrations naturally contained in the water at the time point of sampling and the maximal cell concentrations in the same sample obtained after a batch growth assay. Whereas raw waters were biologically stable, treatment resulted in a loss of biological stability and also partly in an increase in the maximal cell numbers. Treatment steps reducing biological stability resulted in the conversion of biologically fixed nutrients to dissolved nutrients. The stabilizing effect of biologically active filters was annihilated by disinfection at the end of treatment. The lack of biological stability was especially evident when distributing chlorinated water, where actual cell numbers and, in part, regrowth potentials tended to increase throughout transport with strong seasonal variations. Comparing cold drinking water at house entrances in different buildings across Germany, regrowth tests resulted in an average regrowth factor of 54 with high spatial and temporal variability. Biological instability was further increased in drinking water installations during water heating, which contributed to an additional shift towards dissolved nutrients, giving room to microbiological changes once the water cools down and stagnates. It remains to be determined whether the biological stabilization of drinking water can increase its microbiological resilience towards the growth of hygienically relevant bacteria.

1. Introduction

Drinking water entering the distribution system should ideally be biologically stable [1], meaning that the water quality should not change from the water works to the tap. The idea is that biologically stable water should not support the multiplication of microorganisms [2,3]. While this primarily applies to opportunistic pathogens [4] and coliforms, increased heterotrophic plate counts or a general increase in waterborne microbes should also be avoided to avoid problems of biofilm formation, the loss of esthetic quality or corrosion [5,6]. Strategies to achieve this goal include distributing drinking water with a disinfectant residual (like chlorine, chlorine dioxide or monochloramine) or limiting the concentration of assimilable nutrients. Both strategies benefit from a well-maintained pipe infrastructure [7], which is particularly important in the absence of protection by a disinfection residual. Within drinking water distribution systems (DWDSs), water is typically assumed to be stable if only minor changes in colony numbers are determined by cultural methods based on standard nutrient agars. Concentrations tend to be substantially below 100 colony-forming units (cfu)/mL on nutrient-rich agars, although heterotrophic plate counts using R2A medium with a lower nutrient concentration can exceed these numbers by a factor of 100–200 [8]. For fecal indicators like E. coli, coliforms or enterococci, strict monitoring guarantees their absence, and in rare cases of coliform occurrence, countermeasures are taken quickly.
The current diagnostic system has served well for many decades and assures microbiology safety within DWDSs. Nevertheless, when applying cultivation-independent methods, research has shown that water microbiology can undergo profound changes in DWDSs [9,10,11]. When examining changes in total cell numbers in a chloraminated DWDS fed from a drinking water treatment plant (DWTP) treating surface water, increases in cell numbers were reported with increasing distance from the DWTP, seasonal temperature fluctuations with higher counts in summer (1.51–5.24-fold increase), longer residence times and increased contact of bulk water with pipe biofilm [12]. A combination of flow cytometry and sequencing also detected substantial changes in flow cytometric fingerprints and shifts in the composition of bacterial communities in drinking water distributed from a surface water works that added chlorine dioxide at the end of treatment [13]. These changes were not detected using colony counts. Changes have also been observed in DWDSs without disinfectant residual, but with UV disinfection prior to distribution. The drinking water microbiome re-established quickly after UV disinfection [14]. It was found that water at the point of entry of a building in close proximity to the water works shared a much more similar sequencing profile with the water prior to UV than after UV disinfection.
Changes in microbiological water quality can be even more pronounced in drinking water installations (DWIs) than in the DWDSs. While water safety is strictly monitored in DWDSs, this is not the case to the same extent in DWIs. Deterioration of microbiological water quality has been frequently reported, especially in the “last meters prior to consumption” [15]. Testing for opportunistic pathogens in a research context regularly reveals surprises. In a large-scale German study from 2017, 12.8% of drinking water samples (n = 22,786) from public buildings were found positive for Legionella spp. above the allowed limit of 100 cfu/100 mL [16]. The same study reported that 2.9% of samples (n = 3468) were positive for Pseudomonas spp. (≥1 cfu/100 mL). Several factors contribute to the deteriorating microbiological water quality in premise plumbing systems, including the use of other pipe materials than in the DWDS, such as elastomeric materials like EPDM and other plastic materials that promote bacterial growth [17]. Additionally, water stagnates in plumbing systems most of the time, on average 23 h per day [18]. Stagnation can cause substantial increases in cell numbers [19,20]. And eventually, cold water in a DWI is typically not as cold as in a DWDS, leading to accelerated regrowth [20]. Although excessive warming of cold water can often be mitigated by correcting poor practices in plumbing systems, the problem is, in part, also associated with warmer raw water in the summer in surface water treatment plants and further warming during transport in the DWDS. The latter problems can be assumed to increase in the future with climate change.
Finally, the heating of water inside buildings for hot water production affects the microbiology and probably also the nutrient pool. Bacterial communities in hot water have been found to differ strongly from cold water communities [6,21]. Water from hot water boilers was reported to have higher total cell numbers than inflowing cold water [22]. The authors discussed the existence of specialized thermophilic bacteria utilizing AOC generated from the thermal disintegration of TOC.
Overall, existing scientific knowledge points to constant changes in the microbiome, with microbes adapting to new conditions on their way from raw water to the tap. Changes in the composition of the microbial community and also in its function can be sensitively measured using modern sequencing technologies (including metagenomics). Whether these changes affect biological stability depends, however, on its definition. Newer definitions imply biological stability to be reached when conditions prevent the replication of microorganisms of hygienic relevance or of microorganisms that lead to aesthetic (i.e., color, odor or taste) or technical (i.e., corrosion) problems (for a review, see [23]. Overall, a diverse set of biological stability parameters is available with important differences between groundwater and surface water [24]. In this study, we relate biological stability to the regrowth potential of the autochthonous heterotrophic bacteria contained in the corresponding water before and after regrowth in a seven-day batch growth test. This parameter is fundamentally linked to nutrient availability. The net increase in cell numbers in these seven days, as determined by flow cytometry, was expressed as the regrowth factor, whereas the cell numbers obtained after regrowth represent the maximal growth potential. The presented data were compiled from different individual projects performed over the last few years and comprise changes throughout the treatment of different surface waters (river, reservoir and canal water) together with changes during distribution. Finally, we looked into drinking water at the entry points of different buildings and the effect of water heating. Whereas most studies focus on individual aspects of drinking water treatment, the distribution or changes in DWIs, we try to give a holistic overview of changes in cell concentrations, regrowth potentials and the deduced relative ratios of dissolved and biologically fixed nutrients from source to tap. The focus is not on maintaining stability in regard to water hygiene, esthetic parameters or lack of corrosive properties, but on biological stability in the sense of low regrowth potentials.

2. Methods

2.1. Preparation of AOC-Free Glassware

An alkaline solution of potassium permanganate was made by separately dissolving (A) 30 g of permanganate (cat.nr. 105082; Merck KGaA, Darmstadt, Germany) and (B) 100 g sodium hydroxide pellets (cat.nr. 106498; Merck KGaA, Germany) in 500 mL deionized water each and equilibrated to room temperature. The two solutions were subsequently combined and stored in a 1 L bottle in the dark prior to use. Clean glass vials (50 mL, cat.nr. 7612150; Th. Geyer GmbH & Co. KG, Renningen, Germany) or 100 mL Schott bottles (Schott AG, Mainz, Germany) were first washed with deionized water and then filled with this alkaline solution and sealed with appropriate caps (cat. nr. 292401305, DWK Life Sciences, Wertheim, Germany). The entire surface area of the glassware was in contact with the solution. The permanganate solution was decanted (for recycling purposes), and the glassware and caps were rinsed three times with tap water and twice with deionized water. The dried glassware and caps were wrapped in aluminum foil. The glassware was muffled at 550 °C for at least 8 h or overnight; the caps were heated at 200 °C during that time. The caps were provided with a Teflon seal (special fabrication by Max Werth GmbH & Co. KG, Mülheim an der Ruhr, Germany) prior to use. The other glassware was treated accordingly before use.

2.2. Sampling Sites and Sample Collection

Water samples were collected in AOC-free vials (50 mL or 100 mL). The sampling sites were heat-disinfected with a flame following standard procedures. Depending on the sampling site, the first 200 mL to 1 l of water was discarded prior to sampling. The sample bottles for collecting water with chemical disinfectant contained thiosulfate (final concentration 18 mg/L) for quenching. The samples were subsequently stored at 4 °C (±2 °C) and transported cold to the laboratory. The samples were either analyzed directly after receipt or at the latest within 24 h after sampling in cases of longer transport time. The data obtained from this first analysis are referred to as day 0, representing the microbiological status at the time point of sampling.
The water works treating river water was sampled on 25 July 2018. Treatment included slow sand filtration (SSF), ground passage (GP) and ozonation followed by passage through multilayer filters and, subsequently, granular activated carbon (GAC) filters (Figure 1A). The filtrate was subject to UV disinfection prior to collecting the finished water in a clean water tank from which it entered the DWDS. No sampling site was available after slow sand filtration.
The water works treating reservoir water was sampled on 3 September 2024. Treatment consisted of flocculation followed by floc filtration in multilayer filters (MLF) containing anthracite-N and quartz sand for the removal of turbidity, TOC-reduction and manganese removal (Figure 2A). A second filtration over calcium carbonate served to increase the hardness. The filtrate of the second filter was subjected to disinfection with UV-light followed by chlorine dioxide prior to the collection of the finished water in a drinking water tank before distribution.
The water works treating canal water was sampled on 22 June 2022. Treatment included pH adjustment with H2SO4, coagulation using polyaluminium chloride with subsequent flocculation, and clarification followed by rapid sand filtration (RSF) in a dual-layer filter (Figure 3A). The filtrate entered an open buffer basin, which fed a slow sand filter (SSF). The SSF was covered by a roof. The filtrate was further treated by GAC filtration, followed by UV disinfection and pH adjustment with NaOH prior to the addition of sodium hypochlorite. The water entered the DWDS via a pumping station.
All water works were also sampled on other days and in different seasons. Although the absolute values could differ, the same trends in cell counts and regrowth potentials could be confirmed.
Water samples from multifamily buildings were taken between March 2021 and January 2024 at the entry point of the corresponding building (point of entry, POE), typically before or directly after the water meter. The buildings were located in different geographical cities across Germany: Kiel, Hamburg, Neuruppin, Berlin, Hameln, Kassel and Mülheim an der Ruhr. These cities receive drinking water from different water works utilizing different raw waters (groundwater, enriched groundwater and river water). The corresponding water works were not related to the ones in the examples shown in Figure 1, Figure 2 and Figure 3. Samples were typically taken in 100 mL AOC-free Schott bottles.
Hot water samples from a single-family home plumbing system in Mülheim an der Ruhr were taken from a tap receiving water from a 5 L under-sink water heater (STIEBEL ELTRON GmbH & Co. KG, Holzminden, Germany). The heater was turned on only for the duration of the experiment. The first sample consisted of cold water collected after discarding approx. 50 L of water. Subsequently, the heater was set to different target temperatures with increasing heat: 40, 55, 65 and 80 °C. The actual temperature reached could differ slightly from the set value. After the target temperature was reached (as indicated by a light on the display), the corresponding temperature was maintained for 30 min each before starting sampling from the tap connected to the water heater while recording the actual water temperature. The first flush of water was discarded until it reached the maximum temperature of the corresponding heating level, and we then took samples (approx. 100 mL). Three independent samples were taken consecutively for each temperature (biological repeats). After taking samples, the heat was increased to the next highest temperature setting, and samples were taken accordingly in a stepwise fashion. Samples were stored on ice and analyzed in the laboratory within 6 h after sampling.
Chlorine concentrations were measured using the DPD (N,N-diethyl-p-phenylenediamine) method. Colony counts were determined following ISO 6222 [25].

2.3. Flow Cytometry

Bacterial cell numbers were quantified using flow cytometry. Cells were stained using the fluorescent dyes SYBR Green I (SG-I; 10,000× stock; cat.nr. S-7567; Life Technologies Ltd., Paisley, UK) and propidium iodide (PI; 1 mg mL−1, cat.nr. P3566; Life Technologies Ltd.). SG-I was diluted to a working stock concentration of 100× using dimethylsulfoxide (DMSO; Sigma Aldrich, St. Louis, MO, USA) and stored at −20 °C until use. In a first step, aliquots (250 µL) of water samples were transferred into 96-well plates (cat. nr. 601808, HJ-Bioanalytik GmbH, Erkelenz, Germany). To determine total cell concentrations (TCC), 200 µL sample aliquots from this plate were transferred into the wells of a second 96-well plate with pre-aliquoted 2 µL of the 100× SG-I working stock solution, followed by thorough mixing by pipetting up and down several times with a multichannel pipette. To determine intact cell concentrations (ICC), 200 µL sample aliquots from this plate were transferred into the wells of a second 96-well plate with pre-aliquoted 2.4 µL of a mixture of 100× SG-I (2 µL) and PI (0.4 µL), followed by thorough mixing. Staining was performed at 37 °C for 13 min in an air incubator. Data were collected using two Novocyte® ACEA benchtop instruments (OLS OMNI Life Science, Bremen, Germany) equipped with a 488 nm laser and an autosampler to enable analysis on a 96-well plate. The trigger was set on the green fluorescence (recorded in the FL1-channel), and the detection threshold was set to 800 fluorescence units. The data were analyzed using instrument-specific software and a gating procedure similar to the one described by Gatza et al. [26]. Graphical data visualization was performed using Microsoft Excel. In cases where the total signals exceeded approx. 5000 signals/sec, the water samples were diluted with 0.1 µm filtered mineral water (Evian, Evian-les-Bains, France). The TCC and ICC values were the basis for calculating the relative proportions of intact and membrane-damaged cells. For selected data sets, the relative proportion of high-nucleic-acid (HNA) bacteria is shown. The distinction between HNA and low-nucleic-acid (LNA) bacteria was carried out in the FL1/FL3 fluorescence plot of samples stained with SG I and PI. The instrument was regularly calibrated using NovoCyte QC particles (cat. nr. 8000004; Agilent Technologies, Santa Clara, CA, USA) to ensure that the instrument was operating within acceptable limits as stated by the manufacturer. QA also included regular assessments of differences between the two instruments using drinking water and bacterial suspensions. The standard deviations for repeated measurements of the same sample (technical repeats) were typically ≤5%, in line with Hammes et al. [27].

2.4. Assessment of Regrowth Potential and Ratio of Fixed to Dissolved Nutrients

Day 0 cell numbers were typically quantified as technical replicates from samples in AOC-free 100 mL Schott bottles (with the exception of hot water samples, which were sampled in 50 mL glass vials). After the quantification of cell numbers on day 0 (TCCday 0 and ICCday 0), the water samples were aliquoted into three AOC-free glass vials (50 mL, cat.nr. 7612150; Th. Geyer GmbH & Co. KG) containing 20 mL sample each. These vials were stored at 22 °C (±1 °C) for seven days (or indicated times in cases where the water was sampled from the hot water boiler), followed by repeated quantification of cell numbers by flow cytometry. Only ICC data are shown after regrowth. The ICC numbers obtained after seven days of incubation (ICCday 7) represent the maximal intact cell concentrations that are supported by the nutrients contained in the original samples. The difference between ICCday 0 and ICCday 7 is referred to as the regrowth potential. Regrowth factors, on the other hand, are the ratio of ICCday 7/ICCday 0 and indicate how much the bacterial concentrations can increase on the basis of the given available assimilable nutrients.
We supplemented 20 mL aliquots of samples subjected to ozonation or to high temperatures with a 1/1000th volume (20 µL) of the corresponding untreated water (prior to the corresponding treatment step) to re-introduce bacteria capable of replication and to capture the correct regrowth potential. Samples without spiking were processed in parallel, and their regrowth was compared with that of spiked samples. Data with higher regrowth were selected. Samples from the chlorinated DWDS were not spiked as they still contained bacteria capable of replication
ICCday 0 and ICCday 7 were used to calculate the ratios of biologically fixed nutrients (=biomass) and dissolved nutrients. The ICCday 7 values were considered to represent the maximal concentrations of intact cells that the nutrient pool of the corresponding water supports. When the maximal cell concentrations were reached, it was assumed that all available dissolved nutrients had been biologically fixed in biomass and biological stability had been reached. The ICCday 7 values were assessed in relation to the ICCday 0 values that represent the intact cell concentrations that were actually present when taking samples. The ICCday 0 values thus represent the proportion of the nutrient pool that was biologically fixed in the form of biomass at the time point of sampling. The remaining proportion of the nutrient pool, as a net value, was thus dissolved and available (i.e., not biologically fixed) and represents the nutrient reserve available for regrowth. The proportions are relative and do not provide information about the absolute nutrient concentrations. Also, the portion of the nutrient pool that was respired and, thus, not available for biomass production was not considered. In cases of raw water samples that showed “negative growth”, meaning that the ICC values after 7 days of incubation were lower than on day 0 (e.g., through the die-off of phototrophic bacteria or changes in the microbiome), the calculation was performed as if all nutrients were biologically fixed on day 0.

3. Results

The data presented in this study show changes in cell numbers from source to tap both at the time point of sampling (day 0) and after seven days of incubation at 22 °C (day 7). A seven-day incubation time was chosen as, for most water samples, the most substantial changes occurred within this time period (for exemplary growth curves of drinking water, see Supplementary Figure S1 in addition to Gillespie et al. [28] and as this time period was considered relevant for drinking water. The data were the basis for calculating the underlying regrowth factors and the relative proportions of biologically fixed and dissolved nutrients. The first data set addressed changes along the treatment train of different surface water treatment plants.

3.1. Effect of Surface Water Treatment on Cell Numbers and Bacterial Regrowth Potentials

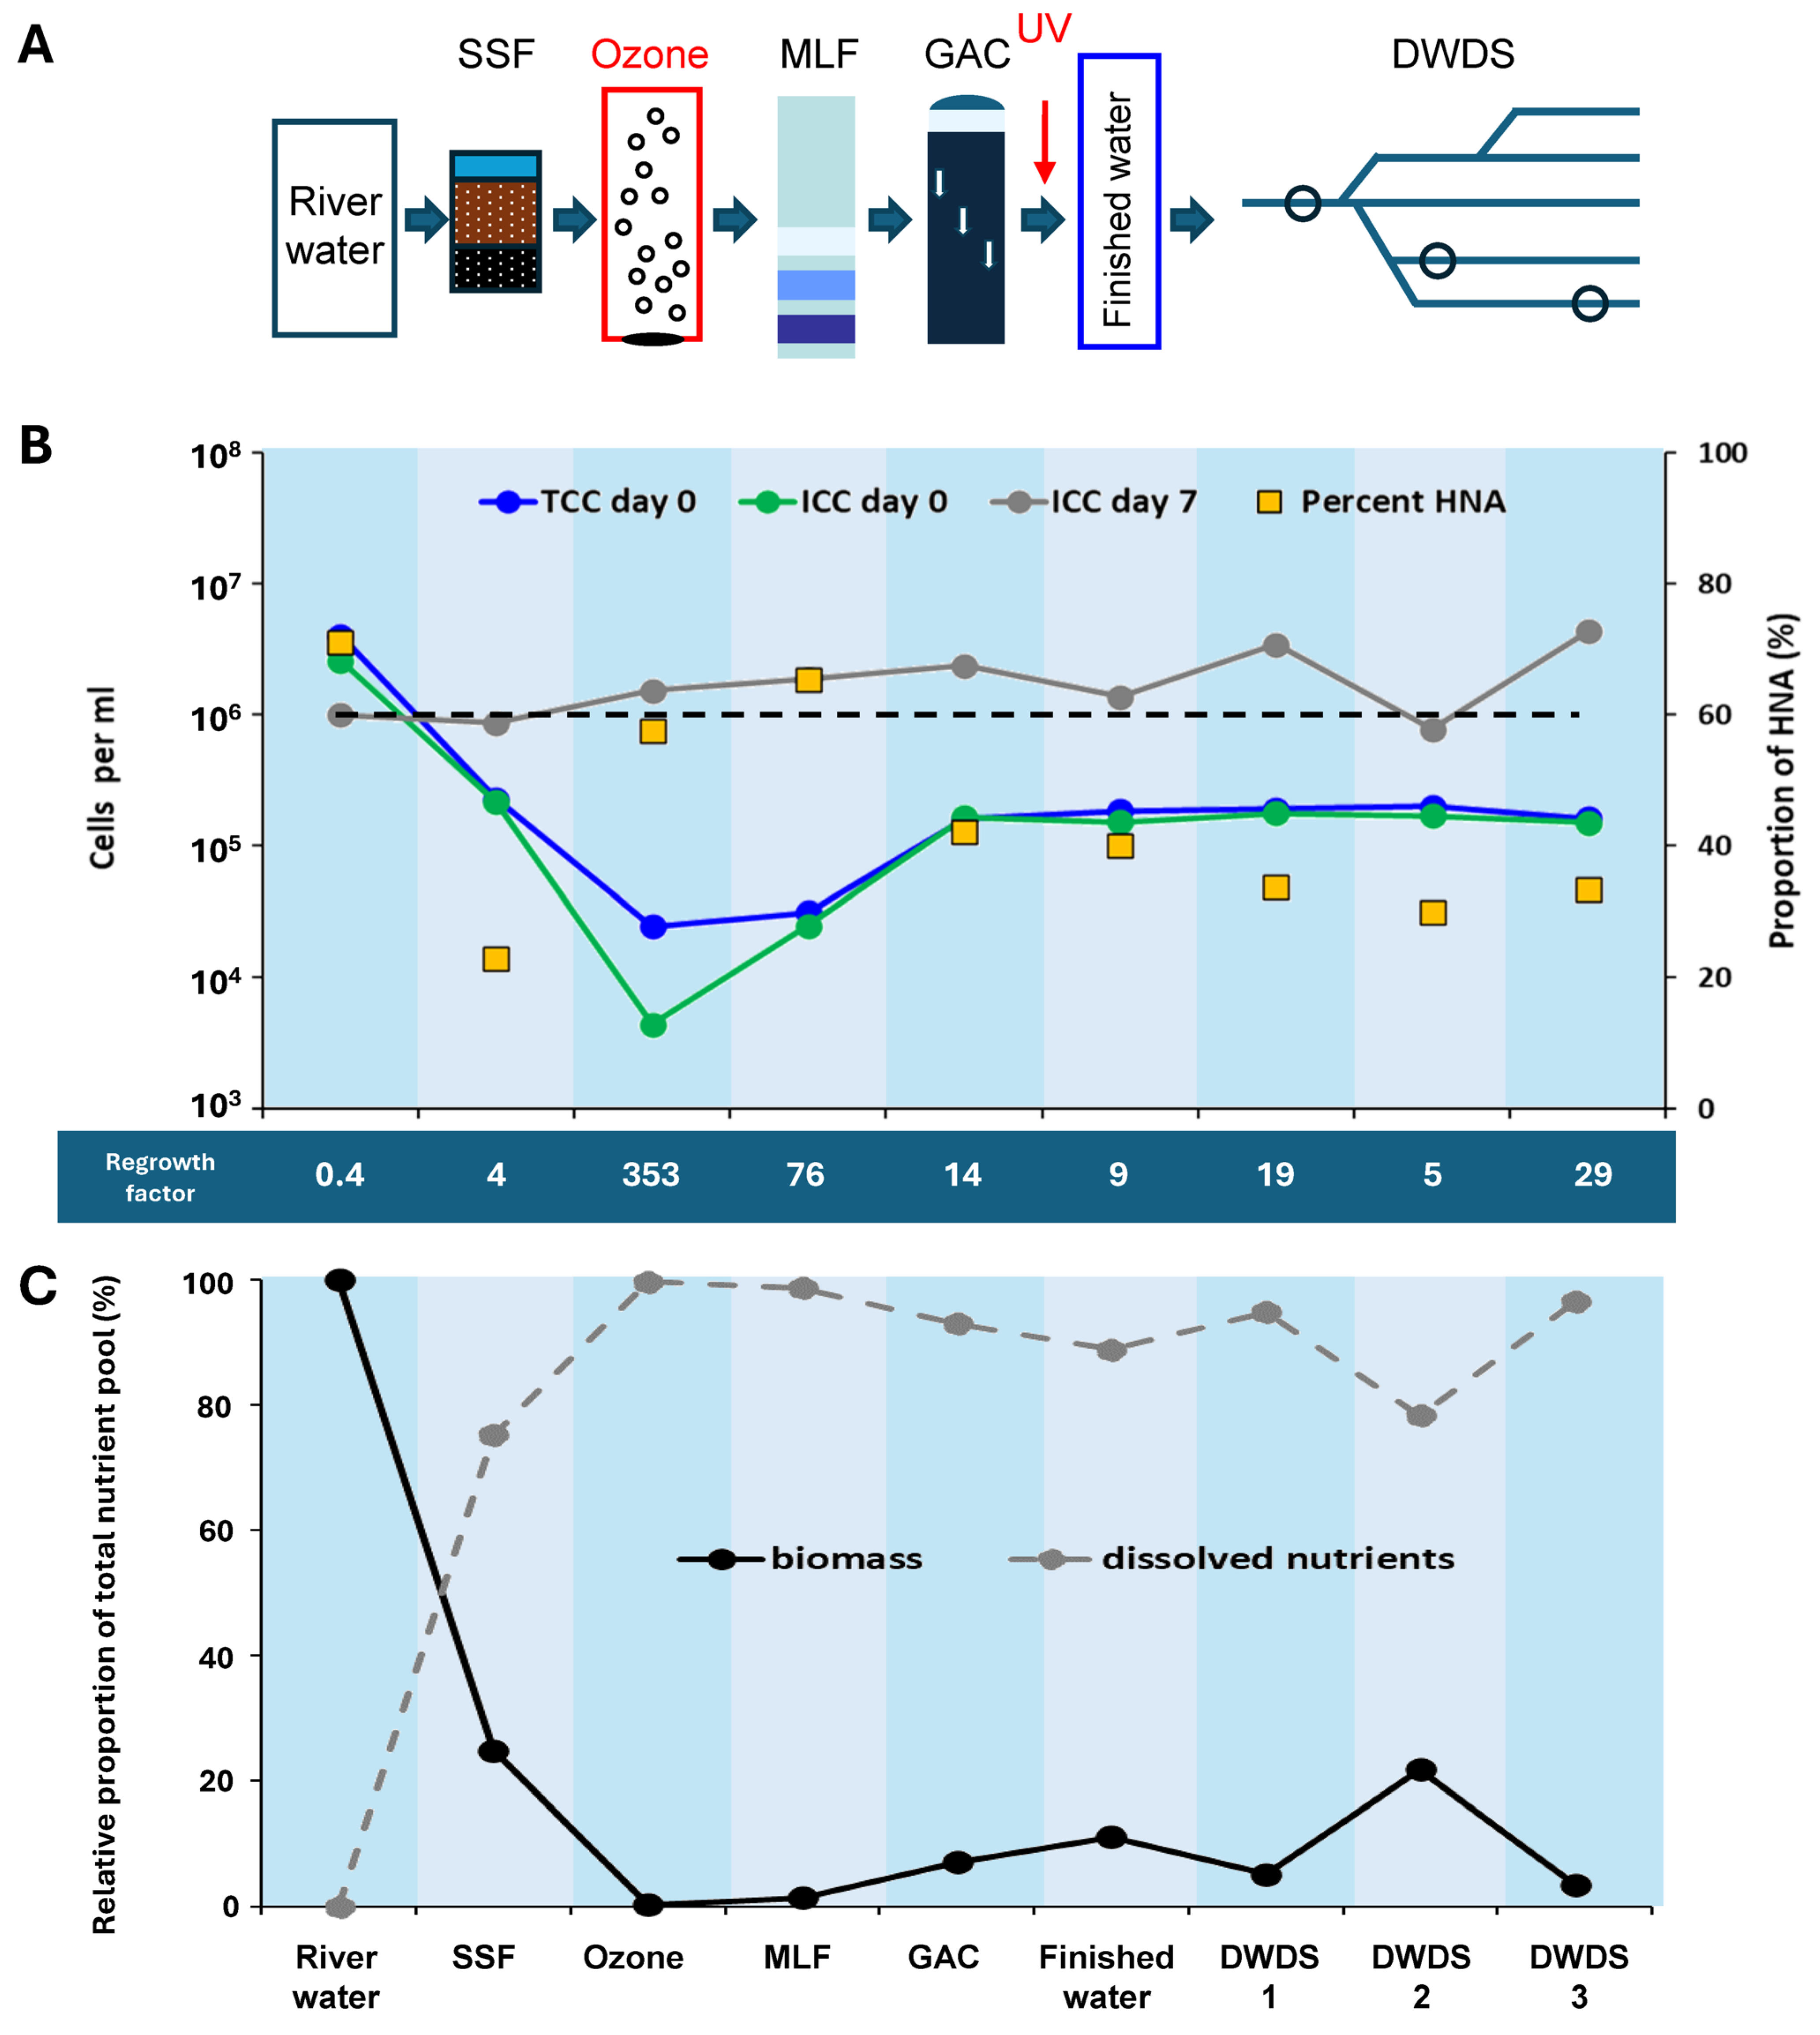
3.1.1. River Water Treatment

A DWTP treating river water serves as the first example. Treatment comprised slow sand filtration (SSF), ground passage (GP) and ozonation followed by water passage through multilayer filters (MLFs) with anthracite and quartz sand and GAC filters (Figure 1A). The filtered water was subsequently subjected to UV disinfection prior to storage in a drinking water tank from where it was fed into the distribution system. Three sampling points within the distribution system were included in this study.
The cell numbers in the river water on the day of sampling (day 0) were 4.0 × 10⁶ total cells per ml (TCC) and 2.6 × 10⁶ intact cells per ml (ICC) (Figure 1B). Similarly to other surface waters, the ICCday 7 value of the river water was lower than the ICCday 0 value due to the die-off of phototrophic bacteria and the establishment of a different microbial community during sample incubation. This corresponds to an ICCday 7/ICCday 0 regrowth factor of 0.4. The combination of slow sand filtration and ground passage led to a decrease of more than one log-scale in day 0 cell numbers, whereas the maximal cell numbers after regrowth (ICCday 7) remained comparable to that of the river water. The regrowth factor increased to 4. Ozonation, as expected, resulted in a strong decrease in ICC. The reduction in TCC was due to the destruction of bacteria through ozone, which exceeds the mere loss of membrane integrity. The maximal cell numbers (ICCday 7) increased as a result of the ozonation converting TOC partially into AOC. The regrowth factor reached a maximum of 353. The subsequent increase in cell numbers in MLF and GAC filtrates reflected the beginning of biological stabilization. Surprisingly, the ICCday 7 values also continued to increase, indicating that both filters introduced nutrients instead of removing them. However, overall, the regrowth factors gradually decreased.
The next treatment step consisted of UV disinfection prior to the collection of the finished drinking water in a storage tank from where it entered the distribution network. The day 0 cell numbers of the drinking water remained constant after UV disinfection, storage and distribution. The effect of UV on cell viability could not be captured, as photochemical disinfection does not impact cell integrity. The ICCday 7 value showed a slight decrease in the finished water (1.4 × 10⁶ cells/mL), possibly caused by the turnover of dissolved nutrients during water storage in the clean water tank. Compared with the raw water (ICCday 7: 1.0 × 10⁶), however, the treatment resulted in an overall increase in maximal cell numbers by 37.5%.
Water was subsequently distributed and did not contain a disinfectant residual. The samples in the distribution showed stable ICCday 0 values but differences in maximal cell numbers at the various sampling points. These variations were also seen in later sampling events. The water at different sampling points in the DWDS showed regrowth factors between 5 and 29 compared to 9 for the finished water.
The changes in the relative proportions of HNA bacteria reflect the changes in the bacterial community composition (Figure 1B). The combined effect of slow sand filtration and ground passage resulted in a sharp drop in HNA bacteria, making this microbiological parameter more similar to groundwater, where LNA bacteria typically dominate. The high proportion of HNA bacteria in the ozonated water should not be overinterpreted, as the ratio is based on very few intact cells. Passage over the MLF and GAC filters was accompanied by significant changes in the HNA proportion, indicating that the water was enriched by bacteria specifically populating these filters. The finished and distributed water eventually contained a substantially lower proportion of HNA bacteria than the river water. Overall, these changes in HNA bacteria suggest that the water treatment was effective in replacing the original microbiology in the raw water. The waterborne bacterial community continued to be subject to changes in the DWDS, as indicated by a reduction in the proportion of HNA bacteria compared to the finished water at the end of the treatment, although the change was less pronounced than during treatment.
Assuming that the majority of nutrients in the river water were biologically fixed and not dissolved and bioavailable, the proportion of dissolved nutrients increased to 75% after SSF and ground passage (Figure 1C). After ozonation, the vast majority of nutrients were present in dissolved form. Filter passage resulted in a decrease in dissolved nutrients to 93%, whereas the finished water contained 89%. The proportion of biologically fixed nutrients increased accordingly. Within the DWDS, the relative proportion of dissolved nutrients was in the range between 78 and 96%. Overall, water treatment inverted the ratio of biologically fixed and dissolved nutrients.
Figure 1. Changes in the cell numbers at the time point of sampling (day 0), the maximal intact cell numbers after 7 days of regrowth (ICCday 7), and the percentage of HNA bacteria for the river water treatment and distribution. (A) A treatment train overview including slow sand filtration (SSF) and ground passage (GP), ozonation, multilayer filters (MLF), GAC filters and UV disinfection. The sample “SSF + GP” comprises both slow sand filtration and ground passage as no sample could be obtained after slow sand filtration. (B) Changes in TCCday 0, ICCday 0, ICCday 7 and the percentage of HNA bacteria throughout the treatment and within the distribution system. The dotted line serves as a reference for the ICCday 7 value of the raw river water. The values are averages from three repeated measurements of the corresponding sample (technical repeats). (C) Changes in the relative proportions of biologically fixed nutrients and dissolved nutrients as a percentage of the total assimilable nutrient pool.
Applsci 15 05843 g001

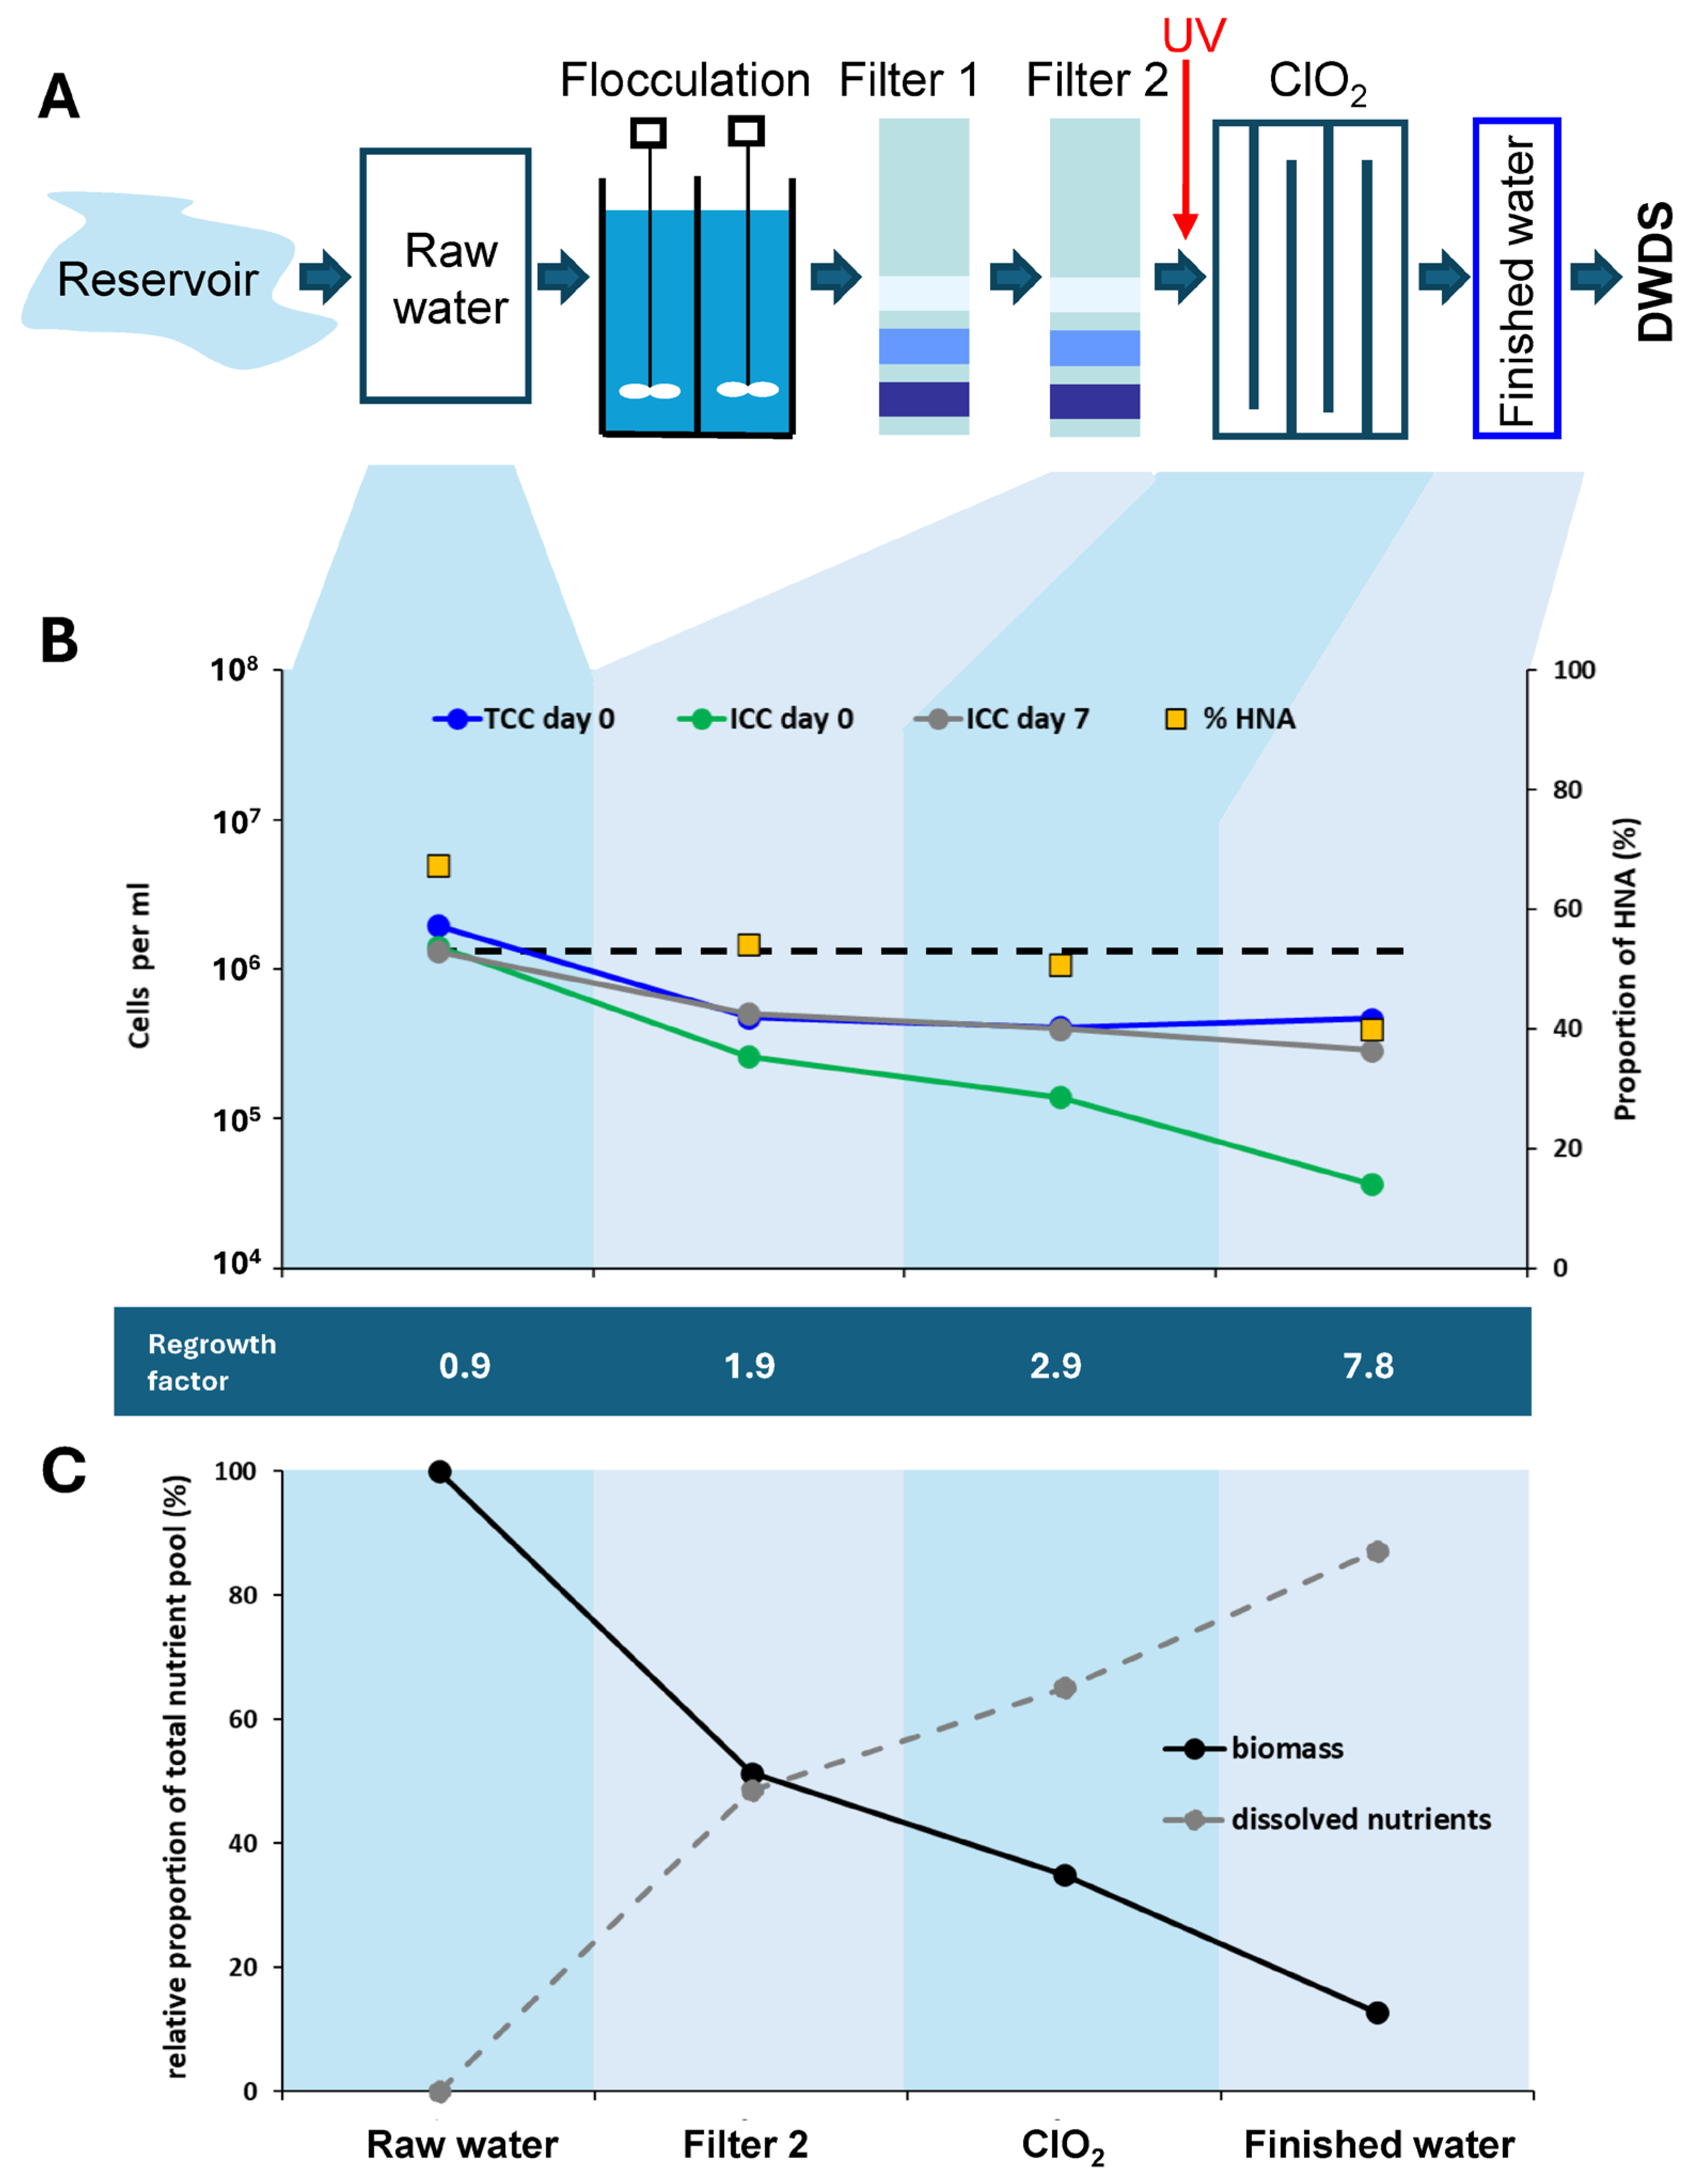
3.1.2. Reservoir Water Treatment

A water treatment plant treating reservoir water serves as the second example. Treatment consisted of flocculation followed by floc filtration in multilayer filters (MLFs) containing anthracite-N and quartz sand for the removal of turbidity, TOC-reduction and manganese removal. A second filtration over calcium carbonate served to increase the hardness. The filtrate of the second filtration step was subjected to disinfection with UV-light and chlorine dioxide prior to collection of the finished water in a drinking water tank before distribution (Figure 2A). We measured the microbiological parameters in raw water, the effluent of the second filter, the disinfected water and the finished water at the outlet of the drinking water tank.
The cell numbers in raw water at the time of sampling were 2.0 × 10⁶ (TCCday 0) and 1.4 × 10⁶ cells/mL (ICCday 0) (Figure 2B). Approximately 72% of cells were intact, which is within the typical range for surface water. The effluent of the second filtration step contained lower cell numbers (TCC: 4.8 × 10⁵, ICC: 2.6 × 10⁵), of which 55% were intact. The maximal cell number (ICCday 7) dropped in the two filtration steps. Directly after the addition of ClO2, the concentration of intact cells dropped to 1.4 × 10⁵ cells/mL, corresponding to 34% intact cells. The ICC values in water from the clean water tank dropped further to 3.7 × 10⁴ cells/mL (8% intact cells) due to the longer exposure time to the disinfectant. Treatment resulted in a reduction in the maximal cell number, with ICCday 7 of the finished water being 2.9 × 10⁵ cells/per ml. Compared with the raw water (ICCday 7: 1.3 × 10⁶), treatment thus decreased the maximal cell number by 88%.
When looking at the nutrient ratios, the nutrients were biologically fixed in the form of biomass in the raw water (Figure 2C). This proportion dropped to 51% after the second filtration, and the remaining nutrients were dissolved. Disinfection and concomitant killing of cells eventually resulted in a drop in biologically fixed nutrients to less than 13% in the finished water, and 87% of nutrients were dissolved. Overall, treatment thus led to an inversion of the two nutrient reservoirs.
Figure 2. Changes in the cell numbers and regrowth potentials for the reservoir water treatment. (A) A treatment train overview including two filter steps and disinfection with UV and chlorine dioxide. (B) Changes in TCCday 0, ICCday 0, ICCday 7 and the percentage of HNA bacteria throughout the treatment. The dotted line serves as a reference for the ICCday 7 value of the raw reservoir water. The values are averages from three repeated measurements of the corresponding sample (technical repeats). (C) Changes in the relative proportions of biologically fixed nutrients and dissolved nutrients as a percentage of the total assimilable nutrient pool.
Applsci 15 05843 g002

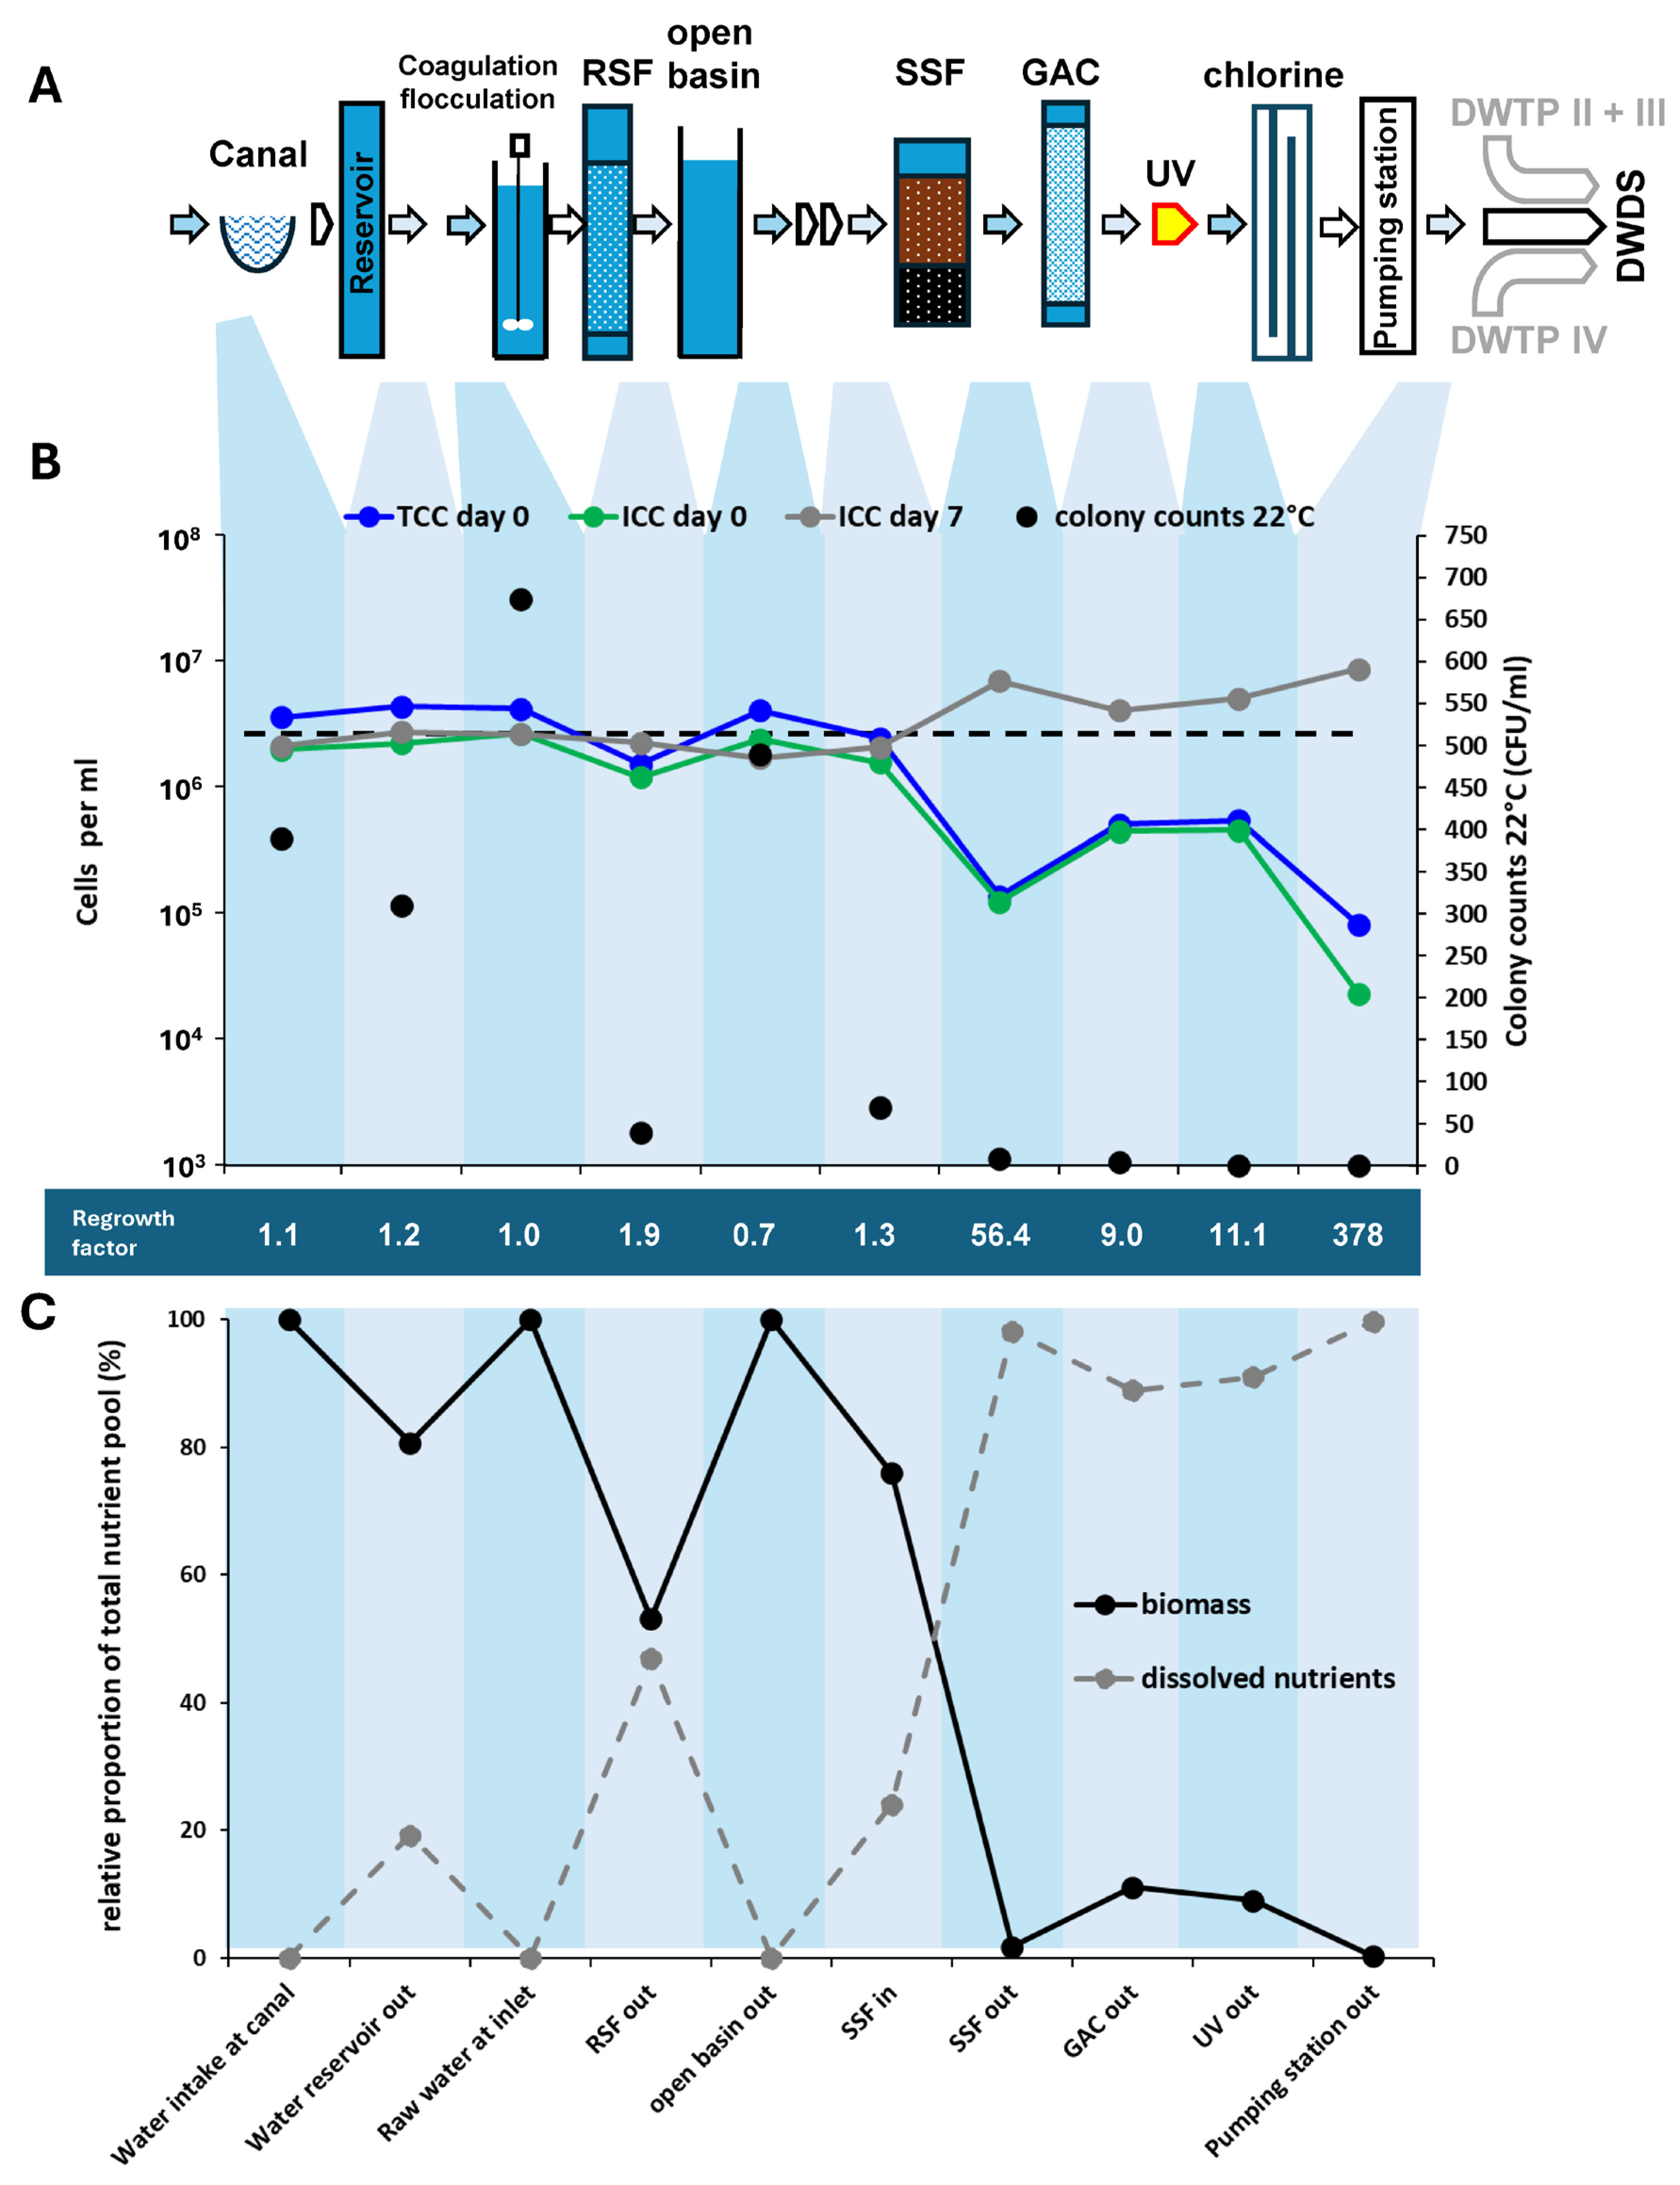
3.1.3. Canal Water Treatment

Next, we looked into microbiological changes within a water works processing canal water as raw water. The canal water was diverted from a major canal and subsequently passed through a reservoir before entering the treatment works. An overview of the subsequent treatment is shown in Figure 3A.
Figure 3. Changes in the cell numbers and regrowth potentials for the canal water treatment. (A) A treatment train overview including coagulation/flocculation/clarification, rapid sand filtration (RSF), storage in an open buffer basin, slow sand filtration (SSF), GAC filtration and disinfection with UV, and hypochlorite addition to the drinking water tank. The water entered the DWDS via a pumping station. The DWDS was supplied with water from two additional DWTPs. (B) Changes in TCCday 0, ICCday 0, ICCday 7 and colony counts in cfu/mL throughout the treatments. The dotted line serves as a reference for the ICCday 7 value of the raw water intake. The values are averages from three repeated measurements of the corresponding sample (technical repeats). (C) Changes in the relative proportions of biologically fixed nutrients and dissolved nutrients as a percentage of the total assimilable nutrient pool.
Applsci 15 05843 g003
The cell numbers from the water intake at the canal through the water reservoir to the raw water inlet at the treatment works remained similar (Figure 3B). Water at the inlet contained 4.2 × 10⁶ total cells/mL and 2.7 × 10⁶ intact cells/mL. Seven days of incubation at 22 °C resulted in little change in the ICC levels, with low regrowth factors, suggesting biological stability. The first two treatment steps (coagulation/flocculation/clarification and rapid sand filtration) resulted in a decrease in day 0 cell numbers but did not considerably affect the regrowth potential. The residence in the open buffer reservoir, on the other hand, led to an interim increase in cell numbers. As the ICCday 7 value was slightly below the ICCday 0 value (resulting in negative regrowth), the water remained biologically stable. Surprisingly, the roof-covered slow sand filter had a strong impact on cell numbers, which dropped to 1.4 × 10⁵ cells/mL (TCC) and 1.2 × 10⁵ cells/mL (ICC) (Figure 2B). The ICCday 7, at the same time, increased strongly to 7.0 × 10⁶ cells/mL, suggesting a substantial loss of biological stability with a regrowth factor of 56.4. GAC passage, in contrast, increased day 0 cell numbers and lowered the maximal cell number, but did not lead to complete biological stabilization (regrowth factor: 9). Whereas UV disinfection had no impact on cell numbers, the addition of hypochlorite (added to the drinking water tank) resulted in a strong decrease to 8.2 × 10⁴ cells/mL (TCC) and 2.3 × 10⁴ cells/mL (ICC), as measured in the outflow of the pumping station. Assuming plug flow conditions and flow rates between 2580 and 4050 m3/h, the residence time between hypochlorite addition and the pumping station was in the range between 345 and 541 min. The residual chlorine concentrations measured at the pumping stations were 0.25 mg/L (total chlorine) and 0.18 mg/L (free chlorine). The fact that chlorination also affected TCC values and not only ICC suggests that the disinfection was sufficiently strong to cause cellular disintegration and not only damage. The strong disinfection was probably also responsible for the increase in maximal cell numbers to 8.7 × 10⁶ intact cells/mL, representing an increase by a factor of 3.3 compared to the raw water intake. The regrowth factor reached a maximum of 378 at this point.
Changes in cell numbers did not show much correlation with colony counts at 22 °C, which showed a decrease throughout treatment, with the exception of the open water basin. The basin was identified as a point of hygienic concern due to sporadic findings of E. coli, enterococci and Clostridium perfringens when analyzing data from the previous five years.
When looking at the ratios of biologically fixed and dissolved nutrients, different treatment steps had different effects (Figure 3C). For canal and raw water at the intake, nearly all nutrients were fixed in biomass, whereas water from the intermediate water reservoir had dissolved nutrients present. This might be due to the ingress of dissolved nutrients into the open water by birds or other sources. These nutrients were transformed into biomass at the intake of the DWTP. The combination of coagulation/flocculation/clarification and rapid sand filtration (which were not sampled individually), on the other hand, resulted in a decrease in biomass. The opposite trend was seen in the open basin, which led to nutrient fixation into biomass consistent with the increase in colony counts at 22 °C. SSF had a strong effect on nutrient ratios by sharply increasing the proportion of dissolved nutrients. The high level of dissolved nutrients could only be lowered moderately by GAC passage, whereas after chlorination and the resulting killing of cells, the proportion of dissolved nutrients reached a maximum.

3.2. Microbiological Changes During Distribution of Chlorinated Water

Drinking water distributed from the “canal water treatment plant” was monitored for changes in cell numbers and regrowth potential. The DWDS was fed not only by the treatment plant shown in Figure 3A, but also by three other DWTPs that supply drinking water with disinfectant residual to a large European city. Samples were taken in June, September and December 2022. In total, 31 sampling points were included and sorted based on increasing distance from the DWTP (Figure 4). These samples represent water with increasing residence time, with the maximum water age reaching approx. 100 h before leaving the DWDS and entering individual plumbing systems. The first seven samples (1–7) were taken from different pumping stations, and samples 8 and 9 from transport pipes. The average water temperatures at the time of sampling were 20.6 °C (lowest: 17.9 °C, highest: 22.6 °C) in June, 18.2 °C (lowest: 15.6 °C, highest: 20.0 °C) in September and 9.0 °C (lowest: 6.6 °C, highest: 10.7 °C) in December.
The ICCday 0 values tended to increase with increasing residence time (Figure 4A). The highest intact cell numbers were obtained in June, increasing from approx. 104 cells/mL (proximal sampling sites) to 105 cells/mL (distal sampling sites). In September and December, the cell numbers also increased throughout the distribution, but on a lower level (trendlines are indicated in Figure 4A).
Additionally, the maximal intact cell numbers (ICCday 7) were subject to seasonal variation on the three different sampling dates. In June, the maximal cell numbers were highest and showed less variation throughout the distribution, whereas in September and December, the maximal cell numbers tended to increase from a lower level. In the September and December sampling rounds, samples 4 and 5 (from pumping stations early in the distribution system) did not show much regrowth, likely due to extensive damage inflicted on the cells by chlorine. This phenomenon did not occur in samples later in the distribution system, as the chlorine effect was probably not as pronounced. The corresponding ICC regrowth factors (the ratios of ICCday 7/ICCday 0) along the entire DWDS showed great variation, ranging from factors of 3 to 3241. In other words, the concentrations of intact bacteria could increase by these factors after the quenching of chlorine and seven days of incubation.
When looking at the relative ratios of intact and membrane-damaged cells, the proportion of intact cells increased in June with increasing residence time (Figure 4B). In December, high proportions of damaged cells were maintained throughout the distribution, probably due to less pronounced chlorine decay at lower water temperatures. The ratios of intact and damaged cells in September showed an intermediate profile.
Figure 4. Changes in intact cell numbers, regrowth potentials, relative proportions of intact cells and proportions of dissolved and biologically fixed nutrients along a network distributing chlorinated drinking water for three selected months (June, September and December). Samples were chosen to reflect water with increasing distance from the DWTP and increasing water age. (A) Changes in ICCday 0 and ICCday 7 along the DWDS together with exponential trendlines. Green and red shading was used for visual simplification with most data points in the shaded areas. The corresponding regrowth factors are shown underneath. The values are averages from three repeated measurements of the corresponding sample (technical repeats). (B) Changes in the relative ratios of membrane-intact and membrane-damaged cells throughout the distribution. (C) The relative ratios of dissolved and biologically fixed nutrients for the different sampling points, with the exception of samples from pumping stations (samples 1–7), where partly no or very little regrowth was obtained. The reason for regrowth suppression was attributed to strong cellular damage due to high chlorine concentrations early in the distribution.
Applsci 15 05843 g004
As for the previous examples (Figure 1, Figure 2 and Figure 3), the finished and distributed water from the DWTP contained primarily dissolved nutrients, and only a minor portion of the nutrients were biologically fixed in biomass (Figure 4C). The ratio of dissolved and biologically fixed nutrients remained relatively unchanged throughout the distribution; only at more distal points with higher residence time the percentage of biologically fixed nutrients increased. The reason for this was again seen to be chlorine decay allowing regrowth and the conversion of dissolved nutrients into biomass. The most distal sampling point, located in the city center, showed, at all time points, the highest ICCday 0 concentrations and the greatest utilization of the available regrowth potential. This is reflected in the highest extent of nutrient fixation in biomass or, vice versa, the lowest concentration of available dissolved nutrients.

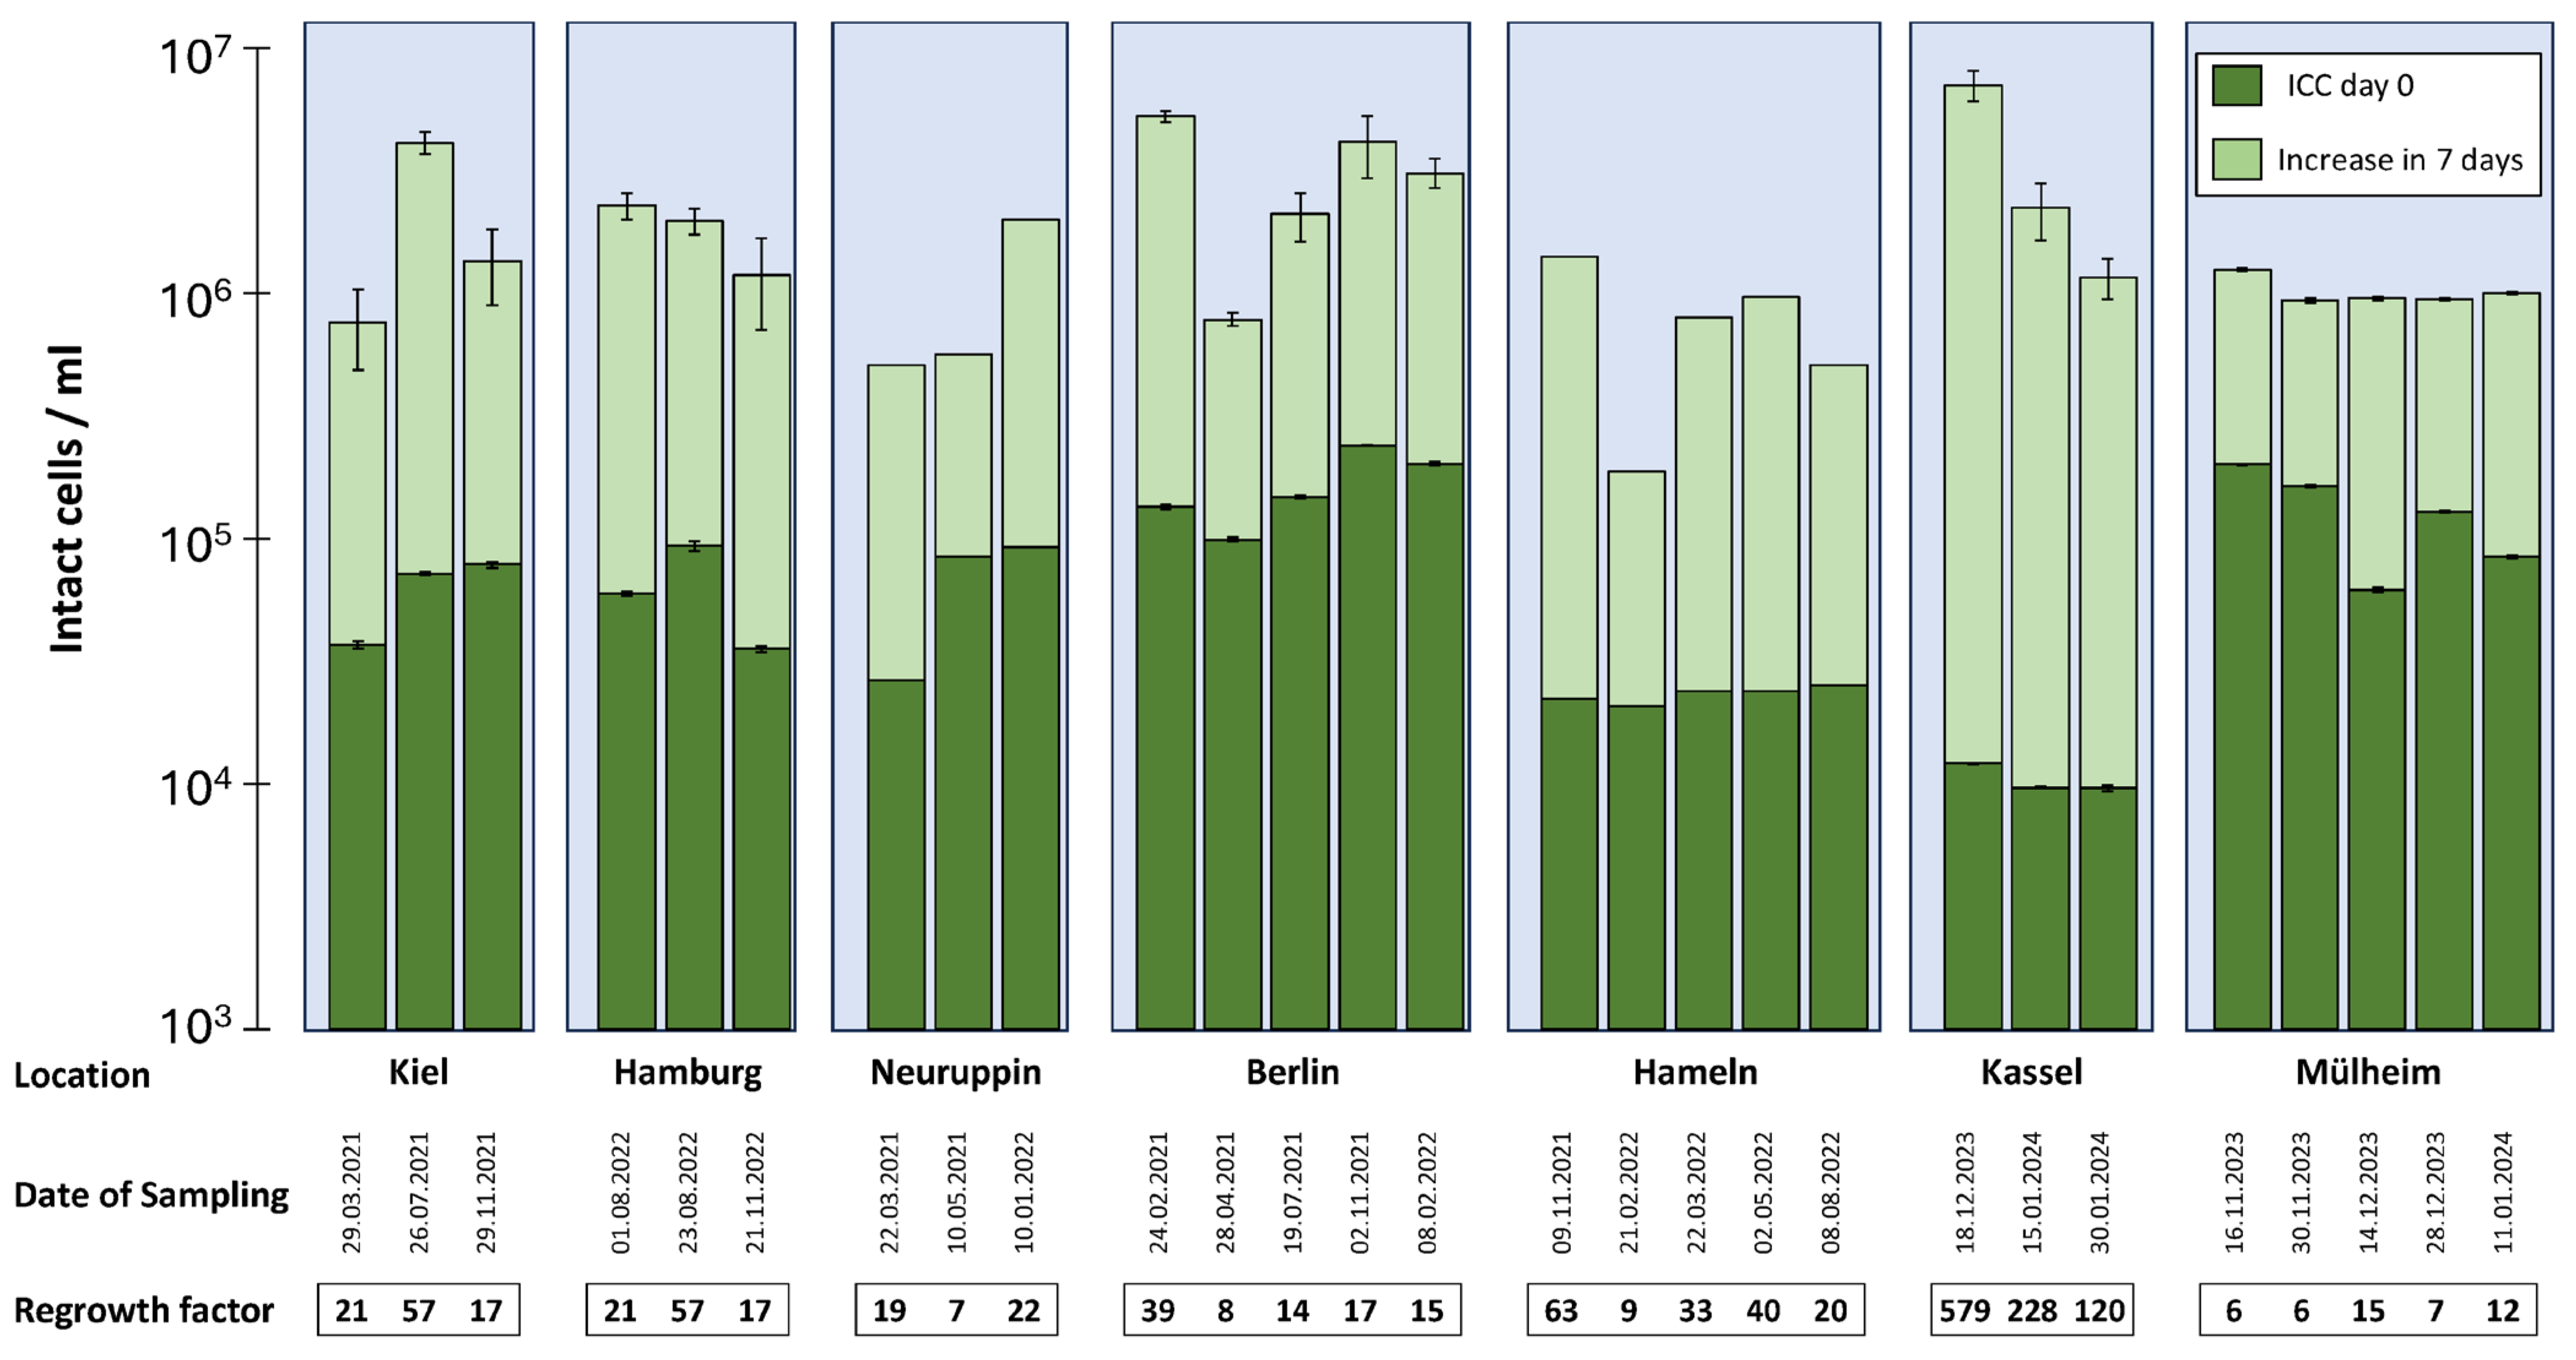
3.3. Regrowth Potential at the Entry Point of Buildings

We investigated the regrowth potential of cold drinking water (potable water cold, PWC) when leaving the DWDS and entering buildings. For this purpose, PWC samples were taken at the point of entry (POE) of different multifamily buildings across Germany. PWC samples were taken at different time points between 2021 and 2024. The ICCday 0 values ranged between 9.6 × 10³ and 2.4 × 10⁵ cells/mL (Figure 5, dark green bars). The ICCday 7 values showed strong variation and were in the range between 1.7 × 10⁵ and 7.0 × 10⁶ cells/mL (Figure 5, light green bars indicate the ICC increase in 7 days). This corresponds to regrowth factors between 6 and 579. The average regrowth factor over all samples was 54.
The extent of and variation in both ICCday 0 and ICCday 7 values differed between locations. For example, PWC from the building in Kassel showed relatively low and comparable ICCday 0 for all three sampling dates. Higher overall ICCday 0 values were measured for the building in Berlin. The latter also showed high and variable ICCday 7 values. Maximal cell numbers could substantially vary between sampling points. PWC in Mülheim showed the lowest regrowth factors, and the highest were obtained for the building in Kassel. Although the data set is limited, these results suggest strong regional and temporal differences in the extent of regrowth potentials and maximal cell numbers.
Figure 5. Intact cell numbers (ICCday 0, dark green bars) in PWC at the entry point of multifamily buildings in seven different German cities at different time points and corresponding regrowth within seven days (light green bars). The regrowth potentials refer to the entire bars (ICCday 7), comprising both dark and light green colors. The error bars represent the standard deviations from three measurements (biological repeats). The exact corresponding regrowth factors are indicated.
Applsci 15 05843 g005

3.4. Effect of Heating Water on Production of PWH

In DWIs, part of the PWC is subjected to heating for warm water production. We quantified regrowth in cold drinking water heated in a 5 L kitchen under-sink water boiler to different temperatures. After the target temperature was reached, the water was exposed to the corresponding temperature for 30 min each prior to taking samples. After cooling to room temperature, the PWH samples were spiked with a 1000th volume of cold water to re-introduce bacteria capable of replication. Spiking, in this case, replaced the natural seeding that would take place in a DWI in areas where heated bulk water cools down in subsequent pipes where it stagnates and where it is in contact with surface-attached bacteria. Changes in ICC were monitored over 21 days. The PWC, which was sampled before the boiler was turned on and which had a temperature of 9 °C, served as a reference.
The ICC increased most strongly during the first 7 days of incubation and subsequently plateaued (Figure 6A). The maximal ICC levels were in the range between 4.8 × 10⁶ and 8.2 × 10⁶ intact cells/mL. After 21 days, in part, higher ICC levels were reached in stagnated heated water than in the PWC that was subject to heating. The corresponding bacterial regrowth factors relative to ICC at the time of sampling are indicated (Figure 6B). The regrowth factors were mainly determined by the minimal ICC resulting from heat exposure. Higher heating temperatures resulted in stronger decreases in ICC levels and, thus, induced stronger subsequent regrowth factors. The temperature to which PWC was heated thus has a substantial effect on the extent of subsequent regrowth. When the water was heated to 82 °C, the ICC increased by more than 3000-fold over 21 days. Also, the PWC that originally contained 6.5 × 10⁴ intact cells per ml underwent regrowth, with a maximal regrowth factor of 117 reached after 14 days to a concentration of 7.6 × 10⁶ intact cells per ml. At the time of sampling, only 0.86% of the regrowth potential of PWC was thus biologically fixed in biomass, while the remaining 99.14% was present in the form of dissolved nutrients. The maximal ICC of PWC sampled from the turned-off boiler was higher than that typically obtained for PWC from this building without boiler passage. The reason might lie in the enrichment of water with nutrients during boiler passage.
Figure 6. The regrowth of autochthonous bacteria in PWC heated in an under-sink boiler to different indicated temperatures with heat exposure times of 30 min each. PWC that was not heated (boiler turned off) served as a reference. (A) The regrowth kinetics of water samples over 21 days of incubation at 22 °C. The values are averages from three biological repeats, and the error bars represent standard deviations. (B) The corresponding ICC regrowth factors for different incubation times.
Applsci 15 05843 g006
The temperature to which PWC is heated directly impacts subsequent bacterial regrowth if the water is not consumed. The higher the temperature, the greater the reduction in ICC levels and the greater the regrowth factors once the water is cooled down and subjected to stagnation. Strong heating exacerbates the biological instability already inherent in cold water. On the other hand, moderate heating to approximately 40 °C did not induce further instability. The regrowth factors resulting from warming to 41 °C for 30 min in the studied system were only moderately higher than that of PWC (Figure 6B).
When comparing the day 7 regrowth factors from the sampling locations in the same single-family house, the PWC samples from nine different sampling locations had an average regrowth factor of 15 (low: 1; high: 34), with water temperatures between 18 °C and 21 °C. The PWH samples from four sampling locations showed an average regrowth factor of 82 (low: 15, high: 271), with water temperatures between 36 °C and 57 °C. These data suggest that even within a single building, regrowth factors can substantially vary depending on the sampling location, water usage at the specific sampling point and water temperature. Hot water tends to be associated with significantly higher regrowth once it has cooled down and stagnated.

4. Discussion

This study presents an overarching view of the changes in regrowth potentials from raw water to the tap. Specifically, we addressed the question of how surface water treatment affects bacterial regrowth potential, how much of the regrowth potential is contained in drinking water after distribution, and how heating drinking water in a DWI affects regrowth factors. Regrowth factors increased as a consequence of water treatment. In the examples of river water treatment, and especially in the case of canal water treatment, the maximal cell numbers in finished waters even exceeded the ones in the corresponding raw waters. When defining biological stability on the basis of regrowth factors (and, thus, the possibility to produce new biomass), the stability of the water decreased. Regrowth factors herein refer to the ratio between the regrowth potential ICCday 7 and the actual bacterial concentration ICCday 0 and, therefore, to the net increase, whereas the ICCday 7 values represent the upper limit of intact cell numbers (i.e., maximal growth potential). It is important to understand that the regrowth potentials do not need to be met in practice, for example, if drinking water does not stagnate (meaning it is consumed rapidly) or if it is not exposed to elevated temperatures that accelerate the regrowth kinetics. In cases of drinking water with a disinfectant residual, regrowth is suppressed if the residual does not decay below a critical threshold. Still, ideally, the risk of possible regrowth should be avoided, as it can possibly result in the emergence of specific groups of unwanted bacteria related to esthetic, technical or hygienic problems. Especially in DWIs, regrowth is typically not a controlled process and is, therefore, a threat to water safety [29,30].
Independent of the absolute regrowth potential, water treatment reversed the ratios of biologically fixed and dissolved nutrients. Eventually, drinking water with predominantly dissolved nutrients is distributed. This applies both to drinking water with and without residual disinfectant, as the final disinfection is typically not followed by biological stabilization. This biological instability of drinking water contrasts with environmental waters, where the availability of easily accessible dissolved nutrients should be limited under stable environmental conditions.

4.1. Effect of Water Treatment

Different treatment steps have different effects on biological stability. Ozonation was one of the treatment steps in this study that led to substantially increased regrowth potentials. It is well known that oxidative water treatment results in highly unstable water [31,32,33]. Part of the reason is the increased availability of assimilable nutrients due to a modified substrate composition [23,34]. The majority (60–80%) of the AOC newly formed by ozonation was shown to comprise organic acids [35]. Also, phytoplankton contained in surface water can contribute substantially to the organic carbon load when subjected to ozonation [36]. The increase in AOC is thereby dependent on ozone dose and contact time [37]. Another reason for the instability is the lack of microbial competition [23]. Oxidation opens up ecological niches previously occupied by the bacteria that have been killed or damaged by the treatment, resulting in a “microbiological” reset. Among oxidative treatments, ozonation is seen as having the strongest impact due to its high reactivity [34].
Ozonation is typically followed by biological filtration to remove excess AOC [3]. Biological filters are sites of intense metabolic transformations and induce changes in the microbiome [38,39]. Biologically active GAC filters play a dominant role. In a study assessing the effect of GAC filters in a pilot plant treating surface water, different GAC filters receiving water treated with different ozone doses were reported to remove up to 70% of the AOC newly produced by ozone [40]. However, in none of the filters the overall AOC was reduced to concentrations given prior to ozonation. Without prior ozonation, the same authors reported that one GAC filter even produced AOC. This effect, whereby GAC filtration could raise the AOC of treated surface water, has also been described by Sallanko et al. [41]. In other words, GAC filters in these examples increased the regrowth potential of the water. A Japanese study reported little or no AOC removal in an ozonation–biological activated carbon process [42]. In our study, a GAC-mediated reduction in maximal intact cell numbers was seen for the canal water (Figure 3), whereas for the river water, both the multilayer and the GAC filter led to an increase in maximal cell numbers (Figure 1). These examples show that the effects of GAC filters vary, and filtration does not necessarily always lead to an overall reduction in assimilable nutrients. The reason probably lies in the fact that GAC filters are primarily operated to adsorb trace substances (pesticides, pharmaceuticals, etc.). To maintain a high adsorption capacity, charcoal is frequently exchanged, while a higher filter age in combination with optimized backwashing would be required for the microbiology to establish and to reach stability and maturity while, at the same time, removing excess nutrients.
A surprising finding was the increase in regrowth potential by the slow sand filter in canal water treatment (Figure 3). The increase in maximal cell numbers (ICCday 7) was accompanied by a substantial decrease in ICCday 0, resulting in a high regrowth factor. Slow sand filtration provides treatment through the physical filtration of particles, biological turnover of biomass and organics in the upper layer and intermittent removal of the latter. AOC removal efficiencies between 5 and 40% have been reported [43]. SSF has also been shown to reduce the biomass production potential (BPP) based on measurements of cumulative ATP concentrations and, therefore, metabolically active biomass in a batch growth test [44]. In the current case, the reason for the lack of biological stabilization by the slow sand filter was seen in the mode of operation: frequent mechanical disturbance of the upper filter layer and insufficient removal of the upper layer (“Schmutzdecke”). While a decrease in actual cell numbers in SSF filtrates is typical [45], the concomitant increase in regrowth potential is not and might indicate the die-off of microbes within the accumulated biomass in the upper layers of the SSF and nutrient release by cell lysis. It should be noted that treatment processes do not automatically lead to the desired outcome, but their success depends on the mode of operation.
Also, the combination of slow sand filtration with ground passage in the case of river water treatment did not result in a net decrease in maximal growth potential, only in a decrease in day 0 cell concentrations (Figure 1). The increasing discrepancy between the ICCday 0 and ICCday 7 values (i.e., the regrowth factor) can be interpreted as the conversion of biologically fixed nutrients into dissolved nutrients and, thus, the loss of biological stability (Figure 1). Riverbank filtration systems are subject to substantial dynamics regarding water quantity and quality [46]. Most studies have focused on DOC or NOM removal with little information available on AOC. While a decrease in AOC (based on quantification of an increase in ATP content) as an effect of riverbank filtration has been reported [47], the comparability of data is complicated by methodological heterogeneities in the experimental setups and scale of the studies [48]. For this reason, the comparison of removal rates of organic pollutants from different batch and column studies was considered to be nearly impossible [48,49]. The same might apply to data on the effect of riverbank filtration, which reduced the ICCday 0 values but not the maximal growth potential. The effect measured here could possibly be explained by the scenario that microorganisms from a river ecosystem enter in large amounts into a subsurface soil environment, which represents a dramatically different chemical, physical and biological environment for these microbes. The die-off of the microbiome and, thus, a decline in cell numbers, is conceivable, which would be concomitant with the release of previously biologically fixed nutrients. The time to convert these released nutrients into new biomass might not be sufficient during underground passage. Also, saturation effects or limiting factors might play a role and need more clarification. Unfortunately, the individual effects of SSF and ground passage could not be distinguished due to the lack of a sampling site.
Rapid sand filtration, on the other hand, in our studied example (Figure 3) resulted in both a decrease in ICCday 0 cell numbers and a 21% decline in ICCday 7. This finding is consistent with those of other studies [29,50] and is probably due to the mode of operation. The frequent removal of accumulated biomass turns it into a nutrient sink on an absolute scale. In relative proportions, however, the removal of biomass shifts the relative proportion of nutrients towards the dissolved nutrients (Figure 3C).

4.2. Regrowth in Distribution Systems

The distribution system studied here distributed water with hypochlorite as a secondary disinfectant. The cell numbers increased with water age. Strong seasonality was observed, with substantially higher ICC levels and higher relative proportions of intact cells in summer than in winter. This seasonal variation is primarily attributed to faster regrowth kinetics and higher chlorine demand in months with higher water temperatures, whereas in the colder months, the chlorine residuals persisted longer, causing a stronger disinfection effect. It is important to note that this biological effect was measurable even when chlorine levels were below the detection threshold using the DPD method.
These observations align with earlier research. Maul et al. [51] linked higher heterotrophic plate counts to lower levels of chlorine residuals and extended water retention times in a French distribution system. Similarly, [12] attributed increases in cell numbers (quantified by flow cytometry) in a chloraminated Swedish DWDS to distance from the DWTP, longer residence times and increased contact time of bulk water with pipe biofilm. Elevated water temperatures in summer led to higher TCC (1.51–5.24-fold increase) in some locations compared to colder months. And also, applying flow cytometric quantification, [52] reported increasing cell numbers with prolonged water residence times in the chlorinated DWDS of Riga, Latvia. The bacterial growth was ascribed to the loss of disinfectant residuals with prolonged retention times. A later study of the same DWDS described seasonal variations, with the ICC counts in winter being at least one log lower than in summer [53], consistent with the data presented here. These variations were attributed to changes in water temperature, with a direct effect on bacterial growth, but the extent varied depending on the water source and underlying treatment. Bacterial dynamics in the periphery of a large chlorinated DWDS was also corroborated in a recent study reporting shorter bacterial community turnover times and, therefore, reduced biological stability following the depletion of the disinfection residual for the sampling site with the greatest distance from the treatment plant [9].
Also, in non-chlorinated systems, temperature plays a pivotal role; for instance, a major German city experienced a strong increase in the cell count of heterotrophic bacteria at the end of a very hot summer with water temperatures up to 25 °C [8]. The latter example shows that the absence of secondary chlorination does not ensure biological stability. Higher temperatures have been reported to shorten growth lag phases and enhance growth rates and maximal cell numbers [54]. Different bacterial genera respond differently to temperature elevations [54]. Temperature likely plays a crucial role in increasing the probability of elevated cell numbers in summer, despite higher AOC concentrations typically found in winter in raw surface waters [42,55]. This contrasts with higher AOC removal efficiencies observed for biological filtration processes like GAC or SSF at higher temperatures [44]. Overall, bacterial growth in the DWDS appears to be more influenced by temperature than by AOC [23]. However, bacterial growth can only occur if a nutrient basis is available.
In addition to seasonal variations in actual cell numbers (ICCday 0), profound differences in ICCday 7 were observed between sampling months, with the highest concentrations occurring in summer. The reasons for these seasonal fluctuations in maximal growth potential remain unclear, but could relate to variations in organic compounds in raw water (canal water) and/or more efficient TOC conversion into AOC due to higher chlorine reactivity in summer. The use of secondary disinfection has been reported to significantly alter not only the community composition, but also the nutrient pool [23]. The effect of chloramination on cell numbers and AOC in the DWDS was less pronounced than the effect of chlorination [56], which is likely due to the lower but longer-lasting reactivity of chloramine in comparison to hypochlorite [28].

4.3. Regrowth Potential in Drinking Water Installations and Effect of Water Heating

Even if regrowth potentials are not fully met in the distribution system, this is likely the case in the DWIs, where water can stagnate in pipes with high surface area-to-volume ratios for extended periods and can reach substantially higher temperatures compared to the distribution network [18,19]. In buildings receiving drinking water with residual disinfectants, disinfectant decay is nearly unavoidable [57,58]. Plumbing system characteristics and stagnation under these conditions can lead to substantial increases in cell numbers and alterations in the drinking water microbiome [19,59,60]. Stagnation times peak during apartments vacancy or holidays. Water sampled here was collected at the house entrance of multifamily buildings and, thus, largely excluded these factors. Also, the effect of plastic materials within the plumbing system, which can further increase regrowth potentials [61], is not reflected in the data from the house entrance, which, therefore, does not represent the “worst case” scenario. Nevertheless, cold water samples at the house entrance exhibited maximal intact cell numbers, exceeding the ICCday 0 levels by factors ranging from 6 to 579. The impact of regrowth potentials on biofilm formation on pipe surfaces and overall water hygiene remains unknown but warrants investigation.
Within the DWI, a portion of the water undergoes the production of PWH. Prolonged heating of water to lethal temperatures (common in storage boilers) results in biologically unstable water, evidenced by strong regrowth after cooling. The D values (meaning the time required to achieve a one-log reduction in colony-forming units) for waterborne indicator bacteria at 65 °C were reported to be only a few seconds [62]. The release of intracellular contents from thermally lysed or damaged microorganisms can promote necrotrophic growth [63]. Also, the thermal degradation of TOC into more bioavailable forms in hot water boilers has recently been discussed as an additional source of AOC [22]. Complex organic molecules may be thermally degraded, becoming available for microbial assimilation. Both nutrient release and new AOC formation contribute to strong (re)growth, with the effects more pronounced at higher temperatures and at extended heat exposure times. Lethal treatments effectively lead to a “microbiological reset”, as vacated biological niches can be subsequently colonized by new organisms. It has been reported before that PWH contains a different bacterial community from that in PWC prior to heating [22,64]. Heating water to high temperatures thus adds to treatment steps like chlorination or ozonation (and other oxidative treatment steps) leading to a loss of biological stability in the sense of increasing regrowth factors.
The temperature to which PWC is heated has a direct impact on the subsequent bacterial regrowth if not consumed immediately. The higher the temperature, the greater the reduction in ICC levels and the higher the regrowth factors. In typical scenarios, regrowth occurs when hot water reaches peripheral water pipes in the installation system. Once hot water consumption ceases, the remaining water cools down and stagnates for extended periods of time. The water is, at the same time, seeded with bacteria present at the pipe surfaces [64]. The dissolved nutrients contained in the bulk water can subsequently be metabolized, generating new biomass. The increased AOC produced by heating has been reported to promote biofilm formation and to elevate the risk of Legionella manifestation [65]. In cases of appliances with plastic components, the nutrients contained in the bulk water add to those leaching from materials (e.g., EPDM in pipe seals or shower hoses). Regrowth in initially heated drinking water with disinfectant is facilitated by faster disinfectant decay in hot water compared to cold water [57,58]. Cooled and stagnated hot water might thus play an important role in the deterioration of the microbiological water quality, contributing to the “twilight zone” [15] of the last meters before the tap. The extent to which hygienically relevant bacteria, such as typical plumbing-associated opportunistic pathogens like Legionella pneumophila, Mycobacterium avium and Pseudomonas aeruginosa [60], benefit from this regrowth potential remains an open question for future investigations. Legionella might also indirectly profit from the buildup of biofilms, which represents the nutrient source for amoeba, which, in turn, can harbor Legionella. The role of the intrinsic regrowth potential of drinking water in comparison to that caused by materials in the plumbing system is, however, unknown and might be minor, e.g., in comparison to EPDM or similar materials.

4.4. Biological Stability of Drinking Water and Its Measurement

We use the term “biological stability” in the sense of small regrowth factors. This contrasts with the definition of “stability” on the basis of low colony or cell numbers enforced by residual disinfectants. This type of ‘stability’ is lost when the disinfectant decays during stagnation or heating. The overall results of this study, from raw water to tap, corroborate that drinking water produced from surface waters has an intrinsic regrowth potential. The regrowth potential is largely due to the water treatment process. While all current water treatment steps serve a purpose and ensure excellent drinking water quality from a chemical and microbiological perspective (e.g., the removal of fecal pathogens in a multibarrier process), this research raises the question of whether current treatment should be supplemented with an additional step: biological stabilization. Converting dissolved nutrients into biomass that is hygienically safe might help to increase its resilience to the establishment of microorganisms that can cause esthetic, technical or hygienic problems. This applies especially to DWIs, which are not strictly controlled. Occupying the ecological niches might lower the risk of unwanted bacteria intrinsic to water such as Legionella, Pseudomonas, Aeromonas or Mycobacterium. The correlation between the abundance of dissolved nutrients and the risk of hygienic problems is currently under-studied and needs to be addressed in future research. What seems clear, however, is that the current definition of biological stability needs to be clarified. The fact that drinking water comes with regrowth factors in the range reported here is hardly compatible with biological stability. An excellent basis for the concept of biological stability has been provided by Favere et al. [66,67] and Prest et al. [23].
Some of the results presented here (e.g., the lack of biological stabilization by soil passage or slow sand filtration) show deviations from those of other studies. These differences might be partly explained by methodological differences. The classical AOC assay is based on the reproductive ability of Pseudomonas fluorescens P-17 and Spirillum NOX added to pasteurized samples, followed by the quantification of colony-forming units after 5–25 days [68,69,70]. The ability of these two strains to metabolize the complex pool of carbon compounds sometimes differs from that of more complex microbial communities [29]. Other assays use complex microbial communities (e.g., from a river or finished drinking water) that are seeded into the water samples after removing or killing the indigenous bacterial community by filtration (0.22 µm) or pasteurization, followed by incubation at different temperatures and time periods and the quantification of bacteria by flow cytometry, turbidity or ATP measurement [21,29,50,71,72]. The evaluation of treatment performance on the basis of a complex microbial community was seen as advantageous [29].
In contrast, our approach did not include water pasteurization, filtration or seeding (the latter was only necessary in cases of certain ozonated waters) to avoid modification of the bioavailability of organics, and the lysis of biologically fixed nutrients or their removal. We also intentionally did not add a nitrogen or phosphorous source to limit the analysis to organic carbon. Instead, regrowth potentials were determined in unmodified samples using the autochthonous heterotrophic microbial community naturally contained in the corresponding water sample without prior laboratory treatment. The metabolic capacity of the microbial consortium can be seen to be well adapted to the nutrient spectrum contained in the specific sample. This approach allows for the assessment of both regrowth factors and the upper growth limits, each bearing important but distinct information. Future improvements could include the consideration of multiple stability parameters [24], cell sizes, growth rates, respiratory losses caused by metabolic turnover and limited maximum cell densities in batch assays.

5. Conclusions

Water treatment and processing are essential for providing chemically and microbiologically safe drinking water that is of high esthetic quality and meets operational requirements (e.g., a lack of corrosive properties). However, several of these processes can result in biological instability in terms of high regrowth factors and the generation of a surplus of dissolved nutrients. Certain processes can even increase the net regrowth potential. While all treatment steps serve an important purpose and cannot be easily modified or replaced, an additional stabilization step at the end of the treatment process should be considered to obtain biological stability. Alternatively, disinfection after biological filters or secondary disinfection in the DWDS might be omitted given that the water has been sufficiently disinfected further upstream and that the water is safe for human consumption. Biologically stable water would be characterized by an increase in the concentration of live bacteria in finished water and vice versa by a decrease in dissolved nutrients. Biological stabilization prior to water distribution might be beneficial to establish a hygienically safe and stable microbiome, minimizing the risk of colonization by unwanted bacteria through competition [66,67]. Such a more ecology-oriented, probiotic approach might be especially beneficial in microbiological risk areas of the distribution system or DWIs, where water is subject to stagnation or increasing water temperature. Of course, biological stabilization does not eliminate the necessity of a well-maintained water distribution system, which should remain the primary goal, but it might contribute to risk minimization in an imperfect world [7]. A new area of research includes the microbiological effects of heating water to high temperatures. Temperatures that lead to the lysis of microorganisms and the release of their intracellular components result in high regrowth factors once the water has cooled down. The nutrient release achieved by killing biomass adds to the thermal cracking of TOC, which is, in part, converted to AOC. The regrowth factors of water warmed to 41 °C were comparable to those of cold water. It remains to be investigated whether such moderate temperatures are compatible with hygienic aspects. Overall, however, microbiological water research needs more focus on nutrient availability and regrowth potential.

Supplementary Materials

The following supporting information can be downloaded at: https://www.mdpi.com/article/10.3390/app15115843/s1, Figure S1: Drinking water growth curve examples.

Author Contributions

A.N.: methodology, investigation, analysis, conceptualization, writing—original draft; B.M.: analysis and investigation of data on multifamily buildings, writing—review and editing; B.B.: methodology, investigation, analysis, writing—review and editing. All authors have read and agreed to the published version of the manuscript.

Funding

We thank Innogy SE and E.ON for funding part of this research on drinking water treatment plants and for providing seed funding for the initial studies. Special thanks are also extended to the participating water utilities. We further thank the German Federal Ministry for Economic Affairs and Climate Action (BMWK) and participating industry partners for funding studies of drinking water installation systems under grant numbers 03ET1617D (ULTRA-F) and 03EN1027B (Trans2NT-TWW).

Institutional Review Board Statement

Not applicable.

Informed Consent Statement

Not applicable.

Data Availability Statement

The original contributions presented in this study are included in the article and Supplementary Materials. Further inquiries can be directed to the corresponding author.

Acknowledgments

We would like to thank Denise Windrich and Dietmar Pütz for the technical sample analysis.

Conflicts of Interest

The authors declare no conflicts of interest.

Abbreviations

AcronymDefinition
AOCassimilable organic carbon
ATPadenosine triphosphate
ClO2chlorine dioxide
DOCdissolved organic carbon
DWDSdrinking water distribution system
DWTPdrinking water treatment plant
DWIdrinking water installation
EPDMethylene–propylene–diene monomer
FCMflow cytometry
FLfluorescence
GACgranular activated carbon
GPground passage
HNAhigh nucleic acid
ICCintact cell count
LNAlow nucleic acid
MLFmultilayer filter
PIpropidium iodide
POEpoint of entry
PWCpotable water cold
PWHpotable water hot
RSFrapid sand filter
SG-ISYBR Green I
SSFslow sand filter
TCCtotal cell count
TOCtotal organic carbon

References

  1. World Health Organization (WHO). Guidelines for Drinking-Water Quality: Fourth Edition Incorporating the First Addendum; World Health Organization: Geneva, Switzerland, 2017. [Google Scholar]
  2. Rittman, B.; Snoeyinck, V.L. Achieving biologically stable drinking water. J. Am. Water Work. Assoc. 1984, 76, 106–110. [Google Scholar] [CrossRef]
  3. van der Kooij, D. Significance and assessment of the biological stability of drinking water. In Water Pollution. The Handbook of Environmental Chemistry; Hrubec, J., Ed.; Springer: Berlin/Heidelberg, Germany, 1995; Volume 5/5B. [Google Scholar]
  4. Falkinham, J.O., III; Hilborn, E.D.; Arduino, M.J.; Pruden, A.; Edwards, M.A. Epidemiology and ecology of opportunistic premise plumbing pathogens: Legionella pneumophila, Mycobacterium avium, and Pseudomonas aeruginosa. Environ. Health Perspect. 2015, 123, 749–758. [Google Scholar] [CrossRef] [PubMed]
  5. Flemming, H.C.; Percival, S.L.; Walker, J.T. Contamination potential of biofilms in water distribution systems. Water Sci. Technol. Water Supply 2002, 2, 271–280. [Google Scholar] [CrossRef]
  6. Sun, H.; Shi, B.; Lytle, D.A.; Bai, Y.; Wang, D. Formation and release behavior of iron corrosion products under the influence of bacterial communities in a simulated water distribution system. Environ. Sci. Process. Impacts 2014, 16, 576–585. [Google Scholar] [CrossRef]
  7. Clark, R.M. Drinking water treatment and distribution systems: Their Role in Reducing Risks and Protecting Public Health. In Encyclopedia of Environmental Health, 2nd ed.; Nriagu, J., Ed.; Elsevier: Amsterdam, The Netherlands, 2019; pp. 157–172. [Google Scholar]
  8. Uhl, W.; Schaule, G. Establishment of HPC(R2A) for regrowth control in non-chlorinated distribution systems. Int. J. Food Microbiol. 2004, 92, 317–325. [Google Scholar] [CrossRef]
  9. Campostrini, L.; Proksch, P.; Jakwerth, S.; Farnleitner, A.H.; Kirschner, A.K.T. Introducing bacterial community turnover times to elucidate temporal and spatial hotspots of biological instability in a large Austrian drinking water distribution network. Water Res. 2024, 252, 121188. [Google Scholar] [CrossRef]
  10. Lautenschlager, K.; Hwang, C.; Liu, W.T.; Boon, N.; Köster, O.; Vrouwenvelder, H.; Egli, T.; Hammes, F. Microbiology-based multi-parametric approach towards assessing biological stability in drinking water distribution networks. Water Res. 2013, 47, 3015–3025. [Google Scholar] [CrossRef]
  11. Prest, E.I.; Weissbrodt, D.G.; Hammes, F.; van Loosdrecht, M.C.M.; Vrouwenvelder, J.S. Long-Term bacterial dynamics in a full-scale drinking water distribution system. PLoS ONE 2016, 11, e0164445. [Google Scholar] [CrossRef]
  12. Schleich, C.; Chan, S.; Pullerits, K.; Besmer, M.D.; Paul, C.J.; Rådström, P.; Keucken, A. Mapping Dynamics of bacterial communities in a full-scale drinking water distribution system using flow cytometry. Water 2019, 11, 2137. [Google Scholar] [CrossRef]
  13. Prest, E.I.; El-Chakhtoura, J.; Hammes, F.; Saikaly, P.E.; van Loosdrecht, M.C.; Vrouwenvelder, J.S. Combining flow cytometry and 16S rRNA gene pyrosequencing: A promising approach for drinking water monitoring and characterization. Water Res. 2014, 63, 179–189. [Google Scholar] [CrossRef] [PubMed]
  14. Nocker, A.; Shah, M.; Dannenmann, B.; Schulze-Osthoff, K.; Wingender, J.; Probst, A.J. Assessment of UV-C-induced water disinfection by differential PCR-based quantification of bacterial DNA damage. J. Microbiol. Methods 2018, 149, 89–95. [Google Scholar] [CrossRef]
  15. Flemming, H.C.; Bendinger, B.; Exner, M.; Gebel, J.; Kistemann, T.; Schaule, G.; Szewzyk, U.; Wingender, J. The last meters before the tap: Where drinking water quality is at risk. In Microbial Growth in Drinking Water Supplies—Problems, Causes, Control and Research Needs; Van der Kooij, D., van der Wielen, P.W.J., Eds.; IWA Publishing: London, UK, 2014; pp. 207–238. [Google Scholar]
  16. Völker, S.; Schreiber, C.; Kistemann, T. Drinking water quality in household supply infrastructure—A survey of the current situation in Germany. Int. J. Hyg. Environm. Health 2010, 213, 204–209. [Google Scholar] [CrossRef] [PubMed]
  17. Bucheli-Witschel, M.; Kötzsch, S.; Darr, S.; Widler, R.; Egli, T. A new method to assess the influence of migration from polymeric materials on the biostability of drinking water. Water Res. 2012, 46, 4246–4260. [Google Scholar] [CrossRef]
  18. Proctor, C.R.; Hammes, F. Drinking water microbiology—From measurement to management. Curr. Opin. Biotechnol. 2015, 33, 87–94. [Google Scholar] [CrossRef]
  19. Lautenschlager, K.; Boon, N.; Wang, Y.; Egli, T.; Hammes, F. Overnight stagnation of drinking water in household taps induces microbial growth and changes in community composition. Water Res. 2010, 44, 4868–4877. [Google Scholar] [CrossRef]
  20. Lipphaus, P.; Hammes, F.; Kötzsch, S.; Green, J.; Gillespie, S.; Nocker, A. Microbiological tap water profile of a medium-sized building and effect of water stagnation. Environ. Technol. 2013, 35, 620–628. [Google Scholar] [CrossRef]
  21. Ross, P.S.; Hammes, F.; Dignum, M.; Magic-Knezev, A.; Hambsch, B.; Rietveld, L.D. A comparative study of three different assimilable organic carbon (AOC) methods: Results of a round-robin test. Water Sci. Technol. Water Supply 2013, 13, 1024–1033. [Google Scholar] [CrossRef]
  22. Egli, T.; Campostrini, L.; Leifels, M.; Füchslin, H.P.; Kolm, C.; Dan, C.; Zimmermann, S.; Hauss, V.; Guiller, A.; Grasso, L.; et al. Domestic hot-water boilers harbour active thermophilic bacterial communities distinctly different from those in the cold-water supply. Water Res. 2024, 253, 121109. [Google Scholar] [CrossRef]
  23. Prest, E.; Hammes, F.; van Loosdrecht, M.C.M.; Vrouwenvelder, J.S. Biological stability of drinking water: Controlling factors, methods, and challenges. Front. Microbiol. 2016, 7, 45. [Google Scholar] [CrossRef]
  24. van der Wielen, P.W.J.J.; Brouwer-Hanzens, A.; Italiaander, R.; Hijnen, W.A.M. Initiating guidance values for novel biological stability parameters in drinking water to control regrowth in the distribution system. Sci. Total Environ. 2023, 871, 161930. [Google Scholar] [CrossRef]
  25. ISO 6222:1999; Water quality—Enumeration of culturable microorganisms—Colony count by inoculation in a nutrient agar culture medium. ISO: Geneva, Switzerland, 1999.
  26. Gatza, E.; Hammes, F.; Prest, E. Assessing Water Quality With the BD Accuri™ C6 Flow Cytometer; White Paper; BD Biosciences: Franklin Lakes, NJ, USA, 2013. [Google Scholar]
  27. Hammes, F.; Broger, T.; Weilenmann, H.-U.; Vital, M.; Helbing, J.; Bosshart, U.; Huber, P.; Odermatt, R.P.; Sonnleitner, B. Development and laboratory-scale testing of a fully automated online flow cytometer for drinking water analysis. Cytom. Part A 2012, 81, 508–516. [Google Scholar] [CrossRef] [PubMed]
  28. Gillespie, S.; Lipphaus, P.; Green, J.; Parsons, S.; Weir, P.; Juskowiak, K.; Jefferson, B.; Jarvis, P.; Nocker, A. Assessing microbiological water quality in drinking water distribution systems with disinfectant residual using flow cytometry. Water Res. 2014, 65, 224–234. [Google Scholar] [CrossRef] [PubMed]
  29. Kasuga, I.; Nakamura, H.; Kurisu, F.; Furumari, H. Characterization of microbial regrowth potential shaped by advanced drinking water treatment. H2Open J. 2021, 4, 157–166. [Google Scholar] [CrossRef]
  30. Rahmatika, I.; Kurisu, F.; Furumai, H.; Kasuga, I. Dynamics of the microbial community and opportunistic pathogens after water stagnation in the premise plumbing of a building. Microbes Environ. 2022, 37, ME21065. [Google Scholar] [CrossRef]
  31. Hammes, F.; Berger, C.; Köster, O.; Egli, T. Assessing biological stability of drinking water without disinfectant residuals in a full-scale water supply system. J. Water Supply Res. Technol. 2010, 59, 31–40. [Google Scholar] [CrossRef]
  32. Hammes, F.; Berney, M.; Wang, Y.; Vital, M.; Koster, O.; Egli, T. Flow-cytometric total bacterial cell counts as a descriptive microbiological parameter for drinking water treatment processes. Water Res. 2008, 42, 269–277. [Google Scholar] [CrossRef]
  33. Vital, M.; Dignum, M.; Magic-Knezev, A.; Ross, P.; Rietveld, L.; Hammes, F. Flow cytometry and adenosine tri-phosphate analysis: Alternative possibilities to evaluate major bacteriological changes in drinking water treatment and distribution systems. Water Res. 2012, 46, 4665–4676. [Google Scholar] [CrossRef]
  34. Ramseier, M.K.; Peter, A.; Traber, J.; von Gunten, U. Formation of assimilable organic carbon during oxidation of natural waters with ozone, chlorine dioxide, chlorine, permanganate, and ferrate. Water Res. 2011, 45, 2002–2010. [Google Scholar] [CrossRef]
  35. Hammes, F.; Salhi, E.; Koster, O.; Kaiser, H.P.; Egli, T.; von Gunten, U. Mechanistic and kinetic evaluation of organic disinfection by-product and assimilable organic carbon (AOC) formation during the ozonation of drinking water. Water Res. 2006, 40, 2275–2286. [Google Scholar] [CrossRef]
  36. Hammes, F.; Meylan, S.; Salhi, E.; Köster, O.; Egli, T.; von Gunten, U. Formation of assimilable organic carbon (AOC) and specific natural organic matter (NOM) fractions during ozonation of phytoplankton. Water Res. 2007, 41, 1447–1454. [Google Scholar] [CrossRef]
  37. Rosińska, A.; Rakocz, K. Ozonation and changes in biodegradable organic substances in drinking water treatment: The future of green technology. Energies 2024, 17, 530. [Google Scholar] [CrossRef]
  38. Lautenschlager, K.; Hwang, C.; Ling, F.; Liu, W.-T.; Boon, N.; Köster, O.; Egli, E.; Hammes, H. Abundance and composition of indigenous bacterial communities in a multi-step biofiltration-based drinking water treatment plant. Water Res. 2014, 62, 40–52. [Google Scholar] [CrossRef] [PubMed]
  39. Pinto, A.J.; Xi, C.; Raskin, L. Bacterial community structure in the drinking water microbiome is governed by filtration processes. Environ. Sci. Technol. 2012, 46, 8851–8859. [Google Scholar] [CrossRef]
  40. van de Aa, L.T.J.; Rietveld, L.C.; van Dijk, J.C. Effects of ozonation and temperature on the biodegradation of natural organic matter in biological granular activated carbon filters. Drink. Water Eng. Sci. 2011, 4, 25–35. [Google Scholar] [CrossRef]
  41. Sallanko, J.; Iivari, P.; Heiska, E. Effect of ozone and granular activated coal (GAC) on the bioactivity of drinking water. J. Environ. Sci. Health Part A 2009, 44, 230–234. [Google Scholar] [CrossRef]
  42. Ohkouchi, Y.; Ly, B.T.; Ishikawa, S.; Aoki, Y.; Echigo, S.; Itoh, S. A survey on levels and seasonal changes of assimilable organic carbon (AOC) and its precursors in drinking water. Environ. Technol. 2011, 32, 1605–1613. [Google Scholar] [CrossRef]
  43. Guchi, E. Review on slow sand filtration in removing microbial contamination and particles from drinking water. Am. J. Food Nutr. 2015, 3, 47–55. [Google Scholar]
  44. van der Kooij, D.; Veenendaal, H.R.; van der Mark, E.J.; Dignum, M. Assessment of the microbial growth potential of slow sand filtrate with the biomass production potential test in comparison with the assimilable organic carbon method. Water Res. 2017, 125, 270–279. [Google Scholar] [CrossRef]
  45. Trikannad, S.A.; Attiani, V.; van der Wielen, P.W.J.J.; Smidt, H.; van der Hoek, J.P.; van Halem, D. Recovery of microbial biomass and purification performance after scraping of full-scale slow sand filters. J. Water Process Eng. 2024, 60, 105101. [Google Scholar] [CrossRef]
  46. Kirschner, A.K.T.; Lindner, G.; Jakwerth, S.; Vierheilig, J.; van Driezum, I.C.H.; Derx, J.; Blaschke, A.P.; Savio, D.; Farnleitner, A.H. Assessing biological stability in a porous groundwater aquifer of a riverbank filtration system: Combining traditional cultivation-based and emerging cultivation-independent in situ and predictive methods. Osterr. Wasser Und Abfallwirtsch 2021, 73, 490–500. [Google Scholar] [CrossRef]
  47. Weiss, W.J.; Bouwer, E.J.; Ball, W.P.; O’Melia, C.R.; Aboytes, R.; Speth, T.F. Riverbank filtration: Effect of ground passage on NOM. J. Water Supply: Res. Technol.–AQUA 2004, 53, 61–83. [Google Scholar] [CrossRef]
  48. Kondor, A.C.; Vancsik, A.V.; Bauer, L.; Szabó, L.; Szalai, Z.; Jakab, G.; Maász, G.; Pedrosa, M.; Sampaio, M.J.; Lado Ribeiro, A.R. Efficiency of the bank filtration for removing organic priority substances and contaminants of emerging concern: A critical review. Environ. Pollut. 2023, 340, 122795. [Google Scholar] [CrossRef] [PubMed]
  49. Storck, F.R.; Schmidt, C.K.; Lange, F.; Henson, J.W.; Hahn, K. Factors controlling micropollutant removal during riverbank filtration. J. Am. Water Work. Assoc. 2012, 104, 643–652. [Google Scholar] [CrossRef]
  50. Chen, W.T.; Chien, C.C.; Ho, W.S.; Ou, J.H.; Chen, S.C.; Kao, C.M. Effects of treatment processes on AOC removal and changes of bacterial diversity in a water treatment plant. J. Environ. Manag. 2022, 31, 114853. [Google Scholar] [CrossRef]
  51. Maul, A.; El-Shaarawi, A.H.; Block, J.C. Heterotrophic bacteria in water distribution systems. I. Spatial and temporal variation. Sci. Total Environ. 1985, 44, 201–214. [Google Scholar] [CrossRef]
  52. Nescerecka, A.; Rubulis, J.; Vital, M.; Juhna, T.; Hammes, F. Biological instability in a chlorinated drinking water distribution network. PLoS ONE 2014, 9, e96354. [Google Scholar] [CrossRef]
  53. Nescerecka, A.; Juhna, T.; Hammes, F. Identifying the underlying causes of biological instability in a full-scale drinking water supply system. Water Res. 2018, 135, 11–21. [Google Scholar] [CrossRef]
  54. Fransolet, G.; Villers, G.; Masschelein, W.J. Influence of temperature on bacterial development in waters. Ozone Sci. Eng. 2008, 7, 205–227. [Google Scholar] [CrossRef]
  55. Choi, Y.; Park, H.; Lee, M.; Lee, G.-S.; Choi, Y.-J. Seasonal variation of assimilable organic carbon and its impact to the biostability of drinking water. Environ. Eng. Res. 2019, 24, 501–512. [Google Scholar] [CrossRef]
  56. Li, W.; Zhang, J.; Wang, F.; Qian, L.; Zhou, Y.; Qi, W.; Chen, J. Effect of disinfectant residual on the interaction between bacterial growth and assimilable organic carbon in a drinking water distribution system. Chemosphere 2018, 202, 586–597. [Google Scholar] [CrossRef]
  57. Grimard-Conea, M.; Bédard, E.; Prévost, M. Can free chlorine residuals from the utility really be maintained in building plumbing systems to prevent microbial growth? Sci. Total Environ. 2024, 939, 173651. [Google Scholar] [CrossRef] [PubMed]
  58. Nguyen, C.; Elfland, C.; Edwards, M. Impact of advanced water conservation features and new copper pipe on rapid chloramines decay and microbial regrowth. Water Res. 2012, 46, 611–621. [Google Scholar] [CrossRef]
  59. Ji, P.; Parks, J.; Edwards, M.A.; Pruden, A. Impact of water chemistry, pipe material and stagnation on the building plumbing microbiome. PLoS ONE 2015, 10, e0141087. [Google Scholar] [CrossRef]
  60. Ling, F.; Whitaker, R.; LeChevallier, M.W.; Liu, W.T. Drinking water microbiome assembly induced by water stagnation. ISME J. 2018, 12, 1520–1531. [Google Scholar] [CrossRef]
  61. Learbuch, K.L.G.; Smidt, H.; van der Wielen, P.W.J.J. Influence of pipe materials on the microbial community in unchlorinated drinking water and biofilm. Water Res. 2021, 194, 116922. [Google Scholar] [CrossRef]
  62. Spinks, A.T.; Dunstan, R.H.; Harrison, T.; Coombes, P.; Kuczera, G. Thermal inactivation of water-borne pathogenic and indicator bacteria at sub-boiling temperatures. Water Res. 2006, 40, 1326–1332. [Google Scholar] [CrossRef]
  63. Nocker, A.; Lindfeld, E.; Wingender, J.; Schulte, S.; Dumm, M.; Bendinger, B. Thermal and chemical disinfection of water and biofilms: Only a temporary effect in regard to the autochthonous bacteria. J. Water Health 2021, 19, 808–822. [Google Scholar] [CrossRef]
  64. Meyer, B.; Pannekens, M.; Soares, A.; Timmermann, L.; Probst, A.; Hippelein, M.; Bendinger, B.; Nocker, A. Bacterial populations in different parts of domestic drinking water systems are distinct and adapted to the given ambient temperatures. Front. Water 2023, 5, 1119951. [Google Scholar] [CrossRef]
  65. van der Kooij, D.; Veenendaal, H.R.; Italiaander, R.; van der Mark, E.J.; Dignum, M. Primary colonizing Betaproteobacteriales play a key role in the growth of Legionella pneumophila in biofilms on surfaces exposed to drinking water treated by slow sand iltration. Appl. Environ. Microbiol. 2018, 84, e01732-18. [Google Scholar] [CrossRef]
  66. Favere, J.; Waegenaar, F.; Jia, M.; Folens, K.; Verhoeven, M.; Balliu, E.; Rajkovic, A.; De Gusseme, B.; Boon, N. Production of biostable drinking water using a lab-scale biological trickling filter enriched with hydrogen-oxidizing bacteria. Npj Clean Water 2024, 7, 101. [Google Scholar] [CrossRef]
  67. Favere, J.; Barbosa, R.G.; Sleutels, T.; Verstraete, W.; De Gusseme, B.; Boon, N. Safeguarding the microbial water quality from source to tap. Npj Clean Water 2021, 4, 28. [Google Scholar] [CrossRef]
  68. van der Kooij, D. Assimilable Organic Carbon (AOC) in Treated Water: Determination and Significance. In Encyclopedia of Environmental Microbiology; Bitton, G., Ed.; Wileys & Sons: New York, NY, USA, 2002; pp. 312–327. [Google Scholar]
  69. van der Kooij, D. Assimilable organic carbon as an indicator of bacterial regrowth. J. Am. Water Work. Assoc. 1992, 84, 57–65. [Google Scholar] [CrossRef]
  70. van der Kooij, D.; Visser, A.; Hijnen, W. Determining the concentration of easily assimilable organic carbon in drinking water. J. Am. Water Work. Assoc. 1982, 74, 540–545. [Google Scholar] [CrossRef]
  71. Elhadidy, A.M.; van Dyke, M.I.; Peldszus, S.; Huck, P.M. Application of flow cytometry to monitor assimilable organic carbon (AOC) and microbial community changes in water. J. Microbiol. Methods 2016, 130, 154–163. [Google Scholar] [CrossRef]
  72. Hammes, F.A.; Egli, T. New method for assimilable organic carbon determination using flow-cytometric enumeration and a natural microbial consortium as inoculum. Environ. Sci. Technol. 2005, 39, 3289–3294. [Google Scholar] [CrossRef]
Disclaimer/Publisher’s Note: The statements, opinions and data contained in all publications are solely those of the individual author(s) and contributor(s) and not of MDPI and/or the editor(s). MDPI and/or the editor(s) disclaim responsibility for any injury to people or property resulting from any ideas, methods, instructions or products referred to in the content.

