
Efficient Removal of Tartrazine Yellow Azo Dye by Electrocoagulation Using Aluminium Electrodes: An Optimization Study by Response Surface Methodology

 , , ,
, , ,  ,
, 
Abstract
1. Introduction
2. Materials and Methods
3. Results
3.1. Change in Process Parameters During the EC Process
3.1.1. Change in pH Value
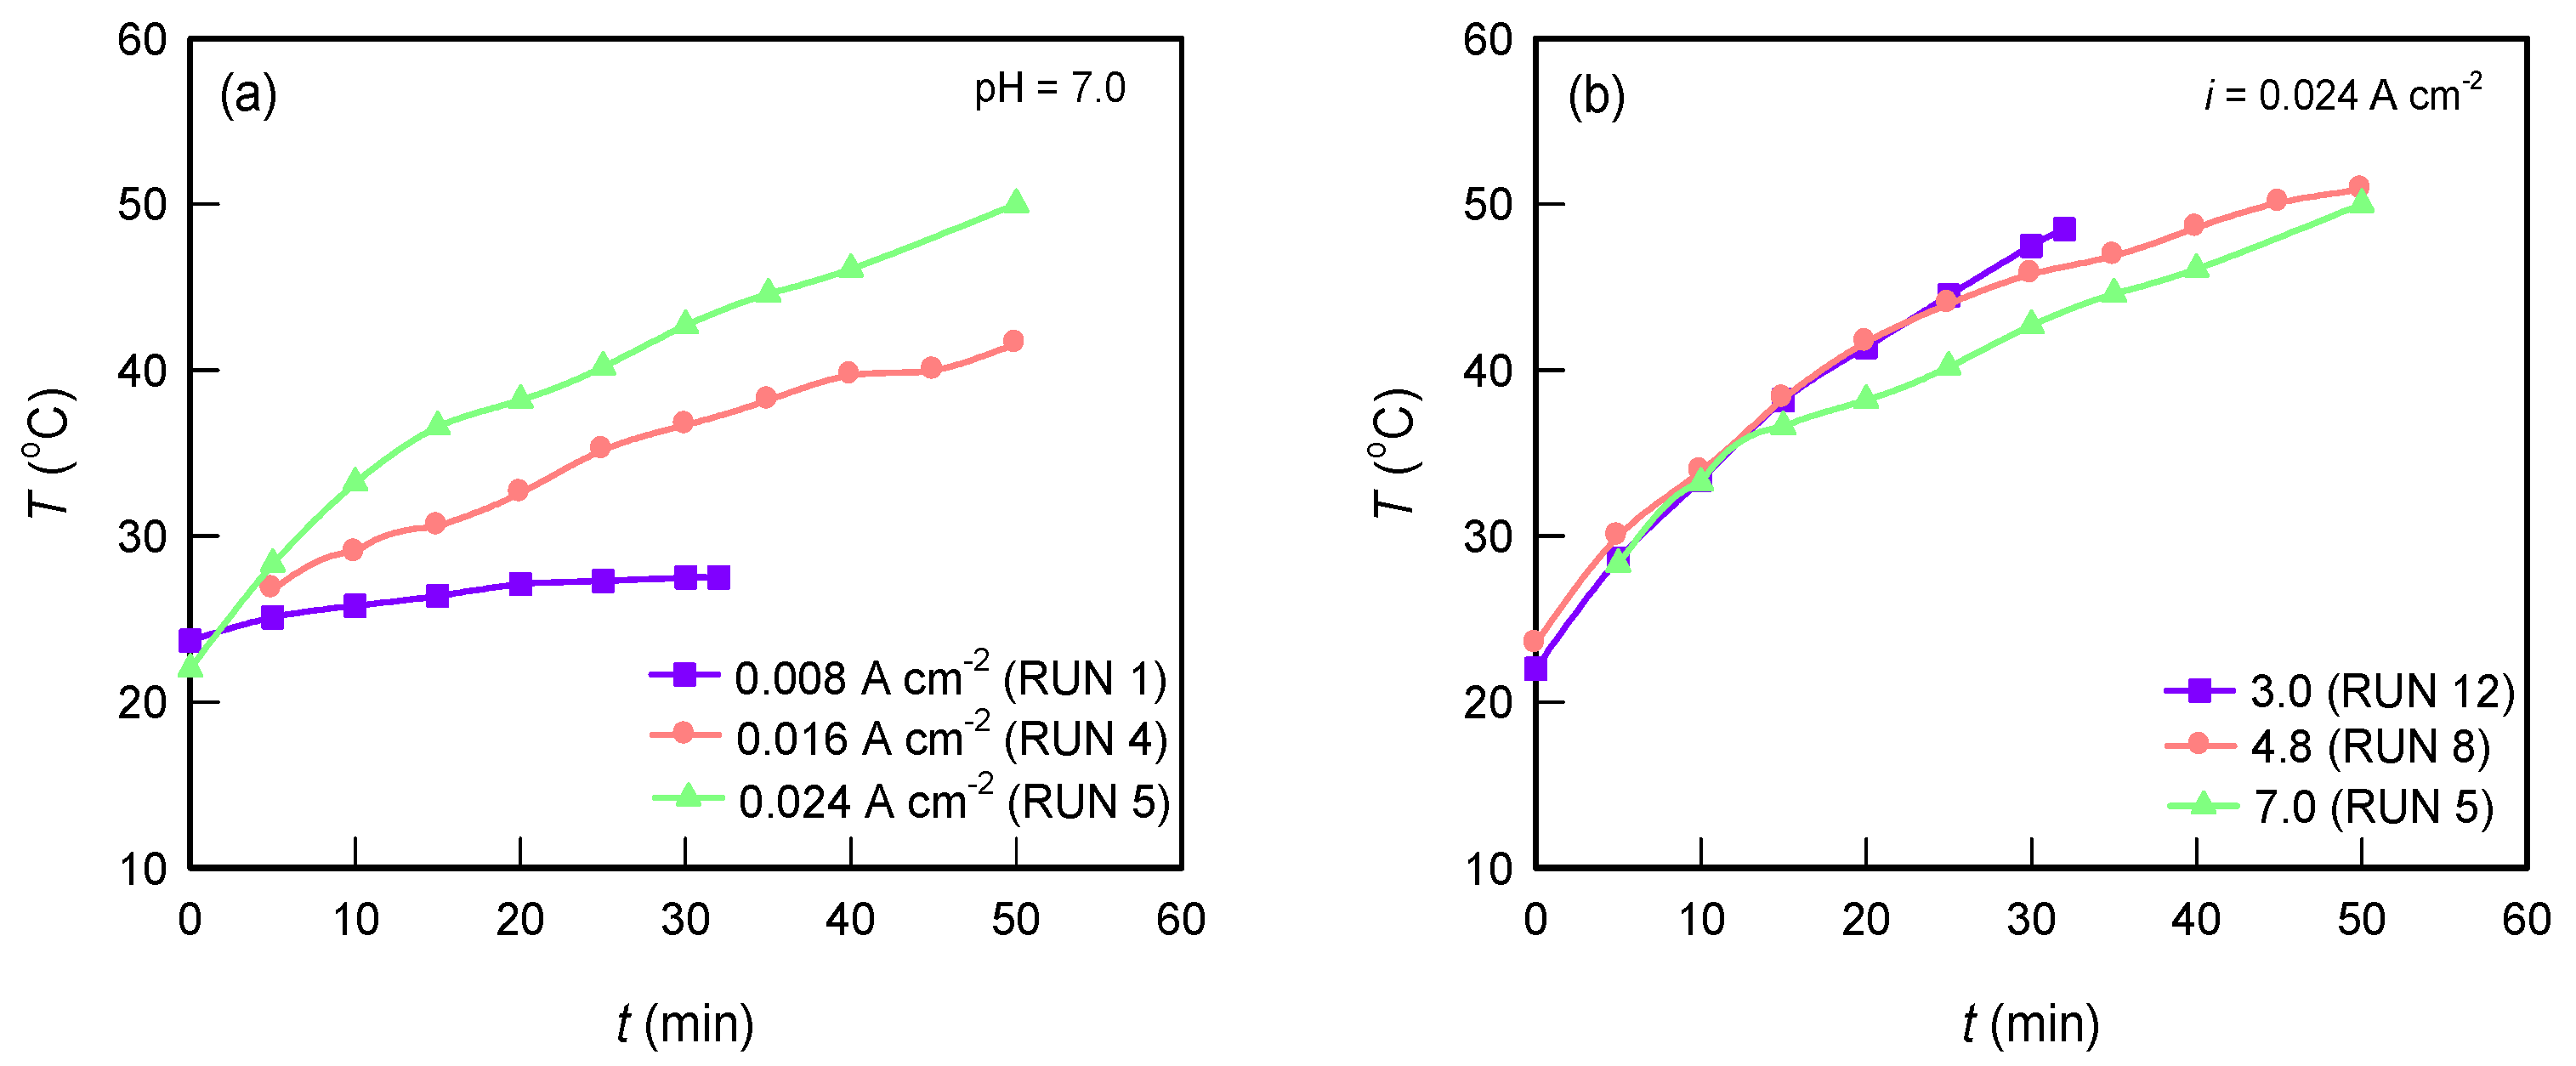
3.1.2. Temperature Change
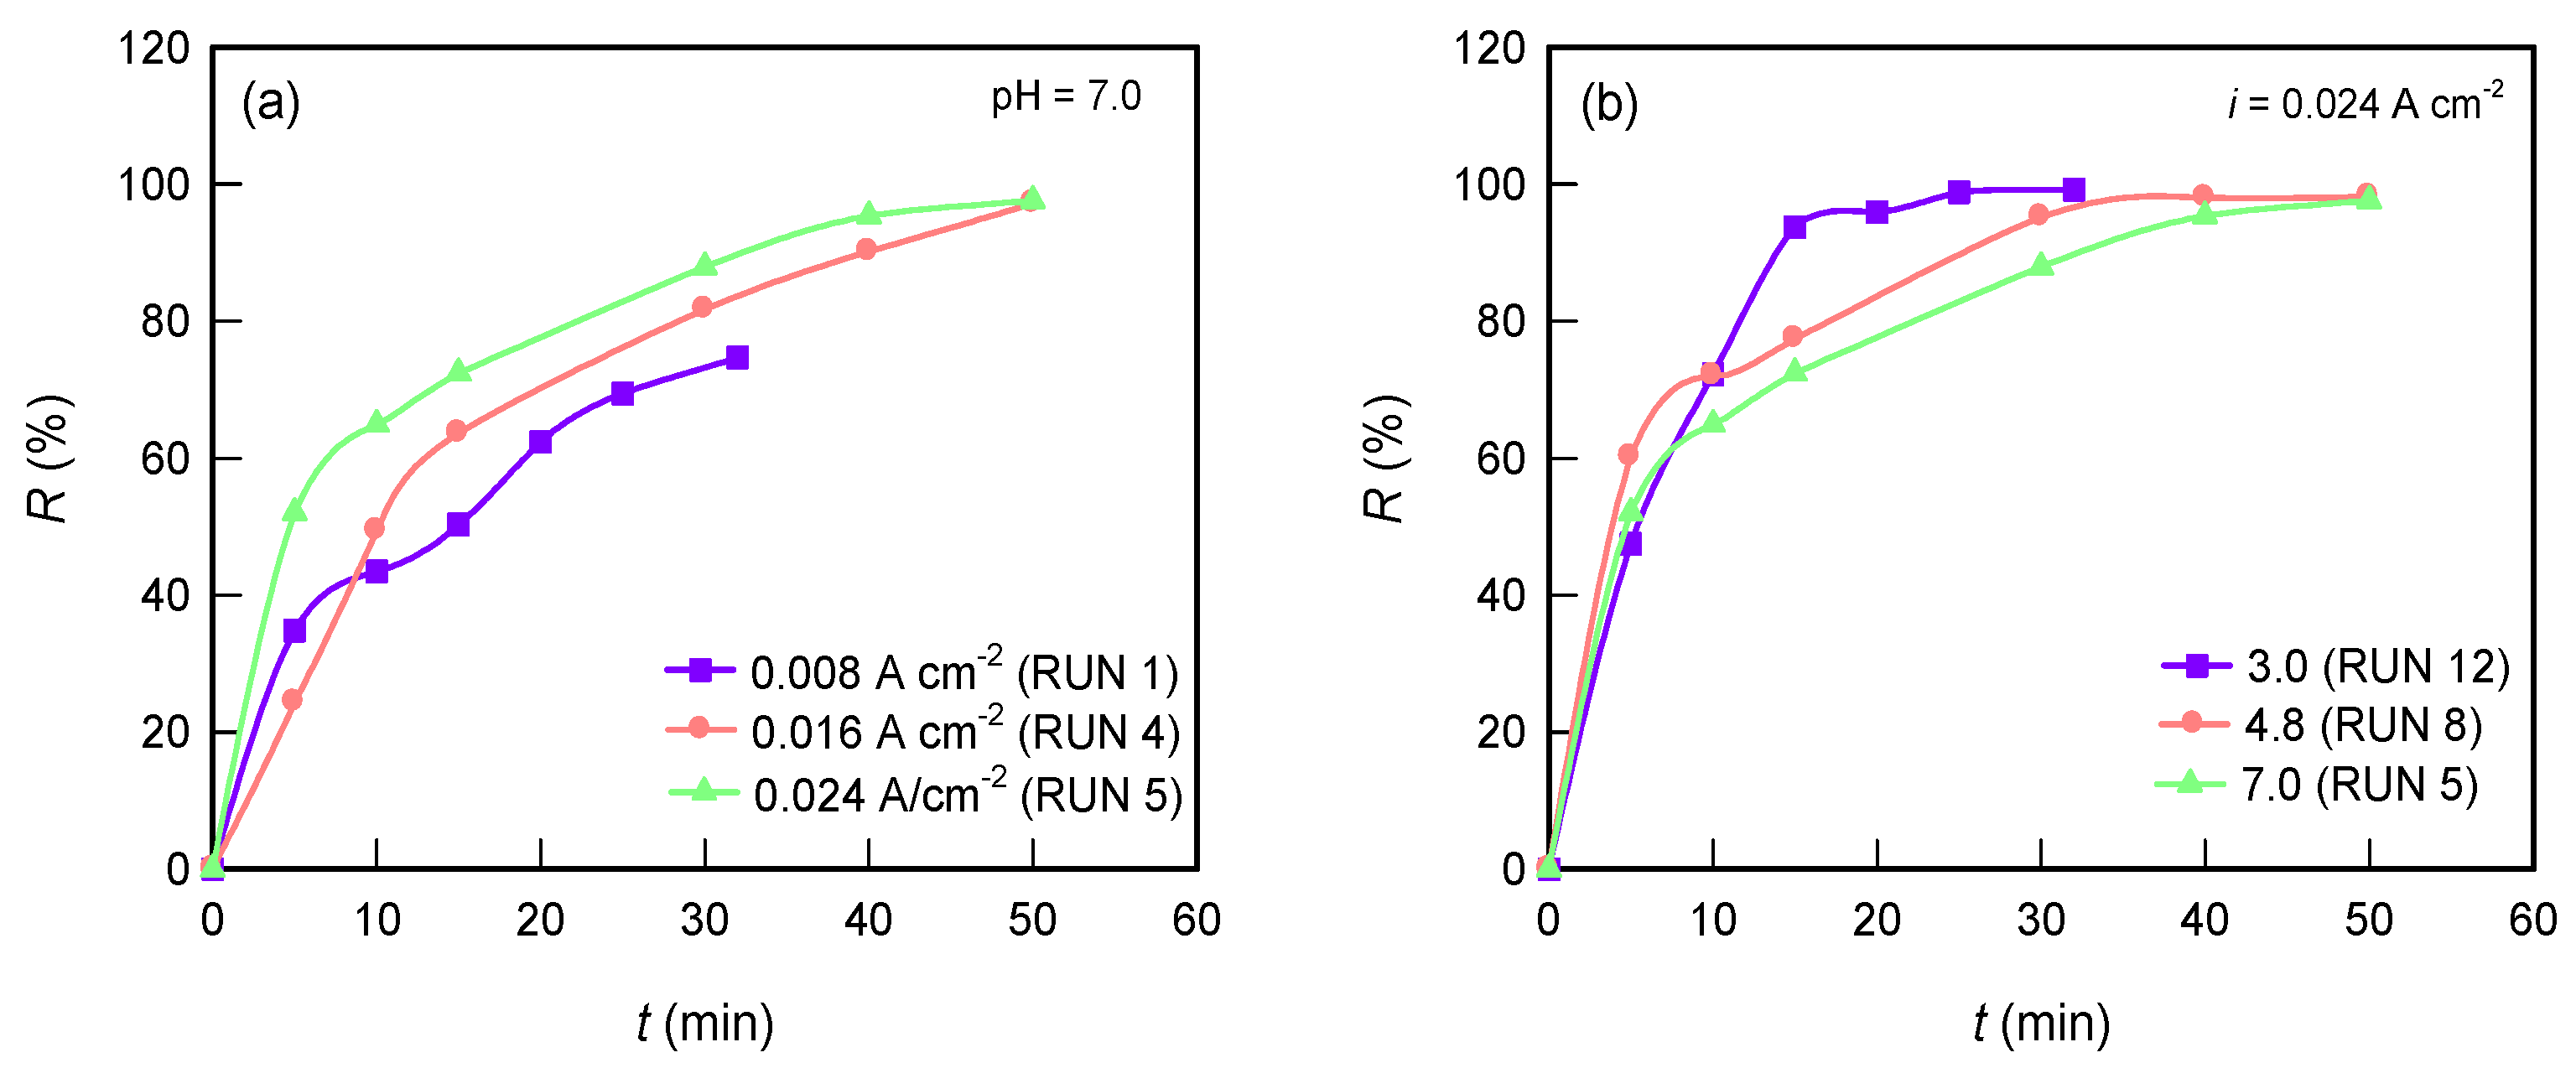
3.1.3. TY Dye Removal Efficiency
3.1.4. Three-Dimensional Representation of Process Parameter Changes
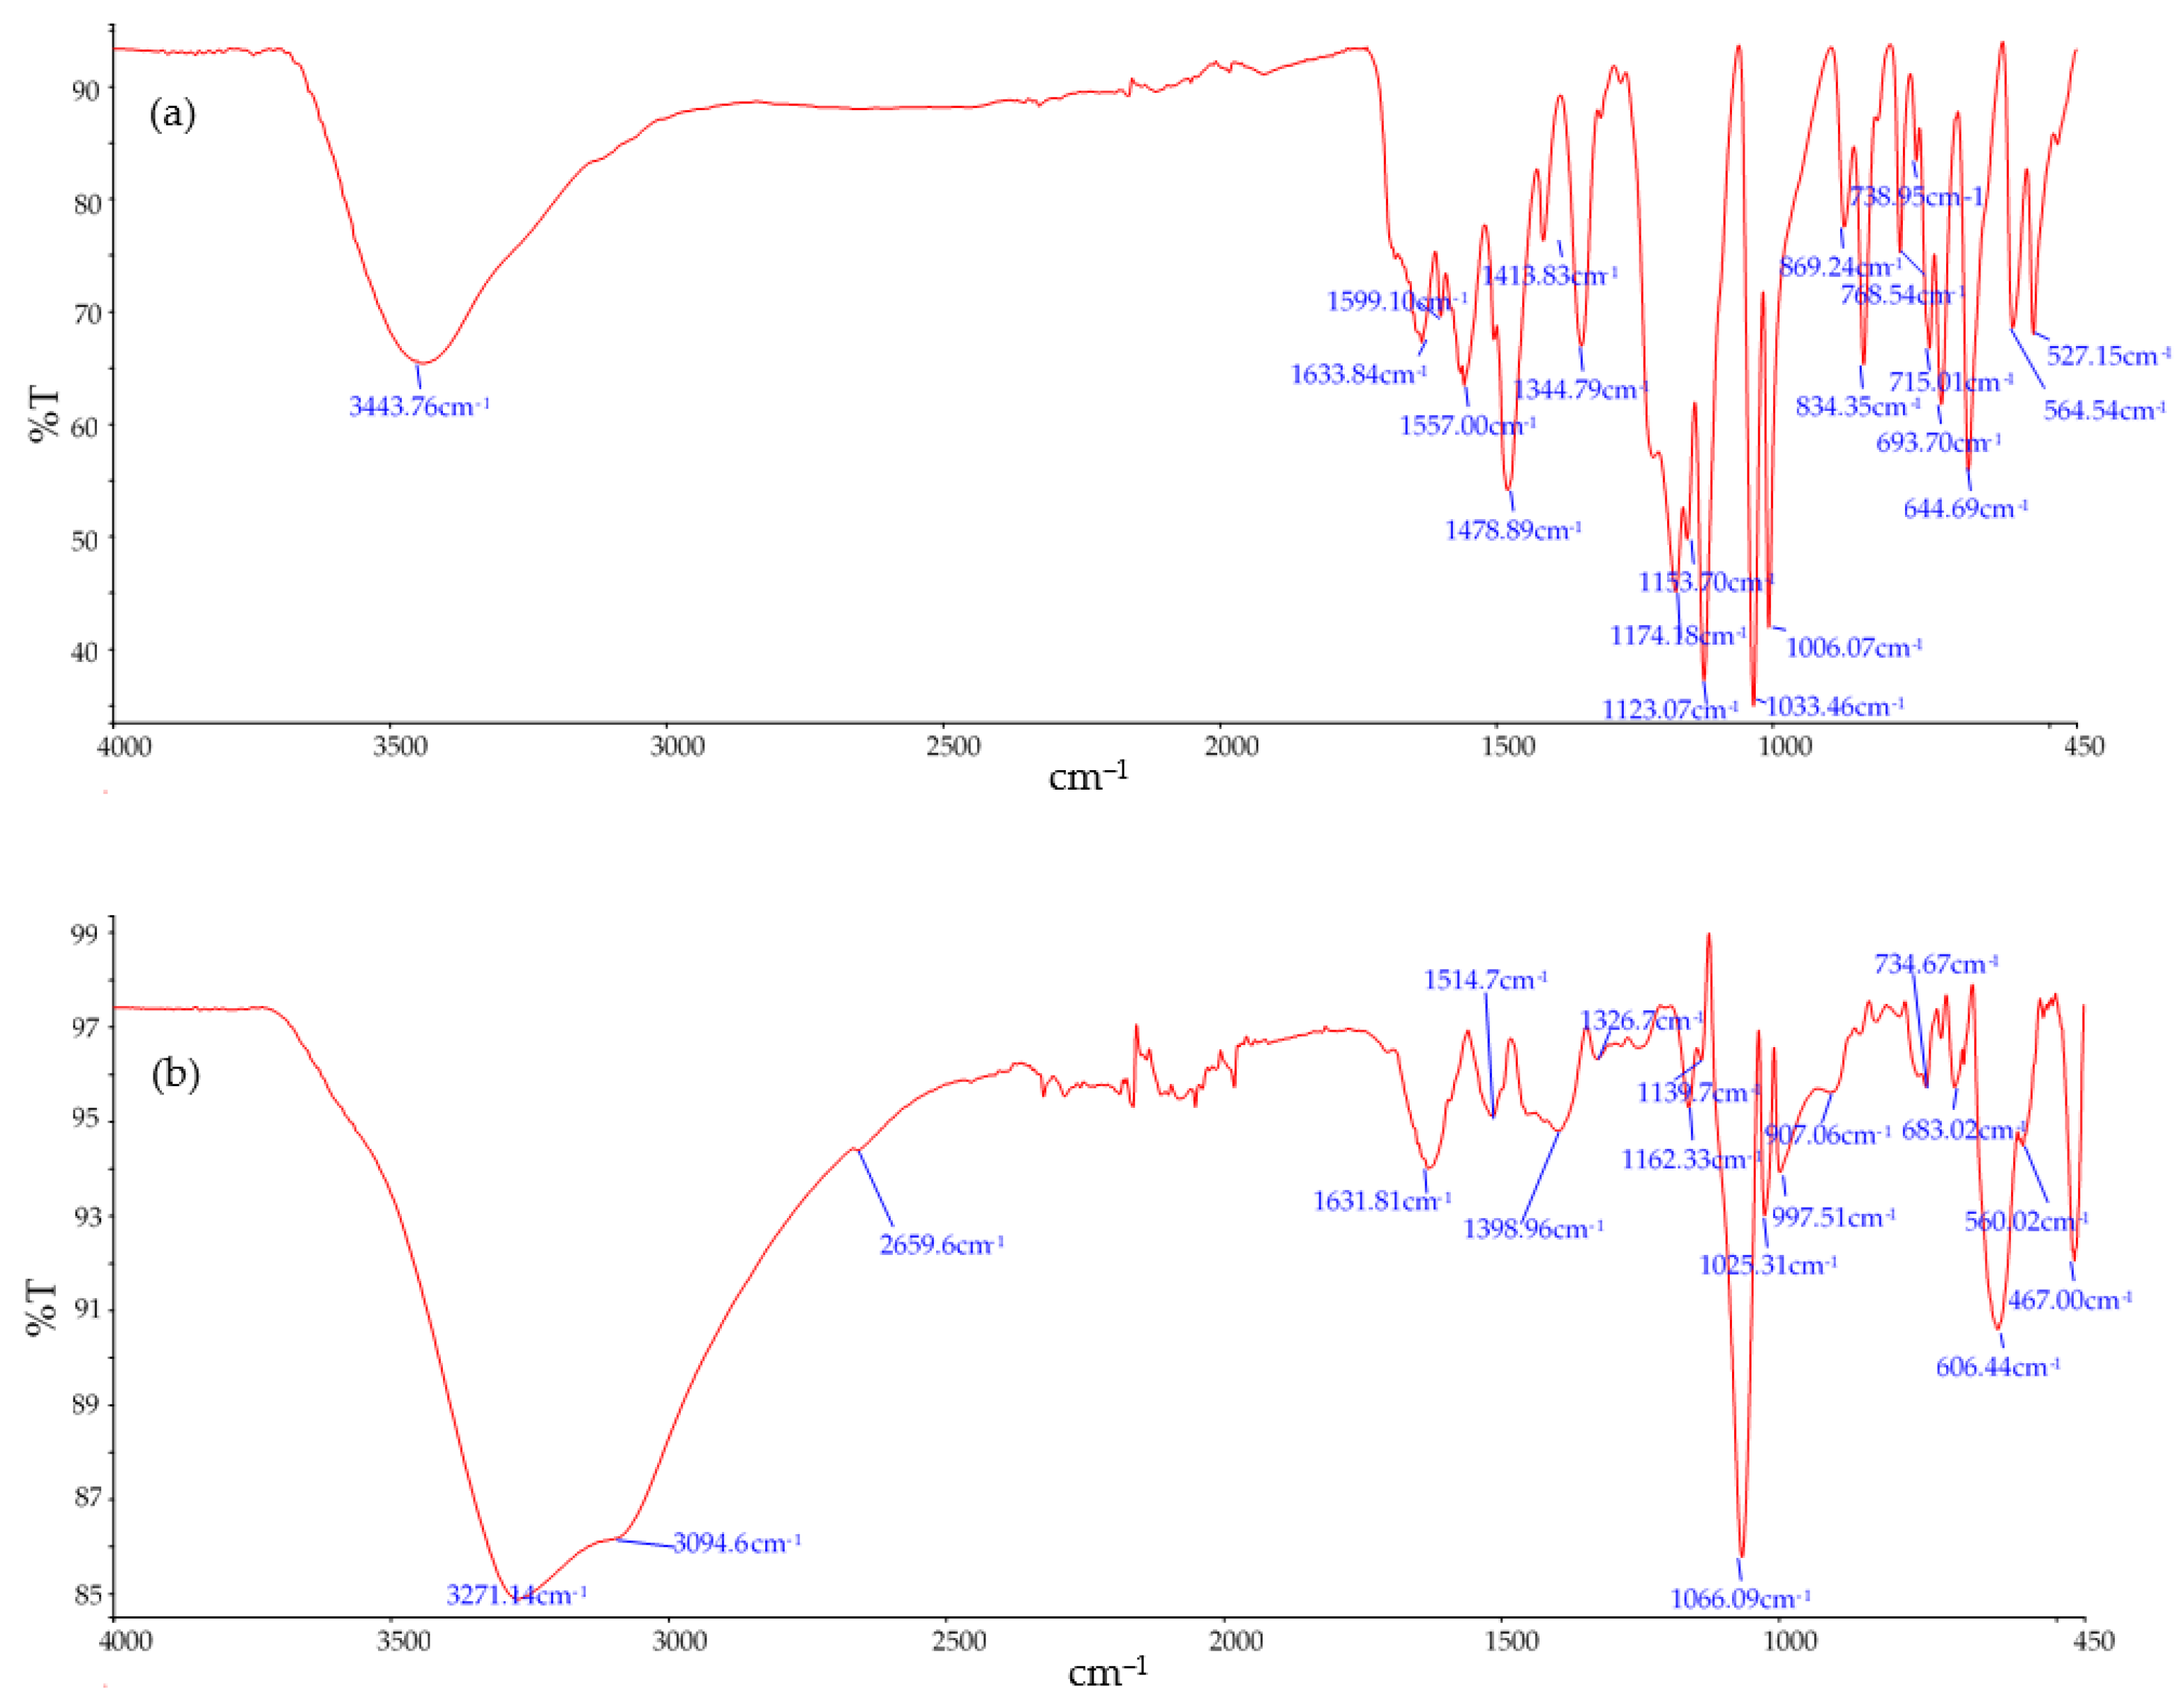
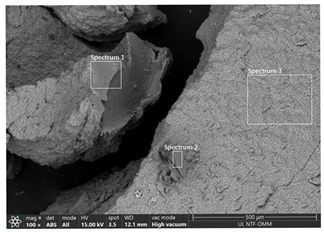
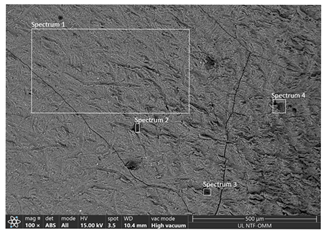
3.2. Anode Consumption and Sludge Characterisation
3.3. Mathematical Model Development
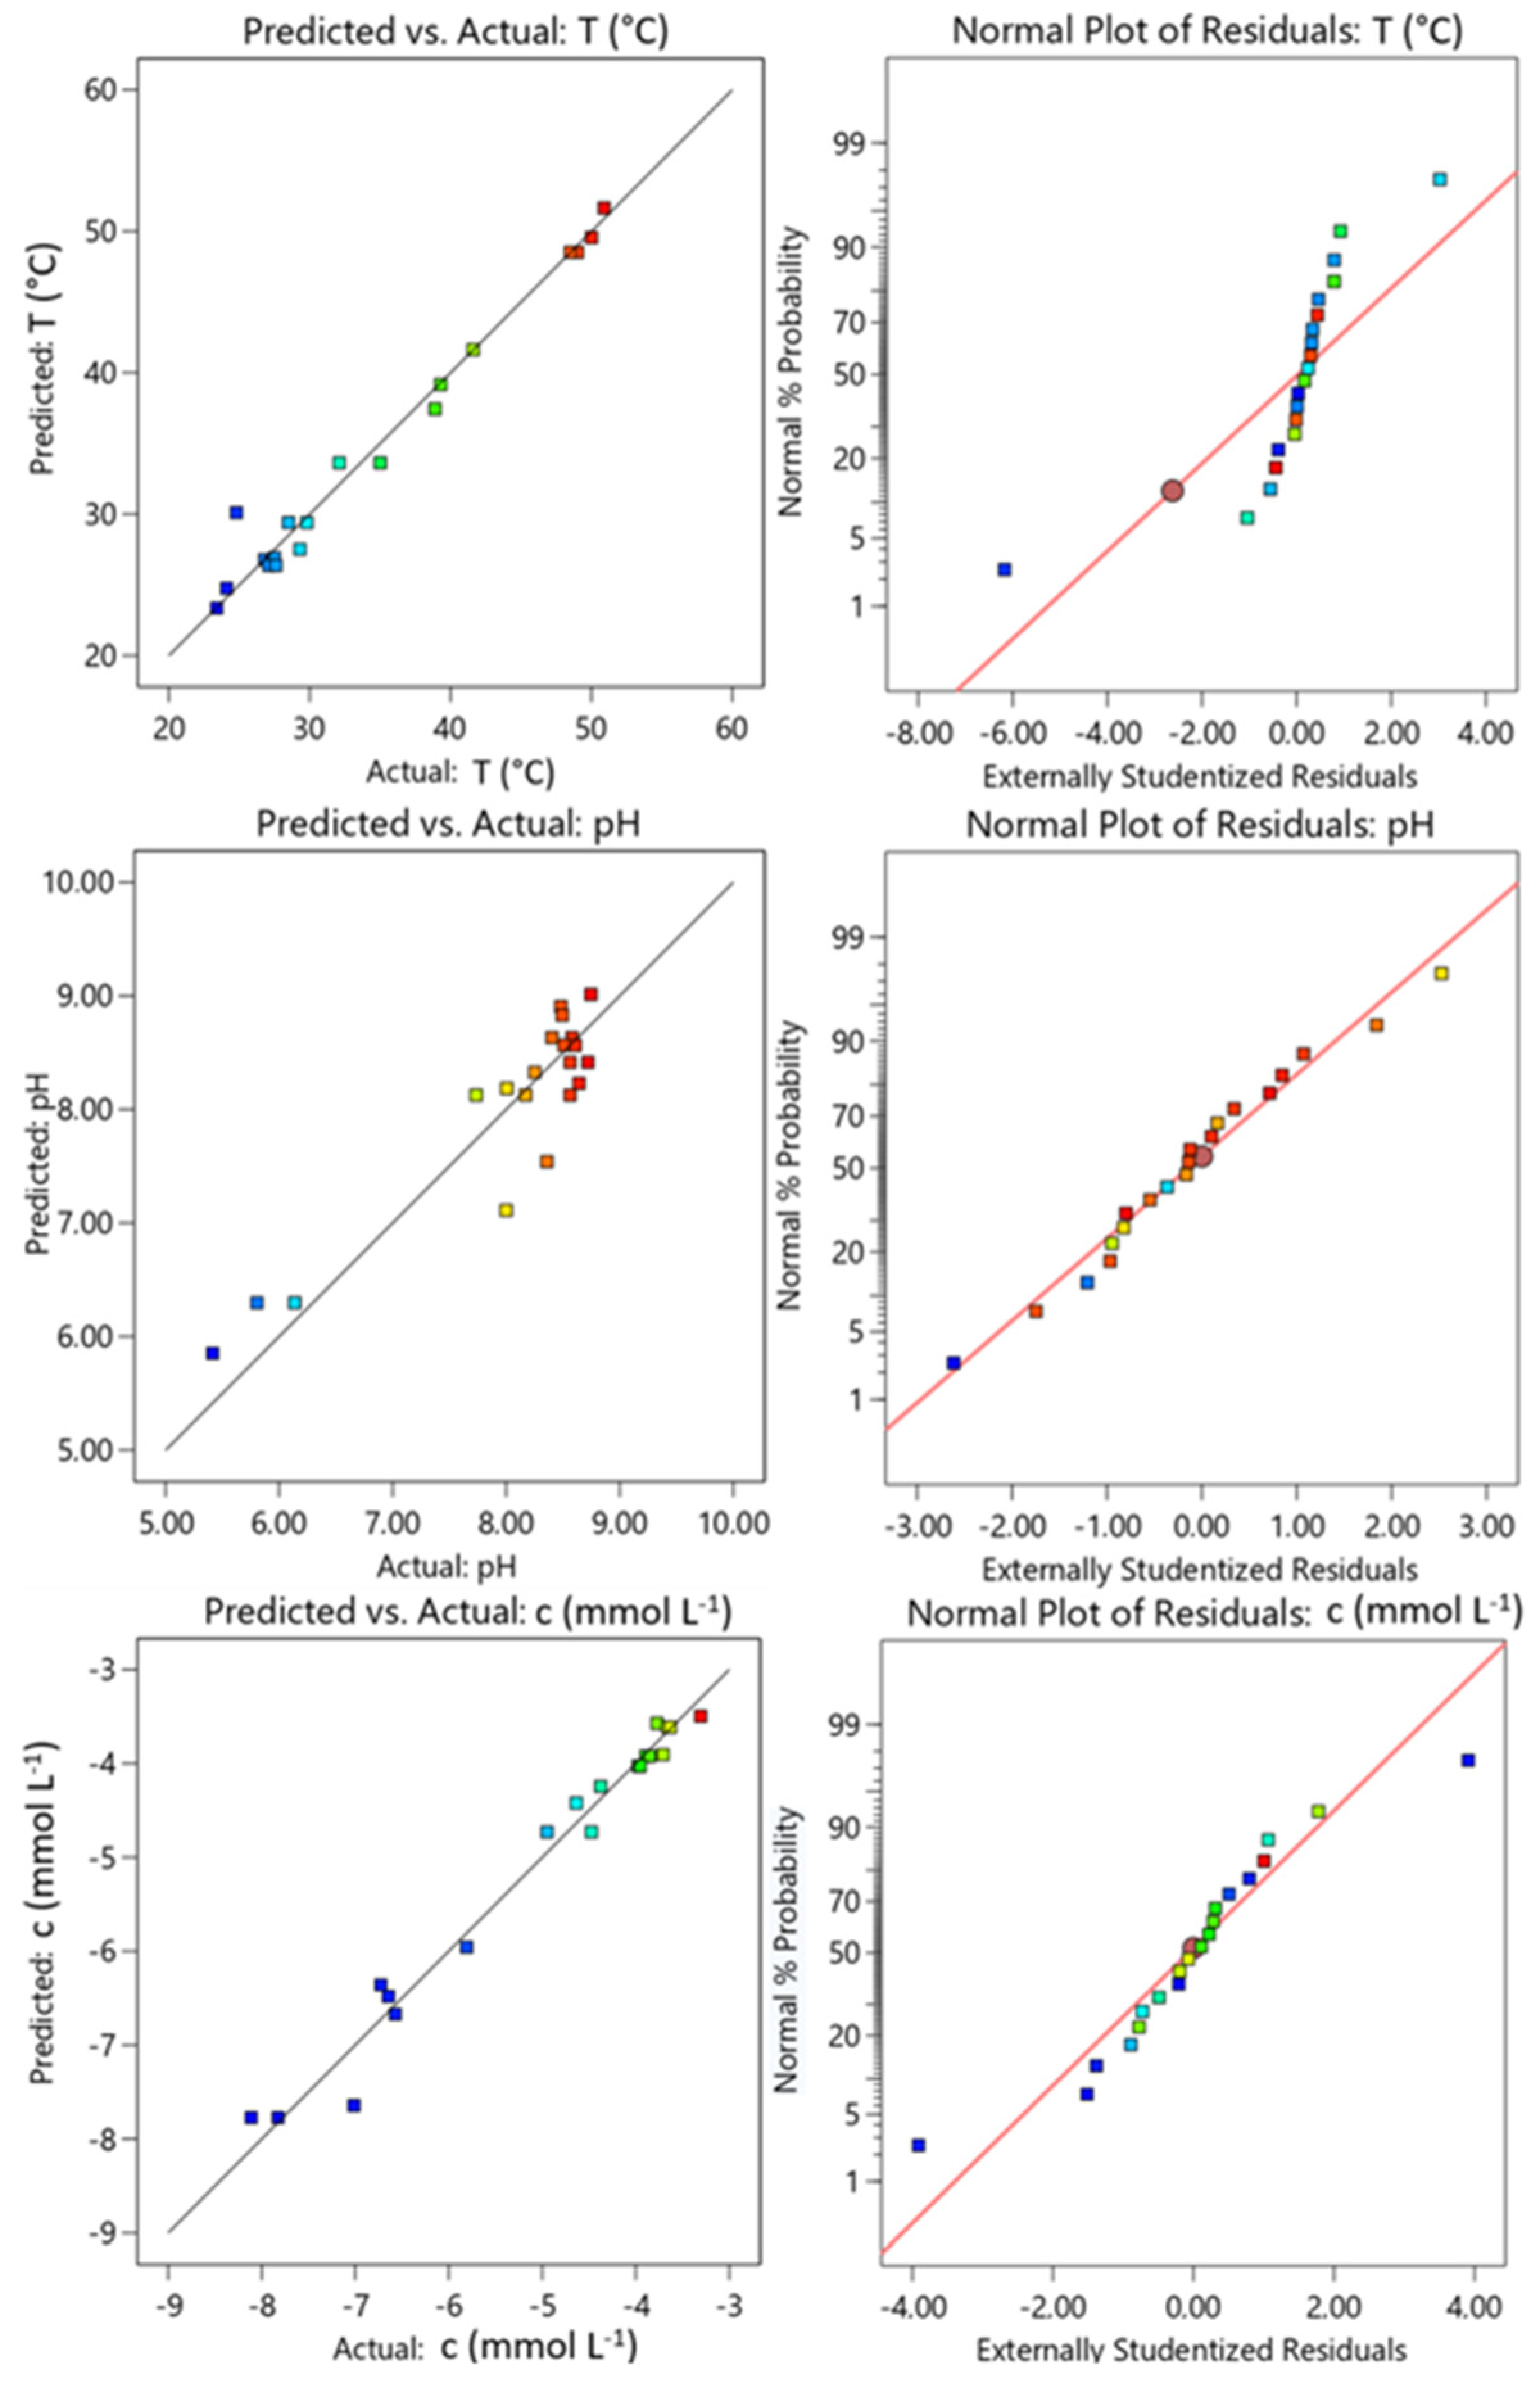
3.3.1. Diagnostic of Model Adequacy
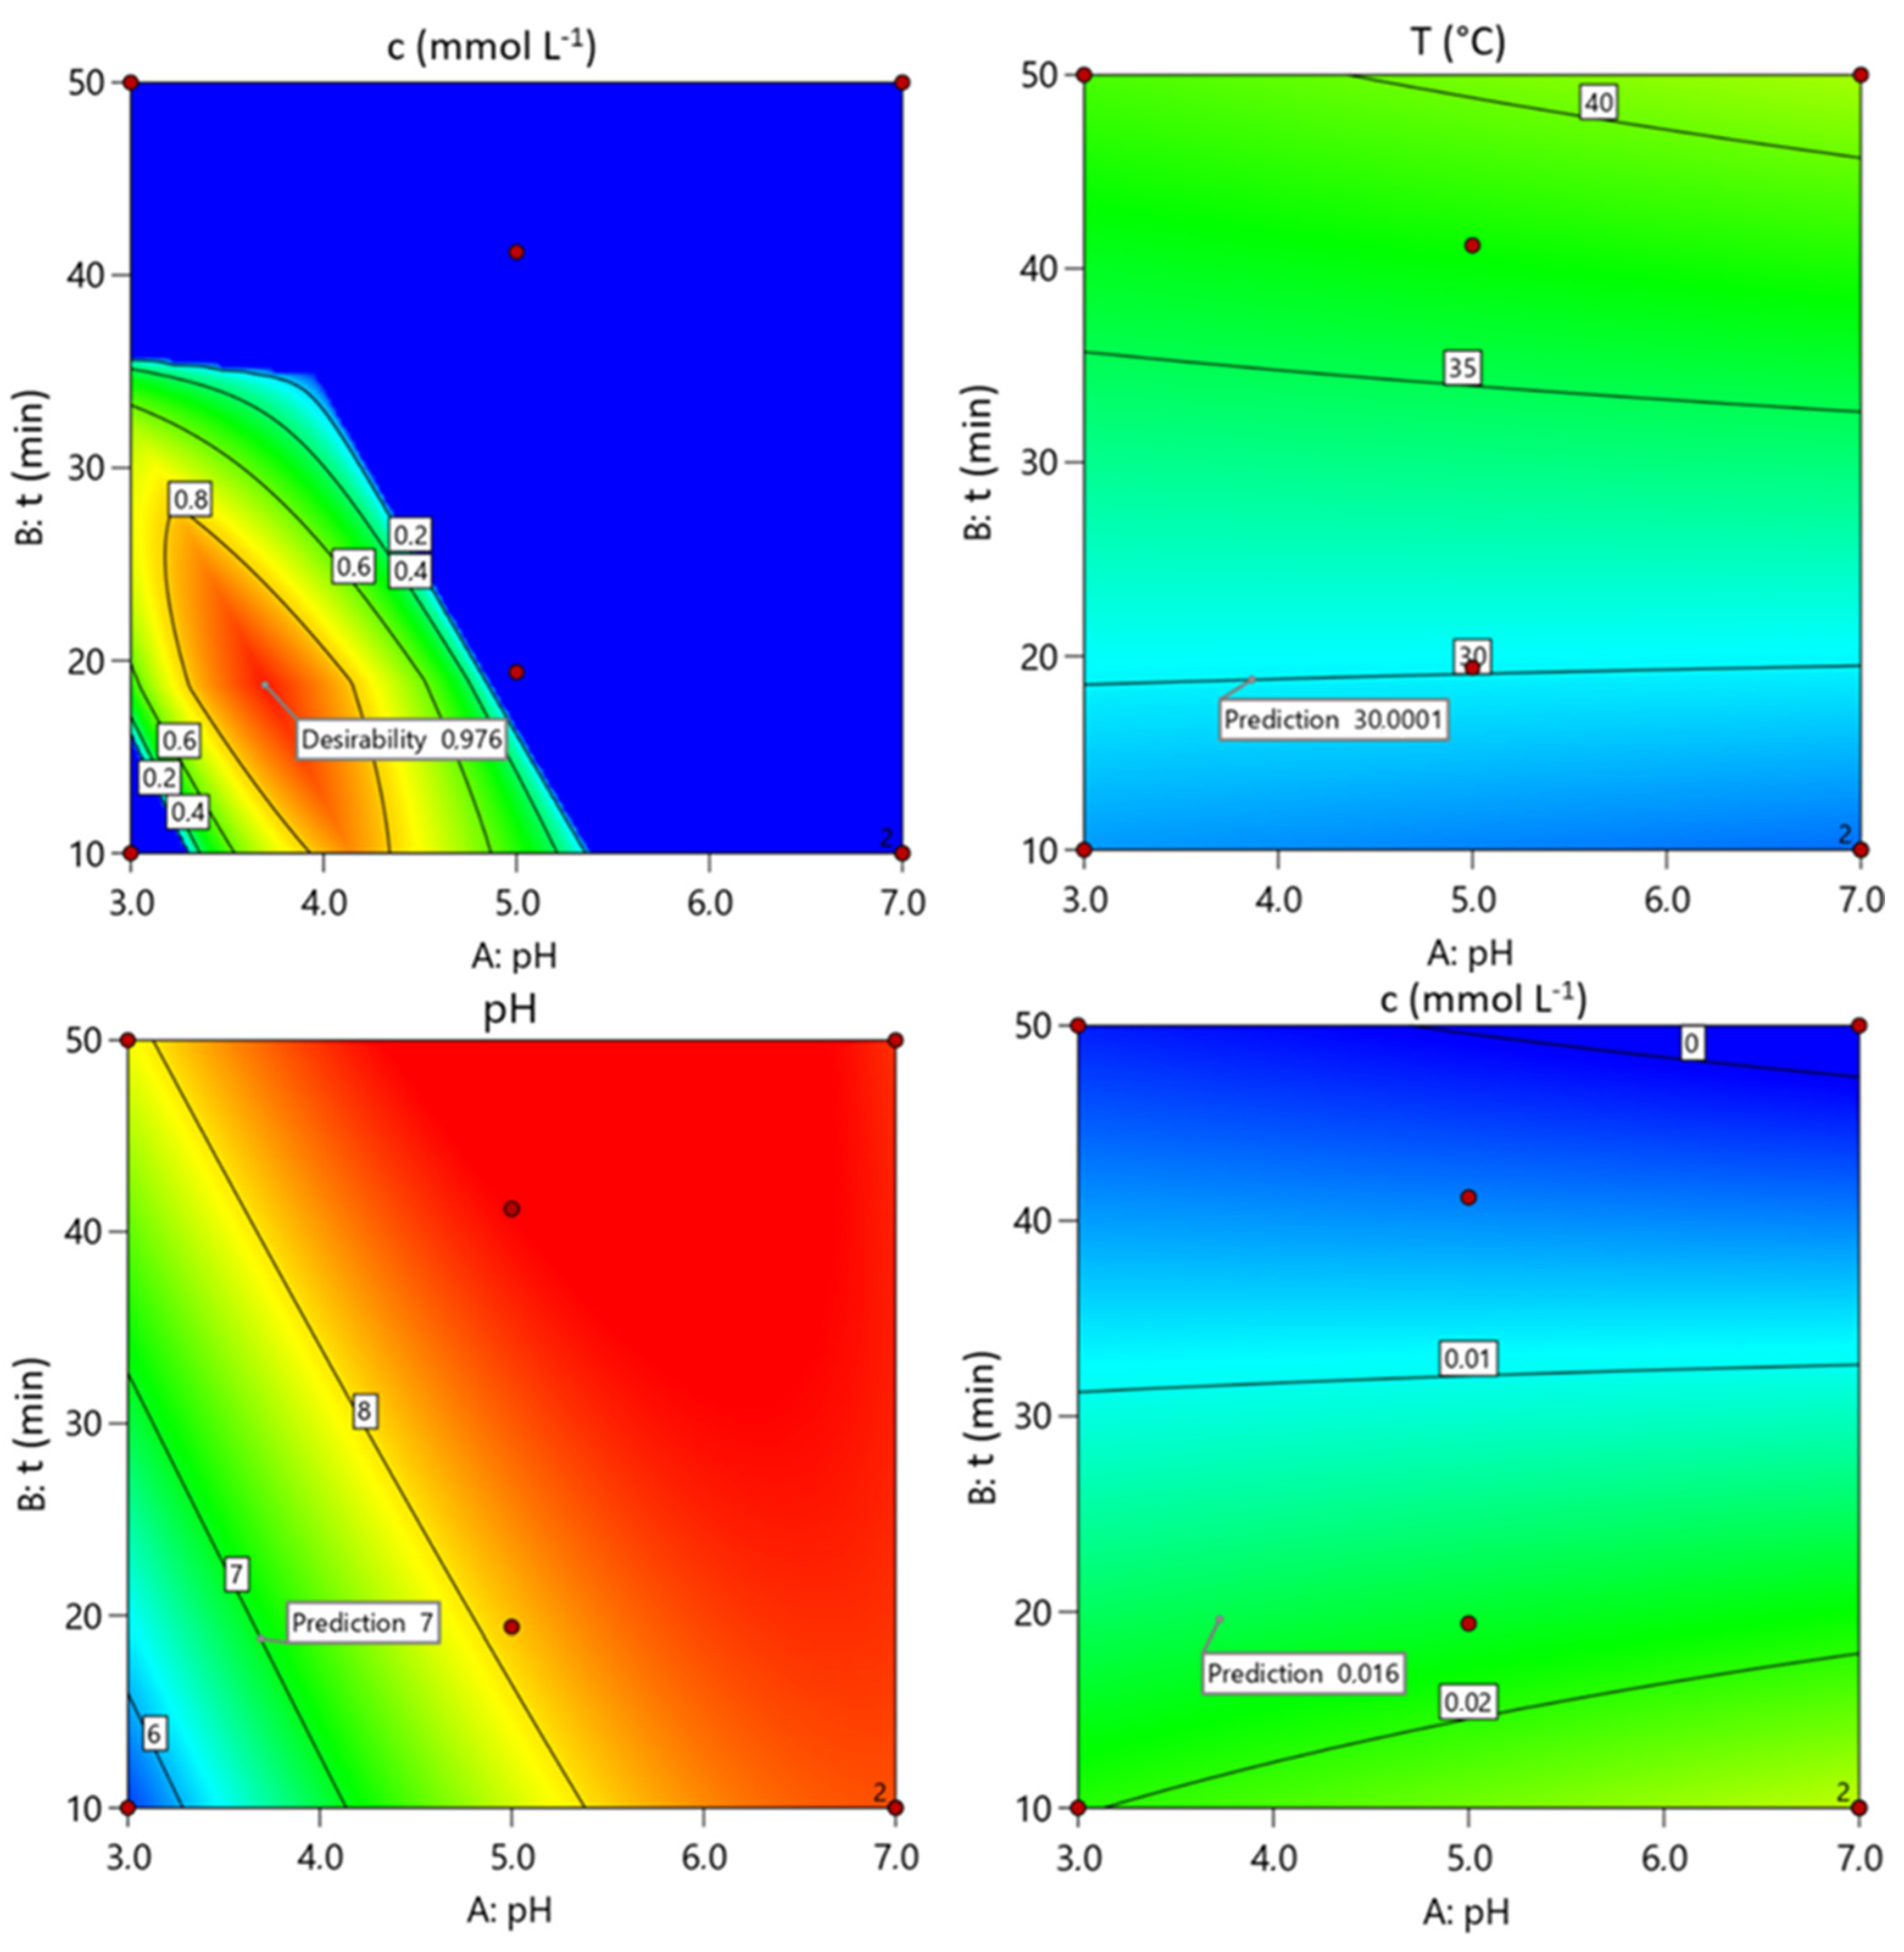
3.3.2. Optimisation and Authentication of Process Parameters and Responses
3.4. Operating Costs of the EC Process
4. Conclusions
Author Contributions
Funding
Institutional Review Board Statement
Informed Consent Statement
Data Availability Statement
Acknowledgments
Conflicts of Interest
References
- Mishra, D.P.; Sahu, P.K.; Acharya, B.; Mishra, S.P.; Bhati, S. A review of the synthesis and application of azo dyes and metal complexes for emerging antimicrobial therapies. Results Chem. 2024, 10, 101712. [Google Scholar] [CrossRef]
- Booth, G.; Zollinger, H.; McLaren, K.; Gibbard Sharples, W.; Westwell, A. Dyes, general survey. Ullmann’s Encyclopedia of Industrial Chemistry; Wiley-VCH Verlag GmbH & Co. KGaA: Weinheim, Germany, 2000. [Google Scholar]
- Rotaru, A.; Moanţă, A. Azoic dyes: From thermal properties to a wide range of applications. In Advanced Engineering Materials; Recent Developments for Medical, Technological and Industrial Applications; Academica Greifswald: Greifswald, Germany, 2016; Chapter 4; ISBN 978-3-940237-38-5. [Google Scholar]
- Banerjee, S.; Chattopadhyaya, M.C. Adsorption characteristics for the removal of a toxic dye, tartrazine from aqueous solutions by a low cost agricultural by-product. Arab. J. Chem. 2017, 10, S1629–S1638. [Google Scholar] [CrossRef]
- Leulescu, M.; Rotaru, A.; Pălărie, I.; Moanţă, A.; Cioateră, N.; Popescu, M.; Morîntale, E.; Bubulică, M.V.; Florian, G.; Hărăbor, A.; et al. Tartrazine: Physical, thermal and biophysical properties of the most widely employed synthetic yellow food-colouring azo dye. J. Therm. Anal. Calorim. 2018, 134, 209–231. [Google Scholar] [CrossRef]
- Leulescu, M.; Rotaru, A.; Moanţă, A.; Iacobescu, G.; Pălarie, I.; Cioateră, N.; Popescu, M.; Criveanu, M.C.; Morîntale, E.; Bojan, M.; et al. Azorubine: Physical, thermal and bioactive properties of the widely employed food, pharmaceutical and cosmetic red azo dye material. J. Therm. Anal. Calorim. 2021, 143, 3945–3967. [Google Scholar] [CrossRef]
- Leulescu, M.; Pălărie, I.; Rotaru, A.; Moanţă, A.; Cioateră, N.; Popescu, M.; Iacobescu, G.; Morîntale, E.; Bojan, M.; Ciocîlteu, M.; et al. Sunset Yellow: Physical, thermal and bioactive properties of the widely employed food, pharmaceutical and cosmetic orange azo-dye material. J. Therm. Anal. Calorim. 2023, 148, 1265–1287. [Google Scholar] [CrossRef]
- Villabona-Ortíz, A.; Tejada-Tovar, C.; Navarro-Romero, D. Evaluation of parameters in the removal of azo Red 40 dye using electrocoagulation. S. Afr. J. Chem. Eng. 2023, 46, 145–152. [Google Scholar] [CrossRef]
- Kazem-Rostami, M. Factors influencing the thermal stability of azo and bisazo compounds. J. Therm. Anal. Calorim. 2020, 140, 613–623. [Google Scholar] [CrossRef]
- Emanuele, L.; D’Auria, M. The Use of Heterocyclic Azo Dyes on Different Textile Materials: A Review. Organics 2024, 5, 277–289. [Google Scholar] [CrossRef]
- Alsantali, R.I.; Raja, Q.A.; Alzahrani, A.Y.A.; Sadiq, A.; Naeem, N.; Mughal, E.U.; Al-Rooqi, M.M.; El Guesmi, N.; Moussa, Z.; Ahmed, S.A. Miscellaneous azo dyes: A comprehensive review on recent advancements in biological and industrial applications. Dye. Pigment. 2022, 199, 110050. [Google Scholar] [CrossRef]
- Sharma, S.; Sharma, S.K.; Acharya, S.; Khandegar, V. Feasibility and sludge analysis of electrocoagulation process for Direct Violet-35 dye remediation. Waste Manag. Bull. 2024, 2, 171–180. [Google Scholar] [CrossRef]
- Yamamoto, A.; Eguchi, H.; Soda, S. Removal of Reactive Yellow 86 from Synthetic Wastewater in Lab-Scale Constructed Wetlands Planted with Cattail and Papyrus. Appl. Sci. 2024, 14, 6584. [Google Scholar] [CrossRef]
- Adu, J.K.; Amengor, C.D.K.; Mohammed Ibrahim, N.; Amaning-Danquah, C.; Owusu Ansah, C.; Gbadago, D.D.; Sarpong-Agyapong, J. Synthesis and In Vitro Antimicrobial and Anthelminthic Evaluation of Naphtholic and Phenolic Azo Dyes. J. Trop. Med. 2020, 2020, 4850492. [Google Scholar] [CrossRef] [PubMed]
- Walton, K.; Walker, R.; Sandt, J.J.M.; Castell, J.V.; Knapp, A.G.A.A.; Kozianowski, G.; Roberroid, M.; Schilter, B. The Application of In Vitro Data in the Derivation of the Acceptable Daily Intake of Food Additives. Food Chem. Toxicol. 1999, 37, 1175–1197. [Google Scholar] [CrossRef]
- Sajid, M.; Khan, M.S.; Ahmad, A.; Husain, F.M.; Al-Thabaiti, S.A.; Khan, M. Environmental risk assessment of tartrazine: A synthetic azo dye. Heliyon 2021, 7, e08454. [Google Scholar] [CrossRef]
- Silva, J.; Fracácio-Francisco, R. Ecotoxicity of Tartrazine Yellow Dye in Danio rerio Embryos and Larvae After Multigenerational Exposure. Water Air Soil Pollut. 2023, 234, 724. [Google Scholar] [CrossRef]
- Blümel, S.; Knackmuss, H.-J.; Stolz, A. Molecular Cloning and Characterization of the Gene Coding for the Aerobic Azoreductase from Xenophilus azovorans KF46F. Appl. Environ. Microbiol. 2002, 68, 3948–3955. [Google Scholar] [CrossRef]
- Ahlstrom, L.H.; Sparr Eskilsson, C.; Bjorklund, E. Determination of banned azo dyes in consumer goods. Trends Anal. Chem. 2005, 24, 49–56. [Google Scholar] [CrossRef]
- Golka, K.; Kopps, S.; Myslak, Z.W. Carcinogenicity of azo colorants: Influence of solubility and bioavailability. Toxicol. Lett. 2004, 151, 203–210. [Google Scholar] [CrossRef]
- Puvaneswari, M.; Muthukrishnan, J.; Gunasekaran, P. Toxicity Assessment and Microbial Degradation of Azo Dyes. Indian J. Exp. Biol. 2006, 44, 618–626. [Google Scholar]
- Lima, R.O.A.; Bazo, A.P.; Salvadori, D.M.F.; Rech, C.M.; Oliveira, D.P.; Umbuzeiro, G.A. Mutagenic and Carcinogenic Potential of a Textile Azo Dye Processing Plant Effluent that Impacts a Drinking Water Source. Mutat. Res. Genet. Toxicol. Environ. Mutagen. 2007, 626, 53–60. [Google Scholar] [CrossRef]
- Hunger, K. Toxicology and Toxicological Testing of Colorants. Rev. Prog. Color. Relat. Top. 2005, 35, 76–89. [Google Scholar] [CrossRef]
- Yu, L.; Lv, X.; Zhang, Y.; Xin, Q.; Zou, Y.; Li, X. Tartrazine exposure results in histological damage, oxidative stress, immune disorders and gut microbiota dysbiosis in juvenile crucian carp (Carassius Carassius). Aquat. Toxicol. 2001, 241, 105998. [Google Scholar] [CrossRef]
- Order, E.H.; Buckley, E. Aspirin, Salicylate sulphite and tartrazine induced bronchoconstriction, safe doses and case definition in epidemiological studies. J. Clin. Epidemiol. 1995, 48, 1269–1275. [Google Scholar] [CrossRef]
- Khayyat, L.; Essawy, A.; Sorour, J.; Soffar, A. Tartrazine induces structural and functional aberrations and genotoxic effects in vivo. PeerJ 2017, 5, e3041. [Google Scholar] [CrossRef]
- Gultekin, F.; Dogue, K.D. Allergic and immunologic reactions to food additives. Clinic. Rev. Allerg. Immunol. 2012, 45, 6–26. [Google Scholar] [CrossRef]
- Hegazy, A.A.; Abdel Haliem, W.A.H.R.; El-Bestawy, E.M.; Ali, G.M.E. Brief overview about tartrazine effects on health. Eur. Chem. Bull. 2023, 12, 4698–4707. [Google Scholar]
- Elhkim, M.O.; Héraud, F.; Bemrah, N.; Gauchard, F.; Lorino, T.; Lambré, C.; Frémy, J.M.; Poul, J.M. New considerations regarding the risk assessment on Tartrazine: An update toxicological assessment, intolerance reactions and maximum theoretical daily intake in France. Regul. Toxicol. Pharmacol. 2007, 47, 308–316. [Google Scholar] [CrossRef]
- Miller, D.M.; Steinmaus, C.; Golub, M.S.; Castorina, R.; Thilakartne, R.; Bradman, A.; Marty, A.A. Potential impacts on synthetic food dyes on activity and attention in children: A review of the human and animal evidence. Environ. Health 2022, 21, 45. [Google Scholar] [CrossRef]
- Dos Santos, C.A.; Silva, G.B.; de Araujo, R.F.; da Silva, M.F.S.; de Souza, R.L.; de Souza, A.A. Behavioral and biochemical effects of tartrazine on rats: A pharmacological and toxicological evaluation. BMC Pharmacol. Toxicol. 2022, 23, 95. [Google Scholar] [CrossRef]
- Gopalakrishnan, G.; Jeyakumar, R.B.; Somanathan, A. Challenges and Emerging Trends in Advanced Oxidation Technologies and Integration of Advanced Oxidation Processes with Biological Processes for Wastewater Treatment. Sustainability 2023, 15, 4235. [Google Scholar] [CrossRef]
- Ziembowicz, S.; Kida, M. The Optimization of Advanced Oxidation Processes for the Degradation of Industrial Pollutants. Sustainability 2025, 17, 1908. [Google Scholar] [CrossRef]
- Pieczyńska, A.; Ossowski, T.; Bogdanowicz, R.; Siedlecka, E. Electrochemical degradation of textile dyes in a fow reactor: Efect of operating conditions and dyes chemical structure. Int. J. Environ. Sci. Technol. 2019, 16, 929–942. [Google Scholar] [CrossRef]
- Zhu, X.P.; Tong, M.; Shaoyuan, S.; Zhao, H.; Ni, J. Essential Explanation of the Strong Mineralization Performance of Boron-Doped Diamond Electrodes. Environ. Sci. Technol. 2008, 42, 4914–4920. [Google Scholar] [CrossRef]
- Machado, K.M.G.; Matheus, D.R.; Bononi, V.L.R. Ligninolytic Enzymes Production and Remazol Brilliant Blue R Decolorization by Tropical Brazilian Basidiomycetes Fungi. Braz. J. Microbiol. 2005, 36, 246–252. [Google Scholar] [CrossRef]
- Anyanwu, J.O.; Oguzie, K.L.; Ogbulie, T.E.; Akalezi, C.O.; Oguzie, E.E. Electrochemical and Microbial Treatment of Bromophenol Blue Dye in Aqueous Solution. J. Electrochem. Sci. Eng. 2023, 13, 1063–1080. [Google Scholar] [CrossRef]
- Perez-D, I.M.; McFeeters, R.F. Modification of azo dyes by lactic acid bacteria. J. Appl. Microbiol. 2009, 107, 584–589. [Google Scholar] [CrossRef]
- Kamarudin, W.F.; Rahman, M.N.A.; Rahamat, N.B.; Irwan, Z.; Yaafar, M.R. Microbial Degradation of Food Dye by Pseudomonas aeruginosa. AIP Conf. Proc. 2022, 2454, 050029. [Google Scholar] [CrossRef]
- Sharma, G.; Kumar, A.; Naushad, M.; Stadler, F.J.; Ghfar, A.A.; Alfadul, S.M.; Ahamad, T. A Critical Review on Recent Developments in the Low-Cost Adsorption of Dyes from Wastewater. Desalination Water Treat. 2019, 172, 395–416. [Google Scholar] [CrossRef]
- Samhaber, W.M.; Nguyen, M.T. Applicability and costs of nanofiltration in combination with photocatalysis for the treatment of dye house effluents. Beilstein J. Nanotechnol. 2014, 5, 476–484. [Google Scholar] [CrossRef]
- Wei, M.-C.; Wang, K.-S.; Huang, C.-L.; Chiang, C.-W.; Chang, T.-J.; Lee, S.-S.; Chang, S.-H. Improvement of textile dye removal by electrocoagulation with low cost-steel wool cathode reactor. Chem. Eng. J. 2012, 192, 37–44. [Google Scholar] [CrossRef]
- Medvidović, N.V.; Vrsalović, L.; Svilović, S.; Bilušić, A.; Jozić, D. Electrocoagulation treatment of compost leachate using aluminium alloy, carbon steel and zinc anode. Appl. Surf. Sci. Adv. 2023, 15, 100404. [Google Scholar] [CrossRef]
- Vrsalovic, L.; Čatipović, N.; Gudić, S.; Kožuh, S. Beneficial effect of Cu content and austempering parameters on the hardness and corrosion properties of austempered ductile iron. Facta Univ. Ser. Mech. Eng. 2025, 23, 33–47. [Google Scholar] [CrossRef]
- Suhartana, U. The effectiveness of anode variations for electrocoagulation and its application for laundry wastewater treatment. J. Phys. Conf. Ser. 2021, 1943, 012182. [Google Scholar] [CrossRef]
- Meetiyagoda, T.A.O.K.; Fujino, T. Comparison of different anode materials to remove microcystis aeruginosa cells using electrocoagulation-flotation process at low current inputs. Water 2020, 12, 3528. [Google Scholar] [CrossRef]
- Mollah, M.Y.A.; Schennach, R.; Parga, J.R.; Cocke, D.L. Electrocoagulation (EC)—Science and applications. J. Hazard. Mater. 2001, B84, 29–41. [Google Scholar] [CrossRef]
- Chen, G. Electrochemical technologies in wastewater treatment. Sep. Purif. Technol. 2004, 38, 11–41. [Google Scholar] [CrossRef]
- Holt, P.K.; Barton, G.W.; Mitchell, C.A. The future for electrocoagulation as a localized water treatment technology. Chemosphere 2005, 59, 355–367. [Google Scholar] [CrossRef]
- Vasudevan, S.; Oturan, M.A. Electrochemistry: As cause and cure in water pollution—An overview. Environ. Chem. Lett. 2014, 12, 97–108. [Google Scholar] [CrossRef]
- Gudić, S.; Vrsalović, L.; Vukojević Medvidović, N.; Svilović, S.; Ivančić, S. Removal of Crystal Violet dye by electrocoagulation—Analysis of electrode and solution changes. Kem. Ind. 2024, 73, 109–117. [Google Scholar] [CrossRef]
- Lach, C.E.; Pauli, C.S.; Coan, A.S.; Simionatto, E.L.; Koslowski, L.A.D. Investigating the process of electrocoagulation in the removal of azo dye from synthetic textile effluents and the effects of acute toxicity on Daphinia magna test organisms. J. Water Process. Eng. 2022, 45, 102485. [Google Scholar] [CrossRef]
- Ghernaoult, D.; Al-Ghonamy, A.I.; Naceur, W.M.; Messaoudene, A.; Aichouni, M. Influence of operating parameters on electrocoagulation of C.I. disperse yellow 3. J. Electrochem. Sci. Eng. 2014, 4, 271–283. [Google Scholar] [CrossRef]
- Modirshahla, N.; Behnajady, M.A.; Kooshaiian, S. Investigation of the Effect of Different Electrode Connections on the Removal Efficiency of Tartrazine from Aqueous Solutions by Electrocoagulation. Dye. Pigment. 2007, 74, 249–257. [Google Scholar] [CrossRef]
- Tahir, H.; Rauf, A. Electrochemical Treatment of Synthetic Wastewater Containing Azo Dye: Tartrazine. Int. J. Environ. Sci. Manag. Eng. Res. 2014, 3, 18–30. [Google Scholar]
- Zhian, H.; Noroozi Pesyan, N. Investigating Changes in the Physical and Chemical Effects of Tartarazine Dye Remove on Industrial Wastewater by Electrocoagulation Method. Iran. J. Chem. Chem. Eng. 2021, 40, 123–132. [Google Scholar] [CrossRef]
- Husein, S.; Slamet; Dewi, E.L. The Impact of Sodium Chloride (NaCl) Concentrations on Electrocoagulation for Simultaneous Tartrazine Dye Removal and Hydrogen Production. Eng. Proc. 2024, 67, 4. [Google Scholar] [CrossRef]
- Weiss, S.F.; Christensen, M.L.; Jorgensen, M.K. Mechanisms Behind pH Changes during Electrocoagulation. AIChE J. 2021, 67, e17384. [Google Scholar] [CrossRef]
- Mansouri, K.; Ibrik, K.; Bansalah, N.; Abdel-Wahab, A. Anodic Dissolution of Pure Aluminium during Electrocoagulation Process: Influence of Supporting Electrolyte, Initial pH, and Current Density. Ind. Eng. Chem. Res. 2011, 50, 13362–13372. [Google Scholar] [CrossRef]
- Ingelsson, M.; Yasti, N.; Roberts, E.P.L. Electrode Passivation, Faradaic Efficiency, and Performance Enhancement Strategies in Electrocoagulation: A Review. Water Res. 2020, 187, 116433. [Google Scholar] [CrossRef]
- Bharath, M.; Krishna, B.M.; Kumar, B.M. A Review of Electrocoagulation Process for Wastewater Treatment. Int. J. Chem. Tech. Res. 2018, 11, 289–302. [Google Scholar] [CrossRef]
- Mouedhen, G.; Feki, M.; De Petris Wery, M.; Ayedi, H.F. Behavior of aluminum electrodes in electrocoagulation process. J. Hazard. Mater. 2008, 150, 124–135. [Google Scholar] [CrossRef]
- Chen, G.; Chen, X.; Yue, P.L. Electrocoagulation and electroflotation of restaurant wastewater. J. Environ. Eng. 2000, 126, 858–863. [Google Scholar] [CrossRef]
- Chen, X.; Chen, G.; Yue, P.L. Separation of pollutants from restaurant wastewater by electrocoagulation. Sep. Purif. Technol. 2000, 19, 65–76. [Google Scholar] [CrossRef]
- Benefield, L.D.; Judkins, J.F.; Weand, B.L. Process Chemistry for Water and Wastewater Treatment; Prentice-Hall Inc.: Hoboken, NJ, USA, 1982. [Google Scholar]
- Kobya, M.; Hiz, H.; Senturk, E.; Aydiner, C.; Demirbas, E. Treatment of potato chips manufacturing wastewater by electrocoagulation. Desalination 2006, 190, 201–211. [Google Scholar] [CrossRef]
- Bayramoglu, M.; Kobya, M.; Can, O.T.; Sozbir, M. Operating cost analysis of electrocoagulation of textile dye wastewater. Sep. Purif. Technol. 2004, 37, 117–125. [Google Scholar] [CrossRef]
- Pourbaix, M. Atlas of Electrochemical Equilibria in Aqueous Solutions; Pergamon Press: London, UK, 1974. [Google Scholar]
- Manikandan, S.; Saraswathi, R.; Ansari, A.M.S. Effect of pH and electrolysis time on removal of Reactive Black B dye by electrochemical treatment. Asian J. Eng. Appl. Technol. 2018, 7, 45–47. [Google Scholar] [CrossRef]
- Tahir, H.; Sadiq, S.; Shah, A.R. Modeling and optimization of electrocoagulation process for the removal of Yellow145 dye based on central composite design. Pak. J. Anal. Environ. Chem. 2019, 20, 115–126. [Google Scholar] [CrossRef]
- Chellam, S.; Sari, M.A. Aluminum Electrocoagulation as Pretreatment during Microfiltration of Surface Water Containing NOM: A Review of Fouling, NOM, DBP, and Virus Control. J. Hazard. Mater. 2016, 304, 490–501. [Google Scholar] [CrossRef]
- Bockris, J.O.; Reddy, A.K.N.; Gamboa-Aldeco, M. Modern Electrochemistry 2A—Fundamentals of Electrodics, 2nd ed.; Kluwer Academic/Plenum Publisher: New York, NY, USA, 2000. [Google Scholar]
- Chukwuemeka-Okorie, H.O.; Ekuma, F.K.; Akpomie, K.G.; Nnaji, J.C.; Okereafor, A.G. Adsorption of Tartazine and Sunset Yellow Anionic Dyes onto Activated Carbon Derived from Sieve Waste Biomass. Appl. Water Sci. 2021, 11, 27. [Google Scholar] [CrossRef]
- Rozamliana, J.; Gurung, J.; Pulikkal, A.K. Exploring the Interactions of Anionic Dye Tartazine with Cationic Surfactants in Aqueous Solution: Insight into Micellization and Interfacial Properties. Inorg. Chem. Commun. 2024, 159, 111740. [Google Scholar] [CrossRef]
- Jiménez, C.; Sáez, C.; Martínez, F.; Cañizares, P.; Rodrigo, M.A. Electrochemical dosing of iron and aluminum in continuous processes: A key step to explain electro-coagulation processes. Sep. Purif. Technol. 2012, 98, 102–108. [Google Scholar] [CrossRef]
- Mansour, L.B.; Chalbi, S. Removal of oil from oil/water emulsions using electroflotation process. J. Appl. Electrochem. 2006, 36, 577–581. [Google Scholar] [CrossRef]
- Signorelli, S.C.M.; Costa, J.M.; Neto, A.F.A. Electrocoagulation-flotation for orange II dye removal: Kinetics, costs, and process variables effects. J. Environ. Chem. Eng. 2021, 9, 106157. [Google Scholar] [CrossRef]
- Bazrafshan, E.; Mahvi, A.H.; Naseri, S.; Shaieghi, M. Performance evaluation of electrocoagulation process for dye removal from colored textile wastewater. Arab. J. Chem. 2012, 5, 393–398. [Google Scholar] [CrossRef]
- European Parliament and Council. Directive 2008/98/EC of the European Parliament and of the Council on Waste and Repealing Certain Directives (Waste Framework Directive). Off. J. Eur. Union 2008, L 312, 3–30. [Google Scholar]
- European Commission. Commission Regulation (EU) No 1357/2014 on the waste classification and hazardous properties. Off. J. Eur. Union 2014, L 365, 89–96. [Google Scholar]
- Garcia-Segura, S.; Eiband, M.M.S.G.; de Melo, J.V.; Martinez-Huitle, C.A. Electrocoagulation mechanisms: Current understanding and emerging applications. Chem. Eng. J. 2018, 336, 103–120. [Google Scholar]
- Rajaniemi, K.; Tuomikoski, S.; Lassi, U. Electrocoagulation Sludge Valorization—A Review. Resources 2021, 10, 127. [Google Scholar] [CrossRef]
- Agraw, T.A. Utilizations of electro-coagulated sludge from wastewater treatment plant data as an adsorbent for direct red 28 dye removal. Data Brief 2020, 28, 104848. [Google Scholar] [CrossRef]
- State-Ease Inc. DX13 Help, Design Expert 13; State-Ease Inc.: Minneapolis, MN, USA, 2024. [Google Scholar]
- Anuf, A.R.; Ramaraj, K.; Sivasankarapillai, V.S.; Dhanusuraman, R.; Maran, J.P.; Rajeshkumar, G.; Rahdar, A.; Díez-Pascual, A.M. Optimization of Electrocoagulation Process for Treatment of Rice Mill Effluent Using Response Surface Methodology. J. Water Process. Eng. 2022, 49, 103074. [Google Scholar] [CrossRef]
- Karimifard, S.; Moghaddam, M.R.A. Application of Response Surface Methodology in Physicochemical Removal of Dyes from Wastewater: A Critical Review. Sci. Total Environ. 2018, 640, 772–797. [Google Scholar] [CrossRef]
- Erraib, F.; El Ass, K. Optimization of Electrocoagulation Operating Parameters for COD Removal from Olive Mill Wastewater: Application of Box-Behnken Design. Mediterr. J. Chem. 2019, 9, 212–221. [Google Scholar] [CrossRef]
- Bajpai, M.; Katoch, S.S. Reduction of COD from Real Graywater by Electrocoagulation Using Fe Electrode: Optimization Through Box-Behnken Design. Mater. Today Proc. 2018, 43, 303–307. [Google Scholar] [CrossRef]
- Ozyonar, F.; Karagozoglu, B. Operating cost analysis and treatment of domestic wastewater by electrocoagulation using aluminum electrodes. Pol. J. Environ. Stud. 2011, 20, 173–179. [Google Scholar]
- Ebba, M.; Asaithambi, P.; Alemayehu, E. Investigation on operating parameters and cost using an electrocoagulation process for wastewater treatment. Appl. Water Sci. 2021, 11, 175. [Google Scholar] [CrossRef]
- Available online: https://www.hep.hr/elektra/poduzetnistvo/tarifne-stavke-cijene-1578/1578 (accessed on 10 September 2024).
- Available online: https://www.indexmundi.com/commodities/?commodity=aluminum (accessed on 10 September 2024).
- Available online: https://markets.businessinsider.com/commodities/aluminum-price (accessed on 10 September 2024).
- Eskibalci, M.F.; Ozkan, M.F. Comparison of conventional coagulation and electrocoagulation methods for dewatering of coal preparation plant. Miner. Eng. 2018, 122, 106–112. [Google Scholar] [CrossRef]
- Moosavirad, S.M. Feasibility study of coagulation system for greywater treatment and comparison of economical effects with those of electrocoagulation in mining areas. J. Adv. Environ. Health Res. 2016, 4, 190–198. [Google Scholar]
- Moradi, M.; Vasseghian, Y.; Arabzade, H.; Khaneghah, A.M. Various wastewaters treatment by sono-electrocoagulation process: A comprehensive review of operational parameters and future outlook. Chemosphere 2020, 263, 128314. [Google Scholar] [CrossRef]
- Kobya, M.; Bayramoglu, M.; Eyvaz, M. Techno-economical evaluation of electrocoagulation for the textile wastewater using different electrode connections. J. Hazard. Mater. 2007, 148, 311–318. [Google Scholar] [CrossRef]
- Sharma, G.; Choi, J.; Shon, H.K.; Phuntsho, S. Solar-powered electrocoagulation system for water and wastewater treatment. Desalin. Water Treat. 2011, 32, 381–388. [Google Scholar] [CrossRef]
- Aryanti, P.T.P.; Nugroho, F.A.; Phalakornkule, C.; Kadier, A. Energy Efficiency in Electrocoagulation Processes for Sustainable Water and Wastewater Treatment. J. Environ. Chem. Eng. 2024, 12, 114124. [Google Scholar] [CrossRef]
- Nippatla, N.; Philip, L. Electrochemical process employing scrap metal waste as electrodes for dye removal. J. Environ. Manag. 2020, 273, 111039. [Google Scholar] [CrossRef] [PubMed]


| Element | Al | Cu | Mg | Fe | Si | Mn | Pb | Bi | Zn |
|---|---|---|---|---|---|---|---|---|---|
| wt.% | 93.50 | 3.84 | 0.88 | 0.67 | 0.21 | 0.67 | 0.11 | 0.07 | 0.04 |
| Experiment | A pH | B t (min) | C i (A cm−2) |
|---|---|---|---|
| RUN 1 | 7.0 | 32 | 0.008 |
| RUN 2 | 5.0 | 41 | 0.016 |
| RUN 3 | 7.0 | 10 | 0.016 |
| RUN 4 | 7.0 | 50 | 0.016 |
| RUN 5 | 7.0 | 50 | 0.024 |
| RUN 6 | 5.0 | 19 | 0.016 |
| RUN 7 | 5.7 | 50 | 0.008 |
| RUN 8 | 4.8 | 50 | 0.024 |
| RUN 9 | 5.7 | 10 | 0.024 |
| RUN 10 | 5.7 | 10 | 0.024 |
| RUN 11 | 3.0 | 23 | 0.008 |
| RUN 12 | 3.0 | 37 | 0.024 |
| RUN 13 | 3.0 | 23 | 0.008 |
| RUN 14 | 5.7 | 50 | 0.008 |
| RUN 15 | 3.0 | 10 | 0.016 |
| RUN 16 | 7.0 | 10 | 0.008 |
| RUN 17 | 7.0 | 10 | 0.016 |
| RUN 18 | 4.7 | 10 | 0.008 |
| RUN 19 | 3.0 | 50 | 0.016 |
| RUN 20 | 3.0 | 37 | 0.024 |
| Experiment | pH | t (min) | i (A cm−2) | Anode Consumption (g) | Sludge Mass (g) |
|---|---|---|---|---|---|
| RUN 1 | 7.0 | 32 | 0.008 | 0.0860 | 0.1853 |
| RUN 4 | 7.0 | 50 | 0.016 | 0.2574 | 0.6047 |
| RUN 5 | 7.0 | 50 | 0.024 | 0.3733 | 1.1764 |
| RUN 8 | 4.8 | 50 | 0.024 | 0.3973 | 1.5023 |
| RUN 12 | 3.0 | 37 | 0.024 | 0.2895 | 1.1693 |
| RUN 1 (pH = 7.0; i = 0.008 A cm−2) | Spectrum | ||||
 | Element | 1 | 2 | 3 | 4 |
| C | 5.14 | 9.35 | 5.64 | 7.77 | |
| O | 57.31 | 55.53 | 56.81 | 56.00 | |
| Na | 0.13 | 0.19 | 0.10 | 0.15 | |
| Mg | 0.27 | 0.09 | |||
| Al | 36.37 | 33.88 | 35.98 | 34.61 | |
| Si | 0.10 | 0.15 | 0.13 | 0.17 | |
| S | 0.10 | 0.12 | 0.09 | 0.11 | |
| Cl | 0.85 | 0.78 | 0.98 | 1.10 | |
| Total | 100.00 | 100.00 | 100.00 | 100.00 | |
| RUN 4 (pH = 7.0; i = 0.016 A cm−2) | Spectrum | ||||
 | Element | 1 | 2 | 3 | |
| C | 9.10 | 11.69 | 11.88 | ||
| O | 56.79 | 58.20 | 57.31 | ||
| Na | 0.26 | 0.34 | 0.22 | ||
| Mg | 0.14 | 0.04 | 0.06 | ||
| Al | 32.97 | 29.01 | 29.65 | ||
| Si | 0.19 | 0.07 | 0.13 | ||
| S | 0.14 | 0.15 | 0.16 | ||
| Cl | 0.41 | 0.50 | 0.59 | ||
| Total | 100.00 | 100.00 | 100.00 | ||
| RUN 7 (pH = 7.0; i = 0.024 A cm−2) | Spectrum | ||||
 | Element | 1 | 2 | 3 | 4 |
| C | 17.83 | 50.46 | 51.15 | 29.97 | |
| O | 48.65 | 38.00 | 35.61 | 36.66 | |
| Na | 0.76 | 0.26 | 0.11 | 0.05 | |
| Al | 30.78 | 10.78 | 12.65 | 32.61 | |
| S | 0.22 | 0.31 | 0.37 | 0.25 | |
| Cl | 1.76 | 0.19 | 0.11 | 0.46 | |
| Total | 100.00 | 100.00 | 100.00 | 100.00 | |
| RUN 12 (pH = 3.0; i = 0.024 A cm−2) | Spectrum | ||||
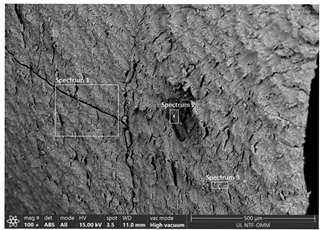 | Element | 1 | 2 | 3 | |
| C | 60.84 | 56.14 | 54.86 | ||
| O | 28.49 | 31.23 | 30.01 | ||
| Al | 10.14 | 12.21 | 14.73 | ||
| S | 0.53 | 0.42 | 0.40 | ||
| Cl | 0.10 | ||||
| Total | 100.00 | 100.00 | 100.00 | ||
| Experiment | Input Parameters | Output Parameters | R (%) | ||||
|---|---|---|---|---|---|---|---|
| A pH | B t (min) | C i (A cm−2) | pH | T (°C) | c (mmol L−1) | ||
| RUN 1 | 7.0 | 32 | 0.008 | 8.48 | 27.5 | 0.0126 | 74.8 |
| RUN 2 | 5.0 | 41 | 0.016 | 8.64 | 38.9 | 0.0030 | 94.0 |
| RUN 3 | 7.0 | 10 | 0.016 | 8.58 | 27.1 | 0.0257 | 48.6 |
| RUN 4 | 7.0 | 50 | 0.016 | 8.49 | 41.6 | 0.0014 | 97.2 |
| RUN 5 | 7.0 | 50 | 0.024 | 8.17 | 50.0 | 0.0012 | 97.6 |
| RUN 6 | 5.0 | 19 | 0.016 | 8.36 | 24.8 | 0.0097 | 80.6 |
| RUN 7 | 5.7 | 50 | 0.008 | 8.56 | 28.5 | 0.0071 | 85.8 |
| RUN 8 | 4.8 | 50 | 0.024 | 8.25 | 50.9 | 0.0009 | 98.2 |
| RUN 9 | 5.7 | 10 | 0.024 | 8.51 | 32.1 | 0.0188 | 62.4 |
| RUN 10 | 5.7 | 10 | 0.024 | 8.61 | 35.0 | 0.0192 | 61.6 |
| RUN 11 | 3.0 | 23 | 0.008 | 5.805 | 27.3 | 0.0213 | 57.4 |
| RUN 12 | 3.0 | 37 | 0.024 | 8.563 | 48.5 | 0.0004 | 99.2 |
| RUN 13 | 3.0 | 23 | 0.008 | 6.14 | 26.8 | 0.0204 | 59.2 |
| RUN 14 | 5.7 | 50 | 0.008 | 8.72 | 29.8 | 0.0114 | 77.2 |
| RUN 15 | 3.0 | 10 | 0.016 | 5.41 | 29.3 | 0.0245 | 51.0 |
| RUN 16 | 7.0 | 10 | 0.008 | 8.75 | 23.4 | 0.0367 | 26.6 |
| RUN 17 | 7.0 | 10 | 0.016 | 8.40 | 27.6 | 0.0265 | 47.0 |
| RUN 18 | 4.7 | 10 | 0.008 | 8.00 | 24.1 | 0.0230 | 54.0 |
| RUN 19 | 3.0 | 50 | 0.016 | 8.00 | 39.3 | 0.0013 | 97.4 |
| RUN 20 | 3.0 | 37 | 0.024 | 7.74 | 49.0 | 0.0003 | 99.4 |
| T (°C) | pH | c (mmol L−1) | ||||
|---|---|---|---|---|---|---|
| F Value | p-Value | F Value | p-Value | F Value | p-Value | |
| MODEL | 42.66 | <0.0001 | 5.88 | 0.0053 | 48.88 | <0.0001 |
| A–pH | 1.67 | 0.2247 | 29.16 | 0.0003 | 13.36 | 0.0044 |
| B–t (min) | 118.28 | <0.0001 | 2.46 | 0.1481 | 195.89 | <0.0001 |
| C–i (A cm−2) | 95.57 | <0.0001 | 1.23 | 0.3342 | 51.02 | <0.0001 |
| AB | 0.9867 | 0.3440 | 4.87 | 0.0518 | 0.7386 | 0.4103 |
| AC | 1.87 | 0.2042 | 1.48 | 0.2744 | 15.06 | 0.0010 |
| BC | 9.30 | 0.0052 | 1.42 | 0.2855 | 11.33 | 0.0027 |
| R2 | 0.9746 | 0.8412 | 0.9778 | |||
| Adj-R2 | 0.9518 | 0.6982 | 0.9578 | |||
| Pre-R2 | 0.8639 | −0.1692 | 0.8070 | |||
| C.V. (%) | 6.07 | 6.86 | 6.32 | |||
| Std. Dev. | 2.07 | 0.5491 | 0.3187 | |||
| Mean | 34.08 | 8.01 | −5.04 | |||
| Adeq. Pre. | 19.3520 | 8.1390 | 18.9734 | |||
| Name | Goal | Lower Limit | Upper Limit | Lower Weight | Upper Weight | Importance |
|---|---|---|---|---|---|---|
| A–pH | is in range | 3 | 7 | 1 | 1 | 3 |
| B–t (min) | is in range | 10 | 50 | 1 | 1 | 3 |
| C–i (A cm−2) | is in range | 0.008 | 0.024 | 1 | 1 | 3 |
| T (°C) | target (30) | 22 | 35 | 1 | 1 | 3 |
| pH | target (7) | 6 | 8 | 1 | 1 | 4 |
| c (mmol L−1) | minimise | 0.0003 | 0.0367 | 1 | 0.1 | 5 |
| Number | pH | t (min) | i (A cm−2) | T (°C) | pH | c (mmol L−1) | Desirability | |
|---|---|---|---|---|---|---|---|---|
| 1 | 3.3696 | 18.741 | 0.016 | 30.000 | 7.000 | 0.016 | 0.976 | Selected |
| 2 | 3.000 | 46.592 | 0.008 | 28.404 | 7.000 | 0.011 | 0.932 | |
| 3 | 3.048 | 45.027 | 0.008 | 38.303 | 7.000 | 0.012 | 0.927 |
| Experiment | U (V) | Cenergy (kWh m−3) | Celectrode (kg m−3) | Celectrode,Faraday (kg m−3) | Operating Cost (EUR m−3) |
|---|---|---|---|---|---|
| RUN 1 | 11.78 | 4.00 | 0.14 | 0.11 | 0.736 |
| RUN 2 | 28.37 | 24.64 | 0.36 | 0.29 | 3.360 |
| RUN 3 | 26.61 | 5.65 | 0.09 | 0.07 | 0.787 |
| RUN 4 | 26.61 | 28.19 | 0.43 | 0.36 | 3.890 |
| RUN 5 | 38.87 | 61.79 | 0.62 | 0.53 | 7.880 |
| RUN 6 | 26.61 | 10.73 | 0.17 | 0.14 | 1.493 |
| RUN 7 | 12.07 | 6.40 | 0.23 | 0.18 | 1.180 |
| RUN 8 | 37.02 | 58.85 | 0.66 | 0.53 | 7.486 |
| RUN 9 | 36.29 | 11.57 | 0.15 | 0.11 | 1.535 |
| RUN 10 | 36.96 | 11.79 | 0.14 | 0.11 | 1.535 |
| RUN 11 | 13.92 | 3.39 | 0.08 | 0.07 | 0.531 |
| RUN 12 | 33.02 | 38.88 | 0.48 | 0.40 | 5.104 |
| RUN 13 | 14.54 | 3.55 | 0.10 | 0.08 | 0.592 |
| RUN 14 | 16.80 | 8.91 | 0.21 | 0.18 | 1.395 |
| RUN 15 | 28.63 | 6.08 | 0.09 | 0.07 | 0.832 |
| RUN 16 | 12.06 | 1.28 | 0.05 | 0.04 | 0.245 |
| RUN 17 | 29.25 | 6.21 | 0.09 | 0.07 | 0.845 |
| RUN 18 | 14.00 | 1.49 | 0.04 | 0.03 | 0.244 |
| RUN 19 | 20.19 | 21.39 | 0.42 | 0.36 | 3.159 |
| RUN 20 | 35.59 | 41.90 | 0.50 | 0.40 | 5.462 |
Disclaimer/Publisher’s Note: The statements, opinions and data contained in all publications are solely those of the individual author(s) and contributor(s) and not of MDPI and/or the editor(s). MDPI and/or the editor(s) disclaim responsibility for any injury to people or property resulting from any ideas, methods, instructions or products referred to in the content. |
© 2025 by the authors. Licensee MDPI, Basel, Switzerland. This article is an open access article distributed under the terms and conditions of the Creative Commons Attribution (CC BY) license (https://creativecommons.org/licenses/by/4.0/).
Share and Cite
Gudić, S.; Čatipović, N.; Ban, M.; Svilović, S.; Vukojević Medvidović, N.; Rotaru, A.; Vrsalović, L. Efficient Removal of Tartrazine Yellow Azo Dye by Electrocoagulation Using Aluminium Electrodes: An Optimization Study by Response Surface Methodology. Appl. Sci. 2025, 15, 5563. https://doi.org/10.3390/app15105563
Gudić S, Čatipović N, Ban M, Svilović S, Vukojević Medvidović N, Rotaru A, Vrsalović L. Efficient Removal of Tartrazine Yellow Azo Dye by Electrocoagulation Using Aluminium Electrodes: An Optimization Study by Response Surface Methodology. Applied Sciences. 2025; 15(10):5563. https://doi.org/10.3390/app15105563
Chicago/Turabian StyleGudić, Senka, Nikša Čatipović, Marija Ban, Sandra Svilović, Nediljka Vukojević Medvidović, Andrei Rotaru, and Ladislav Vrsalović. 2025. "Efficient Removal of Tartrazine Yellow Azo Dye by Electrocoagulation Using Aluminium Electrodes: An Optimization Study by Response Surface Methodology" Applied Sciences 15, no. 10: 5563. https://doi.org/10.3390/app15105563
APA StyleGudić, S., Čatipović, N., Ban, M., Svilović, S., Vukojević Medvidović, N., Rotaru, A., & Vrsalović, L. (2025). Efficient Removal of Tartrazine Yellow Azo Dye by Electrocoagulation Using Aluminium Electrodes: An Optimization Study by Response Surface Methodology. Applied Sciences, 15(10), 5563. https://doi.org/10.3390/app15105563