Article

Effects of Packaging Material Type, Storage Time and Lipid Content on Phthalate Migration in Smoked Fish Meat

by
Boban Đurić
1,
Brankica Kartalović
2,
Kristina Habschied
3,
Nikolina Novakov
1,
Jelena Vranešević
4,
Boris Brkić
2 and
Krešimir Mastanjević
3,*
1
Department of Veterinary Medicine, Faculty of Agriculture, University of Novi Sad, Trg Dositeja Obradovića 8, 21000 Novi Sad, Serbia
2
BioSense Institute, University of Novi Sad, Zorana Đinđića 1, 21000 Novi Sad, Serbia
3
Faculty of Food Technology, Josip Juraj Strossmayer University of Osijek, Franje Kuhača 20, 31000 Osijek, Croatia
4
Scientific Veterinary Institute Novi Sad, Rumenački put 25, 21000 Novi Sad, Serbia
*
Author to whom correspondence should be addressed.
Appl. Sci. 2024, 14(4), 1660; https://doi.org/10.3390/app14041660
Submission received: 3 February 2024 / Revised: 13 February 2024 / Accepted: 18 February 2024 / Published: 19 February 2024
(This article belongs to the Special Issue Innovative Technology in Food Analysis and Processing)

Abstract

:
The objective of this study is an investigation of the influence of six different plastic packages (polyethylene terephthalate, high-density polyethylene, biodegradable high-density polyethylene, low-density polyethylene, polypropylene and polyamide polyethylene) on the migration of phthalate residues in smoked carp, trout and salmon stored at −18 °C for three and six months. Six phthalate residues concentrations were determined using the gas chromatography-mass spectrometry method. Diisobutyl phthalate (DIBP) and dibutyl phthalate (DBP) migrated the most into salmon meat from PAPE packaging after six months of storage, reaching 73.77 μg/kg and 78.45 μg/kg, respectively. The highest concentrations of bis(2-ethylhexyl) phthalate (DEHP) after six months of storage were present in salmon meat packed in polyamide polyethylene (253.56 μg/kg) and the lowest in carp meat packages in polypropylene (157.72 μg/kg). Phthalate residues in all the samples showed higher levels after three and six months of storage compared to the control sample. Among the investigated phthalates, polypropylene was the material with the lowest migration into fish meat. A further amount of DEHP migration in the fish was detected with a higher fat content. We acknowledge that levels of phthalates should be monitored, and research in this field should be continued, especially since there are no legal restrictions regarding the maximum level of phthalates in food.

1. Introduction

Phthalates are esters of phthalic acid that have many applications. The most significant one is their usage as the main plasticizers in the polymer industry [1]. To improve the extensibility, elasticity and workability of the polymers they are mainly added to various plastic materials, such as polyethylene terephthalate, polyvinyl acetate, polyvinyl chloride and polyethylene [1,2]. With the increase of the population on the planet, the need for food, including fish and seafood, constantly increases. It is expected that fish production from aquaculture could double by 2050 [3]. Although fish is considered a healthy food due to the favorable content of proteins, unsaturated fatty acids, vitamins and minerals [4], it is necessary to take care of the content of various contaminants in them. It is also known that the concentrations of certain chemical contaminants, including phthalates, can decrease or increase depending on the method of processing, packaging material, time of the storage, temperature and fat content [5]. Phthalates can be found in various foods, especially those with a high fat content [6,7]. The major contamination of food with phthalates is due to the contact with various plastic food containers, including contact with packaging materials [8] and contamination during the food production process [9].
According to the US EPA [10], phthalates are classified as probably carcinogenic for humans, leading to endocrine disruptors or hormonally active agents because of their ability to interfere with the endocrine system in the body. Therefore, the European Commission Regulation [11] on the registration, evaluation, authorization and restrictions of chemicals (REACH) has included DEHP, DBP and butylbenzyl phthalate (BBP) as toxic for reproduction. Some of the phthalates are restricted in the European Union [12], which regulates only the migration of some phthalates from food contact material to food but not the maximum permitted amount of phthalates in food. The values for DBP, BBP, DEHP and the sum of diisononyl phthalate (DINP) and diisodecyl phthalate (DIDP) in food contact materials are listed as 0.3 mg/kg, 30 mg/kg, 1.5 mg/kg and 9 mg/kg, respectively.
As a continental country, Serbia produces freshwater fish species, common carp and trout mostly [13]. Carp and trout are often consumed and can be found on the market as fresh and smoked fish. Salmon is also often used as a smoked fish. Plastic packages are commonly used to store smoked fish, both during short storage at refrigerator temperatures and during longer storage at freezing temperatures. In the entire plastics industry, the production of packaging accounts for 40.1%, of which polyethylene accounts for 30% of the total production. Low-density polyethylene and high-density polyethylene types of packaging are the most common and account for 17.5% and 12.3% of the total European plastics demand [14]. Studies on the interaction between frozen fish and packaging are scarce. The importance of this investigation would be in reducing smoked fish contamination with chemical hazards and increasing the level of food safety.
The main aim of this study was to determine the influence of the packaging material on the release of phthalate residues into the fish meat itself. This study aims to determine the effects of the time of storage and lipid content of the smoked fish samples on the levels of investigated phthalates.

2. Materials and Methods

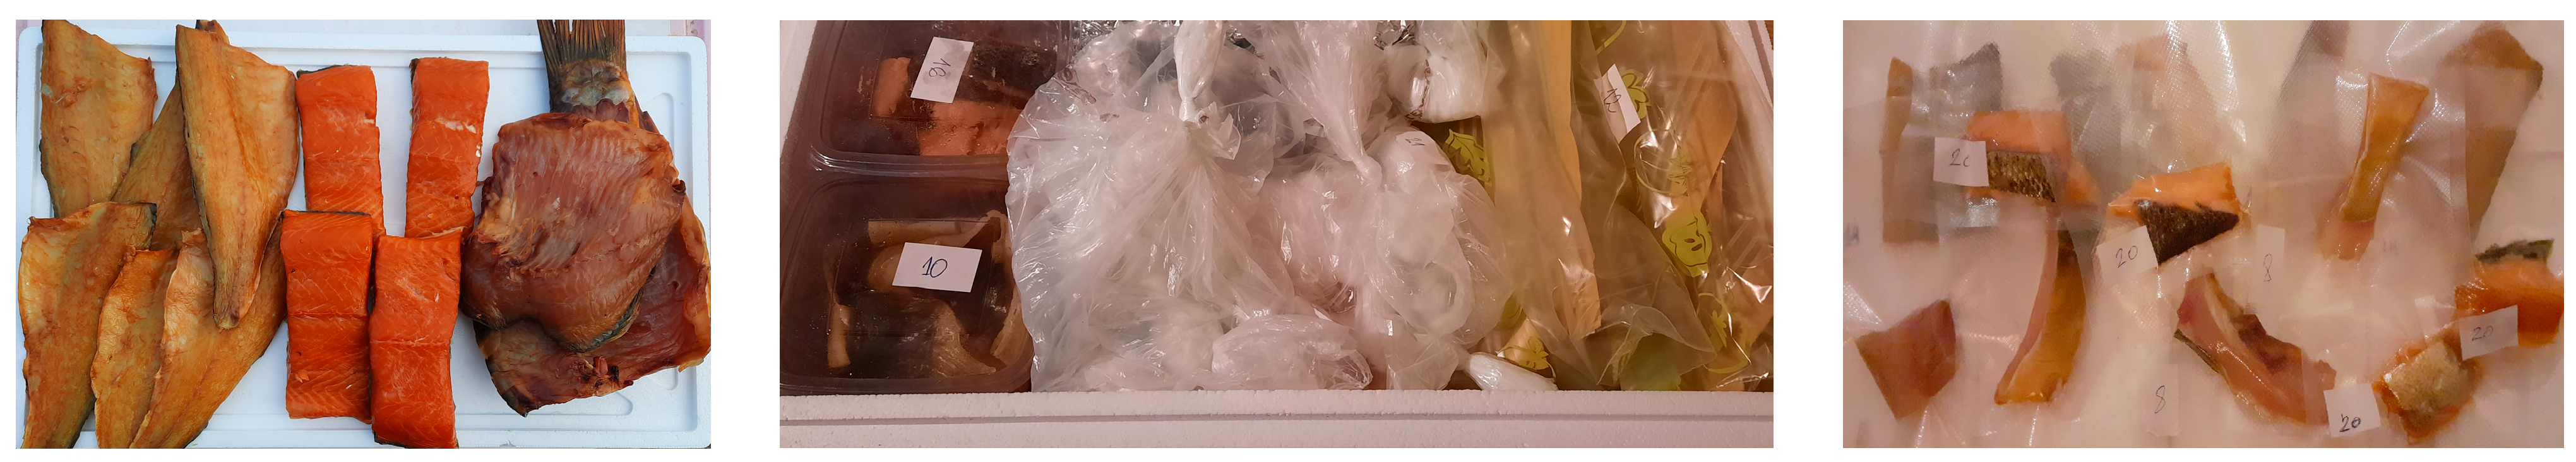
2.1. Study Design and Sampling

Salmon, carp and trout meat smoked by hot smoking in an industrial fish smoking plant in Serbia were used in this study. The smoked meat of each species was cut into pieces of at least 10 g each, divided into two groups and packed as follows: samples from the first group included salmon (36 samples), carp (36 samples) and trout (36 samples) meat packed in six different plastic packages, including polyethylene terephthalate (PET) boxes, high-density polyethylene (HDPE) bags, biodegradable HDPE, low-density polyethylene (LDPE) bags, polypropylene (PP) bags and polyamide polyethylene (PAPE) vacuum bags (90 µm) (MCC Trading International GmbH, Düsseldorf, Germany). Samples packed in PET were placed in transparent boxes. Samples packed in HDPE, biodegradable HDPE, LDPE and PP were put in bags intended for food packaging, while samples packed in PAPE were also in bags, but they were vacuum-sealed. Packaged samples can be seen in Figure 1. The samples from the second group (3 salmon samples, 3 carp and 3 trout samples) were not packed in plastic packaging and served as control samples. Their fat content was also determined. After packaging, 54 samples from the first group, including salmon, carp and trout, were frozen at a temperature of −18 °C for 3 months, while 54 samples of the investigated fish species were stored for 6 months at −18 °C. The samples were analyzed in triplicate so that a total of 117 samples were processed. Each sample was analyzed for the presence of dimethyl phthalate (DMP), diethyl phthalate (DEP), diisobutyl phthalate (DiBP), dibutyl phthalate (DBP), bis(2-ethylhexyl) phthalate (DEHP) and di-n-octyl-phthalate (DnOP).

2.2. Chemicals and Standards

The chemicals and reagents used in this study were acetonitrile (ACN) from Sigma-Aldrich (St. Louis, MO, USA); anhydrous magnesium sulfate (MgSO4), primary and secondary amine (PSA), anhydrous sodium acetate (CH3COONa) and C18 from Merk (Darmstadt, Germany); ultrapure water by a Milli-Q system (Millipore, Bedford, MA, USA) and n-hexane (Carlo Erba, Milan, Italy). Standards of phthalates were obtained from Dr. Ehrenstorfer™ GmbH (Augsburg, Germany).

2.3. Sample Preparation

The sample for the phthalates analysis in the amount of 10 g was first homogenized; after which, 3 g of the sample was taken for further analysis and transferred to a glass tube in which 6 mL of ACN and 3 mL of water were added. The mixture was shaken for 1 min and, after adding 3 g of anhydrous MgSO4 and 1 g of CH3COONa, was centrifuged for 5 min. The Quick Easy Cheap Effective Rugged Safe (QuEChERS) modified method was used for sample preparation, according to Yadav et al. [15], Carnol et al. [16] and Kartalović et al. [17]. Then, 1 mL of the extract was transferred to a 15 mL test tube and mixed with 150 mg of anhydrous MgSO4, 50 mg of PSA and 50 mg of C18 and shaken for 1 min and centrifuged for 5 min at a speed of 5000 rpm. The sample was then ready for analysis. The solutions of each phthalate were also prepared according to the method described by Kartalović et al. [17].

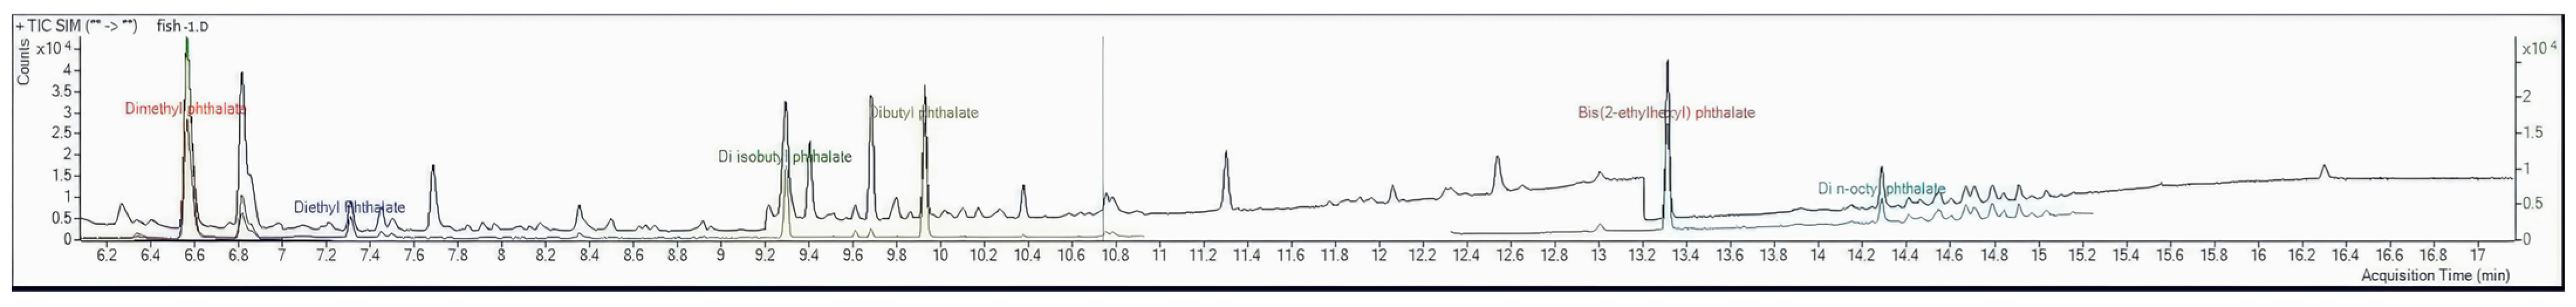
2.4. Instrumentation, Analysis and Method Validation

Agilent Technologies GC-MS 7890B/5977A instrument (Santa Clara, CA, USA) was used for the phthalates analysis. The conditions of the instrument were as follows: injection temperature 280 °C, MSD 280 °C; oven: initial temperature 90 °C (held 1 min) to 210 °C at 15 °C/min (held 2 min), then at the rate of 5 °C/min to 240 °C (held 5 min), followed by an increase of 5 °C/min to 250 °C and then followed by an increase of 25 °C/min to 300 °C and held for 4 min. Phthalate identification was based on a comparison of the peak retention times and target ions in SIM mode with those obtained from a standard phthalate mixture. The quantification was according to Kartalović et al. and Habschied et al. [17,18]. The verification of the peaks was carried out based on the retention times, and the target ions were compared with those of external phthalates. Some phthalates were found in the solvent blank, but the amount was lower than the limit of quantification (LOQ). Phthalates determination was performed in splitless mode. The carrier gas was helium with a velocity of 35.698 cm/s, and the pressure was 7.0 psi. The measurement uncertainties were in the range recommended by SANTE Document No 11312/2021 [19]. Retention time, limit of detection (LOD) and LOQ of the analyzed phthalates are presented in Table 1. Chromatogram of the standard reference material is shown in Figure S1 of the Supplementary Materials. Figure S2 shows a chromatogram of the solvent and salt blank, while in Figure S3, the calibration curves of the analyzed phthalates are presented. A chromatogram of a smoked fish sample can be seen in Figure 2.

2.5. Lipid Analysis

The total lipids were analyzed according to the method described by Spiric et al. [20] using a Thermo Scientific accelerated solvent extractor (ASE 200, Dionex, Sunnyvale, CA, USA). After homogenization and mixing with diatomaceous earth samples, the samples were extracted with a n-hexane and isopropanol mixture (60:40 v/v) at 100 °C and 10.3 MPa of nitrogen pressure.

2.6. Statistical Analysis
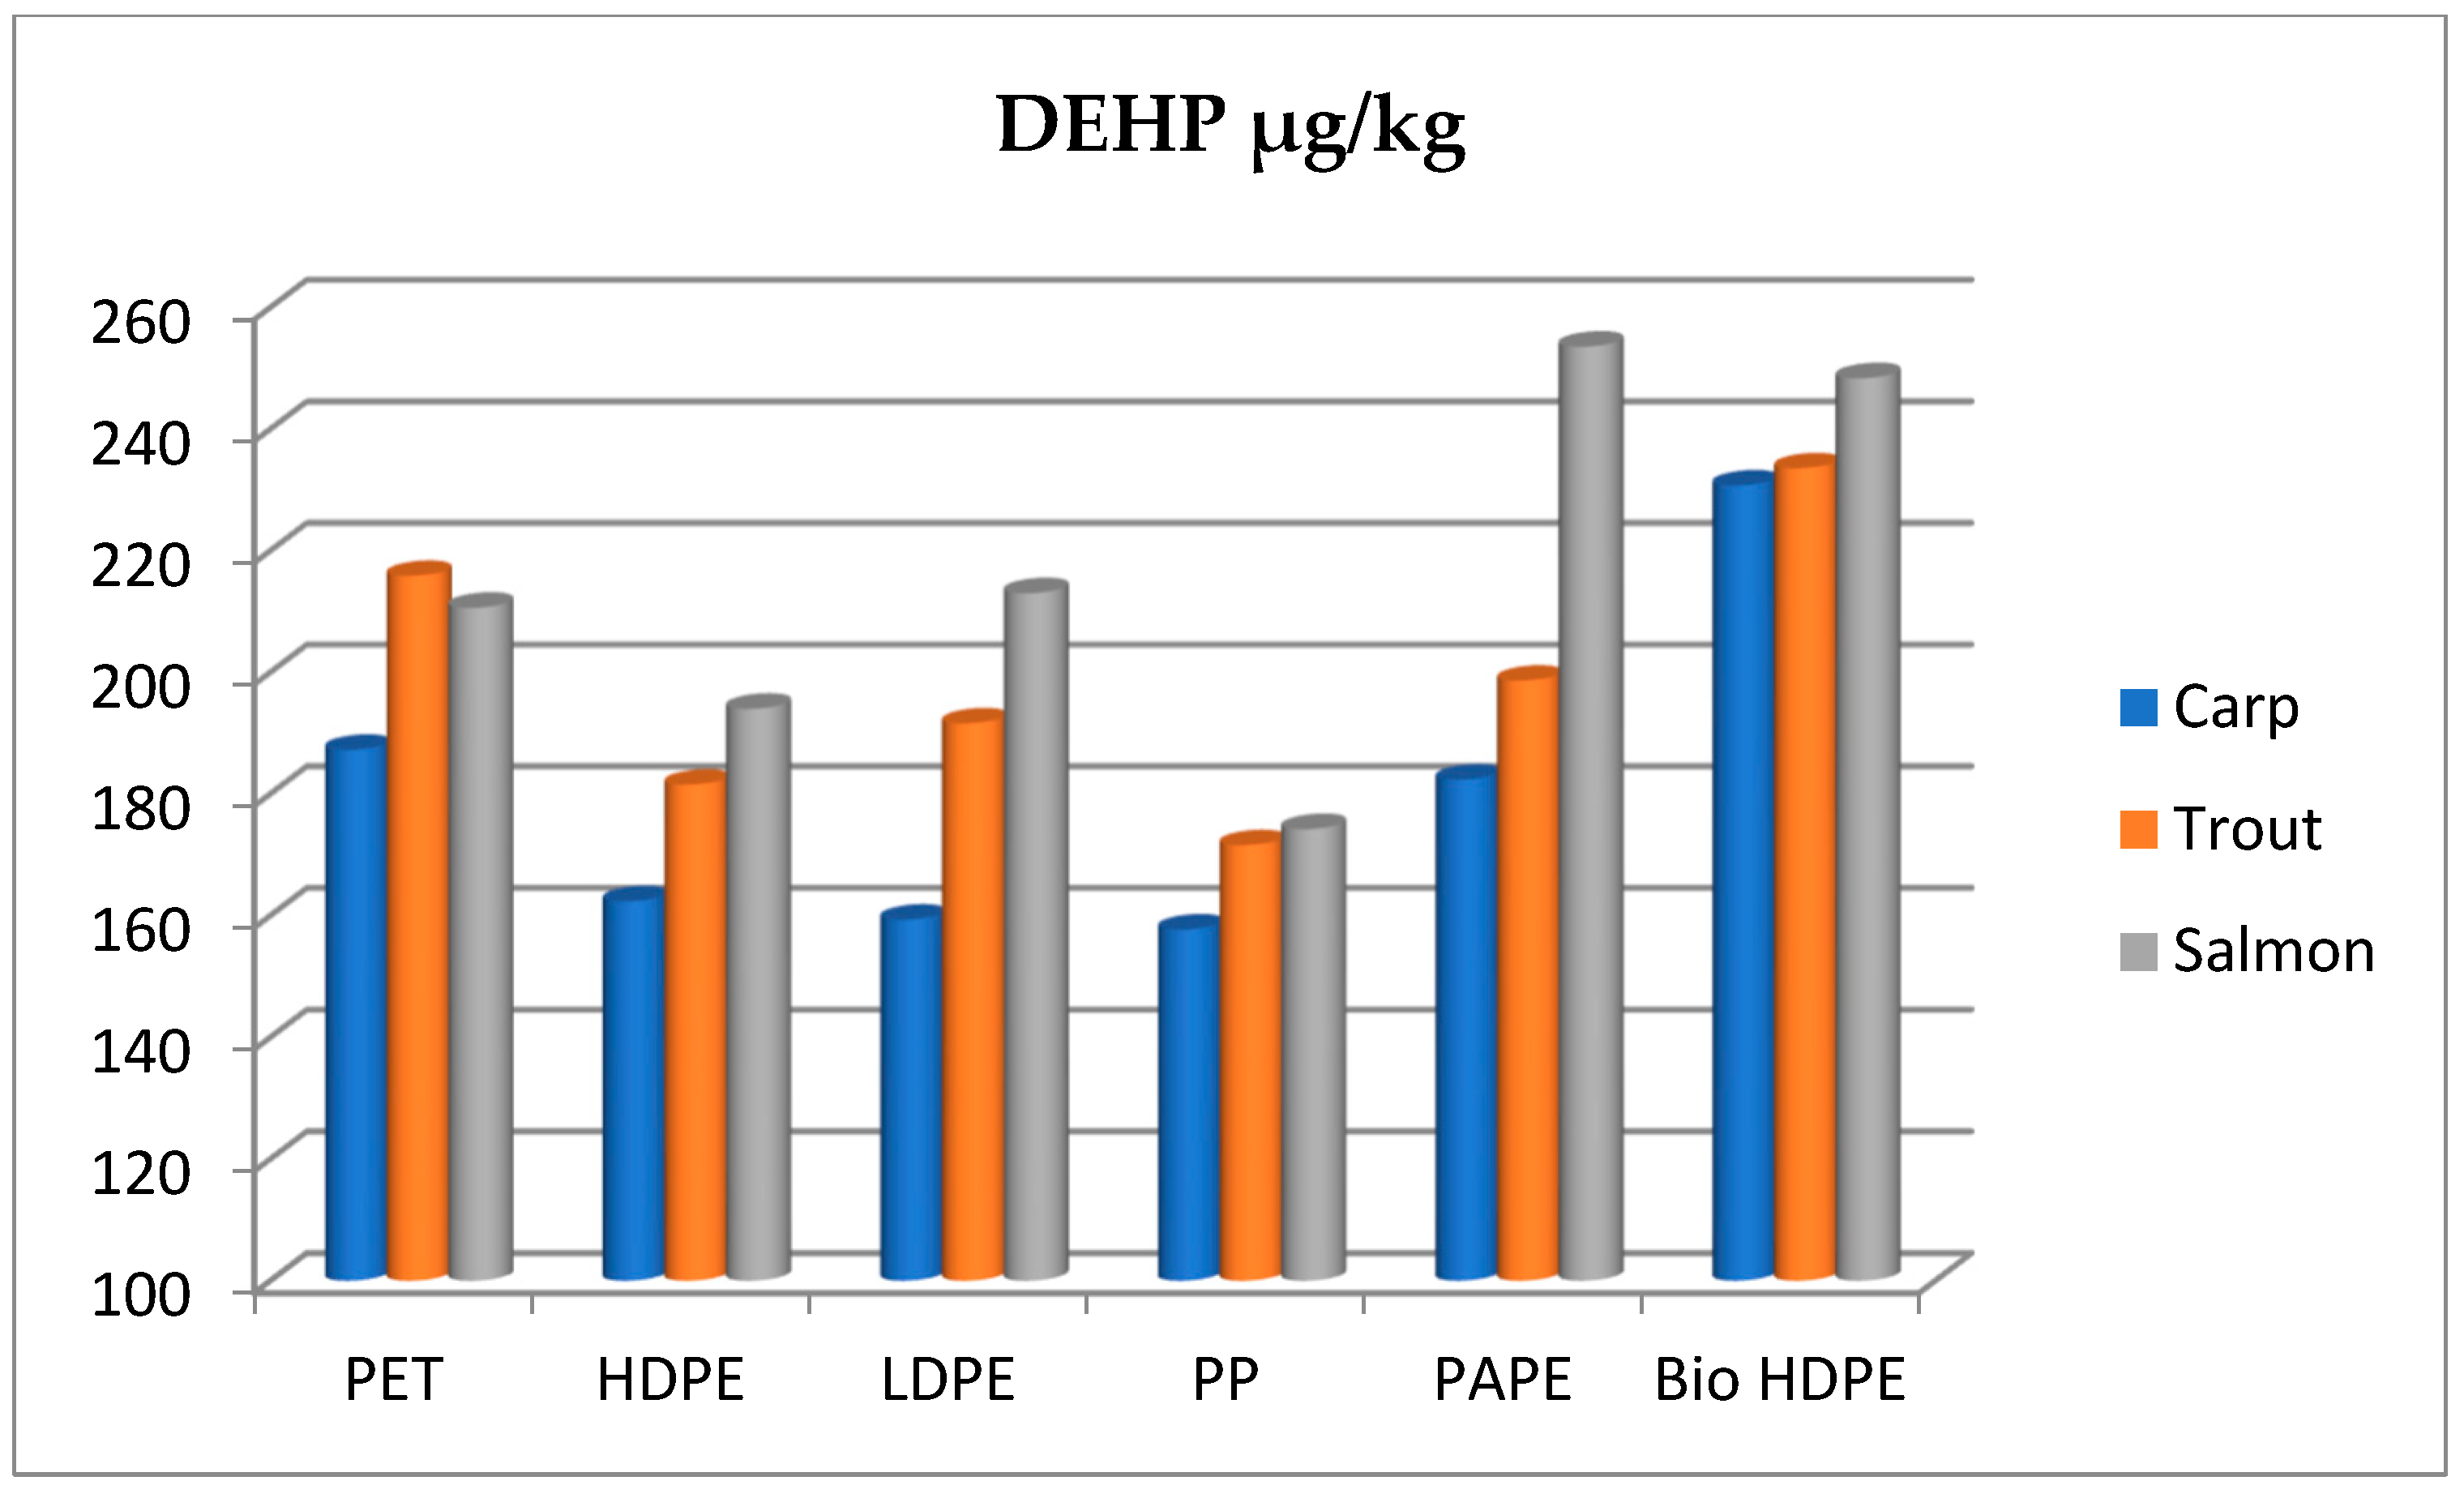
Statistica 12.7 (StatSoft Inc., Tulsa, OK, USA) software was used to determine the means, standard deviations, one-way analysis of variance (ANOVA) and post hoc Tukey’s test. The least statistical significance was defined at p ≤ 0.05.

3. Results

Concentrations of six investigated phtalates in smoked carp, trout and salmon meat in control samples and groups after three and six month of storage at −18 °C packed in different packaging materials are presented in Table 2 and Figure 3. The study results show the levels of the investigated phtalates, including the mean and standard deviation values. The lipid content in the meat of the investigated smoked fish was also determined, and it reached 5.2% in carp, 9.5% in trout and 11.4% in salmon.
DMP, DEP and DnOP were under the limit of quantification for each of the samples, while DIBP, DBP and DEHP were present in all the analyzed samples. DIBP migrated the most into smoked carp meat from biodegradable HDPE packaging after six months of storage, reaching 40.97 μg/kg, while the control sample contained 23.25 μg/kg of DIBP. HDPE was followed by PAPE, reaching a level of 38.57 μg/kg after six months of storage. The lowest migration of DIBP was recorded for PAPE (23.51 μg/kg), PP (23.89 μg/kg) and LDPE (24.30 μg/kg) after three months of storage. In trout meat, the highest DIBP migration was detected in PAPE (42.21 μg/kg) and PET materials (39.87 μg/kg) after six months of storage. The control sample in trout meat had 33.44 μg/kg of DIBP. The lowest DIBP levels were determined in trout packed in LDPE and HDPE materials after three months of storage, reaching values similar to the control samples. DIBP migrated the most into salmon meat from PAPE packaging after six months of storage, reaching 73.77 μg/kg, while the reference sample was 29.76 μg/kg. The DBP control sample in carp meat amounted a mean value of 31.6 μg/kg and was the highest in samples packed in PAPE (46.68 μg/kg) and the lowest in LDPE (32.26 μg/kg) after six month of storage. The DBP level measured from trout meat, which reference sample had a mean value of 32.78 μg/kg, after six months was the highest in the samples from biodegradable HDPE packaging (45.96 μg/kg) and the lowest from the HDPE packaging samples (33.35 μg/kg). In salmon meat, the highest migration of DBP was recorded in the sample embedded in PAPE material after 6 months of storage and amounted to 78.45 μg/kg. The control samples in smoked carp, trout and salmon meat contained 157.69 μg/kg, 172.89 μg/kg and 167.06 μg/kg of DEHP. After six months of storage, the highest DEHP concentration was found in carp meat packed in biodegradable HDPE (230.73 μg/kg) and the lowest in LDPE (156.5 μg/kg) packaging. In trout and salmon, the highest concentrations of DEHP after six months of storage were present in meat packed in biodegradable HDPE (223.54 μg/kg) and in PAPE (253.56 μg/kg) and the lowest in PP (171.57 μg/kg and 174.22 μg/kg).

4. Discussion

An increasing amount of research deals with the impact of plastic packaging on food and their interactions [7,21,22,23,24,25,26]. One of the reasons why phthalates are easily released and end up in contact environments is that they are physically, not covalently, bound to a polymer chain [27]. Phthalates do not enter food, including fish and fish products, only the contact materials in which they are packaged but also from the originating environment and the equipment with which they come into contact during processing and packaging [28]. Thus, in a study conducted in Turkey by Kiralan [7], the phthalate content of fish packaged not only in plastic but also in cans and glass materials was analyzed in order to determine which materials released the most phthalates. It was found that the highest DEPH content of 650 μg/kg was in tuna in olive oil packed in plastic packaging. Jarošova and Bogdanovičova [29] proved that, in addition to the type of material, the composition of the food, as well as the conditions and length of storage, have a significant influence on the phthalate release. They investigated the migration of DBP and DEHP from packaging to meat products and found that the temperature and length of storage are very important. They also concluded that the migration of PAE was 2–21 times higher in samples with 50% fat than in samples with 10% fat. This was also confirmed in the research conducted by Bogdanović et al. [30], who found that the migration of DEHP from packaging into milk increases with increasing the temperature and is higher in dairy products with a higher percentage of fat. In this study, it can be seen that there is a migration of phthalates into fish from all the tested packaging materials, but the migration is not as high as at higher temperatures. It is expected that there was no high migration of phthalates in this study, since the samples were stored at low temperatures. Low temperatures were chosen, because this is how smoked fish is most often stored, especially if the storage time is long, precisely to see how much phthalates actually migrate from the packaging to the fish. Based on the results on the phthalate levels obtained, phthalates migration was higher after six months than after three months of storage in all the analyzed materials, as could be expected. Alp and Yerlikaya [25] also found an increase in time-dependent migration in fish and seafood packaged in PP and polyvinyl chloride. Regarding the influence of different packaging materials on the migration of the investigated phthalates into fish meat, it can be seen that the following materials had the statistically significantly highest migration after 6 months of storage: for DIBP (in carp, it was Bio HDPE, HDPE and PAPE; in trout, PAPE, PET and HDPE; and in salmon, PAPE and PET); for DBP (in carp, it was PAPE, Bio HDPE and HDPE; in trout, Bio HDPE, PET, PAPE, PET and LDPE; and in salmon, PAPE and PET) and for DEHP (in carp, it was Bio HDPE, PET and PAPE; in trout, it was HDPE and PET; and in salmon, Bio HDPE and PAPE). The lowest phthalate migration was observed in fish packed in PP. Migration from packaging to food occurs most often due to diffusion or adsorption [31], and it depends on a number of factors, such as the structure of the phthalate ester side chain, the fragmentation of a certain material, the microplastic particle size, the proximity of the contact between the material and the packaging and others. Kida and Koszelnik [32] found that the leaching of phthalates from the smallest analyzed fraction was more than with the largest fraction tested. In this investigation, PAPE was one of the materials with the highest migration rate. This was most probably influenced by the fact that the fish in it was packed in a vacuum package and thus was in close contact with the material over almost the entire surface. On the other hand, PP was the material with the lowest migration of phthalates. PP is a linear hydrocarbon polymer that can have an isotactic, syndiotactic and atactic structure. It is widely used thanks to its good physical and chemical properties that can be adjusted by adding different types of additives. PP may contain phthalates such as DBP, DEHP and DIBP, primarily due to the presence of catalysts [33]. DEHP is the most commonly found phthalate ester in foods [34]. In this study, the levels of DEHP in carp, which has a lipid content of 5.2%, are, in most of the samples, statistically significantly different (p ≤ 0.05) from the meat of trout and salmon, which have higher percentages of fat and reached 9.5% and 11.4%, respectively. That correlation was most visible with LDPE and PAPE packaging after 6 months of storage (Figure 3). In the meat of carp packed in LDPE that contained a lower percentage of fat, the concentration of DEHP was 159.34 μg/kg; in trout, was 191.59 μg/kg; and in the meat of salmon, was 213.01 μg/kg. In the samples packaged in PAPE, the DEHP level in carp meat reached 182.36 μg/kg, and in trout, it was 198.62 μg/kg, while, in salmon, as the fattiest fish, it reached 253.56 μg/kg. Since phthalate esters are lipid-soluble, it was expected that a higher amount of DEHP migrated in fish with a higher fat content. With DIBP and DBP, it was more difficult to see a correlation between the fat content and phthalate levels, possibly because the values of these phthalates were lower than the DEHP values.
The presented values show that the migration of DBP and DEHP from the examined plastic packagings did not exceed the levels in accordance with the EC [12], which regulates the migration of some phthalates from food contact material to food and which the maximum levels are 0.3 mg/kg for DBP and 1.5 mg/kg for DEHP. The concentrations obtained in this study are far below, which indicates that the plastic materials used for the packaging and storing of smoked fish at a temperature of −18 °C are safe regarding the migration of the tested phthalates. We acknowledge the levels of these contaminants should be monitored, and research in this field should be continued, especially since there are no legal restrictions regarding the maximum level of phthalates in food.

5. Conclusions

The results of the migration of phthalates from different packages into smoked fish show indications that there is higher migration with the increase of the storage time of the tested products. All studied plastic packagings are responsable for the migration of phthalate residues. The lowest phthalate migration was observed in fish packed in PP. It was detected that a higher amount of DEHP migrated in fish with a higher fat content. The migration of DBP and DEHP from the examined plastic packaging does not exceed the values in accordance with the EU limit for migration from food contact material to food. Further studies should be conducted to further confirm and show a continuation of the presented findings. We stress the importance and necessity to permanently develop systems that prevent the possible intake of different contaminates through food based on risk analysis.

Supplementary Materials

The following supporting information can be downloaded at https://www.mdpi.com/article/10.3390/app14041660/s1. Figure S1: Chromatogram of standard reference material of 1 ppm; Figure S2: Chromatogram of solvent and salt blank; Figure S3: The calibration curves for each analyzed phthalate.

Author Contributions

Conceptualization, B.Đ.; methodology, B.K.; validation, B.K.; formal analysis, J.V.; investigation, B.Đ. and N.N.; writing—original draft preparation, N.N.; writing—review and editing, K.H. and K.M.; visualization, B.B. All authors have read and agreed to the published version of the manuscript.

Funding

This research was funded by the Provincial Secretariat for Higher Education and Science, Autonomous Province Vojvodina, Republic of Serbia, grant number 142-451/2023-01/01.

Institutional Review Board Statement

Not applicable.

Informed Consent Statement

Not applicable.

Data Availability Statement

The raw data supporting the conclusions of this article will be made available by the authors on request.

Conflicts of Interest

The authors declare no conflicts of interest.

References

  1. Giuliani, A.; Zuccarini, M.; Cichelli, A.; Khan, H.; Reale, M. Critical review on the presence of phthalates in food and evidence of their biological impact. Int. J. Environ. Res. Public Health 2020, 17, 5655. [Google Scholar] [CrossRef]
  2. Holadová, K.; Prokupková, G.; Hajšlová, J.; Poustka, J. Headspace solid-phase microextraction of phthalic acid esters from vegetable oil employing solvent-based matrix modification. Anal. Chim. Acta 2007, 582, 24–33. [Google Scholar] [CrossRef]
  3. FAO. The State of World Fisheries and Aquaculture 2020. Sustainability in Action. Available online: https://www.fao.org/3/ca9229en/ca9229en.pdf (accessed on 12 December 2023).
  4. Daviglus, M.; Sheeshka, J.; Murkin, E. Health benefits from eating fish. Comment Toxico. 2002, 8, 345–347. [Google Scholar] [CrossRef]
  5. Yerlikaya, P. Fitalat esterleri ve su ürünleri tüketimindeki yeri. J. Food Health Sci. 2017, 3, 59–66. [Google Scholar] [CrossRef]
  6. Sioen, I.; Fierens, T.; Van Holderbeke, M.; Geerts, L.; Bellemans, M.; De Maeyer, M.; Servaes, K.; Vanermen, G.; Boon, P.E.; De Henauw, S. Phthalates dietary exposure and food sources for Belgian preschool children and adults. Enviro. Inter. 2012, 48, 102–108. [Google Scholar] [CrossRef]
  7. Kiralan, S. Phthalate and polycyclic aromatic hydrocarbon levels in liquid ingredients of packaged fish sold in Turkish markets. J. Oleo Sci. 2020, 69, 851–858. [Google Scholar] [CrossRef]
  8. Ustun, I.; Sungur, S.; Okur, R.; Sumbul, A.T.; Oktar, S.; Yilmaz, N.; Gokce, C. Determination of phthalates migrating from plastic containers into beverages. Food Anal. Method. 2015, 8, 222–228. [Google Scholar] [CrossRef]
  9. Pereira, J.; do Céu Selbourne, M.; Poças, F. Determination of phthalates in olive oil from European market. Food Cont. 2019, 98, 54–60. [Google Scholar] [CrossRef]
  10. US EPA. Phthalates, TEACH Chemical Summary; Environmental Protection Agency: Washington, DC, USA, 2007; pp. 1–25. Available online: https://nepis.epa.gov/Exe/ZyPDF.cgi/P100BNSK.PDF?Dockey=P100BNSK.PDF (accessed on 18 February 2024).
  11. European Commission. Commission Regulation (EU) No 143/2011 of 17 February 2011 amending Annex XIV to Regulation (EC) No 1907/2006 of the European Parliament and of the Council on the Registration, Evaluation, Authorisation and Restriction of Chemicals (‘REACH’). Off. J. Eur. Union 2011, 44, 2–6. [Google Scholar]
  12. European Commission. Commission Regulation (EU) No 10/2011 of 14 January 2011 on plastic materials and articles intended to come into contact with food. Off. J. Eur. Union 2011, 12, 1–89. [Google Scholar]
  13. Relić, R.; Marković, Z. Farmed fish welfare, with insight into the situation in Serbia. Vet. Glas. 2021, 75, 132–144. [Google Scholar] [CrossRef]
  14. Plastic Europe. Plastics the Facts 2017. An Analysis of European Plastics Production, de Mand and Waste Data. Available online: https://www.plasticseurope.org/application/files/5715/1717/4180/Plastics_the_facts_2017_FINAL_for_website_one_page.pdf (accessed on 10 December 2023).
  15. Yadav, S.; Rai, S.; Srivastava, A.K.; Panchal, S.; Patel, D.K.; Sharma, V.P.; Jain, S.; Srivastava, J.P. Determination of pesticide and phthalate residues in tea by QuEChERS method and their fate in processing. Environ. Sci. Pollut. Res. 2017, 24, 3074–3083. [Google Scholar] [CrossRef]
  16. Carnol, L.; Schummer, C.; Moris, G. Quantification of six phthalates and one adipate in Luxembourgish beer using HS-SPMEGC/MS. Food Anal. Methods. 2017, 10, 298–309. [Google Scholar] [CrossRef]
  17. Kartalović, B.; Vranešević, J.; Petrović, J.; Ðurđević, B.; Ratajac, R. Detekcija ostataka mikroplastike-Razvoj metode za ftalate u medu. Arh. Vet. Med. 2021, 14, 19–33. [Google Scholar]
  18. Habschied, K.; Kartalović, B.; Lazić, D.; Krstanović, V.; Mastanjević, K. Survey on phthalates in beer packaged in aluminum cans, PET and glass bottles. Fermentation 2023, 9, 125. [Google Scholar] [CrossRef]
  19. SANTE. Analytical Quality Control and Method Validation Procedures for Pesticide Residues Analysis in Food and Feed SANTE 11312/2021. Available online: https://www.eurl-pesticides.eu/userfiles/file/EurlALL/SANTE_11312_2021.pdf (accessed on 5 October 2023).
  20. Spiric, A.; Trbovic, D.; Vranic, D.; Djinovic, J.; Petronijevic, R.; Matekalo-Sverak, V. Statistical evaluation of fatty acid profile and cholesterol content in fish (common carp) lipids obtained by different sample preparation procedures. Anal. Chim. Acta 2010, 672, 66–71. [Google Scholar] [CrossRef]
  21. Fromme, H.; Gruber, L.; Schlummer, M.; Wolz, G.; Boehmer, S.; Angerer, J.; Mayer, R.; Liebl, B.; Bolte, G. Intake of phthalates and di(2-ethylhexyl)adipate: Results of the integrated exposure assessment survey based on duplicate diet samples and biomonitoring data. Environ. Int. 2007, 33, 1012–1020. [Google Scholar] [CrossRef]
  22. Bopp, K.; Altkofer, W. Survey on intake of certain phthalic acid esters in South Germany: Comparative study of two boarding schools with conventional and organic nutrition. Dtsch. Lebensm. Rundsch. 2009, 105, 35–38. [Google Scholar]
  23. Fierens, T.; Servaes, K.; Van Holderbeke, M.; Geerts, L.; De Henauw, S.; Sioen, I.; Vanarmen, G. Analysis of phthalates in food products and packaging materials sold on the Belgian market. Food Chem. Toxicol. 2012, 50, 2575–2583. [Google Scholar] [CrossRef] [PubMed]
  24. Schecter, A.; Lorber, M.; Guo, Y.; Wu, Q.; Yun, S.H.; Kannan, K.; Hommel, M.; Imran, N.; Hynan, L.; Cheng, D.; et al. Phthalate concentrations and dietary exposure from food purchased in New York State. Environ. Health Perspect. 2013, 121, 473–479. [Google Scholar] [CrossRef] [PubMed]
  25. Arp, A.C.; Yerlikaya, P. Phthalate ester migration into food: Effect of packaging material and time. Eur. Food Res. Technol. 2020, 246, 425–435. [Google Scholar]
  26. Baranenko, D.; Boulkrane, M.S.; Borisova, I.; Astafyeva, B.; Lu, W.; Abd El-Aty, A.M. Translocation of phthalates from food packaging materials into minced beef. Front. Nutr. 2022, 8, 813553. [Google Scholar] [CrossRef]
  27. Wittassek, M.; Koch, H.; Angerer, J.; Brüning, T. Assessing exposure to phthalates-the human biomonitoring approach. Mol. Nutr. Food Res. 2011, 55, 7–31. [Google Scholar] [CrossRef] [PubMed]
  28. Horák, T.; Olšovská, J. Phthalates in beverages—A review. Kvas Prum. 2020, 66, 264–269. [Google Scholar] [CrossRef]
  29. Jarošová, A.; Bogdanovičová, S. Phthalate migration from packaging materials into food. Potravinarstvo 2015, 9, 275–279. [Google Scholar]
  30. Bogdanović, S.; Anđelković, H.; Kostić, S.; Kocić, M.; Anđelković, D. The effects of temperature and ultrasound on the migration of di-(2-ethylhexyl) phthalate from plastic packaging into dairy products. Bulg. Chem. Commun. 2019, 51, 242–248. [Google Scholar] [CrossRef]
  31. Guerreiro, T.M.; Oliviera, D.N.; Melo, C.F.O.R.; Lima, E.O.; Catharino, R.R. Migration from plastic packaging into meat. Food Res. Int. 2018, 109, 320–324. [Google Scholar] [CrossRef] [PubMed]
  32. Kida, M.; Koszelnik, P. Investigations of the presence and possible migration form microplastics of phthalic acid esters and polycylic aromatic hydrocarbons. J. Polym. Environ. 2021, 29, 599–611. [Google Scholar] [CrossRef]
  33. McGinnis, P.; Martinez, J.; Gadagbui, B.; Willis, A.; Lee, D.; Parker, A.; Vincent, M.; Thiel, S. Exposure Assessment: Potential for the Presence of Phthalates in Selected Plastics. CPSC Staff Statement on the Toxicology Excellence for Risk Assessment Report, pp. 1–101. 2015. Available online: https://www.cpsc.gov/s3fs-public/pdfs/ReportonPhthalatesinFourPlastics.pdf (accessed on 13 December 2023).
  34. Kim, S.; Kim, S.; Park, G.; Yoo, Y.J.; Jeong, J.S.; Nam, K.T.; Jee, S.; Lim, K.; Lee, Y. Di-2-ethylhexylphthalate promotes thyroid cell proliferation and DNA damage through activating thyrotropin-receptor-mediated pathways in vitro and in vivo. Food Chem. Toxicol. 2019, 124, 265–272. [Google Scholar] [CrossRef]
Figure 1. Smoked fish samples packaged in different materials.
Applsci 14 01660 g001
Figure 2. Chromatogram of a smoked fish sample. ** SIM mode of acquisition.
Applsci 14 01660 g002
Figure 3. Levels of DHPE (µg/kg) in smoked carp, trout and salmon after 6 months of storage in different packages.
Applsci 14 01660 g003
Table 1. Retention time, the limit of detection (LOD) and the limit of quantification (LOQ) for each analyzed phthalate.
PhthalateRetention Time (min) X ± SDLOD (µg/kg)LOQ (µg/kg)
Dimethyl phthalate6.08 ± 0.041.414.69
Diethyl phthalate7.19 ± 0.010.301.01
Diisobutyl phthalate9.17 ± 0.020.301.01
Dibutyl phthalate9.83 ± 0.050.301.01
Bis (2-ethylhexyl) phthalate13.19 ± 0.050.321.14
Di-n-octyl phthalate14.21 ± 0.050.311.10
Table 2. Levels of phthalates (µg/kg) in smoked carp, trout and salmon meat in control and experimental samples after 3 and 6 month of storage at −18 °C.
Smoked Fish
Species
Packaging MatherialTime of StoragePhtalathes (µg/kg)
DMPDEPDIBP
X ± SD
DBP
X ± SD
DEHP
X ± SD
DnOP
CarpControl-ND *ND23.25 a ± 1.0231.60 a ± 0.38157.69 a ± 0.91ND
CarpPET3 monthNDND25.31 a ± 0.3729.89 a ± 0.21158.51 a ± 0.42ND
CarpPET6 monthNDND30.85 b ± 0.1933.22 a,c ± 0.57187.25 b ± 0.39ND
CarpHDPE3 monthNDND25.49 a ± 1.1729.30 a ± 0.18158.67 a ± 0.36ND
CarpHDPE6 monthNDND39.16 c ± 0.2343.34 b ± 0.26162.36 a ± 1.1ND
CarpLDPE3 monthNDND24.30 a ± 0.4430.68 a ± 0.40156.50 a ± 0.46ND
CarpLDPE6 monthNDND31.84 b ± 0.3532.26 a ± 0.37159.34 a ± 0.88ND
CarpPP3 monthNDND23.89 a ± 0.2433.64 a,c ± 0.25155.61 a ± 0.71ND
CarpPP6 monthNDND33.18 b ± 0.5837.82 c ± 0.44157.72 a ± 0.75ND
CarpPAPE3 monthNDND23.51 a ± 0.5431.54 a ± 0.36154.72 a ± 0.60ND
CarpPAPE6 monthNDND38.57 c ± 0.3446.68 b ± 0.39182.36 b ± 1.01ND
CarpBio HDPE3 monthNDND30.49 b ± 0.2737.69 c ± 0.39221.74 c ± 1.13ND
CarpBio HDPE6 monthNDND40.97 c ± 0.3545.82 b ± 0.27230.73 c ± 1.05ND
TroutControl-NDND33.44 b ± 0.2732.78 a,c ± 0.23172.89 a,b ± 0.54ND
TroutPET3 monthNDND34.93 b ± 0.6432.08 a ± 0.45208.68 c,d ± 0.65ND
TroutPET6 monthNDND39.87 c ± 0.6545.21 b ± 0.43215.85 c ± 1.05ND
TroutHDPE3 monthNDND32.80 b ± 0.8932.01 a ± 0.42180.63 b ± 0.47ND
TroutHDPE6 monthNDND38.86 c ± 0.7633.35 a ± 0.58181.51 b ± 0.38ND
TroutLDPE3 monthNDND31.87 b ± 0.2532.28 a ± 0.44180.90 b ± 0.70ND
TroutLDPE6 monthNDND34.72 b ± 0.342.62 b ± 0.71191.59 b,d ± 0.77ND
TroutPP3 monthNDND34.56 b ± 0.3833.65 a,c ± 0.54169.75 a,b ± 0.42ND
TroutPP6 monthNDND34.69 b ± 0.5837.66 c ± 0.23171.57 a,b ± 0.77ND
TroutPAPE3 monthNDND34.19 b ± 0.6137.68 c ± 0.55183.64 b ± 0.66ND
TroutPAPE6 monthNDND42.21 c ± 0.3842.94 b ± 0.89198.62 d ± 0.57ND
TroutBio HDPE3 monthNDND31.96 b ± 0.7335.53 a,c ± 0.76192.13 b,d ± 0.69ND
TroutBio HDPE6 monthNDND35.19 b,c ± 0.5345.96 b ± 0.71233.54 c ± 0.90ND
SalmonControl-NDND29.76 b ± 0.4342.26 b ± 0.57167.06 a,b ± 0.63ND
SalmonPET3 monthNDND29.26 b ± 0.5548.65 b,d ± 1.08172.48 a,b ± 1.23ND
SalmonPET6 monthNDND57.26 e ± 0.9250.16 d ± 1.01210.61 c ± 1.11ND
SalmonHDPE3 monthNDND27.14 a,b± 0.6339.25 c,b ± 0.57172.10 a,b ± 0.87ND
SalmonHDPE6 monthNDND37.49 b,c ± 1.2647.16 b,d ±0.54194.0 b,d ± 1.02ND
SalmonLDPE3 monthNDND28.16 a,b ± 0.5441.57 b ± 1.11 a166.27 a,b± 0.59ND
SalmonLDPE6 monthNDND50.95 d ± 0.6044.84 b ± 0.83213.01 c± 1.06ND
SalmonPP3 monthNDND28.32 a,b ± 0.2844.03 b ± 0.34 a167.38 a,b ± 0.54ND
SalmonPP6 monthNDND30.57 b ± 0.8744.81 b ± 0.77 a174.22 a,b ± 0.56ND
SalmonPAPE3 monthNDND45.49 d ± 0.6241.15 b ± 0.79 a185.48 b ± 1.33ND
SalmonPAPE6 monthNDND73.77 f ±1.2878.45 e ± 1.18253.56 e ± 1.23ND
SalmonBio HDPE3 monthNDND36.88 b,c ± 0.6740.92 c,b ± 0.93200.9 d ± 1.19ND
SalmonBio HDPE6 monthNDND45.86 d ± 0.8747.40 b,d ± 1.27248.37 e ± 0.44ND
* Not detected: <LOQ; a–f Means with different indexes in the same column are significantly different (p < 0.05).
Disclaimer/Publisher’s Note: The statements, opinions and data contained in all publications are solely those of the individual author(s) and contributor(s) and not of MDPI and/or the editor(s). MDPI and/or the editor(s) disclaim responsibility for any injury to people or property resulting from any ideas, methods, instructions or products referred to in the content.

