Article

Design of Indoor Visible Light Communication PAM4 System

1
Faculty of Automation and Information Engineering, Xi’an University of Technology, Xi’an 710048, China
2
Shaanxi Civil-Military Integration Key Laboratory of Intelligence Collaborative Networks, Xi’an 710126, China
3
College of Physics and Electronics, Shaanxi University of Technology, Hanzhong 723001, China
*
Author to whom correspondence should be addressed.
Appl. Sci. 2024, 14(4), 1663; https://doi.org/10.3390/app14041663
Submission received: 14 January 2024 / Revised: 8 February 2024 / Accepted: 10 February 2024 / Published: 19 February 2024
(This article belongs to the Section Optics and Lasers)

Abstract

:
Four-level pulse amplitude modulation (PAM4) can transmit more information in the same symbol interval, effectively improving the information transmission rate and frequency band utilization of visible light communication (VLC). This paper proposes a method for encoding and decoding the PAM4 signal based on FPGA. The PAM4 signal is studied and analyzed under different channel noise models. The research results show that the bit error rate (BER) performance of the PAM4 signal is the best under the additive noise model. The influence of the multiplicative noise on the BER of the PAM4 signal is much greater than that of the additive noise. The BER performance of the PAM4 signal depends on the variance of the noise data. The greater the variance, the worse the BER performance. At the same time, an indoor VLC system based on PAM4 is designed. The simulation results verify that the system scheme is feasible and provides a way to further realize high-speed signal transmission.

1. Introduction

Visible light communication (VLC) is a new type of wireless communication technology that has emerged in recent years [1,2]. It uses light emitting diode (LED) light sources for high-speed modulation, uses light as a carrier to transmit signals, and takes into account communication and lighting functions. It has the advantages of energy saving and environmental protection, no electromagnetic radiation, and low cost [3,4], which has attracted people’s attention. In addition to meeting the basic communication, the VLC system must also consider the communication rate and frequency band utilization. With the improvement of the technical level, the demand for high-speed and high-bandwidth transmission systems is gradually increasing, so it is necessary to improve the communication rate while meeting the performance requirements. At present, the indoor VLC system mostly uses on-off keying (OOK), pulse position modulation (PPM), and pulse interval modulation (PIM) [5,6]; the transmission efficiency of OOK is too low, and it is not suitable for a high-speed transmission system. PPM modulation has good anti-noise ability and has been used in optical communication systems for a long time. The Ke research group at the Xi’an University of Technology systematically analyzed PPM.
In recent years, high speed has been the main requirement of the current communication system, and the upper limit of communication rate can be increased by increasing the modulation order. Compared with the above three modulation methods, four-level pulse amplitude modulation (PAM4) can transmit more bit information in the same symbol; its information transmission rate per unit band is high and has higher spectral efficiency [7]. Under the same communication rate conditions, PAM4 can also reduce inter-symbol interference, thereby reducing the bit error rate (BER) [8] and making full use of frequency band resources. Research in the field of communication has achieved results. In 2016, Zuo used equalization technology implementation of PAM4 signal transmission in 100 m fiber at a transmission rate of 155 Gb/s [9]. In 2017, Laverencik realized the transmission of laser light in optical fiber at high speed and used PAM4 as the modulation method, and the BER was less than 10−12 [10]. In 2019, Yu used PAM4 as the main modulation method for the communication system and combined it with equalization technology. Through experimental verification, a high-speed transmission system based on PAM4 was finally realized [11]. In 2020, Guo designed a dual-mode 32 Gb/s receiver that can simultaneously operate in NRZ and PAM4 modes [12]. In 2021, Wei used the DSP development board to design a VLC system based on PAM4 through the combination of software and hardware. The author successfully completed the communication verification experiment, and the BER met the communication system requirements [13]. The research on PAM4 at home and abroad is mainly developing rapidly in the direction of high speed and high bandwidth, and most of them are used in the field of optical fiber communication. There are relatively few studies on the use of PAM4 technology in indoor VLC. Therefore, the study of the encoding and decoding of the PAM4 signal in indoor VLC systems has certain significance and application value.
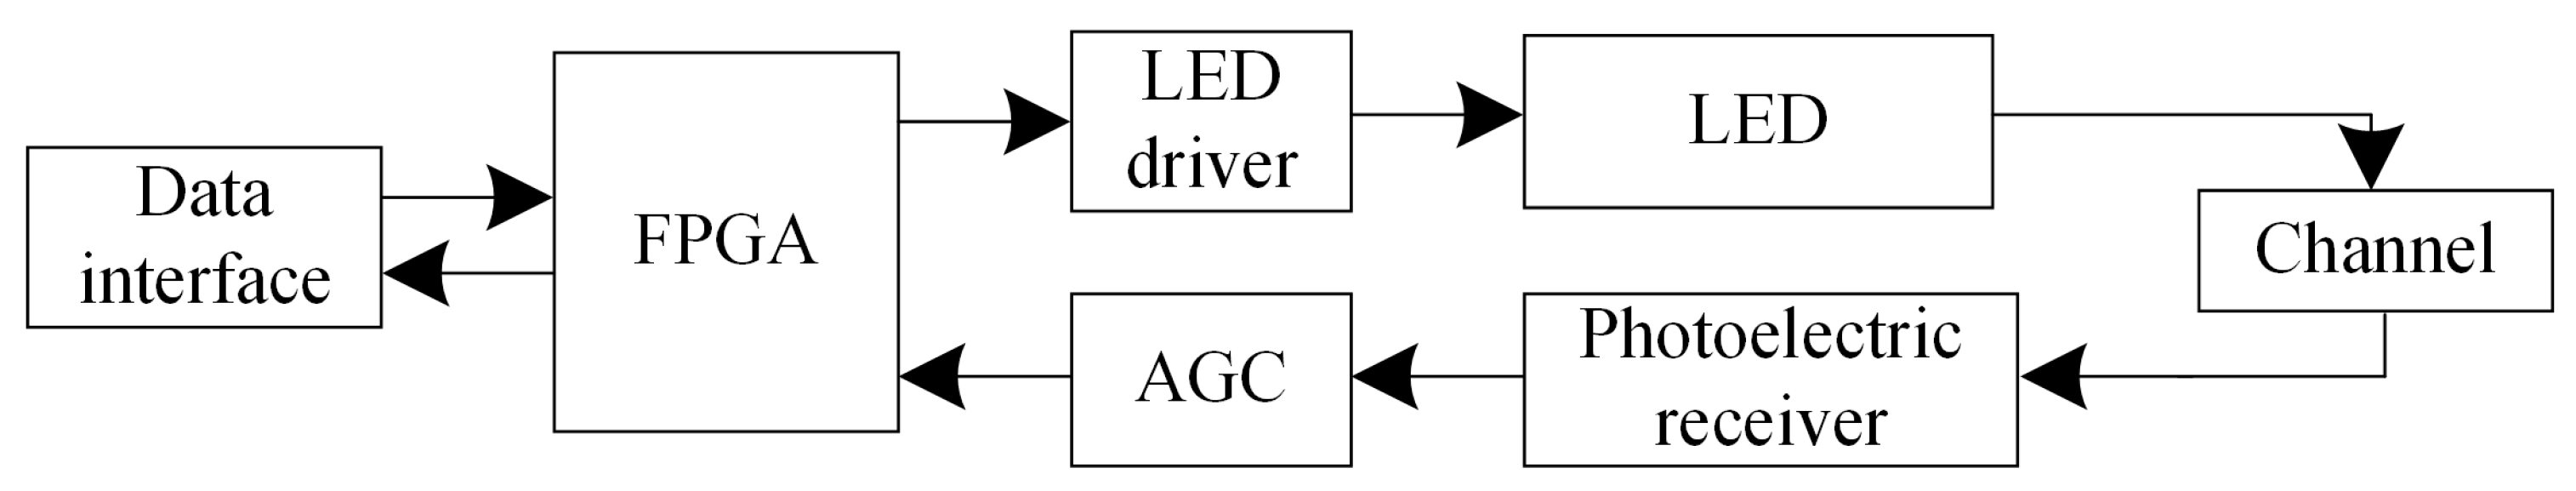
This paper focuses on the design scheme of the key parts of the system and studies and analyzes the BER performance of the PAM4 signal under different channel noise models. The results show that the BER performance of the PAM4 signal depends on the variance of the noise data. The greater the variance, the worse the BER performance. The BER performance in the case of the multiplicative noise is much larger than the BER in the case of the additive noise. The main reason is that the multiplicative noise is caused by the time-varying and nonlinearity of the system, reflecting the fading of the channel, while the additive noise generally refers to the background noise of the system. The field programmable gate array (FPGA) development board with EP4CE10 FPGA chip as the core is used to verify the communication system, which verifies the feasibility of the system scheme. In addition, the system has high programmability and is easy to debug and develop with subsequent system upgrades.

2. Theoretical Basis

Most VLC systems are designed as intensity modulation/direct detection (IM/DD) systems. OOK is the easiest modulation method to implement in an IM/DD system, but the transmission efficiency of OOK is too low [14], while PAM4 can transmit 2 bits of information per waveform, effectively improving the communication rate and modulation efficiency, which can meet the requirements of high transmission efficiency. Under the same transmission rate, the bandwidth utilization of PAM4 is higher than that of OOK, PPM, and DPPM. Table 1 shows the bandwidth requirements of four modulation methods [15], where Rb refers to the transmission rate, and M refers to the modulation order. As can be seen from Table 1, in the case of the same transmission rate, PPM requires the largest bandwidth, followed by DPPM, and PAM requires the smallest bandwidth. Therefore, the bandwidth utilization rate of PAM is higher than that of the other three methods, with higher spectral efficiency, and the data transmission rate is the highest under the same bandwidth requirements. As the order M of PAM increases, the bandwidth utilization rate and data transmission rate will also increase, but the anti-noise performance of the system will gradually deteriorate, and the required hardware will also increase its complexity [16,17,18].
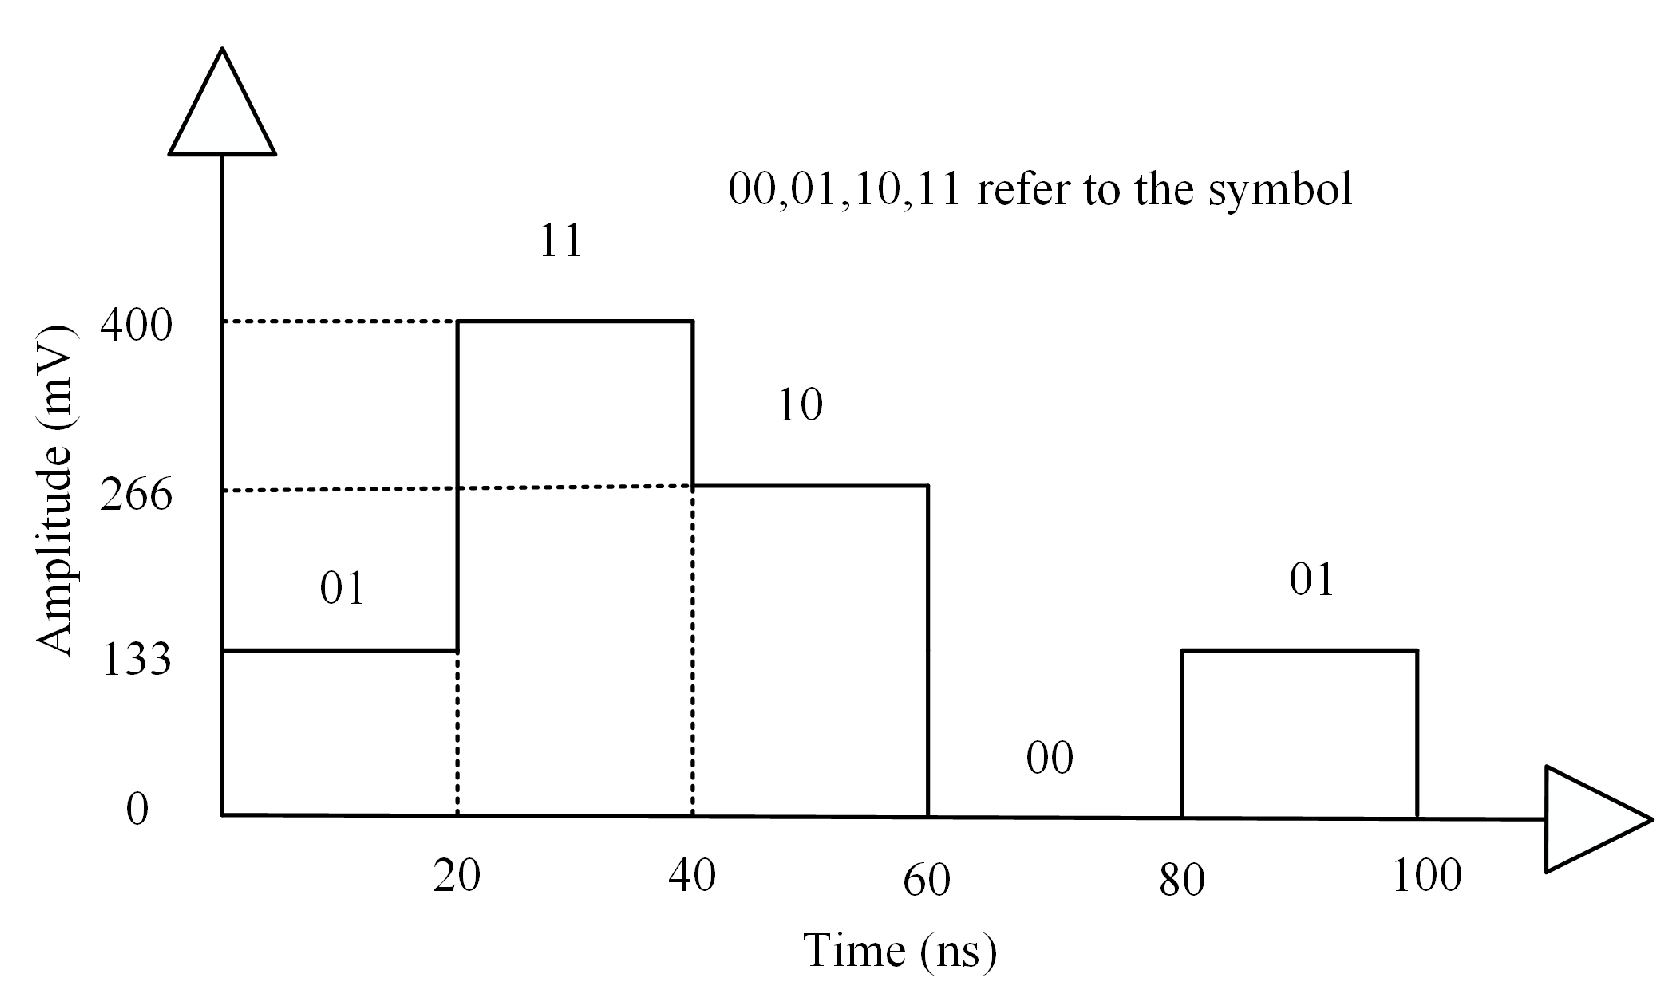
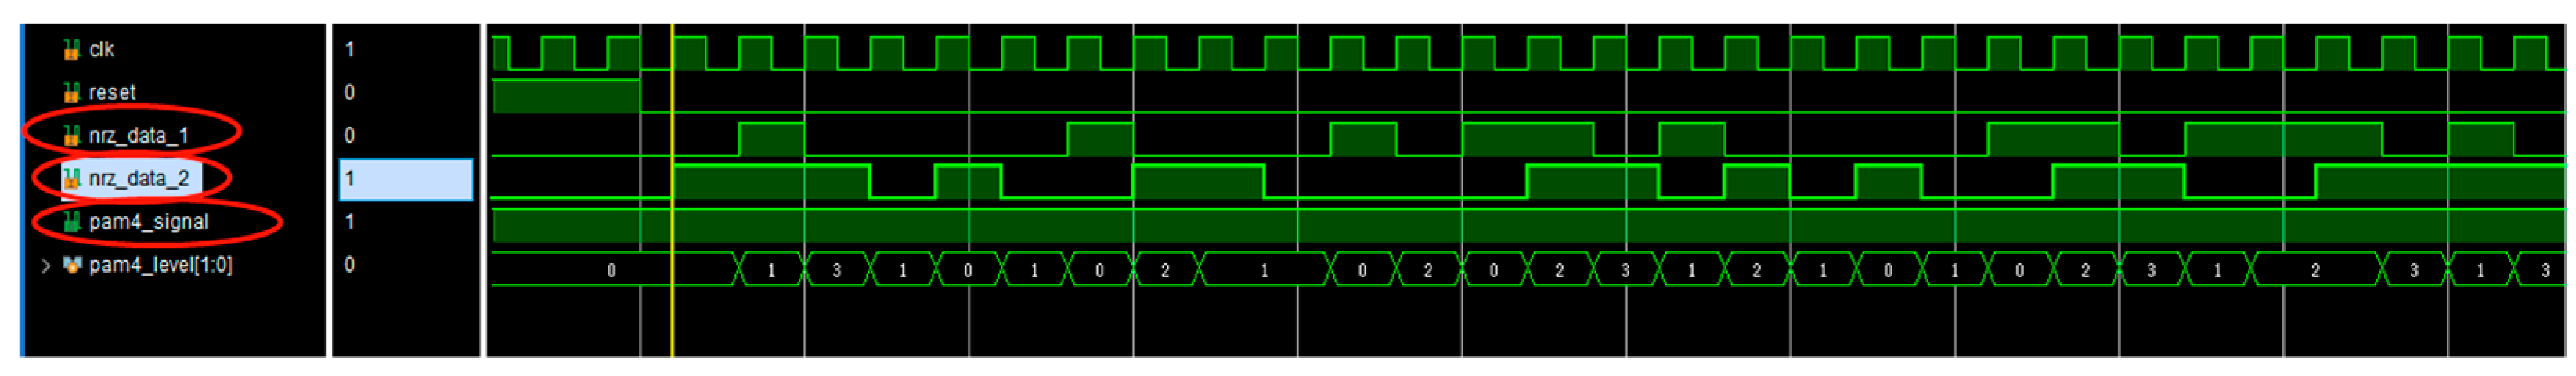
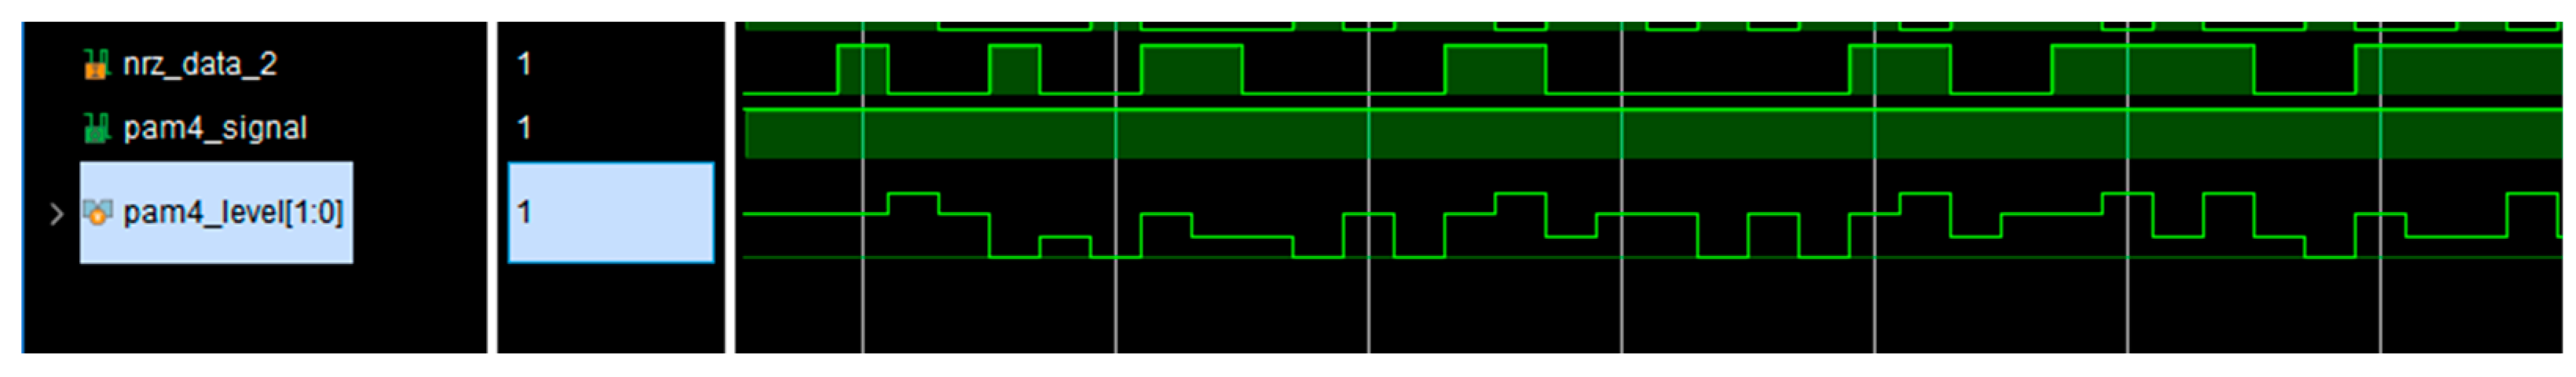
PAM4 uses periodic pulses as the carrier, and the symbol information of the source controls the amplitude of the pulse. The waveform diagram of the PAM4 signal is shown in Figure 1, and four different amplitudes control different symbol information.
For the PAM4 signal, its waveform is expressed as [19]:
s m ( t ) = A m p ( t ) ,   0 t T ,   m = 1 , 2 , 3 , 4
where T is the pulse duration, which is called the symbol interval, t is the time, p(t) is the rectangular pulse with duration T, and Am is the amplitude of the m-th waveform, which is expressed as:
A m = ( 2 m 5 ) d ,   m = 1 , 2 , 3 , 4
where d is half the Euclidean distance between adjacent levels. p(t) is defined as:
p ( t ) = 1 / T
Therefore, the energy of the pulse p(t) is normalized to 1. From Equation (1), it can be seen that the energy of the PAM4 signal is [14]:
ε m = + A m 2 p 2 ( t ) d t = A m 2 ε p
where ε p is the energy of the rectangular pulse p(t). From this, the average energy of the PAM4 signal can be obtained as:
ε a v g = ε p 4 m = 1 4 A m 2 = 2 ε p 4 [ 1 2 + 3 2 ] = 5 d 2 ε p = 5 d 2
Since the PAM4 signal only modulates the amplitude, the constellation map of the PAM4 signal only has values on the in-phase component, and the signal points are all located on the in-phase component. Therefore, the PAM4 map belongs to the one-dimensional real constellation map, and the Euclidean distance d min of any pair of adjacent signal points is [14]:
d min = s m s n 2 = | A m A n | ε p = 2 ε p = 2 1 5 ε a v g = 2 d
where ε a v g is the average energy of the PAM4 signal. S n and S m represent the energy values of any two adjacent signal points. It can be seen from Equation (6) that the Euclidean distance obtained is exactly the same as the expression of Equation (2). Since the amplitude of the PAM4 signal cannot be negative in VLC, and the amplitude of the PAM4 signal has no fixed value, it can be adjusted appropriately to meet the demand, so the amplitude after PAM4 encoding is set to 0, 1, 2, and 3.
Assuming that the transmission channel is equivalent to the AWGN channel. From the above analysis, it can be seen that the average BER P e is [19]:
P e = 1 4 m = 1 4 P [ e r r o r | m ] = 1 4 [ 6 Q ( 2 d 2 N 0 ) ] = 3 2 Q ( 2 ε a v g 5 N 0 ) = 3 2 Q ( 2 5 S N R )
where P [ e r r o r | m ] is the probability of error at each level, N 0 is the noise power, SNR is the signal-to-noise ratio (SNR), and the expression of the Q function is:
Q ( x ) = 1 2 π x e t 2 2 d t
Assuming that the channel noise model is a Gaussian mixture model (GMM), its conditional probability density function (PDF) is [20]:
P ( r | s i ) = j = 1 K ( ε j 2 π σ n j 2 ) exp { ( r { μ n j ( 1 ) i ε b 5 } / 2 σ n j ) 2 }
where s i is the transmitted symbol, ε b is the average bit energy, μ n j is the mean, σ n j is the variance, ε j is the weight value of the GMM, then the BER is [20]:
P e _ G M M = 3 4 j = 1 K ε j { Q [ ( ε b 5 + μ n j ) / σ n j ] + Q [ ( ε b 5 μ n j ) / σ n j ] }
SNR is given by Equation (11) [20]:
S N R = 10 log { ε b / [ ( 1 ε ) σ n 1 2 + ε σ n 2 2 ] }
Assuming that the channel noise model is a lognormal model, if the transmitted signal energy is E b , the received signal energy is h 2 E b . At this time, the SNR at the receiving end becomes ( h 2 E b ) / N 0 . The BER can be obtained by Equation (7) [19]:
P e _ L N = 3 2 Q ( 2 E b 5 N 0 h 2 )
where h reflects the channel state and conforms to the lognormal distribution. Since h is a random variable, there is:
P e _ L N = 3 2 0 Q ( 2 E b 5 N 0 h 2 ) f ( h ) d h
where f (h) refers to the PDF of the lognormal distribution.
In the VLC system, the transmitting end must maintain synchronization with the receiving end [
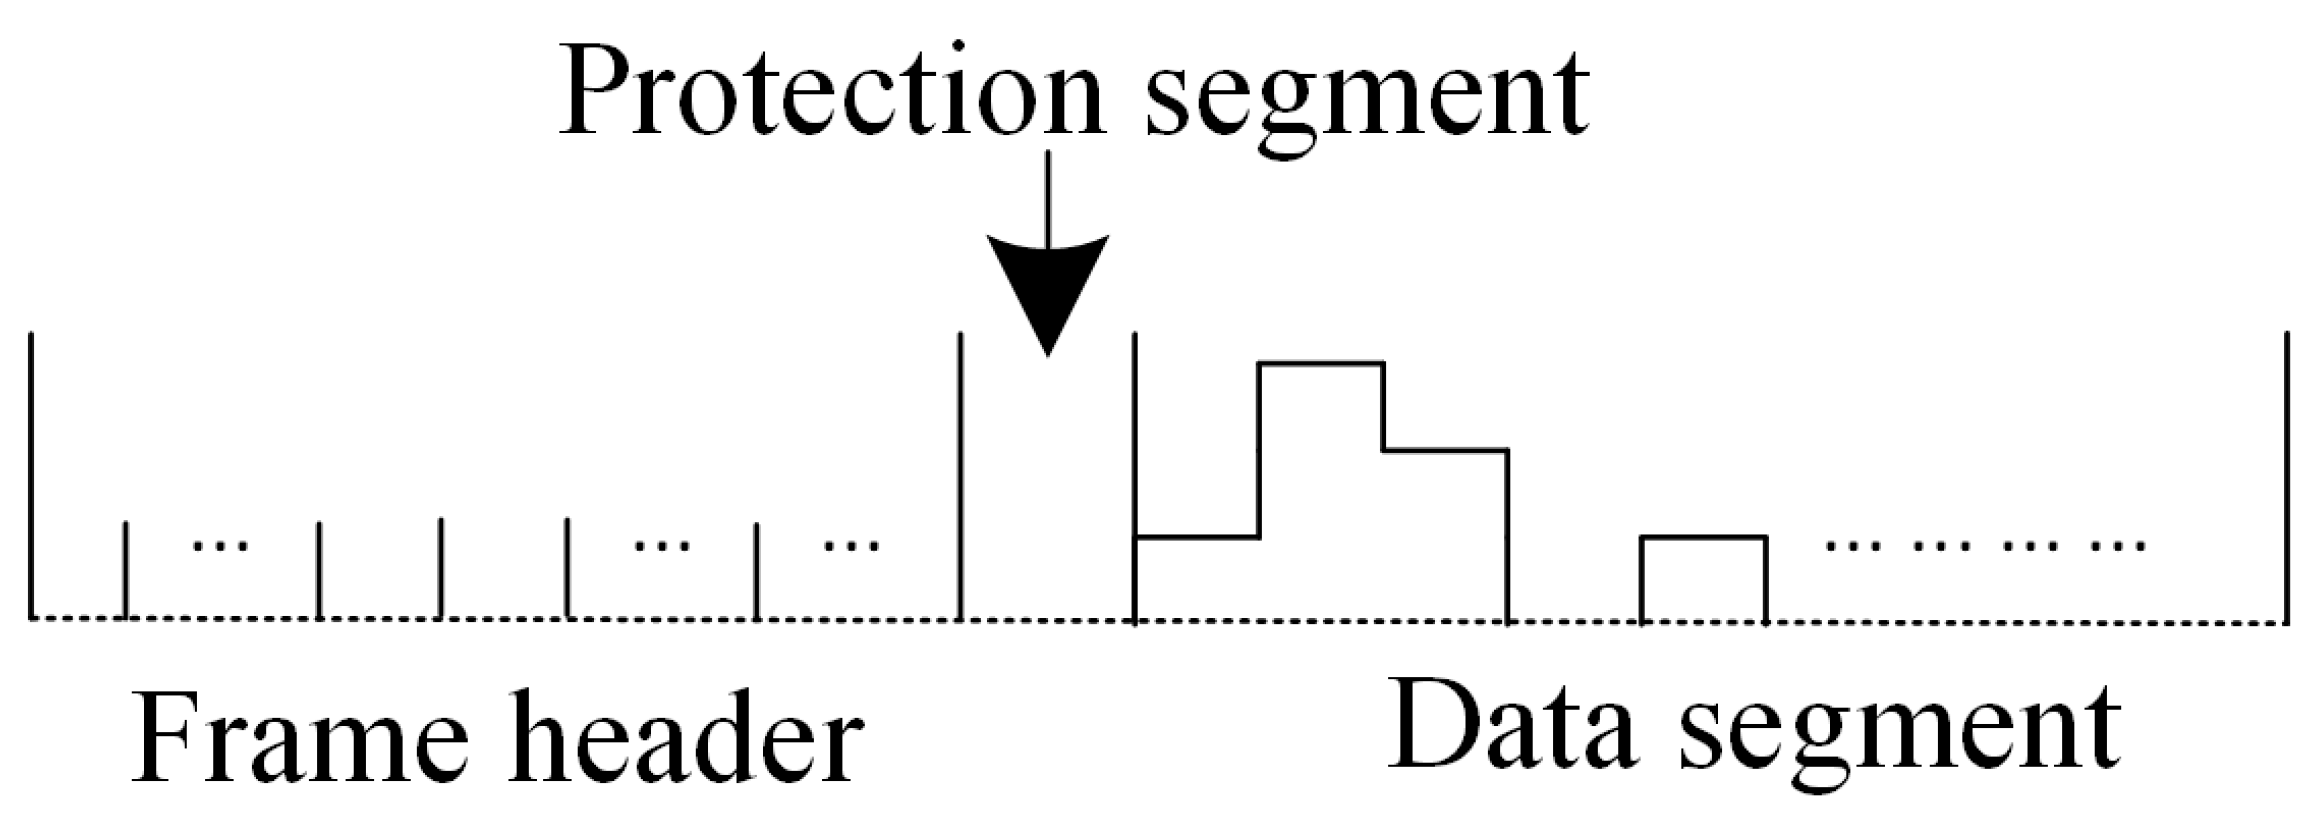
21]. The data must be sent in the format of a frame after being encoded by PAM4. The system inserts a Barker code sequence as a frame synchronization signal at the head of the PAM4 data, thereby forming a PAM4 data frame and then sending the data out. The format of the PAM4 data frame is shown in Figure 2. The data segment of PAM4 contains multiple sets of PAM4 data. The function of the protection segment is to provide the system with enough time to calculate the relevant parameters. In this paper, gray coding and 8b/10b coding are added before the PAM4 coding. The purpose is to minimize the error rate of symbols during transmission according to the coding rules of gray coding and 8b/10b coding. 8b/10b coding encodes 8 bits data into 10 bits data. By increasing the redundancy of information, the coding is more reliable, and the security of information transmission is improved.
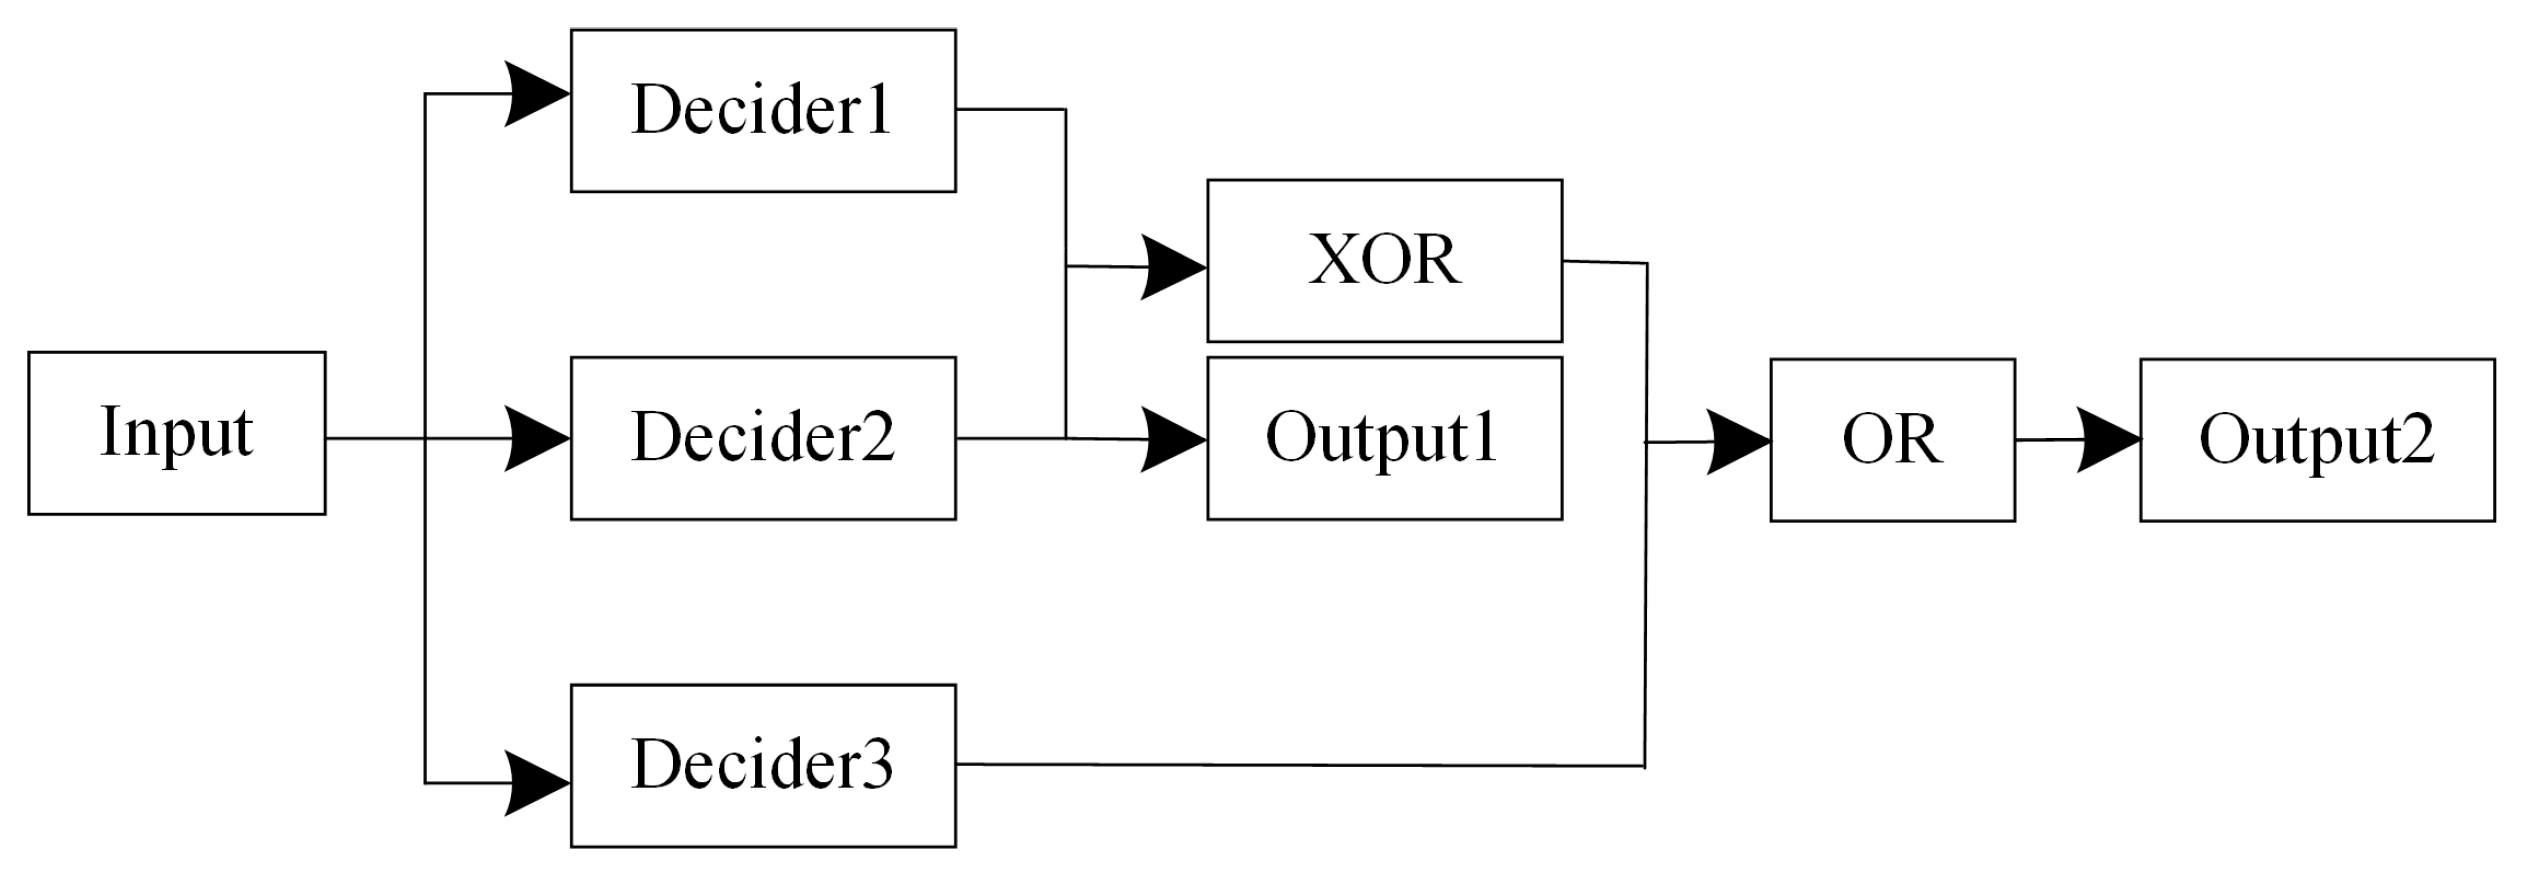
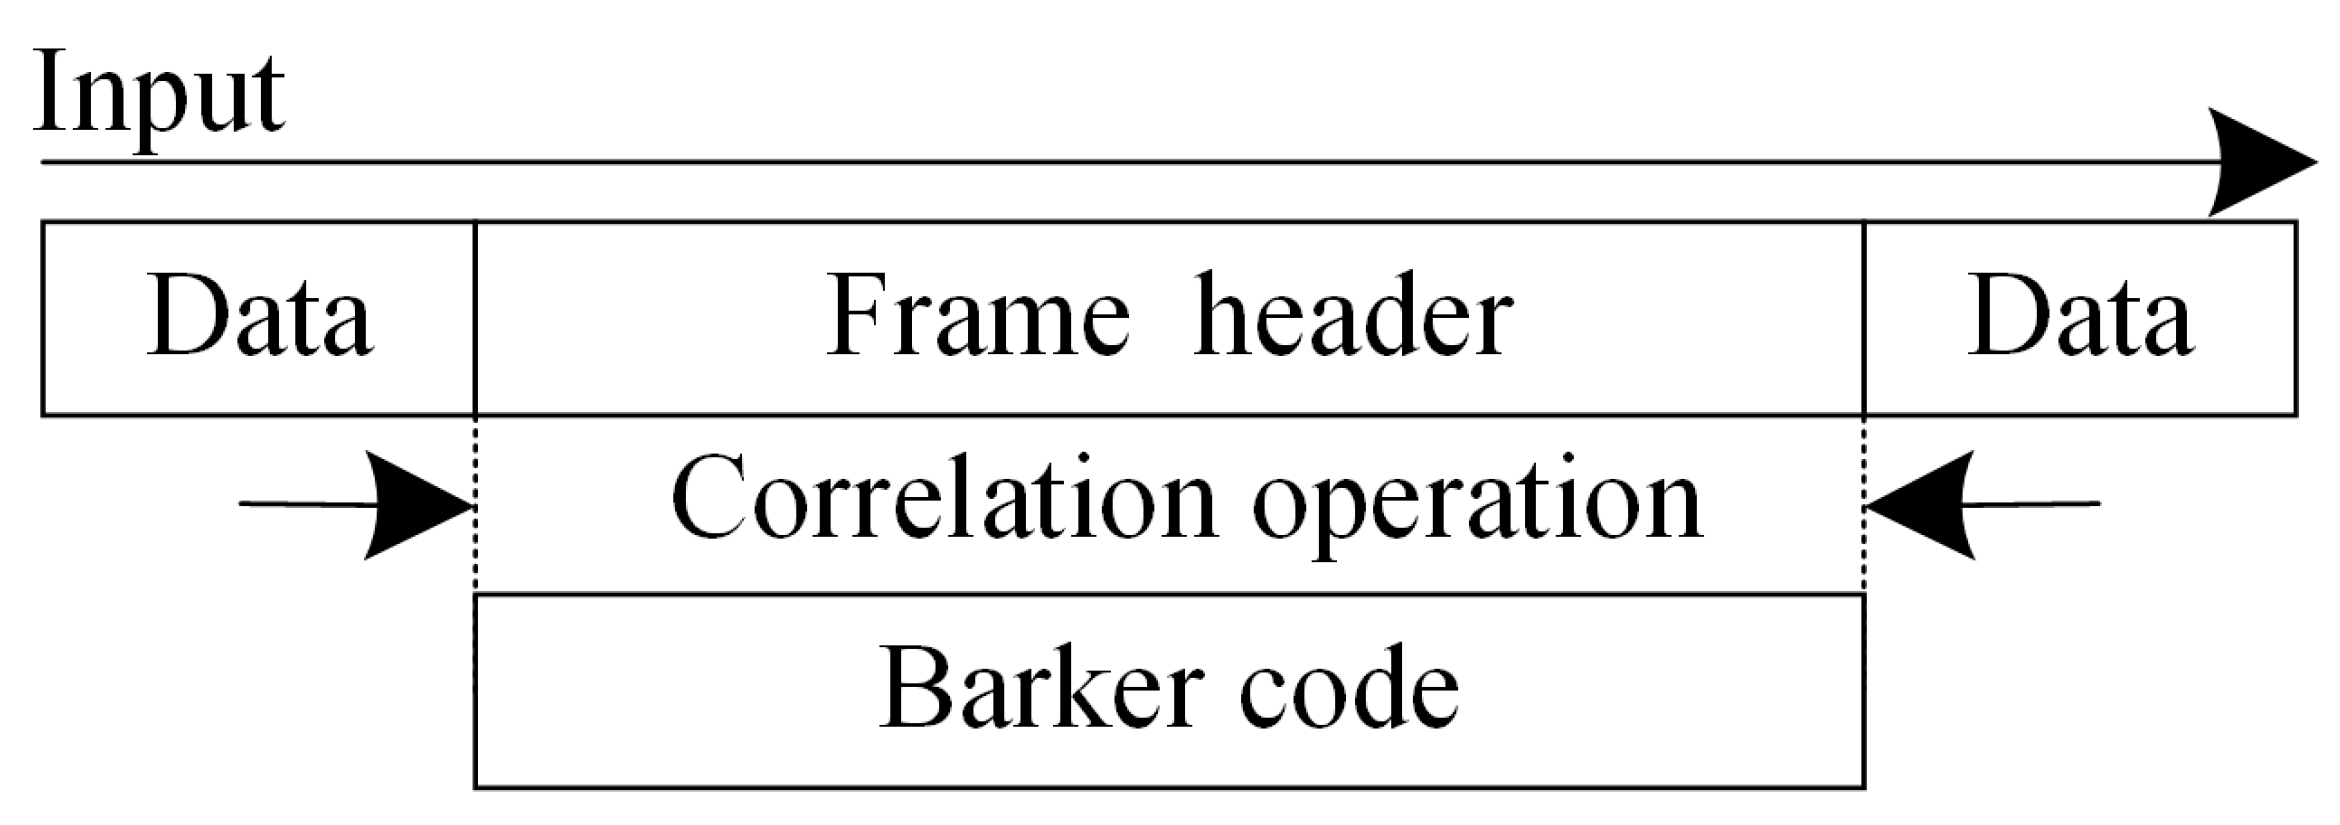
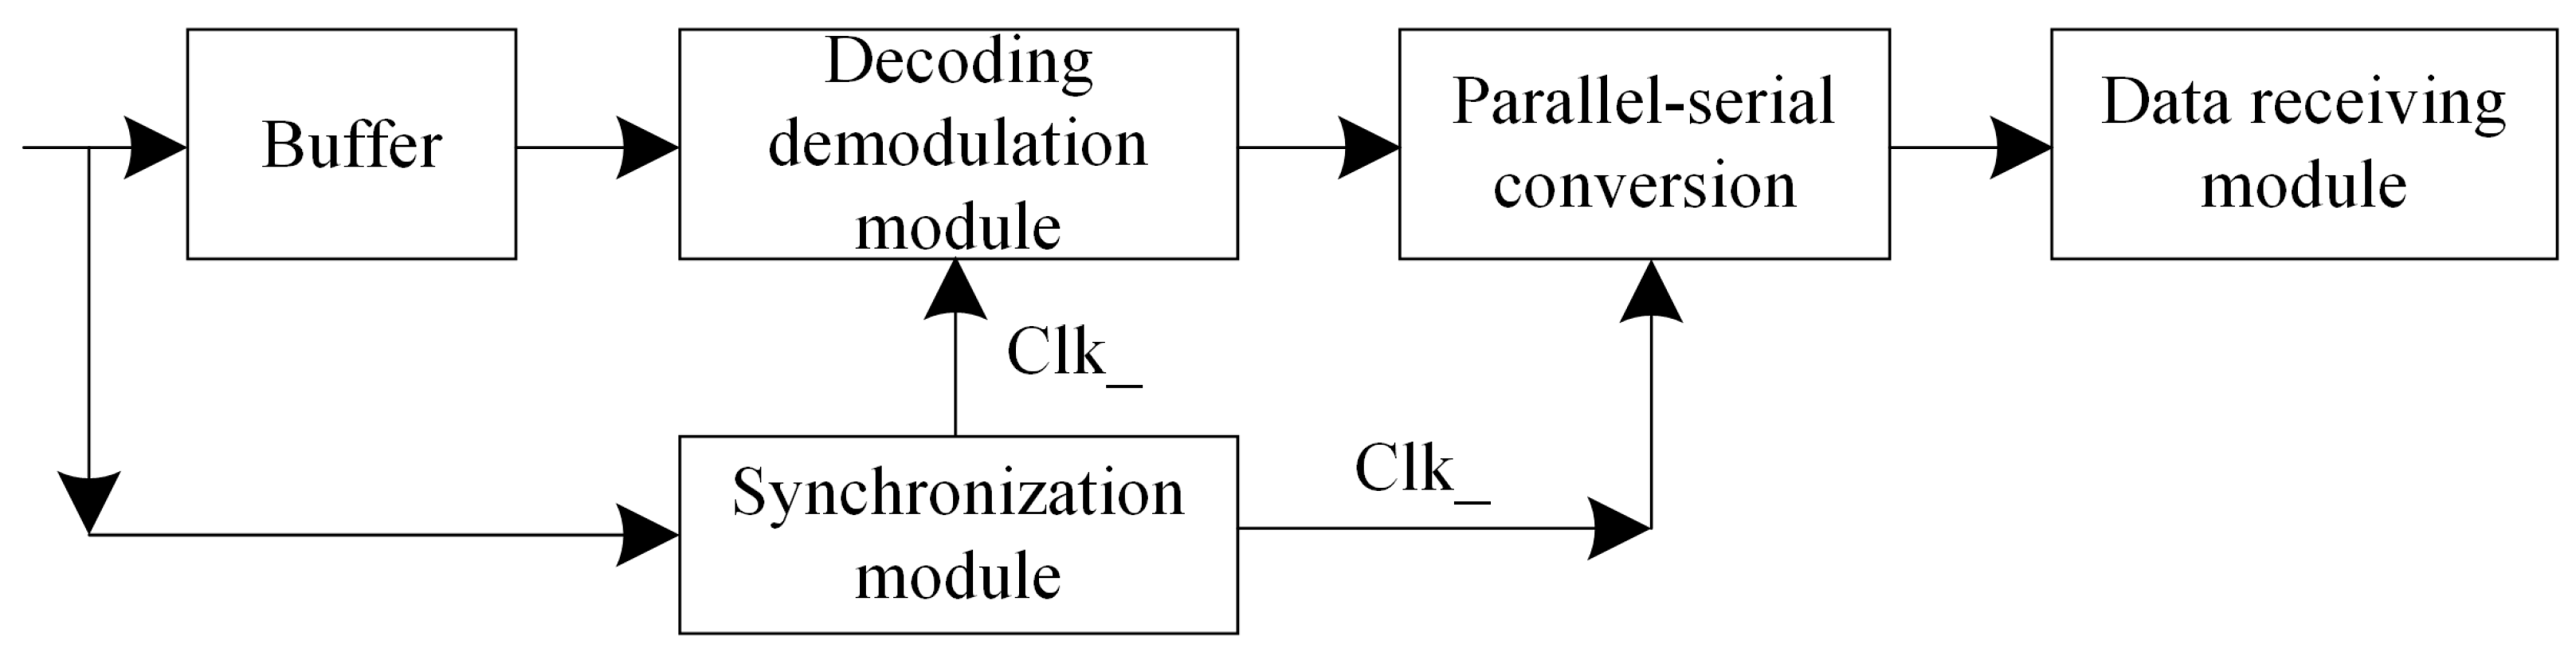
When there is data input at the receiving end, the data is first stored in the buffer, and then the data is judged. When the data is equal to the frame synchronization data, it is considered that the frame header is detected, and the data can be received. This process is called frame synchronization. Frame synchronization is realized by designing a Barker code correlator. In order to successfully decode the original data source, the clock data must be restored, which requires extracting the clock signal from the PAM4 signal to make a correct judgment on the data at the sampling time. This process of recovering the clock signal is called bit synchronization. After bit synchronization recovery using the lead-lag bit synchronization method, PAM4 decoding is performed according to the clock signal to recover the source data.

3. Key Component Design

3.1. PAM4 Encoding and Decoding

In order to generate the PAM4 signal, the coding scheme of the PAM4 signal designed in this paper is shown in Figure 3. The scheme uses two non-return-to-zero (NRZ) codes to generate the PAM4 signal. There are generally two kinds of binary code stream information for sending data, namely logic “0” and logic “1”. For logic “0”, choose a lower amplitude level to act as the least significant bit (LSB); for logic “1”, choose a higher amplitude level to act as the most significant bit (MSB) and superimpose the two channels of NRZ signals to obtain the PAM4 signal. Note that before superimposing, the two NRZ codes must be clock synchronized; otherwise, the signal waveform will be mutated due to different delays.
The decoding scheme is shown in Figure 4. Three deciders are designed according to the amplitude of the PAM4 signal at the receiving end. By comparing the set threshold values, the corresponding symbol information is determined. The rules of the decider are: when the amplitude of PAM4 is greater than the threshold value of the decider, the output logic “1”; when the amplitude of PAM4 is smaller than the threshold value of the decider, the output logic “0”. The output of the decider2 is taken as the output1, the decider1 and the decider2 perform an “exclusive OR” operation, and the output obtained is then “OR” with the output of the decider3 to obtain the output2, and then complete the decoding and recovery of the two NRZ signals. In Figure 4, the threshold value of the decider1 is the smallest, and the threshold value of the decider3 is the largest.
In order to verify the accuracy of the decoding scheme, we assume that the four amplitudes of the PAM4 signal are 0, 1, 2, and 3, then the three decision threshold values are set to 0.5, 1.5, and 2.5, respectively, NRZ1 is “0 1 0 1 0 1 0 1”, and NRZ2 is “0 1 0 0 1 0 1 0”. The output PAM4 signal is “00 11 01 10 00 11 01 10”. This PAM4 signal is brought into Figure 4 as input, and the symbol output values of each part are shown in Table 2. It can be seen from the table that the output of the decider2 is exactly NRZ1, and the result of the output2 is “0 1 1 0 1 1 0”, which is NRZ2, so two NRZ codes can be recovered.

3.2. Bit Synchronization

In order to recover the source data and ensure the reliable transmission of information, the receiving end must know the start and end time of the symbol and make a decision at the best decision clock, that is, the intermediate moment of the received symbol. The process of extracting the decision clock is bit synchronization, also known as symbol synchronization. This paper uses a lead-lag phase detector to recover the bit-synchronous clock signal. The principle of the lead-lag synchronization method is shown in Figure 5. This is a closed-loop feedback system composed of four parts, namely a phase detector, a controller, a crystal oscillator, and a frequency divider. First, the phase of the input signal and the phase of the clock signal output by the local crystal oscillator are compared through the phase detector to determine whether the phase relationship between the two is ahead or behind. The controller will generate a corresponding control signal and output it to the frequency divider according to the judgment result of the phase relationship. The frequency divider adjusts the phase of the input in real-time. Finally, the phase of the output signal is compared with the phase of the input signal. If the same, the output of the phase signal. If not the same, then repeat the above process again so that the phase tracking and adjustment of the input signal can be achieved, and finally, the phase of the input signal is consistent with the bit synchronization clock signal.

3.3. Frame Synchronization

Frame synchronization is obtained by processing the frame synchronization header, which will directly affect the correctness of the subsequent PAM4 decoding results. Barker codes have good autocorrelation and cross-correlation characteristics, which can provide better synchronization performance and anti-noise ability. In order to decode the data correctly, we must determine the start time of each frame, which requires detecting the synchronization header. The detection of the frame synchronization header needs to use the “correlation method,” the principle of which is shown in Figure 6.
First, the input needs to be moved to the shift register, and then, by sliding the input and bit-by-bit detection, determine whether the output value of the shift register is consistent with the standard Barker code. If it is consistent, the correlation value is increased by 1; otherwise, it is decreased by 1. Then, the Barker code frame header is determined by judging whether the final correlation value is greater than the set threshold. When the correlation value of the input signal to be detected satisfies the threshold condition, the output signal is 1; otherwise, it is 0. Finally, the frame synchronization signal is obtained, and the position value of the frame synchronization header is 1. The correlation operation in Figure 6 refers to the multiplication and addition operation. When the Barker code is related to the frame data, the output value is small, and when it is related to the frame synchronization header, the output value is large.

3.4. FPGA Overall Design

The encoded PAM4 frame data needs to be converted into an analog signal by a digital-to-analog conversion (DAC) circuit, and then the PAM4 signal carrying the original data is processed by the LED driver circuit and sent out in the form of an optical signal through the LED lamp. After the optical signal sent by the LED is transmitted to the receiving end through the channel, the photoelectric receiving circuit first receives the optical signal and converts it into a voltage signal. At the same time, the signal is amplified and filtered. The processed signal is adjusted to the appropriate range by the automatic gain control (AGC) circuit to facilitate subsequent decoding. Then, the analog signal is converted into a digital signal by the analog-to-digital conversion (ADC) circuit, and then the FPGA development board performs synchronization and decoding operations to restore the source data. The design block diagram is shown in Figure 7, in which the data interface includes an asynchronous serial interface, a universal serial bus (USB) interface, and an audio interface. The FPGA development board integrates functions such as coding and modulation, demodulation and decoding, synchronization, DAC, and ADC.
The software structure diagram of the sending end is shown in Figure 8. The local crystal oscillator generates the clock signal, sending the data through the data-sending module. After that, the serial data stream is converted to parallel data. The FIFO buffers the data first-in, first-out, and then encodes and modulates the data. At the same time, a control signal is the output to control the buffer for the next operation, and then a frame synchronization header is added to the encoded data, and finally, the data is sent out.
The software structure diagram of the receiving end is shown in Figure 9. The received PAM4 signal needs to be restored by the synchronization module for bit synchronization clock signal and frame synchronization determination, and then the data is decoded. At the same time, it is converted into serial data through parallel serial conversion and received by the receiving module.
The whole software design mainly includes four modules: the data sending and receiving module, encoding module, decoding module, and synchronization module. Each module is composed of a series of algorithm functions. The encoding module completes gray coding, 8b/10b coding, and PAM4 coding. The decoding module completes the corresponding decoding operation. The synchronization module includes a bit synchronization module and a frame synchronization module. The bit synchronization module extracts the clock synchronization signal from the received PAM4 signal through a phase-locked loop. The frame synchronization module uses a Barker code correlator to determine the starting position of the frame header of the PAM4 data frame.

4. Modulation Characteristic Analysis

The noise sources of an intensity modulation/direct detection (IM/DD) optical communication system mainly include background optical noise, receiver noise, and light-intensity flicker noise caused by turbulence [22]. The noise after the background light passes through the receiver can be equivalent to Gaussian noise. The dark current and thermal noise of the receiver can be regarded as a Gaussian random process, obeying the Gaussian distribution [23]. The background optical noise and receiver noise can be regarded as additive noise. The light-intensity flicker noise caused by turbulence is much lower than the signal frequency and belongs to low-frequency multiplicative noise. Therefore, the mathematical model of the equivalent noise of the communication channel and the receiver can be expressed as [24]:
y ( t ) = h ( t ) x ( t ) + n ( t )
where x(t) is the transmitted signal, n(t) is the additive white Gaussian noise, y(t) is the receiver output signal, the multiplicative noise h(t) is the channel state information, and h(t) obeys the lognormal distribution in the case of weak turbulence, and its PDF is [25]:
f I ( h t ) = 1 2 π σ x 2 1 2 h t exp [ ( ln h t 2 μ x ) 2 8 σ x 2 ]
where ht is the channel fading coefficient, the state information of the reaction channel, and μ x , σ x is its mean and variance. According to the literature [26], σ x 2 can be expressed as [26]:
σ x 2 = 1.23 C n 2 k 7 / 6 l 11 / 6 4
where C n 2 is the atmospheric refractive index structure constant, k = 2 π / λ represents the wavenumber, λ is the wavelength of light, and l is the transmission distance. For a random noise process N with a K-component Gaussian mixed distribution, the PDF is defined as [27]:
f N G M ( n ) = j = 1 K ε j f j = j = 1 K ε j N ( μ n j , σ n j ) = j = 1 K ε j 2 π σ n j 2 exp [ { ( n μ n j ) / 2 σ n j } 2 ]
where ε j is the weight coefficient of the j-th component, and f j = N ( μ n j , σ n j ) is the PDF of the Gaussian distribution. It can be seen that the Gaussian mixture model (GMM) is actually the weighted sum of K Gaussian noise, so the GMM is still an additive noise. Since the average value of the detection output signal of the squared law of the optical field must be greater than 0, the Gaussian white noise with a mean value of 0 cannot accurately characterize the additive noise characteristics of the optical channel. Ke proposed a noise model fitted with a double Gaussian function, which we call Ke’s model [28], whose PDF is defined as:
f ( x ) = ε 1 × 1 2 π σ 1 × e ( ( x μ 1 ) 2 2 σ 1 2 ) + ε 2 × 1 2 π σ 2 × e ( ( x μ 2 ) 2 2 σ 2 2 )
where ε 1 , ε 2 are the weight coefficients, ranging from 0 to 1, and μ 1 , μ 2 , σ 1 , and σ 2 are the mean and variance of the noise model.
In this section, we study and analyze the BER performance of the PAM4 encoded signal in the case of the additive noise, the multiplicative noise, and the additive multiplicative mixed noise and compare the performance.

4.1. Additive Noise

We study and analyze the additive noise data measured in Xi’an, Beijing, Kaifeng, Guangzhou, Harbin, and Changchun and obtain the additive noise parameters using the data fitting method. The parameters are shown in Table 3, Table 4, Table 5, Table 6, Table 7 and Table 8, where ε 1 refers to the weight value of the GMM, μ refers to the mean value, and σ refers to the variance.
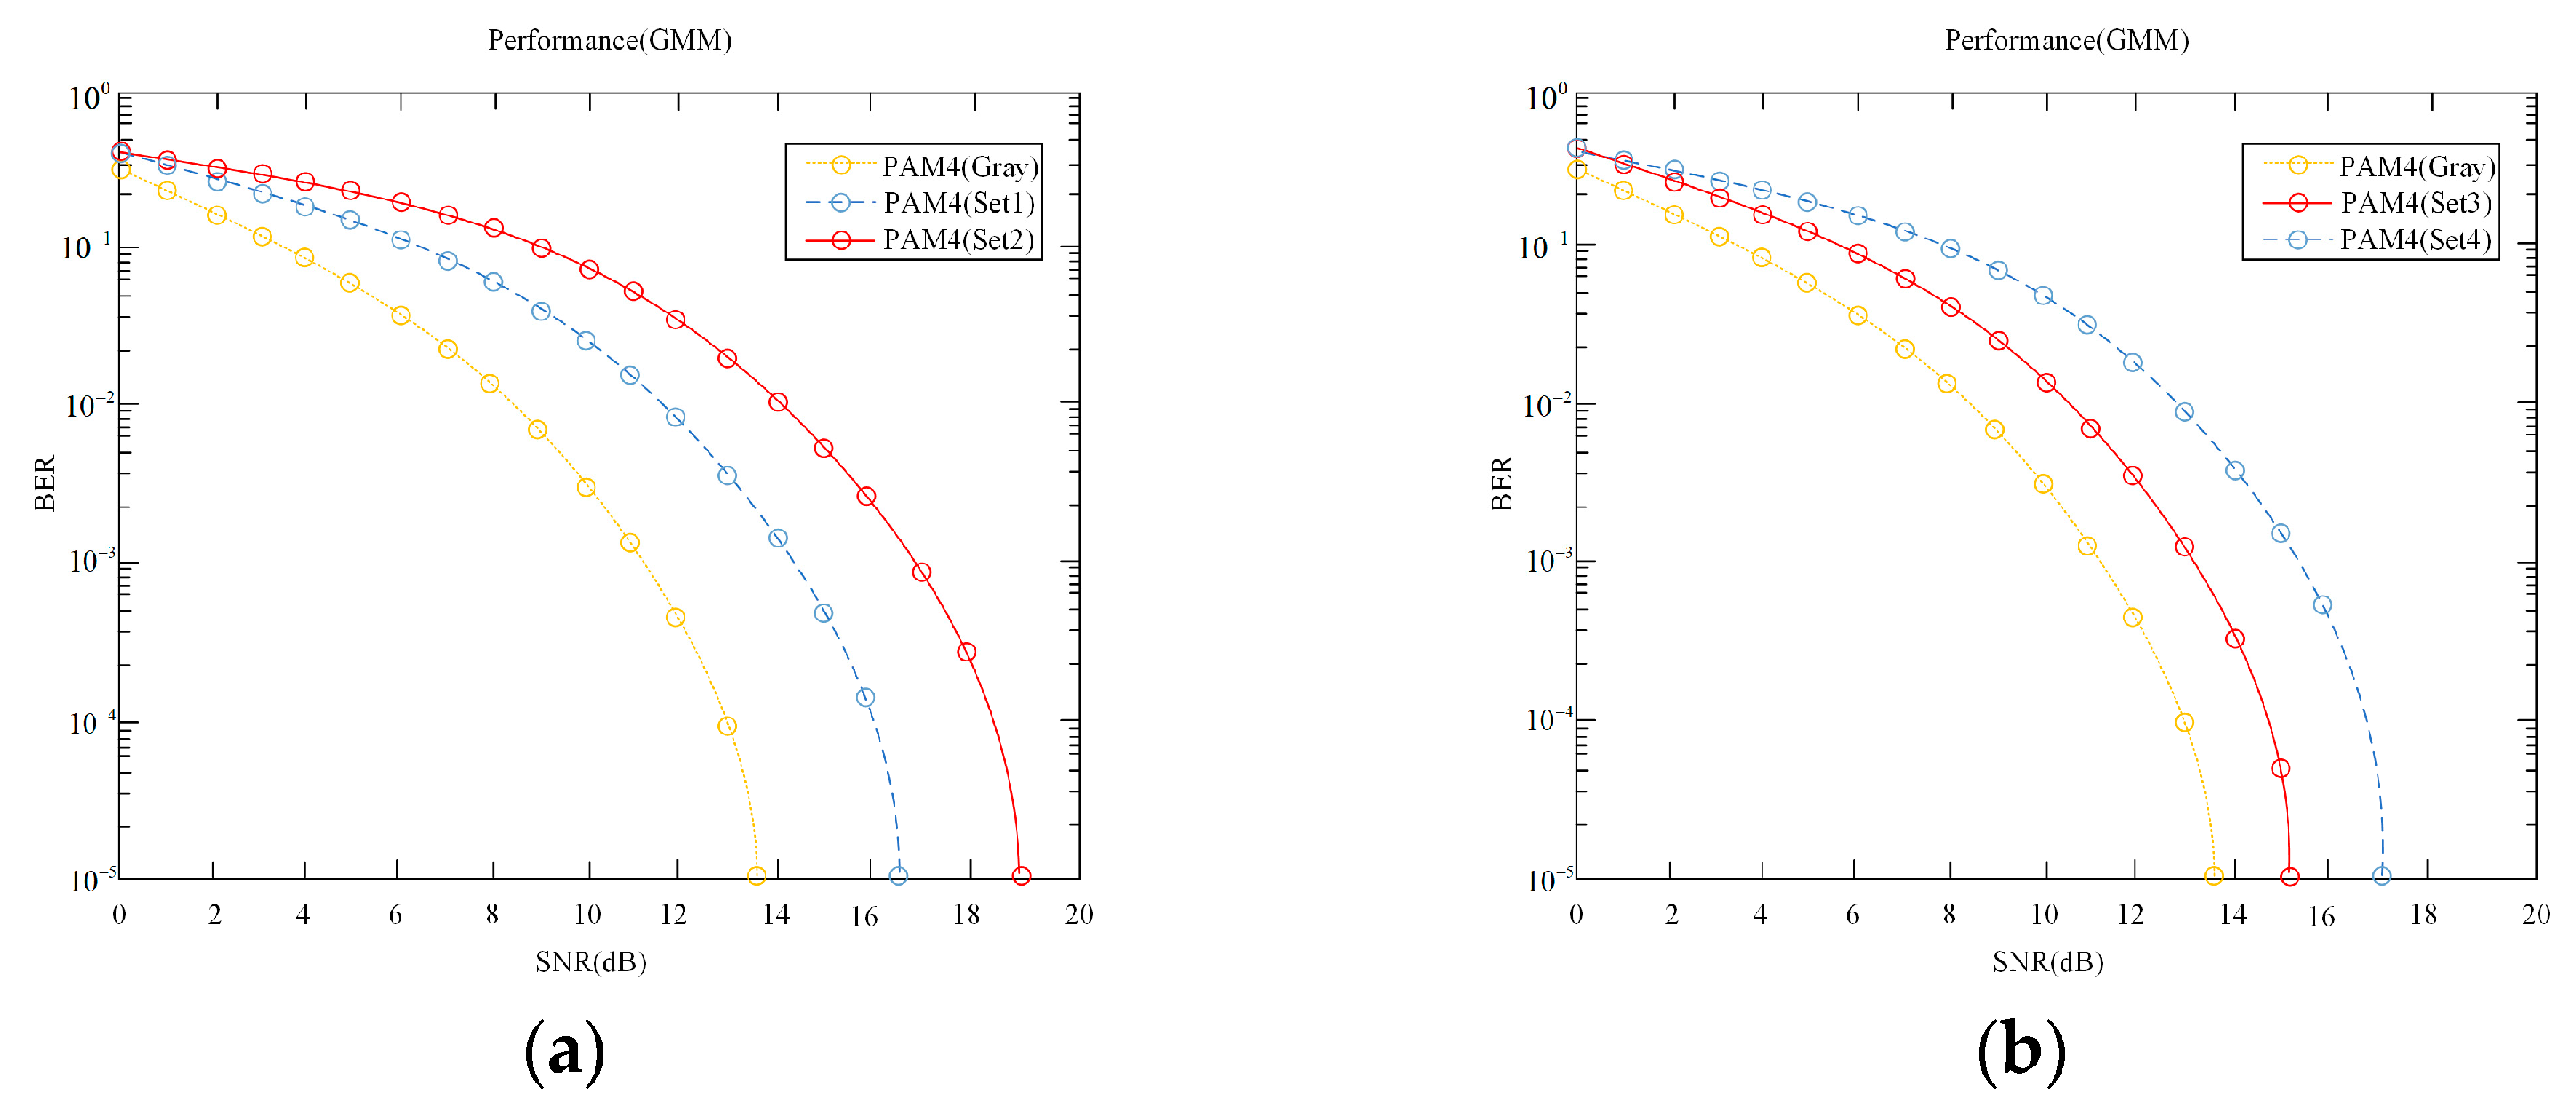
We first analyze the noise data Set 1 and Set 2 in Xi’an. Through numerical calculation and the BER and SNR formulas of Equations (10) and (11), the BER performance results of PAM4 are obtained, as shown in Figure 10a. The yellow line in Figure 10 is the BER performance in the case of AWGN. As can be seen from Figure 10a, for the BER of 10−5, using the noise data Set 1 and the noise data Set 2, PAM4 requires a SNR of 16.6 dB and 18.9 dB, respectively, while using the white Gaussian noise only needs a SNR of 13.8 dB to achieve the same BER performance. Therefore, the impact of GMM noise on the BER of PAM4 is greater than that of white Gaussian noise. For different GMM noise parameters, the performance decreases by 2.8 dB and 5.1 dB, respectively. At the same time, it can be seen from the setting of the parameters of the noise data Set 1 and the noise data Set 2. With the increase in parameters σ GMM , the BER performance deteriorated.
The BER performance of the noise data Set 3 and Set 4 in Beijing is shown in Figure 10b, as can be seen from Figure 10b, for the BER of 10−5, using the noise data Set 3 and noise data Set 4, the PAM4 requires a SNR of 15.1 dB and 17.2 dB respectively, The white Gaussian noise only needs a SNR of 13.8 dB, for different GMM noise parameters, the performance decreased by 1.3 dB and 3.4 Db, respectively, comparing the noise data Set 1, Set 2 and noise data Set 3, Set 4 can be seen, the higher the value of σ GMM , the worse the BER performance, because as the value of σ GMM increases, the greater the variance of the noise data, the higher the dispersion of the noise, the greater the fluctuation, the greater the impact on the original data source, and the BER will increase under the same SNR.
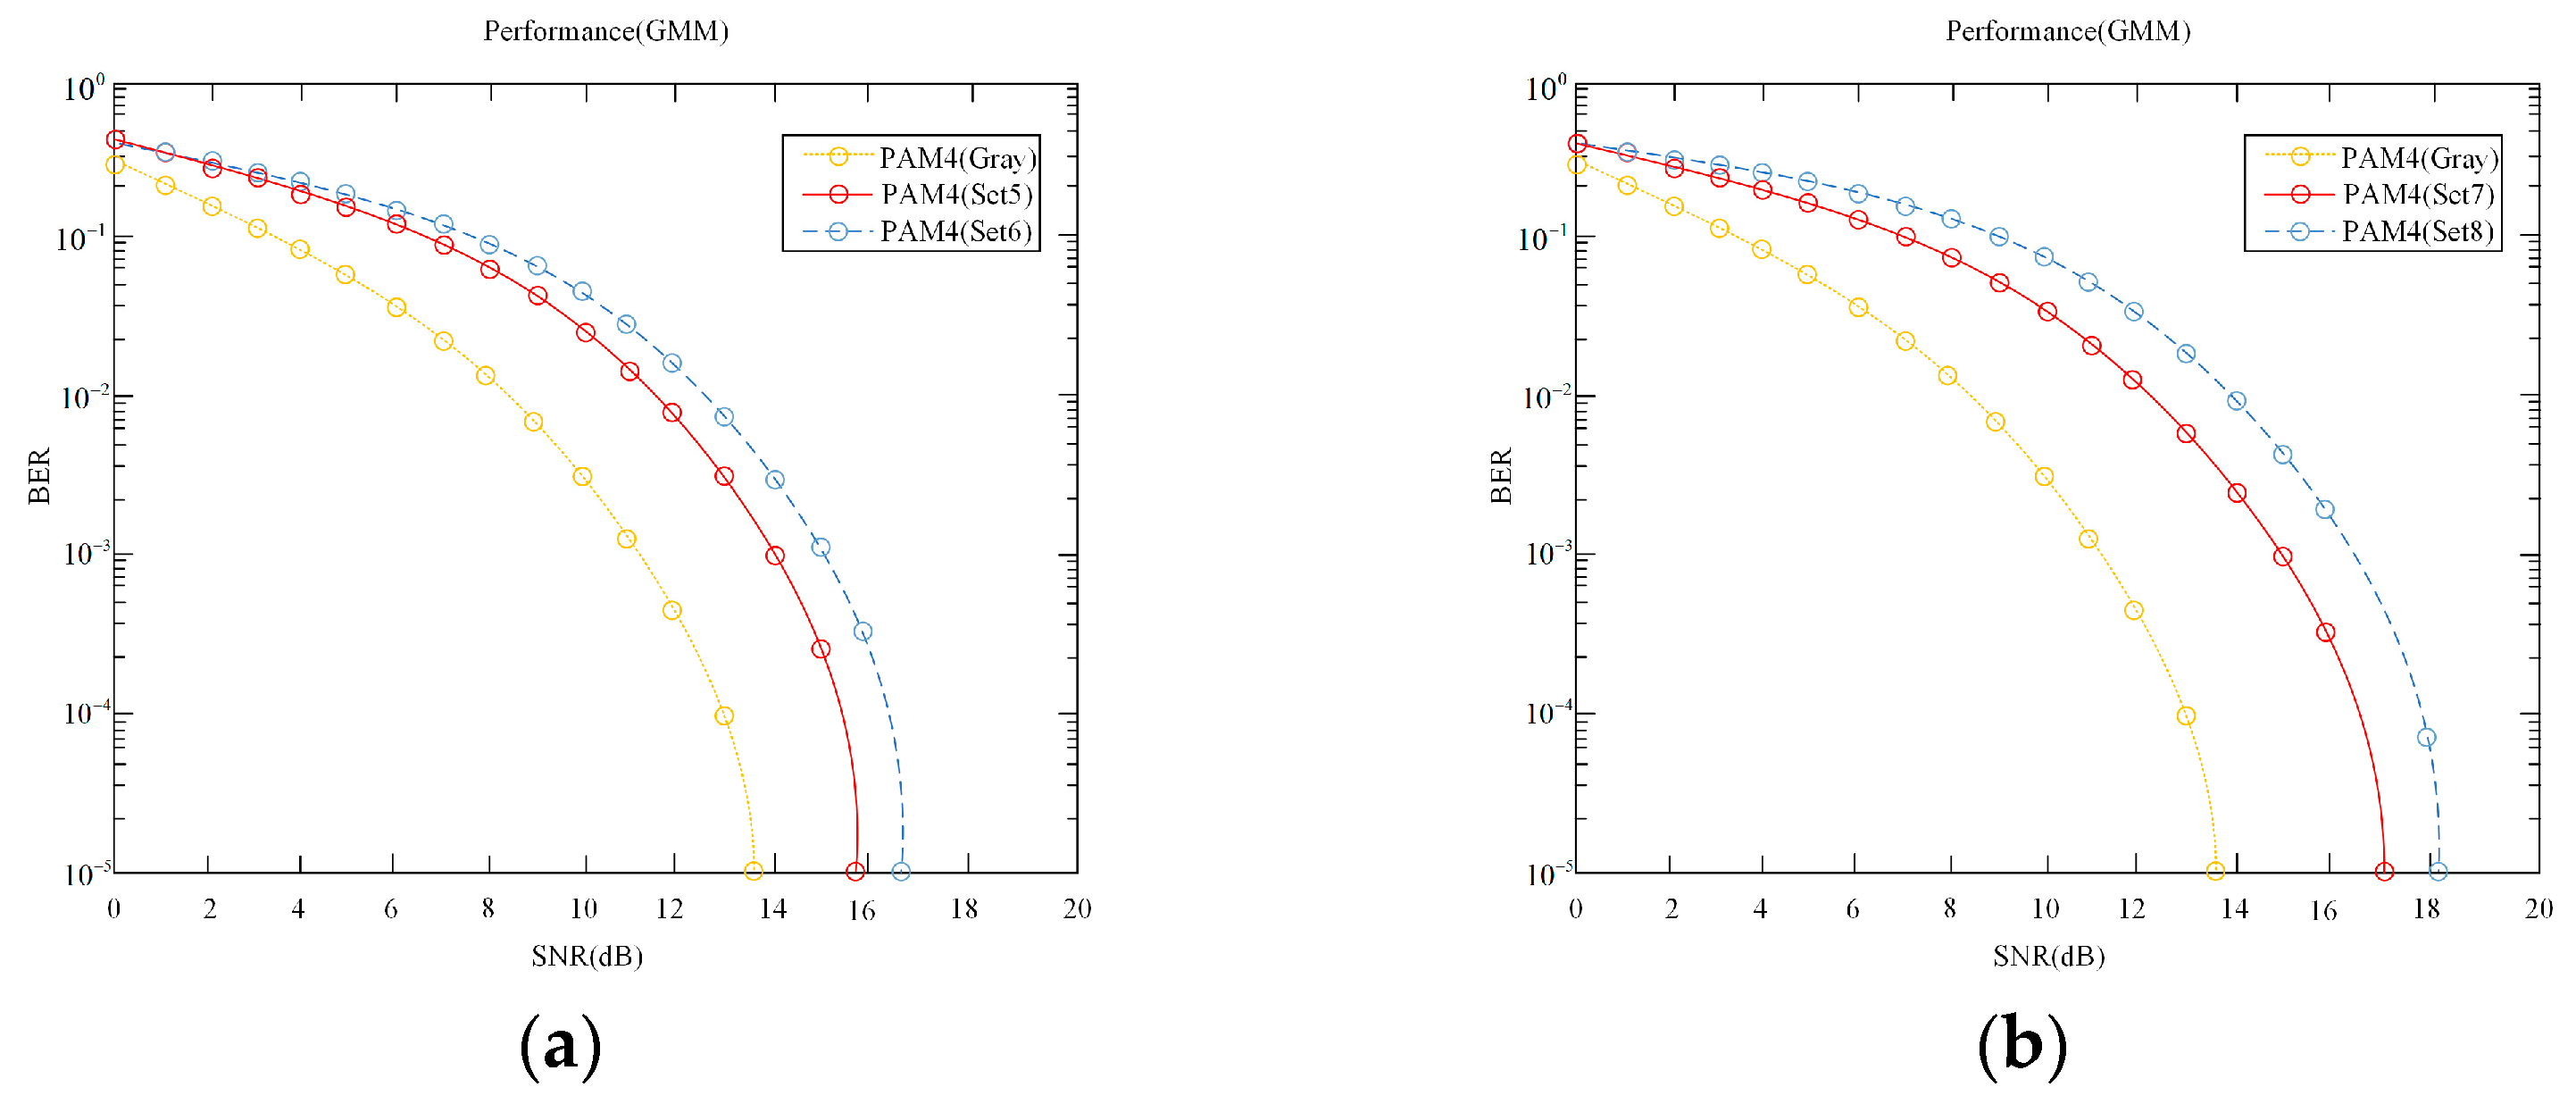
The BER performances of the noise data Set 5 and Set 6 in Kaifeng are shown in Figure 11a. It can be seen from Figure 11a that for the BER of 10−5, using the noise data Set 5 and the noise data Set 6, the PAM4 requires a SNR of 15.8 dB and 16.6 dB, respectively. The white Gaussian noise only needs a SNR of 13.8 dB. For different GMM parameters, the performance decreases by 2.0 dB and 2.8 dB, respectively. The BER performance of the noise data Set 7 and Set 8 in Guangzhou is shown in Figure 11b. It can be seen from Figure 11b that for the BER of 10−5, the noise data Set 7 and the noise data Set 8, the PAM4 requires a SNR of 17.2 dB and 18.1 dB, respectively. Compared with the performance of Gaussian noise, it is reduced by 3.4 dB and 4.3 dB, respectively. From the four sets of noise data in Table 5 and Table 6, it can be seen that the larger the value of σ GMM , the worse the BER performance.
The BER performance of Harbin’s noise data Set 9 and Set 10 is shown in Figure 12a. It can be seen from Figure 12a that for the BER of 10−5, the PAM4 requires a SNR of 17.5 dB and 19.2 dB, respectively. Compared with Gaussian noise, the performance decreases by 3.7 dB and 5.4 dB. The BER performance of Changchun’s noise data Set 11 and Set 12 is shown in Figure 12b. It can be seen that for the BER of 10−5, using the noise data Set 11 and the noise data Set 12, PAM4 requires a SNR of 15.2 dB and 16.3 dB, respectively. Compared with the Gaussian noise, the performance decreases by 1.4 dB and 2.5 dB, respectively. It can be seen from the four sets of noise data in Table 7 and Table 8 that the value of Harbin’s σ GMM is large, so the BER performance is worse.

4.2. Multiplicative Noise

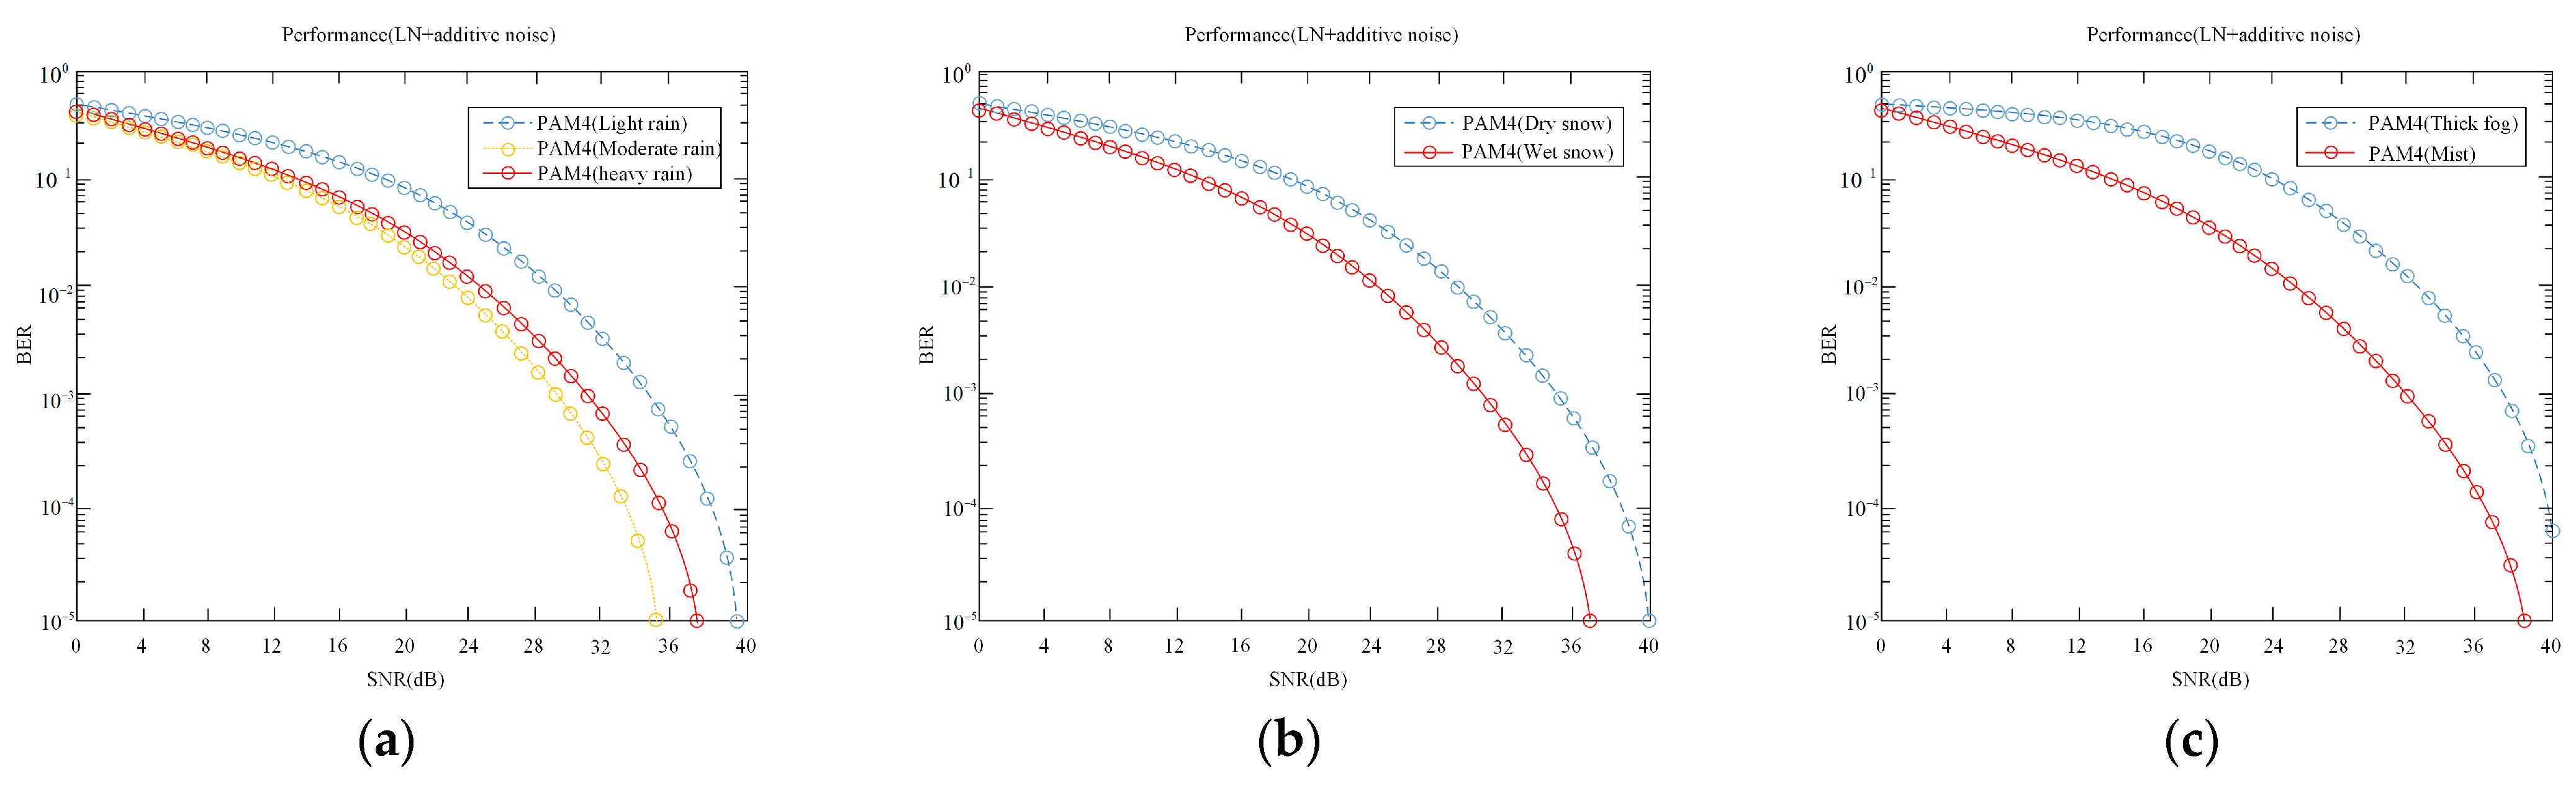
We use the low-frequency multiplicative noise data tested in the outdoor actual environment to research and analyze the lognormal noise model and test the noise data in light rain, moderate rain, heavy rain, wet snow, dry snow, mist, and thick fog weather. The noise mean has been normalized, and the variance after noise fitting is 0.092, 0.053, 0.057, 0.114, 0.156, 0.133, and 0.215, respectively. Through numerical calculation and the BER formula of Equation (13), the BER performance results are obtained, as shown in Figure 13a. As can be seen from Figure 13a, for the BER of 10−5, light rain, moderate rain, and heavy rain, respectively, need 39.2 dB, 35.1 dB, and 37.3 dB. The SNR difference is 4.1 dB and 2.2 dB in the case of the same SNR, and the BER of light rain is greater than the BER of heavy rain and moderate rain because the backscattering of rain particles is large in light rain weather. At this time, the signal attenuation is more serious, with the increase in rain, the radius of rain particles increases, but the number remains almost unchanged, the forward scattering will increase with the increase in rain particles; at this time, the signal attenuation is small, resulting in the variance in the case of light rain is greater than the variance in the case of moderate rain and heavy rain, so the BER in the case of light rain is large.
Comparing Figure 10 can be seen to achieve the BER of 10−5, white Gaussian noise requires a SNR of 13.8 dB, the GMM noise model requires a SNR of 16.6 dB and 18.9 dB, and in such a SNR, light rain, moderate rain, and heavy rain are greater than 10−1. Even in the case of 20 dB SNR, the BER is also very large; therefore, the influence of the lognormal noise model on the BER of PAM4 is much greater than that of the GMM noise model. The reason for this huge difference is that the influence of the lognormal noise belongs to multiplicative noise, the reaction channel state information, and CMM noise belongs to additive noise, the fluctuation of the multiplicative noise is more violent, has low uniformity, and a greater impact on BER performance.
The BER performance results in the case of snowy days are shown in Figure 13b. As can be seen from Figure 13b, under the same SNR, the BER of dry snow is greater than that of wet snow. For the BER of 10−5, the SNR difference in the two weather conditions is 2.9 dB. Comparing Figure 13a,b, the BER performance on snowy days is generally greater than on rainy days. This can be seen from the variance after fitting the noise data. The noise variance on snowy days is greater than on rainy days, and the attenuation of the signal is greater than on rainy days, resulting in the BER performance being worse overall than on rainy days.
The BER performance results in the case of foggy days are shown in Figure 13c. As shown in Figure 13c, under the same SNR, the BER of thick fog is greater than that of mist. For the BER of 10−5, the mist needs a SNR of 38.5 dB, while when the thick fog is 40 dB SNR, the BER is of the order of 10−4, so the BER performance in thick fog weather is worse, which can be seen from the variance after fitting the noise data. Compared with Figure 13a,c, the BER performance on foggy days is greater than that on rainy days, the noise variance on foggy days is greater than that on rainy days, and the attenuation of the signal is greater than that on rainy days, resulting in the BER performance being worse than that on rainy days.
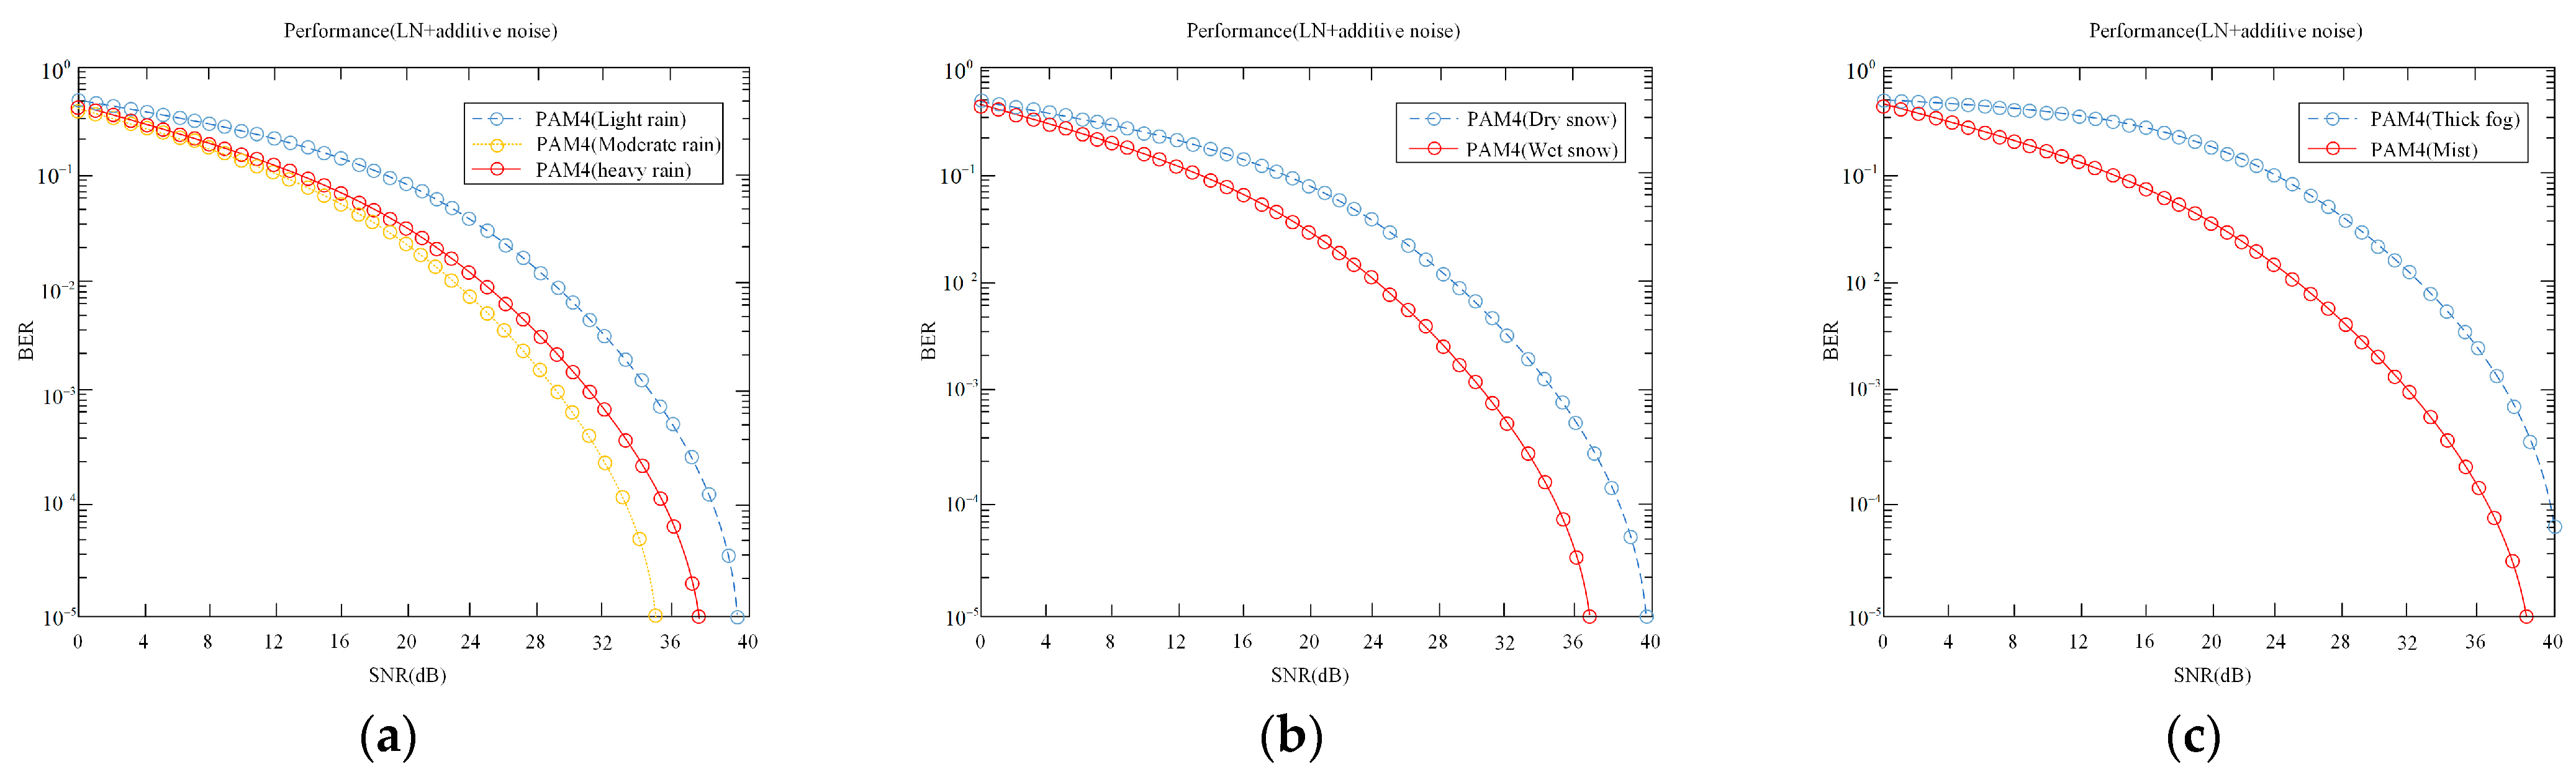
4.3. Mixed Noise

There will be both additive and multiplicative noise in the optical communication system, so we use the measured low-frequency multiplicative noise and the additive noise data of Xi’an, Beijing, and Changchun for research and analysis. The obtained rainy days, snowy days, and foggy days relationship of BER with SNR is shown in Figure 14a–c, Figure 15a–c and Figure 16a–c. It can be seen from Figure 14 that for the BER of 10−5, light rain, moderate rain, and heavy rain need 39.4 dB, 35.3 dB, and 37.5 dB, respectively. Dry snow and wet snow need 37.2 dB and 39.8 dB, respectively; mist needs 38.6 dB, and thick fog is greater than 40 dB, comparing Figure 14 with Figure 13. It can be seen that there is almost no difference between the BER under the condition that the multiplicative noise and the additive noise exist at the same time and the BER where only the multiplicative noise exists. The reason is that the influence of the multiplicative noise is much greater than the influence of the additive noise. The additive noise generally refers to the background noise of the system, mainly thermal noise and shot noise. The multiplicative noise refers to the physical characteristics of the signal through some medium during propagation so that the amplitude of the signal itself changes randomly, and the information contained in the signal is lost. The multiplicative noise appears with the appearance of useful signals. When the signal disappears, the multiplicative noise will also disappear. The randomness of the multiplicative noise is caused by the time-varying and nonlinearity of the system, reflecting the fading of the channel, so the influence of the multiplicative noise is greater than that of the additive noise. When considering the multiplicative noise, the influence of the additive noise is generally negligible.
Comparing the BER curves in Xi’an, Beijing, and Changchun under the same weather, it can be seen that whether it is rainy days, snowy days, or foggy days, the BER performance is almost indistinguishable, which proves that the additive noise in different cities has a very small impact on the BER performance, and also verifies that the effect of the multiplicative noise on the BER performance is much greater than that of the additive noise.

5. Results and Analysis

5.1. Simulation

After completing the overall design of the FPGA, the software simulation of the system is carried out, and the code is written in Verilog language. After the compilation is passed smoothly, the testbench test script is written, and then the simulation result is shown in Figure 17, which is converted into a waveform, as shown in Figure 18. The clk is the system clock signal, nrz_data_1 and nrz_data_2 are the original two NRZ signals, pam4_level is the encoded PAM4 signal, and the output signal is delayed compared with the input signal, which is a normal phenomenon. According to the principle of the PAM4 signal, different input signals output four different amplitude information, corresponding to four symbols. It can be seen from Figure 17 that the output four amplitudes “0”, “1”, “3”, “2” correspond to symbols “00”, “01”, “11”, “10” respectively, which conforms to the criterion of gray coding, that is, only one adjacent symbol is different.
The receiver is simulated and verified. First, the clock signal is recovered from the PAM4 signal, and then the frame synchronization and decoding are performed based on the clock signal. Since a PAM4 data frame designed in this paper contains a frame header and multiple sets of PAM4 data, after detecting the frame header, when the output frame synchronization signal is at a low level (the frame synchronization signal is valid at a high level), the data segment of the PAM4 data frame is PAM4 decoded. The decoding simulation result is shown in Figure 19. The clk is the recovered bit synchronization signal, which acts as the clock signal of the receiving end. The pam4_level is the PAM4 signal to be decoded; the output signal is also delayed compared to the input signal. The recovered two NRZ signals and the original nrz_data_1, nrz_data_2 comparison can be seen by calculating the algorithm in the case where the bit synchronization clock as a reference clock can successfully recover two NRZ signals, verifying that the decoding scheme is feasible.

5.2. System Experiment

The BER is one of the most important parameters in the communication system, which reflects the performance of the communication system. The communication rate is set to 10.0 MB bit/s, and the communication distance is 0.5 m, 1 m, 1.5 m, 2 m, and 2.5 m, respectively. The performance of the BER of the indoor visible light communication system based on PAM4 is tested.
The experimental system diagram is shown in Figure 20. The experimental results are shown in Figure 21. During the experiment, 221,720 symbols were sent. As can be seen from Figure 21, the BER is very large when the communication distance is very close. This is because the light intensity is too large, and the photodetector is saturated, resulting in the photodetector being unable to receive the signal. As the distance slowly increases, this situation will disappear; the BER can basically be maintained at 10−6 within the communication distance of 1.5 m, but as the distance increases, the BER becomes larger and larger, and even after the distance exceeds 1.5 ms, the BER increases sharply, mainly because the intensity of the optical signal received by the photodetector decreases with the increase in distance. The optical signal will attenuate and diverge through the channel. A condenser lens can be added in front of the photodetector, or the luminous power of the LED can be increased. The BER obtained in this way will decrease under the same experimental conditions. This can be seen from Figure 21. After the distance exceeds 1.5 m, the BER obtained by the condenser lens is significantly reduced by combining hardware pre-equalization technology in the LED driver circuit to expand the modulation bandwidth of the LED, using pulse shaping to enhance the decoding performance of the receiver, optimizing the performance of the photovoltaic receiving circuit, adding a blue light filter in front of the photodetector to filter out the yellow light element with slower response, and reducing the response time of the photodetector. The BER will be further reduced by improving and optimizing the above aspects.

6. Conclusions

This paper completes the FPGA design and simulation implementation of PAM4 encoding and decoding based on the analysis of theoretical knowledge. At the same time, the lead-lag bit synchronization method and Barker code correlator are designed for bit synchronization signal recovery and frame header detection. Gray coding and 8b/10b coding are added before PAM4 coding to reduce the error rate of symbols. The FPGA serial port communication based on PAM4 encoding and decoding is realized through simulation, thereby verifying the feasibility of the PAM4 encoding and decoding scheme. The specific conclusions are as follows:
(1)
According to the analysis and research of the three-channel noise models, the BER performance of the PAM4 signal under the additive noise model is the best. The BER under the multiplicative noise model is much larger than that under the additive noise model, and the BER performance under the mixed noise model is almost the same as that under the multiplicative noise model, indicating that in the actual communication system, the influence of the multiplicative noise on the signal is the main factor determining the communication performance.
(2)
The BER performance of PAM4 in the additive noise model mainly depends on the noise variance. The analysis result shows that the noise variance of Set 2 and Set 10 is large, resulting in worse BER performance. Under the multiplicative noise model, the BER of foggy days and snowy days is higher than that of rainy days, the BER of thick fog is higher than that of mist, the BER of dry snow is higher than that of wet snow, and the BER of light rain is higher than that of moderate rain and heavy rain.
(3)
The software simulation of the PAM4 encoding and decoding scheme shows that the designed scheme can successfully encode and decode. Two NRZ codes output PAM4 encoded signals, which is the most commonly used method, and the decoding is judged by designing three deciders.

Author Contributions

Conceptualization, J.L.; methodology, J.L. and S.L.; software, S.L.; validation, J.L., S.L. and X.K.; formal analysis, X.K.; investigation, J.L.; resources, J.L.; data curation, S.L., J.L. and X.K.; writing—original draft preparation, S.L.; writing—review and editing, X.K., S.L. and J.L.; supervision, X.K.; project administration, S.L. All authors have read and agreed to the published version of the manuscript.

Funding

The Key Industrial Innovation Chain Project of Shaanxi Province [grant number 2017ZDCXLGY-06-01]; the General Project of National Natural Science Foundation of China [grant number 61377080]; the Xi’an Science and Technology Planning Project [grant number 2020KJRC0083]; and the Xi’an Science and Technology Plan (22GXFW0115).

Institutional Review Board Statement

Not applicable.

Informed Consent Statement

Not applicable.

Data Availability Statement

The data or code cannot be made publicly available. Data sharing is not applicable to this article because of the limitations of our patent work.

Conflicts of Interest

The authors declare no conflicts of interest.

References

  1. Kalikulov, N.; Zhussip, D.; Zhexenov, N. Multipath diversity for OFDM based visible light communication systems through fractional sampling. Wirel. Pers. Commun. 2020, 112, 2715–2724. [Google Scholar] [CrossRef]
  2. Chen, J.H.; Wu, J.D.; Wang, R.C. Coded PWM based switching ripple communication applied in visible light communication. IEEE Trans. Power Electron. 2021, 36, 9659–9667. [Google Scholar] [CrossRef]
  3. Ke, X.Z.; Ding, D.Q. Wireless Optical Communication, 2nd ed.; Science Press: Beijing, China, 2022; pp. 3–5. [Google Scholar]
  4. Chen, W.J.; Chen, B.; Jiang, M. Spherical quasi-physical model-based color-shift keying for visible light communication. IEEE Trans. Wirel. Commun. 2020, 19, 8099–8112. [Google Scholar] [CrossRef]
  5. Zhao, B.B.; Feng, L.F. Switching mechanism design of indoor visible light communication system. J. Xi’an Jiaotong Univ. 2019, 53, 107–113. [Google Scholar]
  6. Wang, Y.Q.; Wang, Y.G.; Chi, N. Demonstration of 575-Mb/s downlink and 225-Mb/s uplink bidirectional SCM-WDM visible light communication using RGB LED and phosphor-based LED. Opt. Express 2013, 21, 1203–1208. [Google Scholar] [CrossRef] [PubMed]
  7. Kachave, D.; Sengupta, A. Fault-tolerant DSP core datapath against omnidirectional spatial impact of SET. Can. J. Electr. Comput. Eng. 2019, 42, 102–107. [Google Scholar] [CrossRef]
  8. Tang, M.Z.; Li, Z.H.; Hu, J.F. A 56Gb/s PAM4 continuous-time linear equalizer with fixed peaking frequency in 40 nm CMOS. In Proceedings of the IEEE International Conference on Integrated Circuits, Technologies and Applications (ICTA), Chengdu, China, 13–15 November 2019. [Google Scholar]
  9. Zuo, T.J.; Zhang, L.; Zhou, J. Single lane 150 Gb/s, 100 Gb/s and 70 Gb/s 4 PAM transmission over 100 m, 300 m and 500 m MMF using 25G class 850 nm VCSEL. In Proceedings of the 42nd European Conference on Optical Communication, Dusseldorf, Germany, 18–22 September 2016. [Google Scholar]
  10. Lavrencik, J.; Varughese, S.; Gustavsson, J.S. Error-free 100Gbps PAM4 transmission over 100m wideband fiber using 850 nm VCSELs. In Proceedings of the European Conference on Optical Communication (ECOC), Gothenburg, Sweden, 17–21 September 2017. [Google Scholar]
  11. Yu, J.S.; Bi, M.H.; Ou, J. SVM-based equalization algorithm modified by feature vector construction enabled 50-Gb/s PAM4 modulation NG-PON system. J. Optoelectron. Laser 2019, 30, 1257–1264. [Google Scholar]
  12. Guo, S.H.; Li, D.; Jing, J. A 16/32Gb/s NRZ/PAM4 receiver with Dual-Loop CDR and threshold voltage calibration. In Proceedings of the 2019 IEEE 13th International Conference on ASIC (ASICON), Chongqing, China, 29 October 2019–1 November 2019. [Google Scholar]
  13. Wei, T.C.; Wang, Y.H.; Lin, C.Y. Design and implementation of indoor visible light communication system based on high-order PAM. J. Nanjing Univ. Posts Telecommun. 2021, 41, 53–58. [Google Scholar] [CrossRef]
  14. Shi, J.Y.; Cai, J.F.; Qin, G.J. Geometrically Shaped 32QAM and Modified Binary Switching Coding Method in Underwater Visible Light Communication. Chin. J. Electron. 2022, 31, 1106–1111. [Google Scholar] [CrossRef]
  15. Elganimi, T.Y. Performance comparison between OOK, PPM and PAM modulation schemes for free space optical communication systems: Analytical Study. Int. J. Comput. Appl. 2013, 79, 22–27. [Google Scholar]
  16. Kumar, N.; Lourenco, N.R. Led-based visible light communication system: A brief survey and investigation. J. Eng. Appl. Sci. 2010, 5, 296–307. [Google Scholar] [CrossRef]
  17. Ding, J.J.; Zhang, J.; Wei, Y.R. Comparison of geometrically shaped 32-QAM and probabilistically shaped 32-QAM in a bandwidth-limited IM-DD system. J. Light. Technol. 2020, 38, 4352–4358. [Google Scholar] [CrossRef]
  18. Yu, X.N.; Xiao, L.; Gao, S.H. Atmospheric turbulence suppression algorithm based on APD adaptive gain control for FSO links of 5G floating base stations. IEEE Photonics J. 2020, 12, 7904011. [Google Scholar] [CrossRef]
  19. Ke, X.Z.; Yin, Z.Y. Coding Theory in Wireless Laser Communication System; Science Press: Beijing, China, 2009. [Google Scholar]
  20. Qin, H.H.; Liang, J.Y.; Ke, X.Z. Vehicular visible light communications noise analysis and modeling. Appl. Opt. 2023, 62, 4134–4142. [Google Scholar] [CrossRef] [PubMed]
  21. Yang, S.J.; Ke, X.Z.; Wu, J.L. Fast alignment of wireless optical communication using two-dimensional mirrors. Chin. J. Lasers 2022, 49, 101–114. [Google Scholar]
  22. Yamaguchi, H.; Matsuo, R.; Ohtsuki, T. Equalization for infrared wireless systems using OOK CDMA. IEICE Trans. Commun. 2002, 85, 2292–2299. [Google Scholar]
  23. Gagliardi, R.M.; Karp, S. Optical Telecommunication; Publishing House Electronics Industry: Beijing, China, 1998. [Google Scholar]
  24. Chen, D.; Ke, X.Z.; Qu, F. Research on homomorphism filtering technology of wireless optical communication based on four frequency shift keying modulation. Chin. J. Laser 2011, 38, 143–147. [Google Scholar]
  25. Wang, H.Q.; Wang, X.; Lynette, K. Performance analysis of MIMO wireless optical communication system with Q-ary PPM over correlated log-normal fading channel. Opt. Laser Technol. 2018, 102, 153–159. [Google Scholar] [CrossRef]
  26. Wilson, S.G.; Brandt, P.M.; Cao, Q.L. Optical repetition MIMO transmission with multi-pulse PPM. IEEE J. Sel. Areas Commun. 2005, 23, 1901–1910. [Google Scholar] [CrossRef]
  27. Li, H. Statistical Learning Method; Tsinghua University Press: Beijing, China, 2012; pp. 175–187. [Google Scholar]
  28. Ke, X.Z.; Qin, H.H.; Yang, S.J. Background light noise model of vehicle visible light communication system at night. Chin. J. Radio Sci. 2021, 36, 986–990. [Google Scholar]
Figure 1. The waveform diagram of the PAM4 signal.
Applsci 14 01663 g001
Figure 2. The format of the PAM4 data frame [19].
Applsci 14 01663 g002
Figure 3. The coding scheme of the PAM4 signal.
Applsci 14 01663 g003
Figure 4. The decoding scheme of the PAM4 signal.
Applsci 14 01663 g004
Figure 5. The principle of the lead-lag synchronization method.
Applsci 14 01663 g005
Figure 6. The principle of detecting frame header by correlation method.
Applsci 14 01663 g006
Figure 7. The design block diagram.
Applsci 14 01663 g007
Figure 8. The software structure diagram of the sending end.
Applsci 14 01663 g008
Figure 9. The software structure diagram of the receiving end.
Applsci 14 01663 g009
Figure 10. The relationship between BER and SNR (a) Set 1 and Set 2 (b) Set 3 and Set 4.
Applsci 14 01663 g010
Figure 11. The relationship between BER and SNR (a) Set 5 and Set 6 (b) Set 7 and Set 8.
Applsci 14 01663 g011
Figure 12. The relationship between BER and SNR (a) Set 9 and Set 10 (b) Set 11 and Set 12.
Applsci 14 01663 g012
Figure 13. The relationship between BER and SNR: (a) rainy days, (b) snowy days, and (c) foggy days.
Applsci 14 01663 g013
Figure 14. The relationship of BER with SNR in Xi’an: (a) rainy days, (b) snowy days, and (c) foggy days.
Applsci 14 01663 g014
Figure 15. The relationship of BER with SNR in Beijing: (a) rainy days, (b) snowy days, and (c) foggy days.
Applsci 14 01663 g015
Figure 16. The relationship of BER with SNR in Changchun: (a) rainy days, (b) snowy days, and (c) foggy days.
Applsci 14 01663 g016
Figure 17. The PAM4 coding simulation result.
Applsci 14 01663 g017
Figure 18. The PAM4 waveform display result.
Applsci 14 01663 g018
Figure 19. The PAM4 decoding simulation result.
Applsci 14 01663 g019
Figure 20. The experimental system diagram.
Applsci 14 01663 g020
Figure 21. The BER test results at different communication distances.
Applsci 14 01663 g021
Table 1. The bandwidth requirements for different modulation methods [19].
ModulationBandwidth Requirements
OOKRb
PAMRb/log2(M)
PPMM Rb/log2(M)
DPPM(M+1) Rb/2log2(M)
Table 2. Symbol output values for each part.
PartSymbol ValuePartSymbol Value
NRZ10 1 0 1 0 1 0 1Decider2(Output1)0 1 0 1 0 1 0 1
NRZ20 1 1 0 0 1 1 0Decider30 1 0 0 0 1 0 0
PAM400 11 01 10 00 11 01 10XOR0 0 1 0 0 0 1 0
Decider10 1 1 1 0 1 1 1OR(Output2)0 1 1 0 0 1 1 0
Table 3. The parameters of the Gaussian mixture noise model (Xi’an).
Noise Data ε 1 μ 1 μ 2 μ GMM σ 1 σ 2 σ GMM
Set 1 0.352 0.211.020.73490.921.621.466
Set 20.316 0.251.210.90660.872.772.385
Table 4. The parameters of the Gaussian mixture noise model (Beijing).
Noise Data ε 1 μ 1 μ 2 μ GMM σ 1 σ 2 σ GMM
Set 30.3120.321.300.99710.930.790.953
Set 40.3690.351.411.01220.821.571.437
Table 5. The parameters of the Gaussian mixture noise model (Kaifeng).
Noise Data ε 1 μ 1 μ 2 μ GMM σ 1 σ 2 σ GMM
Set 50.3420.331.320.98510.820.880.982
Set 60.3710.271.441.00420.801.131.165
Table 6. The parameters of the Gaussian mixture noise model (Guangzhou).
Noise Data ε 1 μ 1 μ 2 μ GMM σ 1 σ 2 σ GMM
Set 70.3170.361.130.88530.970.881.248
Set 80.3260.211.541.10760.781.891.734
Table 7. The parameters of the Gaussian mixture noise model (Harbin).
Noise Data ε 1 μ 1 μ 2 μ GMM σ 1 σ 2 σ GMM
Set 90.3350.311.510.78950.861.711.583
Set 100.3890.301.170.83250.892.632.174
Table 8. The parameters of the Gaussian mixture noise model (Changchun).
Noise Data ε 1 μ 1 μ 2 μ GMM σ 1 σ 2 σ GMM
Set 110.348 0.251.320.94780.930.580.886
Set 120.3220.281.040.79840.851.461.345
Disclaimer/Publisher’s Note: The statements, opinions and data contained in all publications are solely those of the individual author(s) and contributor(s) and not of MDPI and/or the editor(s). MDPI and/or the editor(s) disclaim responsibility for any injury to people or property resulting from any ideas, methods, instructions or products referred to in the content.

