Review

A Comprehensive Review of Sensor-Based Smart Building Monitoring and Data Gathering Techniques

Institute of Electronics and Computer Science, LV-1006 Riga, Latvia
*
Author to whom correspondence should be addressed.
Appl. Sci. 2024, 14(21), 10057; https://doi.org/10.3390/app142110057
Submission received: 2 August 2024 / Revised: 30 September 2024 / Accepted: 30 October 2024 / Published: 4 November 2024
(This article belongs to the Special Issue Digital Twin and IoT)

Abstract

:
In an era where buildings are increasingly becoming multifaceted entities, the paradigm of smart buildings has witnessed significant evolution. This advancement integrates sophisticated communication technologies, the Internet of Things (IoT), artificial intelligence (AI), and data analytics. Intending to design an effective smart building monitoring system, this research paper explores and compares various solutions for measuring building parameters by identifying a broad spectrum of review articles considering building occupant behavior, sensor deployment, and implementation complexity. The objective of our paper is to compile diverse information on various sensors used for monitoring building conditions and provide a comprehensive overview of data structuring and processing, all within a single article. Additionally, this paper addresses the challenges of combining data from decentralized systems and the need for managerial tools to optimize user experiences. The findings contribute to the advancement of smart building management, offering valuable insights for improving building performance and user experience as well as evaluating future research directions in this field. This review is designed to serve as an introduction for anyone venturing into the field of building monitoring.

1. Introduction

The global smart cities sector is experiencing continuous expansion, driven by government endeavors to manage urbanization and the growing need for resource-efficient strategies to meet United Nations sustainable development goals [1]. Given the trend of urbanization, governments around the globe continue to invest in smart city projects featuring advanced infrastructure, cleaner transportation, intelligent buildings, and other smart technologies [2]. The concept of a ‘smart city’ involves the coordinated and intelligent use of all available resources and technologies to create more sustainable and livable urban centers [3]. A key area to consider in such advancements is the field of smart buildings.
A smart building is a contemporary residential structure that can measure, control, monitor, and optimize its operations independently. For example, modern facilities can regulate lighting, heating, and cooling according to occupant presence to enhance efficiency; autonomously monitor structural health and quality; bolster physical security; improve pathfinding for occupants; and generate detailed building usage reports. Multiple sensors, actuators, and controllers in a smart building work together to provide a comfortable and energy-efficient living for its inhabitants [4,5].
Smart buildings integrate a range of information and communication technologies, including the Internet of Things (IoT), artificial intelligence (AI), cloud computing, and data analytics, to collect and process data on infrastructure usage. IoT (a wired or wireless sensor network platform that integrates numerous heterogeneous devices) is one of the key technologies advancing the intelligence and automation levels of today’s smart buildings. IoT delivers services to smart scenarios across various contexts, efficiently managing hardware, software, and communication resources to lower costs in a specific domain [6]. It ensures the transparency and visibility of complex systems as well as procures real-time monitoring [7,8].
The architecture of the IoT is intentionally structured to equip all entities with identification, detection, networking, and processing capabilities, enabling them to exchange information seamlessly. Building equipment data collected from IoT sensors enable us to identify abnormal behavior in a monitored environment and predict and respond to anomalies [6]. Therefore, it is possible to make effective calculations based on the real-time environmental data produced by smart buildings and extend their features [8,9].
Taking into account the above definitions, a smart building can be referred to as a building automation and control system (BACS). It is a modular, intelligent, automated system that unifies, integrates, and connects facility technologies through information flow to a central monitoring point. There are alternate terms for BACSs, such as building automation system (BAS) and building management system (BMS). Still, its core principle remains the same: facilitating information flow and automated decision making through connectivity [10].
The goal of BACSs is to control, monitor, and protect the building’s operating environment by automating various systems, such as air conditioning, lighting, ventilation, and security systems. This enhances occupant comfort and reduces energy consumption, tailored to the building’s specific purpose. The global BACS market is expected to experience a remarkable compound annual growth rate (CAGR) of 7.9% from 2023 to 2031 [11].
There are numerous strategies used to enhance the value of a building. However, when factoring in return on investment, cost efficiency, energy reduction potential, and tenant well-being, the most notable approaches are:
  • Indoor climate monitoring—helps to identify energy waste, allowing for corrective actions to prevent it, thereby reducing unnecessary energy costs and CO2 emissions. It also generates the data necessary for environmental, social, and governance (ESG) reporting as well as uncovers new energy efficiency insights.
  • Heating optimization—facilitates real-time temperature monitoring across various sections of a building, allowing for the regulation of district heating systems. This automated, real-time optimization process leads to substantial energy savings and enhances the comfort of tenants, facility managers, and other building occupants.
  • Air quality monitoring—delivers real-time data on temperature, humidity, CO2 level, volatile organic compounds (VOCs), and atmosphere pressure. This allows building owners to create a healthier and more comfortable indoor climate for tenants. Collecting temperature data from across the building enables managers to identify hot and cold spots, allowing them to take proactive measures to reduce energy consumption, CO2 emissions, and cost.
In this paper, we explore and compare solutions for measuring building parameters to evaluate opportunities for designing an effective smart building monitoring system. We consider the following aspects:
  • The behaviors of building occupants;
  • Sensor allocation;
  • Implementation complexity and precision of the studied methods.
The review process was initiated by identifying a range of review articles focused on facility management. For topics that required a more in-depth understanding, extensive research was conducted by sourcing multiple papers that provided a more detailed exploration of the subject matter. These comprehensive papers offered a granular level of detail, enriching the overall review.
The remainder of this paper is organized as follows: Section 2 provides an overview of the architecture and main characteristics of a smart building monitoring and control system; Section 3 describes how to measure and manage building parameters within the scope of smart building applications; Section 4 describes occupancy sensing techniques; Section 5 gives an introduction to data gathering and processing techniques; Section 6 summarizes the findings of this study; Section 7 provides the conclusions and suggests areas for future research.

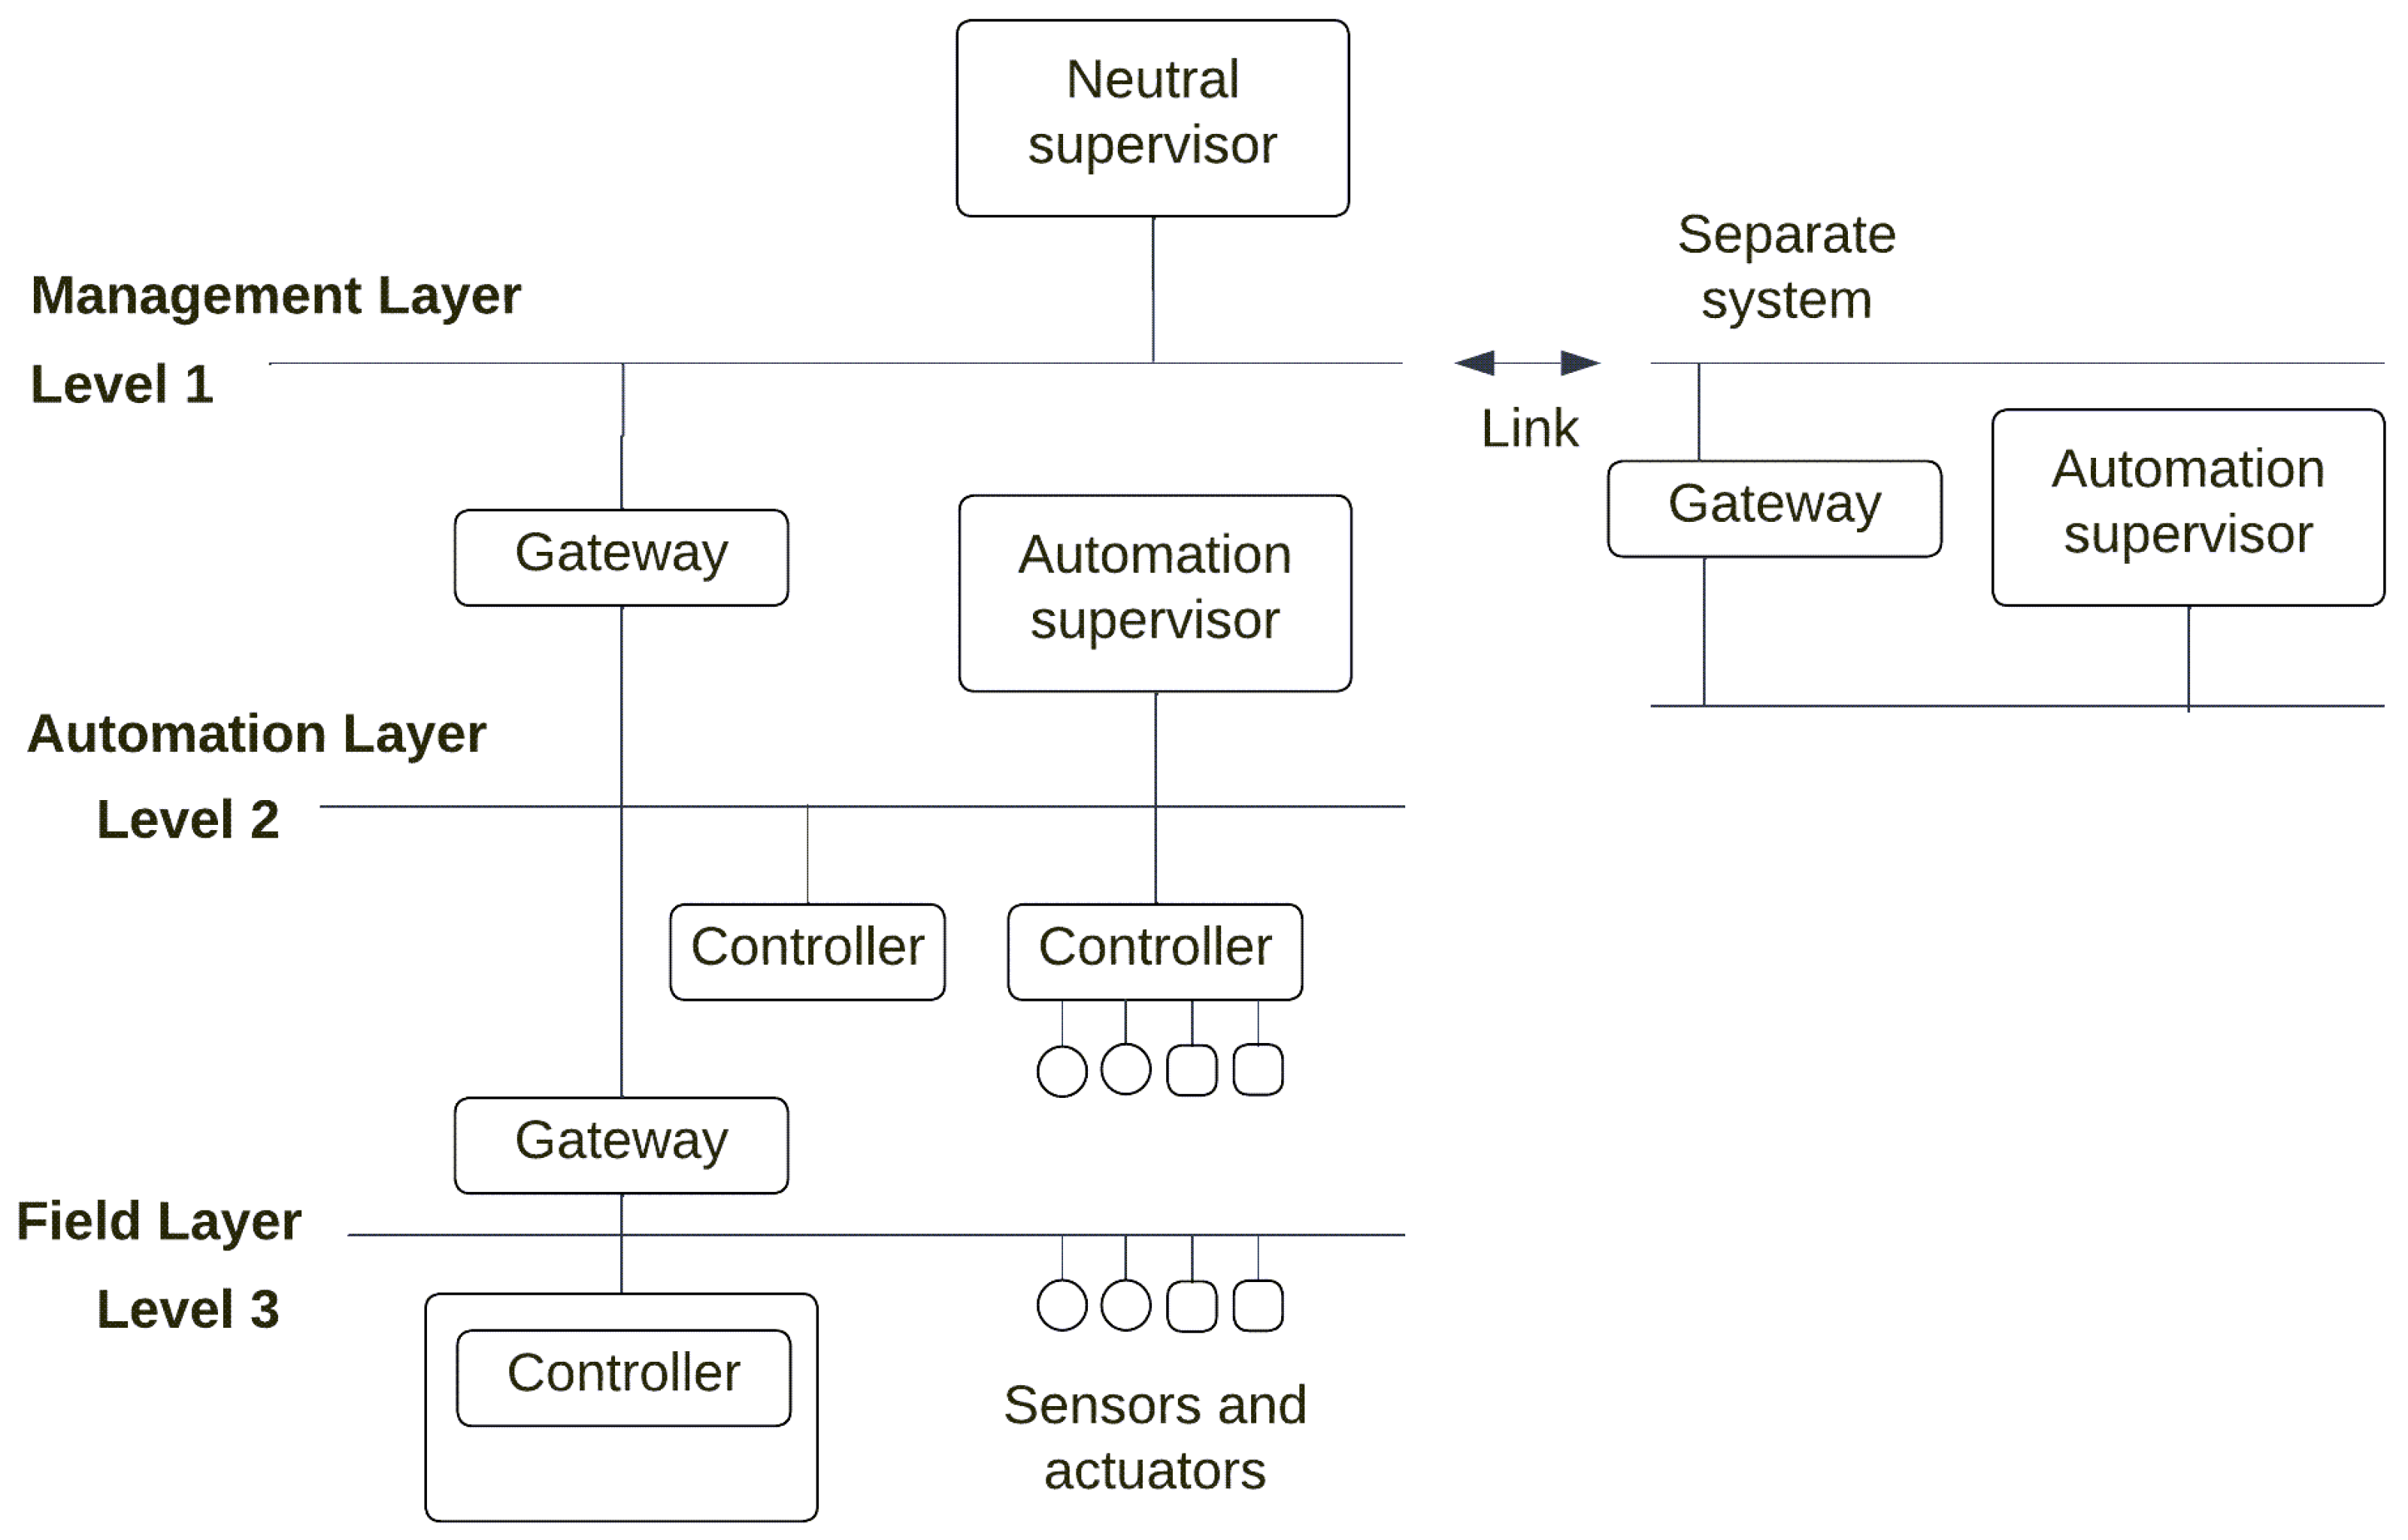
2. Smart Building Monitoring and Control System Architecture

In advancing building management technologies, the deployment of building automation and control systems signifies a crucial evolution in the administrative and operational oversight of facility infrastructures. These systems encompass both hardware and software components designed to facilitate the automated control and monitoring of diverse building systems.
This section outlines the technical architecture of BACSs, emphasizing their role in enhancing connectivity for efficient communication, decision making, and automated control. The BACS architecture consists of three layers: management, automation, and field, as illustrated in Figure 1.
The management layer includes the human–machine interface, which is usually integrated into the organization’s enterprise network. This layer includes operator and monitoring units, along with additional peripheral computing devices, all connected to a central data processing system. It manages the data from across the automation layer to facilitate decision making and reporting. Multiple autonomous systems can be integrated to enhance the human interface for monitoring and management purposes. The adoption of a three-layer architecture reduces the network traffic on the management level; however, the system scale should be considered. For example, the separation of the networks may be an expensive solution for smaller systems [10].
The automation (supervisory) layer serves as the main hub for communication and control. The automation layer includes both hardware and software components, with the software representing the messages or signals that convey information about the device’s status [12]. Connectivity is established through various communication networks that link and integrate numerous discrete devices. Some of the most widely used BACS automation protocols include BACnet, LonWoks, KNX, and Modbus [10].
The field level involves physical input sensors, actuators, and output activators. It encompasses application-specific controllers that are connected to the plant and equipment for monitoring and controlling the environment. The field devices are distributed throughout the building, providing monitoring and control functions. They are installed throughout the BACS to continuously measure and monitor physical parameters [10,12].
Sensors detect and respond to environmental changes, revealing the value of a physical property either directly or indirectly. Subsequently, the data generated are eventually collected, transmitted, assessed, and stored for further analysis [13,14]. Different systems and applications utilize various types and quantities of sensors to gather data; however, sensor fusion technology can integrate sensory data from diverse sources [15]. We will briefly describe some of the common sensor fusion techniques in Section 5.
Integrating several subsystems within a building’s automation framework, regardless of their proprietary protocols or manufacturers, requires a supervisory level. In three-layer BACS architecture, it is referred to as a neutral supervisor (Figure 1). A neutral supervisor operates above the automation layer and is designed to be vendor-neutral, ensuring interoperability among different systems and devices [12]. This integrated architecture forms the backbone for achieving optimal operational efficiency and precision in building management.

3. Smart Building Monitoring Applications

A comprehensive building optimization system utilizes all facets of building and facility management. These systems enable the monitoring of space utilization, water consumption, energy usage, and allocation, among other factors. Advancing this monitoring further, data from IoT sensors tagged by location or asset type and linked with business rules can activate algorithms to detect, predict, and respond to anomalies [16].

3.1. Lighting Management

IoT-based lighting control is crucial for effective smart building management and control. The primary goal of implementing an automated lighting management system in a building is to minimize energy consumption while ensuring visual comfort for occupants. Also, light management is necessary to meet lighting requirements for specific visual tasks like drawing, soldering, reading, etc.
There are several lighting management strategies presented by Aghemo et al. [17] and Pacific Northwest National Lab. [18]:
  • Time scheduling—uses a schedule with a determined time when lights should be turned on and off automatically. This strategy is good for spaces that are constantly occupied during a predetermined time and unoccupied for the rest of the day.
  • Daylight harvesting—measures total illuminance from daylight and artificial lighting to adjust luminaire brightness to reach the required illuminance level in a room. This strategy shows high effectiveness for rooms with high daylight availability.
  • Occupancy control—turns on lighting automatically when human presence is detected and switches off the light when there is no human presence. This approach is typically used in areas that are occupied intermittently, such as stairwells, break rooms, conference rooms, and restrooms.
Each of the described approaches is strongly dependent on the type and occupancy pattern of the room where it is applied, yet the energy efficiency and occupants’ visual comfort can be improved by combining the above strategies. Table 1 represents an estimation of energy savings for each automated lighting management strategy, including also manual control for comparison, based on a review made by Dubois et al. [19].
Light sensors are commonly located on ceilings for ease of installation, yet more precise measurement results can be obtained when light sensors are placed closer to the points of interest for occupants, for example, desks, walls, etc. This solution allows the required illumination for specific tasks to be measured directly; however, the downside of such an approach is that the sensors can be easily shadowed by an object or a person [20].
Another important aspect of indoor lighting management is the light color adjustment described by Malik et al. [21]. The authors employ a real-time adjustable lighting system that varies both correlated color temperature (CCT) and illuminance. This system achieves the desired CCT by blending the colors of cool-white and warm-white light-emitting diodes (LEDs). The proposed lighting system is versatile in human-centric applications, enhancing occupant productivity and supporting proper circadian rhythms. It adjusts dimming and warm lighting according to the time of the day (e.g., if a person works after daylight).

3.2. HVAC Systems Management

Heating, ventilation, and air-conditioning (HVAC) systems are essential elements of any building. They manage the building’s climate control to ensure occupant comfort and safety [22]. Typical HVAC systems control such parameters as
  • Temperature;
  • Humidity;
  • Air distribution;
  • Indoor air quality.
For smart HVAC systems, the aim is to enhance energy efficiency and automatically regulate the indoor climate for comfort, typically with the ability for remote monitoring and control capabilities. Advanced smart HVAC systems use zoning, which means that the building is not treated as a single unit and is divided into different zones. The climate in each zone is individually managed based on its purpose, the number of occupants, and their personal preferences.
HVAC systems consume the most amount of energy in office buildings [23]; this naturally leads to the conclusion that an optimization of these systems should yield the highest results in terms of reducing energy efficiency and environmental impact. Several HVAC design strategies, proposed by Sriram et al. [24], can be implemented:
  • Using energy-efficient equipment;
  • Initially designing buildings to reduce heating and cooling loads;
  • Using demand-controlled ventilation. This strategy is often implemented by using CO2 sensors. Air ventilation is adjusted based on CO2 concentration;
  • Using solar cooling and refrigeration. This approach converts solar energy to power cooling appliances. This strategy’s advantage is not only that it relies on renewable energy sources but also, as cooling needs increase on the hottest summer days, the amount of available solar energy increases as well;
  • Using desiccant-based cooling systems. These systems provide cooling without refrigeration.
The most popular methods for HVAC control are time scheduling and occupancy-based control. Time scheduling turns on the HVAC system at a predetermined time when high occupancy is expected, which is not always constant and not so precisely predictable. The occupancy-based method, on the other hand, senses the occupancy level in the rooms and adjusts interior climate parameters accordingly. This method is described by Cao et al. [25], Bae et al. [26]; typical used sensors are as follows:
  • Presence sensors like passive infrared (PIR);
  • Radio-frequency identification (RFID) tags, which must be worn by all people using the building;
  • Optical cameras;
  • Interior parameter measurements like air temperature, CO2, humidity, and acoustics, which are dependent on human presence.
Correct sensor placement significantly affects the operation of an HVAC system. For example, the temperature distribution profile is not uniform within one location, HVAC system operation can be substantially affected by sensor layout, and, as the study by Yoganathan et al. [27] shows, the optimal sensor placement can also differ with time. In general, there is no universal methodology for optimal sensor location or count and this is usually decided based on engineering judgment or heuristic methods [26].

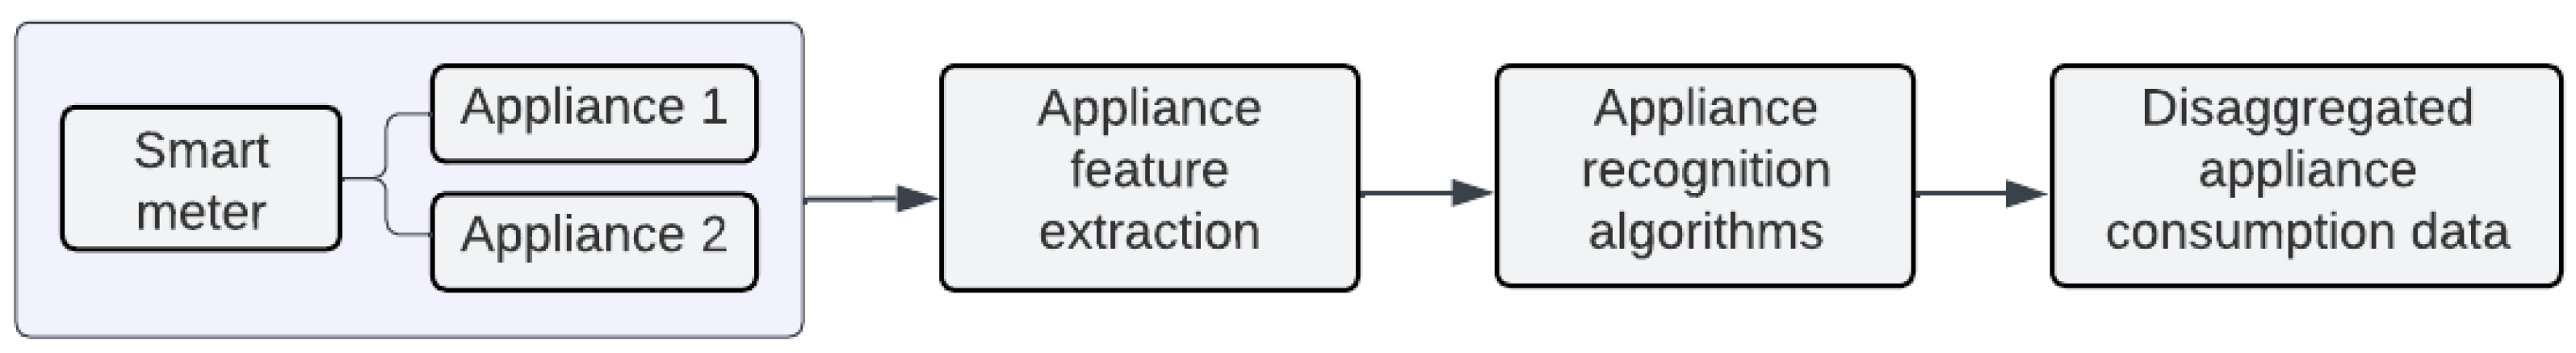
3.3. Energy Management

Energy efficiency optimization is driven by good business practices as well as by government regulations. The building sector represents a significant portion of the world’s total energy consumption. Based on a survey by the International Energy Agency (IEA) [2], the global building sector consumes 42 percent of the total generated electricity. Building energy monitoring and management systems ensure energy efficiency by overseeing energy usage through the collection and analysis of real-time data, whether gathered manually or from sensor networks. Therefore, Abo-Zahhad et al. [28] argue that it is possible to forecast the energy utilization trends for different buildings and make realistic estimations.
To establish an efficient energy management approach, it is a crucial step to monitor related energy-consuming resources such as heat, electric power, water, and others. This process relies on measuring both the static parameters that remain constant over the building’s lifespan (such as building materials, orientation, and placement) and dynamic parameters, which are variable over time (including weather data, occupancy characteristics, energy use, and water use) [29].
When monitoring electricity consumption, techniques can be categorized into intrusive load monitoring (ILM) and non-intrusive load monitoring (NILM). The NILM method is implemented with a low level of intrusiveness at a single point of measurement, typically at the point where the building is connected to the electrical grid. On the other hand, The ILM method requires a higher level of intrusion into the energy system compared to NILM into the energy system, as it involves the addition of meters or sensors.
In a 2014 survey article, ILM is divided into three levels based on their level of intrusiveness: submeter level (at the circuit breaker), plug level, and embedded level [30].
However, in recent years, the definition of ILM has changed. Based on recent articles, ILM implies that collected energy data do not require data disaggregation to distinguish various appliances [31,32,33] as in the case of NILM. NILM relies on the concept of a unique energy utilization pattern for each load and its goal is to filter out the energy consumption of individual equipment from the total power usage [31].
ILM gives finer details about appliance energy consumption; however, the installation process is more complex compared to NILM since many energy meters have to be set up depending on appliance count. Costs of an ILM system increase linearly as the sensor count grows.
In NILM, it is feasible to derive characteristics of individual appliance energy consumption through the analysis of the whole consumption data. Then, by utilizing appliance recognition algorithms [33,34], it is possible to disaggregate appliance energy consumption data. Figure 2 shows the required steps of NILM signal processing for appliance energy consumption monitoring. To ease the process of processing energy consumption signals for energy consumption devices, they can first be segregated into four groups depending on their energy consumption patterns [33]:
  • Appliances with binary power states (ON/OFF);
  • Appliances with multiple and finite power states;
  • Appliances with multiple power states, including infinite intermediate states;
  • Appliances with a constant power consumption that stays ON for days or weeks.
Given that each appliance exhibits a unique energy consumption pattern, a “signature” can be derived for each one. This “signature” can be understood as a compilation of the specific electrical characteristics associated with a particular load. The notable drawback of methods where energy signal disaggregation has to be performed is its inability to monitor all types of loads, such as loads with continuously variable power consumption and loads with constant power consumption during a long period. Currently, intrusive energy monitoring is considered as the most viable and efficient method on the market [34].
Additionally, monitoring the behaviors and habits of building occupants is imperative, as they constitute the primary energy consumers. By discerning occupant energy utilization patterns, it becomes feasible to adapt energy consumption to meet the preferences of occupants while concurrently curbing overall energy usage. Energy usage adjustments can be made based on physical environmental parameters (temperature, lighting, and humidity) and occupant preferences by creating their personalized comfort profile (e.g., by monitoring it with sensors or surveys) [35].

3.4. Water Consumption End-Use Monitoring

Water end-use pertains to the specific locations within a building where water is utilized, such as sinks, showers, toilets, etc. Water consumption monitoring helps to detect water leaks and get rid of water waste. Monitoring occupant end-use habits can be useful for the preservation of water resources in a building as well as predicting water consumption in the future [36]. Furthermore, water quality sensors allow for monitoring the quality of water [37].
Typically, water consumption measurements for multiple end-use sites involve the use of multiple smart water meters that measure water flow rate within an IoT sensor network [38]. Water flow rate can be calculated by measuring liquid flow velocity and the cross-sectional area through which it passes, as demonstrated by Che Soh et al. [39]. Smart meters can be classified into various categories according to the principles they use to measure liquid flow [40]:
  • Mechanical or positive displacement flow meters: have mechanical parts that are displaced or rotated when water flows through them;
  • Vortex flow meters: utilize the vortex shedding principle, where a bluff object is placed in the way of liquid flow, which creates alternating vortices downstream;
  • Electromagnetic flow meters: generate an electromagnetic field, which fluctuates when conductive fluid flows through them;
  • Ultrasonic flow sensors: these sensors operate similarly to radar, sending sound waves in both downstream and upstream directions to measure the time difference, which is then used to calculate the volumetric flow rate.
  • Turbine flow meter: employs a turbine whose rotation speed is directly proportional to the flow rate.
  • Single- and multi-jet flow meters: employ single or multiple impellers, respectively.
When setting up an IoT network with the intention of measuring water consumption, it is advisable to install a separate water flow meter for each end-use site. Flow meter characteristics vary for the different types of sensors but the primary criteria to consider while choosing an optimal flow meter type are cost and required accuracy (Table 2).
Significant contributions to the development of a smart hot water control system are detailed by Sonnekalb and Lucia [42]. The system analyzes actual data from water heaters to understand human behavior concerning domestic hot water usage. Optimized heating schedules are calculated utilizing Gaussian process-based models and neural networks. Accordingly, the control of the hot water heating system adjusts heating times based on data collected about user behavior, resulting in energy savings, as demonstrated by Metallidou et al. [43].

4. Occupancy Sensing

Indoor occupancy data, combined with the capability to detect when a building or space is in use, are crucial for the operation of an intelligent building system. Knowing occupancy as well as possessing the ability to accurately predict usage patterns leads to data-driven decision making toward the minimization of operational energy consumption through the intelligent control of the HVAC systems in commercial buildings.
Extensive research has been conducted on detecting occupancy in building zones using various sensors, including PIR, carbon dioxide concentration, temperature, humidity, and light beams, with the primary goal of determining whether a specific area is occupied, as described by Rabiee and Karlsson [44]. Motion or occupancy sensors operate by detecting infrared energy or by emitting ultrasonic or radio waves and measuring their reflection off a moving object.
A promising approach for measuring occupancy described by Melfi et al. [45] is the implicit sensing method, which leverages existing IT infrastructure to infer occupancy counts. These sensing methods operate on the assumption that building occupants modify their environment, and these changes can be detected through various sensing mediums, as explained by Howard et al. [46]. Depending on the involved infrastructure, there are three groups of implicit occupancy evaluating techniques: (i) Tier I, which requires no additional infrastructure, only data collection and processing, (ii) Tier II, which needs additional software to access data within the existing infrastructure, and (iii) Tier III, which necessitates both additional software and hardware for occupancy estimation.
The occupancy resolution level varies depending on the application. For example, sometimes it is enough to determine the occupancy of a particular zone, whether complicated energy-saving systems may require both the number of occupants in different zones, and the fluctuations in occupancy intensity throughout the day [44]. As proposed by Melfi et al. [45], the occupancy resolution can be measured in three dimensions: spatial resolution, temporal resolution, and occupancy resolution (Figure 3).
  • Spatial (zone) resolution: building, floor, room;
  • Temporal resolution: day, hour, minute, second;
  • Occupancy resolution:
    • Level 1: occupancy: at least one person in a zone;
    • Level 2: count: the number of people present in a zone;
    • Level 3: identity: who they are;
    • Level 4: activity: what actions they are performing.
Shen et al. [47] propose the possibility of adding Level 5 as well to track where an occupant was before. In this context, Level 5 represents the movement history of a specific occupant across various zones within the building, which is crucial for designing proactive comfort systems. The most frequently used sensors for occupancy detection include the following:
  • PIR sensors—detect changes in thermal radiation on their surface caused by the movement of occupants. They are low-cost, energy-efficient, and easy to deploy in environments. PIRs are usually wireless, powered by batteries or photovoltaic cells. The operation of PIR sensors in lighting control works as follows: the lighting system turns on the lights when movement is detected and switches them off if no movement is detected for a specified period [46]. The notable drawback of PIR sensors is their poor performance at detecting small motions. Additionally, since PIR sensors work by detecting heat emitted from humans, they may fail when the weather is hot or when placed close to the HVAC system [18,48].
  • Ultrasonic sensors—operate by continuously emitting high-frequency sound waves. When any motion is present, the sensor detects the frequency of sound shifts, called Doppler shift. Ultrasonic sensors are more power-consuming compared to PIR sensors but have a broader coverage area, which means that ultrasonic sensors are more suitable for large spaces like conference rooms while PIR sensors are often used in small rooms and corridors. Also, ultrasonic sensors have a better performance at small movement detection [18].
Other sensors that can be used for occupancy detection include Bluetooth or similar wireless sensors (which detect the presence of people or objects by transmitting a signal between a transmitter and a receiver) [49], wireless microphonic sensors (which detect presence by continuously monitoring for sound), video image sensors (which use a camera and video analytics to determine occupancy), dual-technology sensors (which combine PIR sensors with another technology, typically ultrasonic (active) or microphonic (passive)), and volumetric microwave Doppler sensors (which detect motion by utilizing the Doppler effect, where emitted microwaves bounce off surfaces and return to the sensor) [18,48]. A combination of various sensors is also common for increasing the precision.
Occupancy sensors are usually installed on the ceiling or the wall. The installation of wired sensors can be more expensive compared to wireless sensors because of the complexity of installation, although wireless sensors tend to be more costly than wired ones. Notably, for popular brands, wireless sensors mark a significant premium of about 55% to 100% over wired sensors according to Pacific Northwest National Lab. [18].

5. Data Aggregation Overview

According to Yang [13], the efficient design of the monitoring solution for large public buildings should meet the following requirements: (a) support collaborative real-time monitoring across multiple structures, (b) integrate the different structural monitoring systems via cloud platforms, (c) process and analyze big data, (d) evaluate monitoring data synergy and performance, as well as ensure uniform display of the monitoring results. In other words, smart building monitoring focuses on precise data acquisition from designated targets via an array of sensors and devices, necessitating the complex integration of data from various sources for comprehensive monitoring and subsequent analysis [50]. Therefore, managing large datasets, influenced by factors such as the building’s functionality, scalability, and structural characteristics, presents a significant challenge in this sector.
Bagchi and Moselhi [51] explain that effective data management enhances data exchange, facilitating the creation of an interoperable building model and defining the specifications of building components throughout its life cycle. Additionally, smart building applications require combining the data obtained from multiple decentralized systems. Therefore, more advanced computing infrastructures and the capability to handle high data generation demands are necessary. Existing research on computing infrastructures for IoT solutions can be explored [52].

5.1. Real-Time Analytics
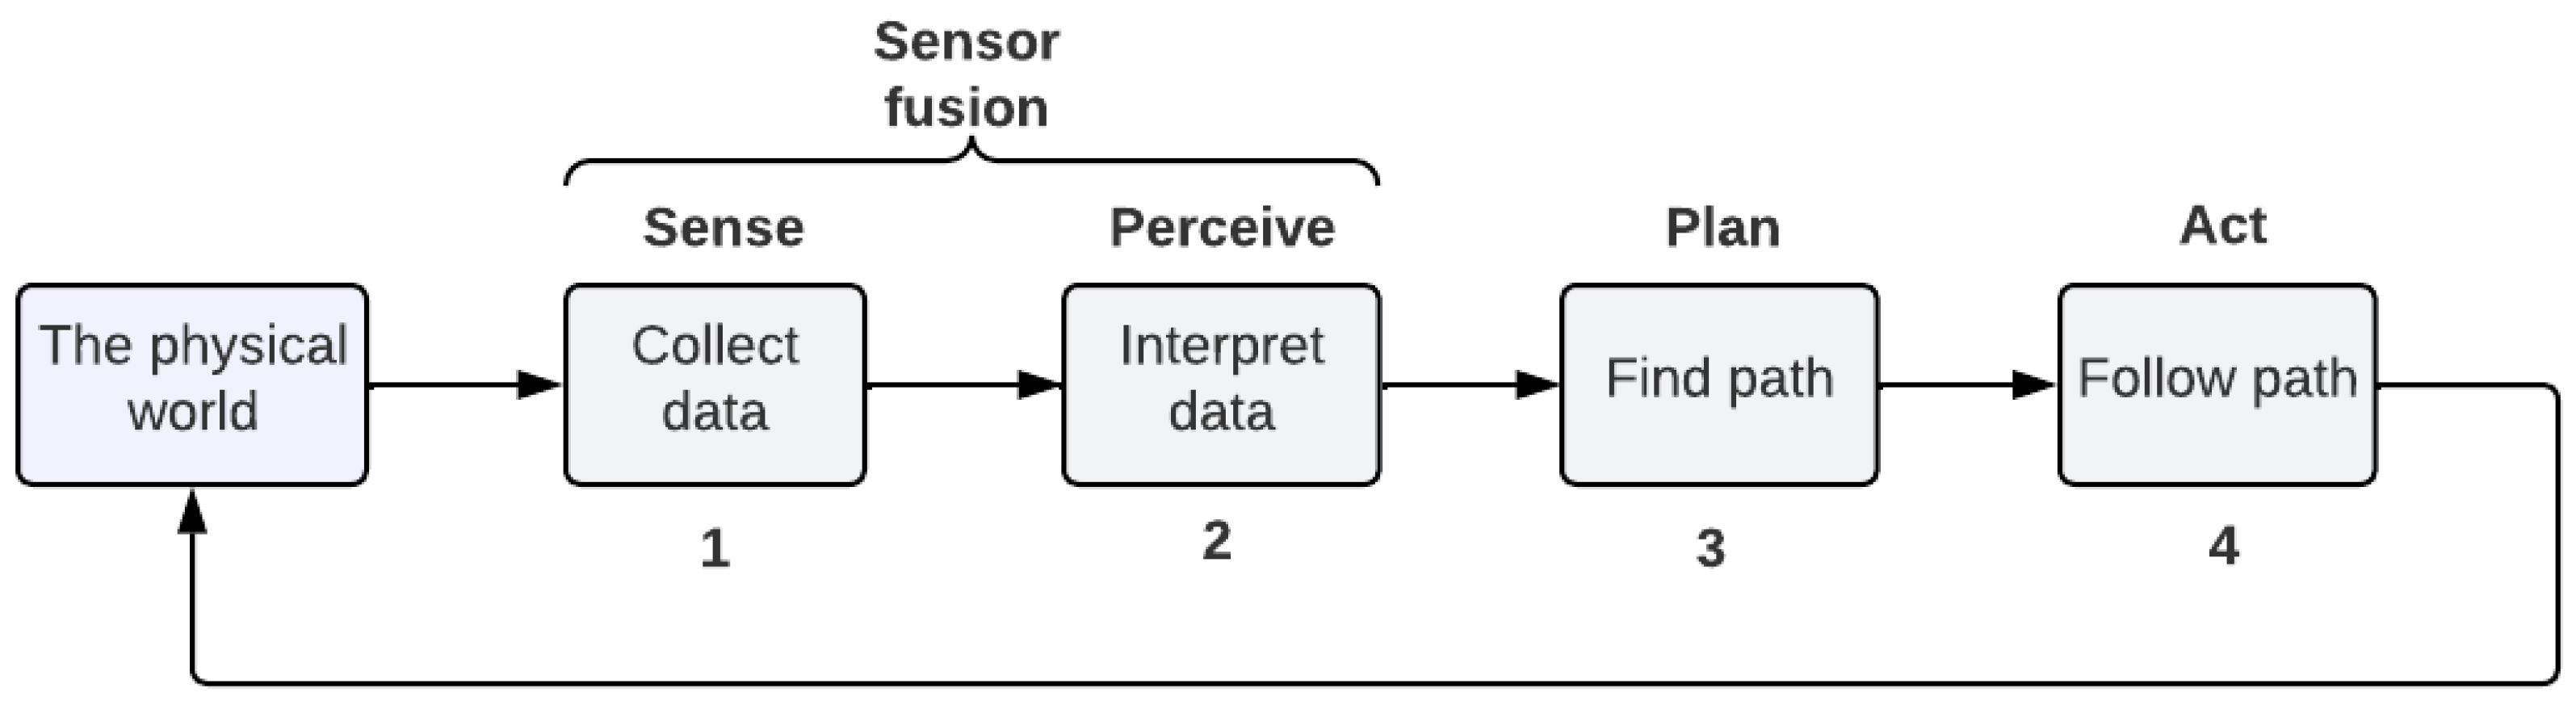
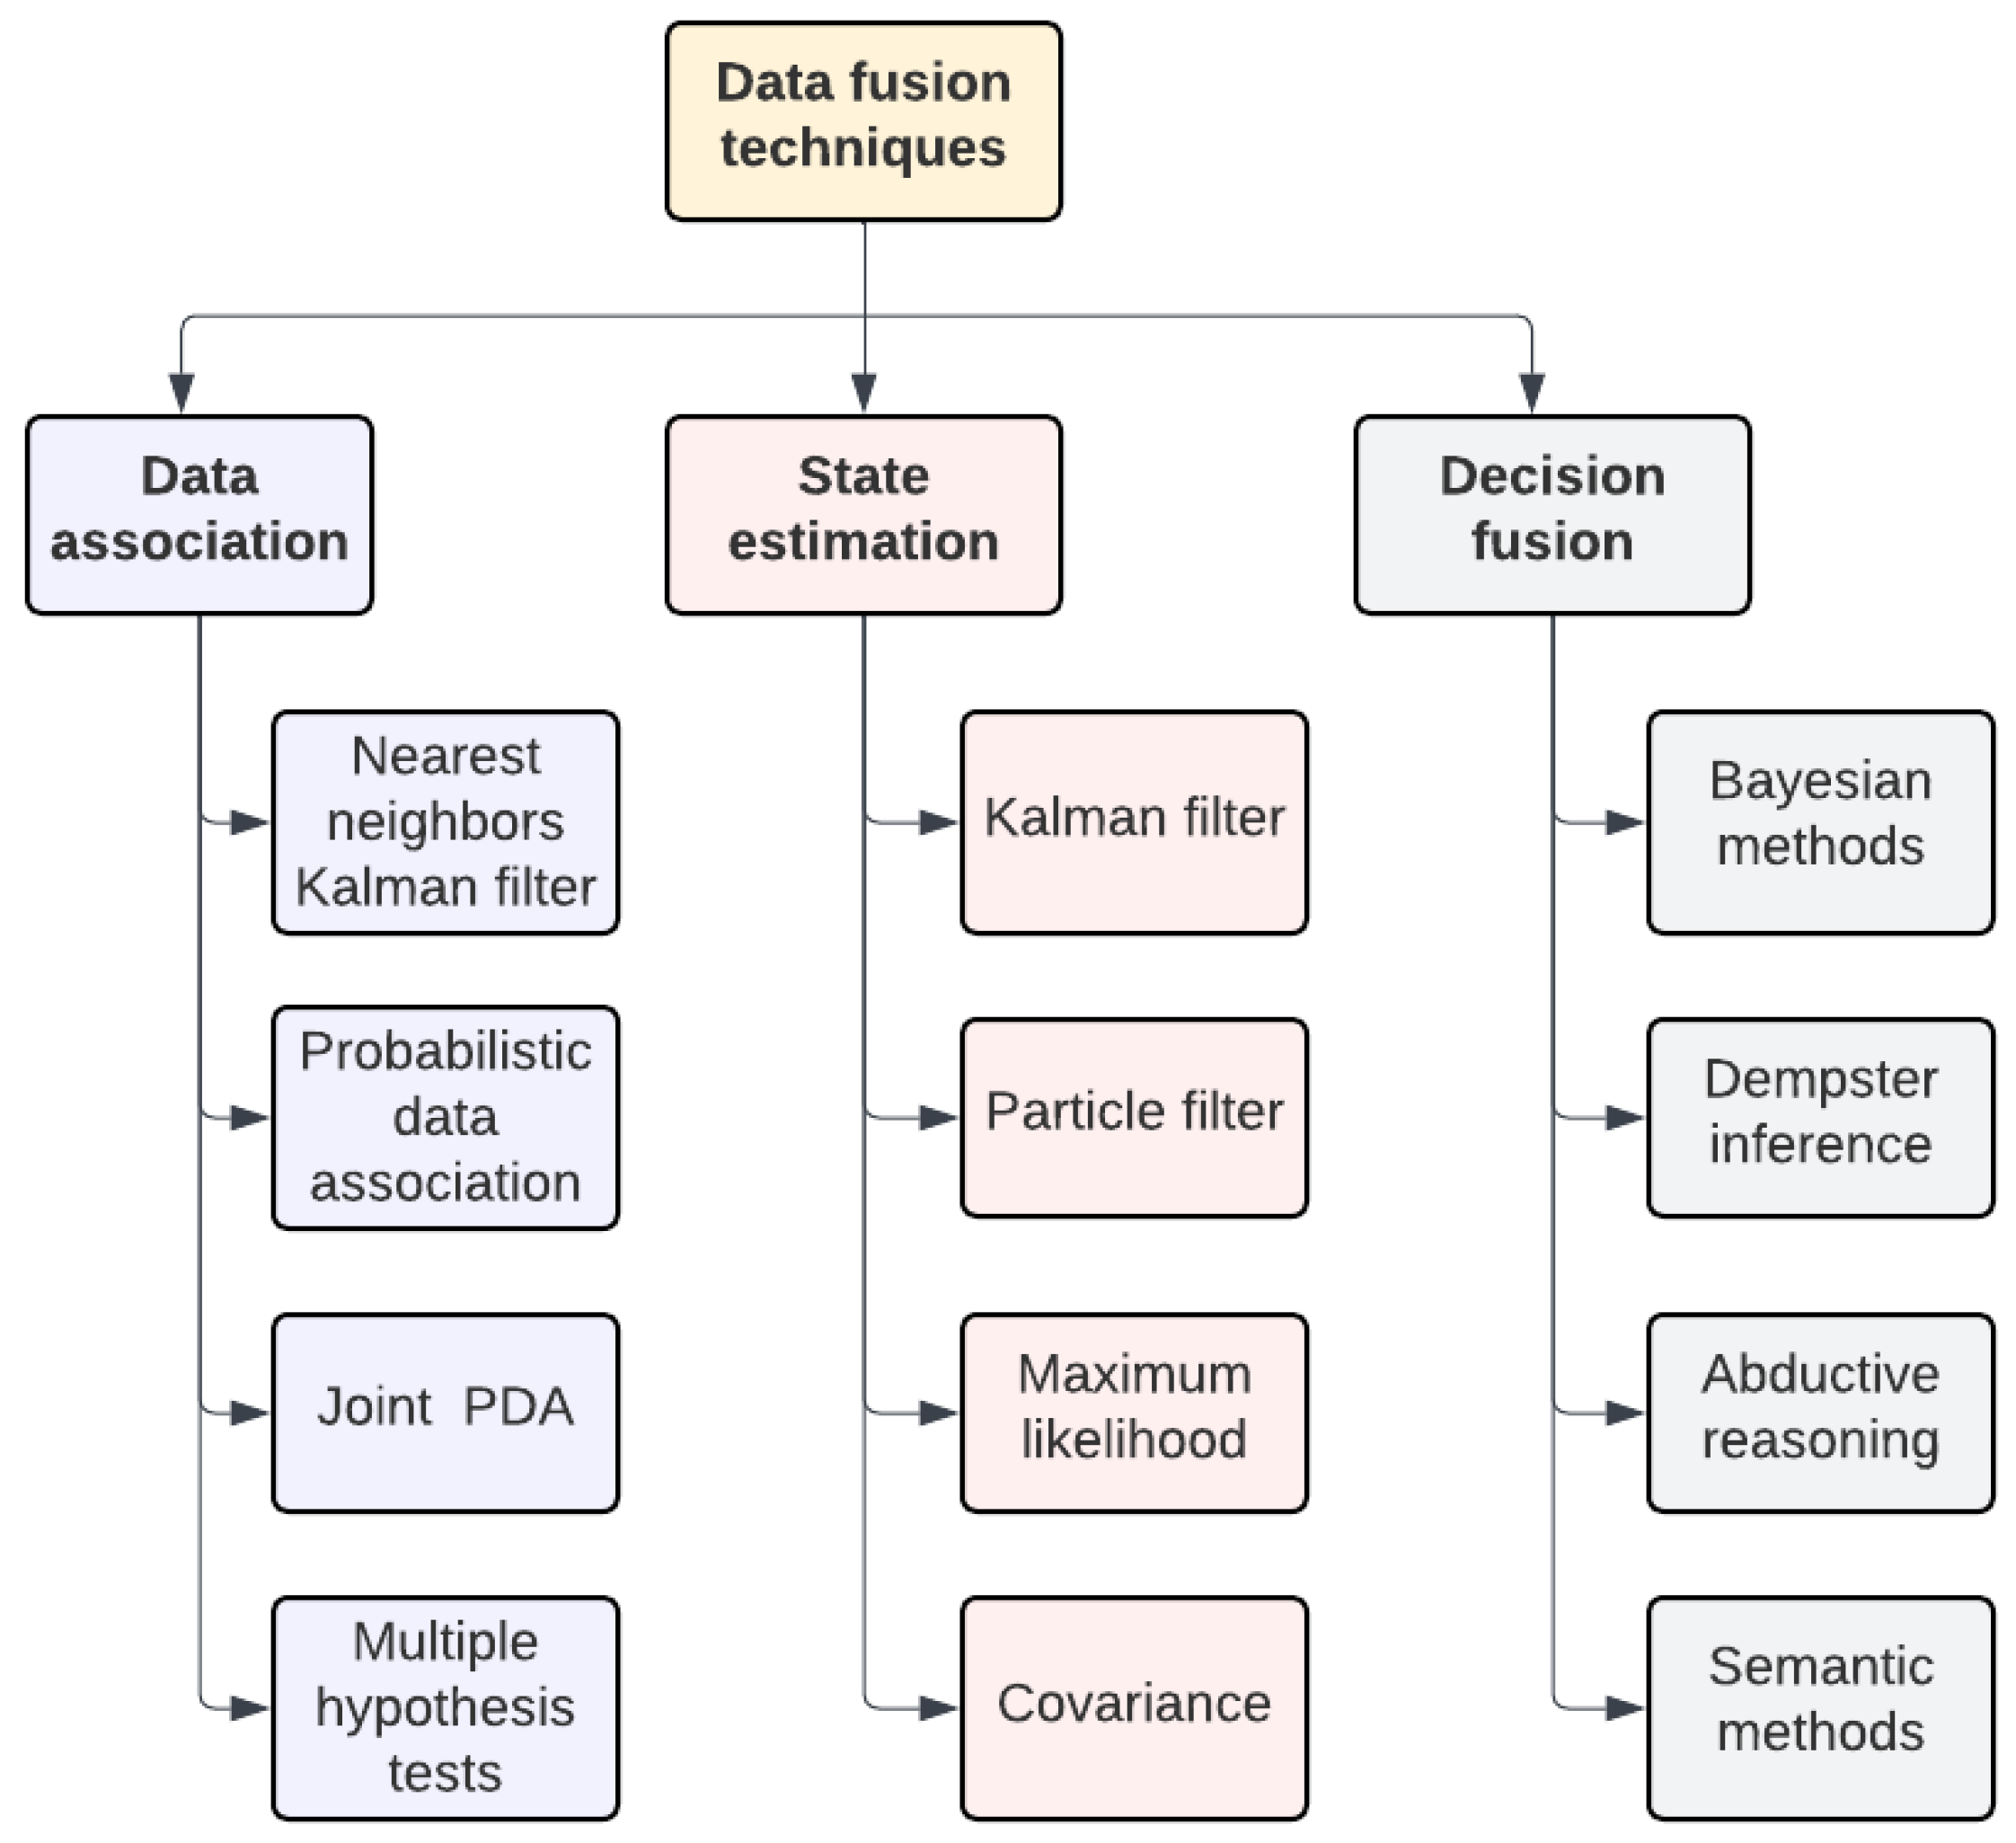
Within the domain of smart buildings, heterogeneous sensors [53] generate substantial volumes of data at an accelerated rate, stemming from the persistent monitoring of the physical environment [54]. Consequently, the implementation of real-time analytics (RTA) becomes imperative for the continuous and seamless processing of data streams. RTA is a technique for real-time data processing and analysis, offering valuable insights and enabling prompt decision making. Real-time analytics of IoT data can offer valuable information for decision making within IoT systems, thereby improving both system efficiency and reliability in a timely manner [55].
Unlike traditional batch processing, which analyzes data at set intervals, RTA offers an immediate and continuous understanding of events and data as they arrive within a specified timeframe. This time interval is usually measured in milliseconds, microseconds, or even nanoseconds, depending on the system. However, many applications might necessitate a combination of batch and real-time data processing (e.g., Lambda architecture). RTA is based on stream processing, which primarily involves ingesting a continuous stream of events to filter, enrich, join, transform, convert, route, and analyze data as they arrive in near-real-time [56,57]. As described by Milosevic et al. [57], a real-time property necessitates gathering data from multiple sources and processing them immediately upon arrival. This process frequently includes alerting humans to important events in the environment, triggering system components to execute specific tasks, or both.
The essential features of an efficient RTA include: (1) low latency to ensure timely responses to events within set time limits, (2) high availability to immediately process incoming events and avoid difficulties in storing or buffering high-volume, high-velocity data streams, and (3) horizontal scalability, which allows for the dynamic addition of servers to handle varying data volumes or processing workloads, ensuring that data are processed within the required time frames.

5.2. Data Fusion

Building management systems are evolving to integrate data from various IoT-based sensors. This provides information on the core operational systems within a facility, allowing facility managers to optimize building performance. The goal of gathering relevant and targeted information refers to the term data fusion.
Hall and Llinas [58] describe data fusion as a collection of methods for integrating data from various sensors and related information from associated databases, aiming to achieve greater accuracy and more precise inferences than using a single sensor alone. Due to the extensive body of literature on data fusion, this section does not aim to provide a comprehensive review on the field. Instead, it aims to delineate the key phases inherent in the sensor fusion framework.
In the context of smart buildings, sensor fusion involves combining data from various IoT sensors to create a cohesive, accurate, and dependable understanding of the monitored system’s behavior, thereby improving building operations. The main considerations are how to obtain data, how to standardize the data, and how to analyze the integrated data. Figure 4 presents a sensor fusion framework delineated into four sequential phases.
The initial “Sense” step encompasses the acquisition of environmental data from the physical world, utilizing a network of various IoT sensors and actuators to capture designated parameters such as temperature, humidity, pressure, occupancy, lighting, etc. After data acquisition, the “Perceive” stage is tasked with the interpretation of sensory information, converting raw data into coherent insights that can be leveraged for analytical purposes. The most common approach at this phase is analyzing the correlations between sensors’ activation and action recognition. The third “Plan” phase involves strategic analysis of the interpreted data to formulate actionable plans. Within the smart building domain, this is typically aimed at optimizing energy consumption, scheduling preventive maintenance, or modulating environmental conditions to enhance occupant comfort. Finally, the “Act” phase executes the strategic plan, directly interfacing with the BACS to implement the determined actions (e.g., modulating HVAC settings or energy consumption).
Sindhu and Saravanan [59] classify data fusion into two categories based on the type of architecture: centralized and decentralized data fusion. In centralized fusion, data from various sensors are sent to a central location, which is responsible for making the final decision. The central processor acts as the fusion node, aggregating raw measurements from all input sources. The primary advantage of this architecture is a unified processing environment, which contributes to more consistent and comprehensive data analysis. However, sending raw data through the network requires high bandwidth [60]. Another critical issue is the variable time delays in transferring information between sources, which affect the fusion results [61].
Conversely, in decentralized fusion, each sensor makes its own local decision and then sends it to the fusion node for further processing. Castanedo [61] describes a decentralized architecture as a network of nodes, each with its own processing capabilities, without a single central point for data fusion. Each node independently combines its local information with data received from its peers. The primary drawback of this architecture is scalability, which becomes challenging as the number of nodes increases. However, this issue can be alleviated through the use of DevOps practices [62] and IoT–edge–cloud continuum frameworks [63,64]. Different kinds of data fusion techniques are depicted in Figure 5.
  • Data association is the process of determining which measurements (or observations) correspond to each specific target being tracked. In a complex environment where multiple targets are present, and the sensor data might include false alarms or noise, it becomes critical to correctly associate each observation with its respective target.
  • State estimation is a technique that tries to determine the state (such as position) of a moving target. The challenge arises from the fact that the observations are often noisy, and it is not always clear which observations correspond to the target being tracked.
  • Decision fusion is a technique used to draw high-level conclusions about detected events and activities based on input from various data sources. These methods typically operate on symbolic information and aim to account for uncertainties in the reasoning process [61].
Choosing the most suitable technique depends on the nature of the problem and the underlying assumptions of each method.
In recent years, significant effort has been dedicated to researching data fusion. The study by Marcello and Pilloni [65] offers a framework designed to predict activities by analyzing the sequences of actions detected by sensors installed in a smart building. These activity sequences can be predicted by analyzing the correlation between successive actions, as users generally follow consistent patterns that remain relatively stable depending on the specific activity that they are performing. Daissaoui et al. [66] employ consistent metadata for building modeling: this approach involves utilizing sensor ontologies, subsystems, and relationships to guarantee seamless interoperability and portability.
Sensor data fusion enables thorough and consistent analysis of data from individual sensors, while combining data from multiple sensors improves the precision, reliability, and clarity of the resulting dataset. Nonetheless, this process encounters several challenges, including the imperfection and correlation of data, inconsistencies, and the heterogeneity of the datasets, which could be alleviated by employing an infrastructure-as-a-service approach [67] for initial validation and baseline data acquisition.

5.3. Building Information Modeling

Building information modeling (BIM) is a methodology designed to tackle issues related to information exchange, interoperability, and effective collaboration throughout a building’s lifecycle (i.e., from feasibility and conceptual design through to demolition and re-cycling stages) [68]. It is a digital model of a building that includes semantic information about objects, such as geometry, spatial location, and extensive metadata about the building’s properties, subsystems, devices, mechanical, electrical, and plumbing (MEP) equipment, etc. BIM can be categorized into various dimensions that represent the types of data being modeled [69,70]. These dimensions include:
  • Three-dimensional BIM (geometry): A 3D model of a building or infrastructure asset. This is the most basic level of BIM, and it provides a visual representation of the asset.
  • Four-dimensional BIM (time): A 3D model with time-related information, such as the construction schedule to see how the construction process will unfold over time.
  • Five-dimensional BIM (cost): A 3D model extended by adding cost information to track and identify cost-saving opportunities.
  • Six-dimensional BIM (sustainability): A 3D model that includes lifecycle information, such as the maintenance and operation requirements for the asset. It helps to plan long-term use of the asset and to optimize its performance.
  • Seven-dimensional BIM (management): A 3D model that includes sustainability information. This enables users to evaluate the environmental impact of the asset and make design choices that enhance sustainability.
  • Eight-dimensional BIM (safety): A 3D model that includes safety information. This enables users to detect and address safety risks during both the construction and operation of the asset.
The synergy between BIM, IoT devices, and the BACS enables a more intelligent, data-driven approach to building management by helping to handle large, complex, and dynamic sensor data. While time series data from IoT sensors offer numerical values and patterns, BIM data provide context and semantic connections between the building’s systems [71].

6. Discussion

The main concerns of this paper are to evaluate opportunities for designing an effective smart building monitoring system and explore different approaches for evaluating smart building parameters. The domains of lighting, HVAC systems, energy, and water consumption, as well as occupancy evaluation, are covered. This study has led to the following conclusions:
  • The effectiveness of lighting management is highly influenced by the type of room and its occupancy pattern. The maximum energy savings can be obtained by applying daylight harvesting and occupancy control strategies.
  • Monitoring the temperature throughout the building helps to optimize HVAC systems and avoid energy wastage. This can be achieved by time scheduling and occupancy-based methods; however, one of the challenging aspects of HVAC monitoring is the determination of an optimal sensor placement since the temperature distribution profile is not uniform within one location.
  • Energy management systems control and optimize the current energy consumption of buildings by monitoring the related energy-consuming resources. This is achieved by measuring both the static parameters (building materials, orientation, placement) and dynamic parameters (weather data, occupancy characteristics, energy use, water use). There are intrusive and non-intrusive energy monitoring techniques. Although the non-intrusive method is a more advantageous and effective way of gathering load data, it has a notable drawback, such as the inability to monitor all types of loads. One of the advanced methods of energy optimization is connecting HVAC systems to the same interface for a direct fine-tuning of temperature and comfort levels.
  • Aggregating the data from different IoT sensors via data fusion is remarkably important for decision-making systems. However, major challenges, such as the imperfection and correlation of data, inconsistencies, and the heterogeneity of the datasets, require the development of advanced predictive analytics algorithms. The accuracy of gathered data can be optimized by combining sensor fusion methods, based on data association, state estimation, or decision fusion.
  • The convergence of BIM with an IoT-enabled BACS promotes an informed, data-driven approach to building management. It automates complex operational tasks based on the analysis of IoT-generated data, enhancing system responsiveness to occupant demands while advancing sustainability objectives by optimizing resource allocation.

7. Conclusions and Outlook

This paper contributes by providing a comprehensive review and comparison of various sensor technologies used in building monitoring. It addresses the challenges of collecting data from a sensor network and the subsequent structuring and processing of these data. Our findings offer valuable insights for the development of a sensor-based network aimed at building monitoring. Consequently, this paper serves as a valuable resource for those new to the field, providing an introductory guide to building monitoring.
Building automation and control systems enable building managers and facility operators to oversee crucial parameters and operations within intricate environments by consistently gathering reliable, real-time data as events unfold. Managing smart buildings necessitates advanced computing infrastructures and the capability to handle high volumes of data generation.
For future research, it would be beneficial to develop a compatible smart facility monitoring framework suitable for the different types of public building architectures, focusing on the strategic integration of IoT devices and sensors within the BACS and BIM. It should involve an in-depth study of the standardized building ontologies and evaluation of the sensor interoperability, as well as privacy and security concerns.

Author Contributions

Conceptualization, I.L., K.O. and J.J.; methodology, I.L. and J.J.; validation, J.J. and K.O.; formal analysis, I.L., D.L. and M.S.; resources, I.L., D.L., and M.S.; writing—original draft preparation, I.L., D.L. and M.S.; writing—review and editing, I.L., K.O. and J.J.; funding, K.O. All authors have read and agreed to the published version of the manuscript.

Funding

This research was funded by the European Union’s Horizon Europe research and innovation programme under grant agreement No. 101092161, project “One Step Open DBL solution (openDBL)”.

Conflicts of Interest

The authors declare no conflicts of interest.

References

  1. Wu, J.; Guo, S.; Huang, H.; Liu, W.; Xiang, Y. Information and Communications Technologies for Sustainable Development Goals: State-of-the-Art, Needs and Perspectives. IEEE Commun. Surv. Tutor. 2018, 20, 2389–2406. [Google Scholar] [CrossRef]
  2. Global Smart Building Market Research Report. Forecast to 2030. 2022. Available online: https://www.fortunebusinessinsights.com/industry-reports/smart-building-market-101198 (accessed on 14 September 2023).
  3. Xie, J.; Tang, H.; Huang, T.; Yu, F.; Xie, R.; Liu, J.; Liu, Y. A Survey of Blockchain Technology Applied to Smart Cities: Research Issues and Challenges. IEEE Commun. Surv. Tutor. 2019, 21, 2794–2830. [Google Scholar] [CrossRef]
  4. Hassan, M.U.; Rehmani, M.H.; Chen, J. Differential Privacy Techniques for Cyber Physical Systems: A Survey. IEEE Commun. Surv. Tutor. 2018, 22, 746–789. [Google Scholar] [CrossRef]
  5. Hoy, M.B. Smart Buildings: An Introduction to the Library of the Future. Med. Ref. Serv. Q. 2016, 35, 326–331. [Google Scholar] [CrossRef] [PubMed]
  6. Santos, B.; Soares, A.; Nguyen, T.A.; Min, D.K.; Lee, J.W.; Silva, F.A. IoT Sensor Networks in Smart Buildings: A Performance Assessment Using Queuing Models. Sensors 2021, 21, 5660. [Google Scholar] [CrossRef]
  7. Shahinzadeh, H.; Moradi, J.; Gharehpetian, G.B.; Nafisi, H.; Abedi, M. Internet of Energy (IoE) in Smart Power Systems. In Proceedings of the 2019 5th Conference on Knowledge Based Engineering and Innovation (KBEI), Tehran, Iran, 28 February–1 March 2019; pp. 627–636. [Google Scholar]
  8. Janowicz, K.; Haller, A.; Cox, S.J.D.; Le-Phuoc, D.; Lefrançois, M. SOSA: A Lightweight Ontology for Sensors, Observations, Samples, and Actuators. J. Web Semant. 2018, 56, 1–10. [Google Scholar] [CrossRef]
  9. Lazarova-Molnar, S.; Mohamed, N. Collaborative data analytics for smart buildings: Opportunities and models. Clust. Comput. 2019, 22, 1065–1077. [Google Scholar] [CrossRef]
  10. Brooks, D.; Haskell-Dowland, P.; Coole, M. Building Automation and Control Systems An Investigation into Vulnerabilities, Current Practice and Security Management Best Practice; Technical Report; ASIS International: Alexandria, VA, USA, 2018.
  11. Building Automation and Control System Market (Offerings: Solution and Services; Technology: Wired and Wireless)—Global Industry Analysis, Size, Share, Growth, Trends, and Forecast, 2023–2031. 2023. Available online: https://www.transparencymarketresearch.com/building-automation-control-system-market.html (accessed on 21 February 2024).
  12. Habash, R. Sustainability and Health in Intelligent Buildings; Woodhead Publishing: Cambridge, UK, 2022. [Google Scholar]
  13. Yang, Y. Technical Code for Monitoring of Building Structures; Springer: Berlin/Heidelberg, Germany, 2020. [Google Scholar]
  14. Ferreira, B.; Poças-Martins, J. Expansion of IFC Model with Structural Sensors; Editorial CSIC: Madrid, Spain, 2013. [Google Scholar]
  15. Thapa, B.; Fernández, E.B.; Cardei, I.; Larrondo-Petrie, M. Abstract Entity Patterns for Sensors and Actuators. Compute 2023, 12, 93. [Google Scholar] [CrossRef]
  16. Building Artificial Intelligence into Buildings. 2018. Available online: https://www.ibm.com/thought-leadership/institute-business-value/en-us/report/buildingintelligence (accessed on 3 October 2023).
  17. Aghemo, C.; Virgone, J.; Fracastoro, G.V.; Pellegrino, A.; Blaso, L.; Savoyat, J.; Johannes, K. Management and monitoring of public buildings through ICT based systems: Control rules for energy saving with lighting and HVAC services. Collect. Front. Archit. Res. 2013, 2, 147–161. [Google Scholar] [CrossRef]
  18. Pacific Northwest National Lab. Wireless Occupancy Sensors for Lighting Controls: An Applications Guide for Federal Facility Managers; Pacific Northwest National Lab.: Richland, WA, USA, 2016.
  19. Dubois, M.C.; Bisegna, F.; Gentile, N.; Knoop, M.; Matusiak, B.; Osterhaus, W.; Tetri, E. Retrofitting the Electric Lighting and Daylighting Systems to Reduce Energy Use in Buildings: A Literature Review. Energy Res. J. 2015, 6, 25–41. [Google Scholar] [CrossRef]
  20. Pandharipande, A.; Caicedo, D. Smart indoor lighting systems with luminaire-based sensing: A review of lighting control approaches. Energy Build. 2015, 104, 369–377. [Google Scholar] [CrossRef]
  21. Malik, R.; Mondal, S.; Saha, N.K.; Bhunia, S. A CCT Tunable Daylight-Integrated LED Lighting System for the Improvement of Health and Well-Being of Human Beings. In Proceedings of the 2023 IEEE Sustainable Smart Lighting World Conference & Expo (LS18), Mumbai, India, 8–10 June 2023; pp. 1–5. [Google Scholar] [CrossRef]
  22. Gupton, G.W. HVAC Controls: Operation & Maintenance, 3rd ed.; Fairmont Press: Fairmont, MN, USA, 2002. [Google Scholar]
  23. HVAC Energy Breakdown. Available online: https://www.environment.gov.au/system/files/energy/files/hvac-factsheet-energy-breakdown.pdf (accessed on 25 October 2023).
  24. Sriram, S.; Hema, K.; Karthiga Shenbagam, N. HVAC Design and Operation for Green Buildings. In Proceedings of the Advances in Systems Engineering; Saran, V.H., Misra, R.K., Eds.; Springer: Singapore, 2021; pp. 687–694. [Google Scholar]
  25. Cao, N.; Ting, J.; Sen, S.; Raychowdhury, A. Smart Sensing for HVAC Control: Collaborative Intelligence in Optical and IR Cameras. IEEE Trans. Ind. Electron. 2018, 65, 9785–9794. [Google Scholar] [CrossRef]
  26. Bae, Y.; Bhattacharya, S.; Cui, B.; Lee, S.; Li, Y.; Zhang, L.; Im, P.; Adetola, V.; Vrabie, D.; Leach, M.; et al. Sensor impacts on building and HVAC controls: A critical review for building energy performance. Adv. Appl. Energy 2021, 4, 100068. [Google Scholar] [CrossRef]
  27. Yoganathan, D.; Kondepudi, S.; Kalluri, B.; Manthapuri, S. Optimal sensor placement strategy for office buildings using clustering algorithms. Energy Build. 2018, 158, 1206–1225. [Google Scholar] [CrossRef]
  28. Abo-Zahhad, M.; Ahmed, S.M.; Farrag, M.; Ahmed, M.F.A.; Ali, A. Design and implementation of building energy monitoring and management system based on wireless sensor networks. In Proceedings of the 2015 Tenth International Conference on Computer Engineering & Systems (ICCES), Cairo, Egypt, 23–24 December 2015; pp. 230–233. [Google Scholar]
  29. Mantha, B.; Menassa, C.; Kamat, V. A taxonomy of data types and data collection methods for building energy monitoring and performance simulation. Adv. Build. Energy Res. 2015, 10, 1–31. [Google Scholar] [CrossRef]
  30. Ridi, A.; Gisler, C.; Hennebert, J. A Survey on Intrusive Load Monitoring for Appliance Recognition. In Proceedings of the International Conference on Pattern Recognition, Stockholm, Sweden, 24–28 August 2014; pp. 3702–3707. [Google Scholar] [CrossRef]
  31. Aladesanmi, E.J.; Folly, K.A. Overview of non-intrusive load monitoring and identification techniques. FAC-Papers OnLine 2015, 48, 415–420. [Google Scholar] [CrossRef]
  32. Ramadan, R.; Huang, Q.; Bamisile, O. Non-intrusive Load Monitoring for Household Energy Disaggregation: A State-of-the-Art. In Proceedings of the 2022 IEEE 6th Conference on Energy Internet and Energy System Integration (EI2), Chengdu, China, 11–13 November 2022. [Google Scholar]
  33. Cannas, B.; Carcangiu, S.; Carta, D.; Fanni, A.; Muscas, C.; Sias, G.; Canetto, B.; Fresi, L.; Porcu, P. NILM techniques applied to a real-time monitoring system of the electricity consumption. Acta IMEKO 2021, 10, 139. [Google Scholar] [CrossRef]
  34. Bandarra, P.; Valdez, M.T.; Pereira, A. Solutions for monitoring and analysing for energy consumption—Energy management systems. In Proceedings of the 2016 51st International Universities Power Engineering Conference (UPEC), Coimbra, Portugal, 6–9 September 2016. [Google Scholar]
  35. Zhu, H.; Lian, X.; Liu, Y.; Zhang, Y.; Li, Z. Consideration of occupant preferences and habits during the establishment of occupant-centric buildings: A critical review. Energy Build. 2023, 280, 112720. [Google Scholar] [CrossRef]
  36. Arsene, D.; Predescu, A.; Pahonțu, B.; Chiru, C.G.; Apostol, E.S.; Truică, C.O. Advanced Strategies for Monitoring Water Consumption Patterns in Households Based on IoT and Machine Learning. Water 2022, 14, 2187. [Google Scholar] [CrossRef]
  37. Pule, M.; Yahya, A.; Chuma, J. Wireless sensor networks: A survey on monitoring water quality. J. Appl. Res. Technol. 2017, 15, 562–570. [Google Scholar] [CrossRef]
  38. Yang, L.; Yang, S.H.; Magiera, E.; Froelich, W.; Jach, T.; Laspidou, C. Domestic water consumption monitoring and behaviour intervention by employing the Internet of Things technologies. Procedia Comput. Sci. 2017, 111, 367–375. [Google Scholar] [CrossRef]
  39. Che Soh, Z.H.; Shafie, M.S.; Shafie, M.A.; Noraini Sulaiman, S.; Ibrahim, M.N.; Afzal Che Abdullah, S. IoT Water Consumption Monitoring & Alert System. In Proceedings of the 2018 International Conference on Electrical Engineering and Informatics (ICELTICs), Banda Aceh, Indonesia, 19–20 September 2018; pp. 168–172. [Google Scholar]
  40. Choosing a Water Flow Meter Type That’s Right for You. 2016. Available online: https://atlas-scientific.com/blog/water-flow-meter-types/ (accessed on 5 December 2023).
  41. Comparing Flow Meter Technology: Choosing the Meter. 2016. Available online: https://www.emersonautomationexperts.com/2016/measurement-instrumentation/comparing-flow-meter-technology-choosing-the-meter/ (accessed on 5 December 2023).
  42. Sonnekalb, T.; Lucia, S. Smart Hot Water Control with Learned Human Behavior for Minimal Energy Consumption. In Proceedings of the 2019 IEEE 5th World Forum on Internet of Things (WF-IoT), Limerick, Ireland, 15–18 April 2019; pp. 572–577. [Google Scholar]
  43. Metallidou, C.K.; Psannis, K.E.; Egyptiadou, E.A. Energy Efficiency in Smart Buildings: IoT Approaches. IEEE Access 2020, 8, 63679–63699. [Google Scholar] [CrossRef]
  44. Rabiee, R.; Karlsson, J. Multi-Bernoulli Tracking Approach for Occupancy Monitoring of Smart Buildings Using Low-Resolution Infrared Sensor Array. Remote Sens. 2021, 13, 3127. [Google Scholar] [CrossRef]
  45. Melfi, R.; Rosenblum, B.; Nordman, B.; Christensen, K. Measuring building occupancy using existing network infrastructure. In Proceedings of the 2011 International Green Computing Conference and Workshops, Orlando, FL, USA, 25–28 July 2011; pp. 1–8. [Google Scholar]
  46. Howard, B.; Acha, S.; Shah, N.; Polak, J.W. Implicit Sensing of Building Occupancy Count with Information and Communication Technology Data Sets. Build. Environ. 2019, 157, 297–308. [Google Scholar] [CrossRef]
  47. Shen, W.; Newsham, G.R.; Gunay, B. Leveraging existing occupancy-related data for optimal control of commercial office buildings: A review. Adv. Eng. Inform. 2017, 33, 230–242. [Google Scholar] [CrossRef]
  48. Cheng, Y.; Fang, C.; Yuan, J.; Zhu, L. Design and Application of a Smart Lighting System Based on Distributed Wireless Sensor Networks. Appl. Sci. 2020, 10, 8545. [Google Scholar] [CrossRef]
  49. Elkenawy, A.; Judvaitis, J. Transmission power influence on wsn-based indoor localization efficiency. Sensors 2022, 22, 4154. [Google Scholar] [CrossRef]
  50. Huang, X.; Liu, Y.; Huang, L.; Onstein, E.; Merschbrock, C. BIM and IoT data fusion: The data process model perspective. Autom. Constr. 2023, 149, 104792. [Google Scholar] [CrossRef]
  51. Bagchi, M.V.A.; Moselhi, O. Managing structural health monitoring data using building information modeling. In Proceedings of the 2nd World Congress and Exhibition on Construction and Steel Structure, Las Vegas, NV, USA, 22–24 September 2016. [Google Scholar]
  52. Judvaitis, J.; Abolins, V.; Elkenawy, A.; Balass, R.; Selavo, L.; Ozols, K. Testbed Facilities for IoT and Wireless Sensor Networks: A Systematic Review. J. Sens. Actuator Netw. 2023, 12, 48. [Google Scholar] [CrossRef]
  53. Judvaitis, J.; Abolins, V.; Mednis, A.; Balass, R.; Nesenbergs, K. The Definitive Guide to Actual Sensor Network Deployments in Research Studies from 2013–2017: A Systematic Review. J. Sens. Actuator Netw. 2022, 11, 68. [Google Scholar] [CrossRef]
  54. Balass, R.; Medvedevs, V.; Mackus, A.I.; Ormanis, J.; Ancans, A.; Judvaitis, J. Precise realtime current consumption measurement in IoT TestBed. Open Res. Eur. 2024, 3, 27. [Google Scholar] [CrossRef] [PubMed]
  55. Yu, T.; Wang, X. Real-Time Data Analytics in Internet of Things Systems. In Handbook of Real-Time Computing; Tian, Y.C., Levy, D.C., Eds.; Springer Nature: Singapore, 2022; pp. 541–568. [Google Scholar] [CrossRef]
  56. Real-Time Analytics. 2023. Available online: https://dzone.com/articles/real-time-analytics-1 (accessed on 11 October 2023).
  57. Milosevic, Z.; Chen, W.; Berry, A.; Rabhi, F. Chapter 2—Real-Time Analytics. In Big Data; Buyya, R., Calheiros, R.N., Dastjerdi, A.V., Eds.; Morgan Kaufmann: Cambridge, MA, USA, 2016; pp. 39–61. [Google Scholar] [CrossRef]
  58. Hall, D.L.; Llinas, J. An introduction to multisensor data fusion. Proc. IEEE 1997, 85, 6–23. [Google Scholar] [CrossRef]
  59. Sindhu, S.; Saravanan, M. Architectural framework for Multi sensor Data fusion and validation in IoT Based system. In Proceedings of the 2021 10th IEEE International Conference on Communication Systems and Network Technologies (CSNT), Bhopal, India, 18–19 June 2021; pp. 448–452. [Google Scholar]
  60. Judvaitis, J.; Salmins, A.; Nesenbergs, K. Network data traffic management inside a TestBed. In Proceedings of the 2016 Advances in Wireless and Optical Communications (RTUWO), Riga, Latvia, 3–4 November 2016; pp. 152–155. [Google Scholar]
  61. Castanedo, F. A Review of Data Fusion Techniques. Sci. World J. 2013, 2013, 704504. [Google Scholar] [CrossRef] [PubMed]
  62. Judvaitis, J.; Nesenbergs, K.; Balass, R.; Greitans, M. Challenges of DevOps ready IoT Testbed. In Proceedings of the MDE4IoT/ModComp@ MoDELS, Munich, Germany, 15–17 September 2019; pp. 3–6. [Google Scholar]
  63. Judvaitis, J.; Balass, R.; Greitans, M. Mobile iot-edge-cloud continuum based and devops enabled software framework. J. Sens. Actuator Netw. 2021, 10, 62. [Google Scholar] [CrossRef]
  64. Arzovs, A.; Judvaitis, J.; Nesenbergs, K.; Selavo, L. Distributed Learning in the IoT–Edge–Cloud Continuum. Mach. Learn. Knowl. Extr. 2024, 6, 283–315. [Google Scholar] [CrossRef]
  65. Marcello, F.; Pilloni, V. Sensor-Based Activity Recognition Inside Smart Building Energy and Comfort Management Systems. In Proceedings of the 2019 IEEE 5th World Forum on Internet of Things (WF-IoT), Limerick, Ireland, 15–18 April 2019; pp. 639–643. [Google Scholar]
  66. Daissaoui, A.; Boulmakoul, A.; Karim, L.; Lbath, A. IoT and Big Data Analytics for Smart Buildings: A Survey. In Proceedings of the ANT/EDI40, Warsaw, Poland, 6–9 April 2020. [Google Scholar]
  67. Salmins, A.; Judvaitis, J.; Balass, R.; Nesenbergs, K. Mobile wireless sensor network TestBed. In Proceedings of the 2017 25th Telecommunication Forum (TELFOR), Belgrade, Serbia, 21–22 November 2017; pp. 1–4. [Google Scholar]
  68. Borrmann, A.; König, M.; Koch, C.; Beetz, J. Building Information Modeling: Technology Foundations and Industry Practice; Springer International Publishing: Cham, Switzerland, 2018; Available online: https://books.google.lv/books?id=t3dvDwAAQBAJ (accessed on 17 September 2024).
  69. Salman, N.; Hamadeh, M. The Integration of Virtual Design and Construction (VDC) with the Fourth Dimension of Building Information Modeling (4D BIM). Int. J. BIM Eng. Sci. 2023, 7, 8–27. [Google Scholar] [CrossRef]
  70. Aung, T. Dimensions in BIM: 7 BIM Dimensions Explained. Available online: https://www.novatr.com/blog/dimensions-in-bim (accessed on 6 September 2024).
  71. Ceccarini, C.; Mirri, S.; Prandi, C. Designing Interfaces to Display Sensor Data: A Case Study in the Human-Building Interaction Field Targeting a University Community. Sensors 2022, 22, 3361. [Google Scholar] [CrossRef]
Figure 1. Three-layer BACS architecture [10].
Applsci 14 10057 g001
Figure 2. Stages of NILM implementation.
Applsci 14 10057 g002
Figure 3. Occupancy resolution levels by Melfi et al. [45].
Applsci 14 10057 g003
Figure 4. Sensor fusion framework.
Applsci 14 10057 g004
Figure 5. Data fusion techniques [59].
Applsci 14 10057 g005
Table 1. Energy savings for each lighting management strategy.
StrategyEnergy Savings
Manual control23–77%
Time scheduling12%
Daylight harvesting10–93%
Occupancy control20–93%
Combined daylight
harvesting and occupancy
26%
Table 2. Cost and accuracy of different liquid flow meters [41].
Flow Meter TypeCostAccuracy, %
Mechanicallow1% of flow rate
Vortexmedium0.65% liquid
Electromagneticmedium0.15% of flow rate
Ultrasonichigh1–2% (wetted), 3–10% (non-invasive)
Turbinelow0.25% of flow rate
Disclaimer/Publisher’s Note: The statements, opinions and data contained in all publications are solely those of the individual author(s) and contributor(s) and not of MDPI and/or the editor(s). MDPI and/or the editor(s) disclaim responsibility for any injury to people or property resulting from any ideas, methods, instructions or products referred to in the content.

