Abstract
Humans have the unique ability to discern spatial and temporal regularities in their surroundings. However, the effect of learning these regularities on eye movement characteristics has not been studied enough. In the present study, we investigated the effect of the frequency of occurrence and the presence of common chunks in visual images on eye movement characteristics like the fixation duration, saccade amplitude and number, and gaze number across sequential experimental epochs. The participants had to discriminate the patterns presented in pairs as the same or different. The order of pairs was repeated six times. Our results show an increase in fixation duration and a decrease in saccade amplitude in the sequential epochs, suggesting a transition from ambient to focal information processing as participants acquire knowledge. This transition indicates deeper cognitive engagement and extended analysis of the stimulus information. Interestingly, contrary to our expectations, the saccade number increased, and the gaze number decreased. These unexpected results might imply a reduction in the memory load and a narrowing of attentional focus when the relevant stimulus characteristics are already determined.
Keywords:
eye movements; fixation duration; saccade amplitude; saccade number; gaze number; learning; memory 1. Introduction
Humans detect and extract the temporal and spatial regularities in the environment through a process called statistical learning. While much research has been focused on distributional regularities (e.g., frequency of occurrence) and transitional probabilities (e.g., order of appearance), higher-order regularities remain underexplored [1]. Moreover, in typical studies on statistical learning, the acquired knowledge of the statistical regularities is not examined in its development but is evaluated in a subsequent test phase. One way to explore the learning process is by using non-observational tasks that require a response from the participants. This approach is used in studies applying either the Serial Reaction Time (SRT) task [2] or the Alternating Serial Reaction Time task (e.g., [2]). In both tasks, the stimulus location and order are manipulated, thus varying the predictability of the targets. The participants respond manually, and the response time change in the experimental trials is a measure of the learning success. In a recent study, [3] used eye movement records to evaluate the temporal dynamics of the learning process by examining the occurrence of anticipatory eye movements during the experiment. This study is one of the few studies that evaluate the changes in eye movement characteristics across trials to characterize the ongoing process of learning. However, the eye movement characteristics may provide richer information than those evaluated by the predictive gaze landings on targets with variable predictivity. Eye movements can provide insight into the unobservable processes of visual selection, decision making, and uncertainty reduction associated with learning.
It is generally believed that statistical learning occurs without awareness (e.g., [4]), i.e., it involves implicit memory. Ramey and co-authors [5] explored whether gaze behavior changes depending on the involvement of explicit or implicit memory in a visual search task. The study’s results showed that the location of the first fixation depended on explicit memory, whereas the search efficiency evaluated by the eye scan path improved due to unconscious memory. The study also showed that the effects of the two memory types were independent.
Other authors (e.g., [6,7]) suggested that eye movements were not needed for implicit learning of spatial configurations. Arató and co-authors [8] provided evidence for the mutual connection between eye movement patterns and the acquired knowledge about the statistical structure of the scenes. Their study explored the interaction between eye movement characteristics and the learning process without a well-defined task. However, natural vision is an active process, and movements of the eyes allow continuous comparison of the current visual input with prior experience to guide our future behavior (e.g., make decisions, navigate [9], and use the acquired knowledge from a scene in future situations and conditions).
Eye movements are not random but reflect both bottom-up and top-down processes. The bottom-up processes are associated with the salience of the image features like edge distribution, contrast, color, size, and other low-level features. In the present study, we aimed to evaluate whether the eye movement behavior reflects the process of learning the high-order regularities in image characteristics when the salience of the stimuli does not differ significantly. Hence, the differences in eye movement characteristics primarily reflect top-down attentional control.
We manipulated the spatial regularities in visual displays, varying the repetition frequency, the co-occurrence of chunks, and the similarity of patterns, aiming to evaluate the interaction between the accumulated knowledge and the gaze behavior. Spatial regularities in a visual scene are related to the eye landings at relevant areas of interest in the visual scenes, whereas temporal regularities produce anticipatory eye movements reflecting the prediction of future stimulus positions based on the acquired knowledge from the stimulation.
We studied the potential changes in four characteristics of eye movements: fixation duration, saccade number, gaze number, and saccade amplitude. The fixation duration is related to the depth and speed of the information processing. Short fixations (50–150 msec) [10] are considered ambient, reflecting unconscious processing. Focal fixations [10] are supposed to reflect conscious processing, focusing on details and object identification.
The focal/ambient mode of image processing is also associated with changes in saccade amplitude. Short fixations are usually combined with large saccades, while the opposite is true for long fixations, reflecting the focal mode of processing. Unema and co-authors [11] showed a transition from an ambient mode of processing (short fixations and large saccade amplitudes) to a focal processing mode (long fixations and short saccades) during a single trial. In our study, conversely, we aim to explore the changes in the dynamics of eye movements during the learning process. We hypothesize that the participants will use the ambient mode of processing in the initial stages of the study to obtain maximal information about the spatial layout of the images. In contrast, when they acquire enough knowledge of the stimulus structure, they will switch to the focal mode with longer fixations, indicating deeper cognitive processes and a longer time for analyzing and interpreting the stimulus information. Hence, we expect the fixation duration to increase and the saccade amplitude to decrease in the learning and practice process.
Alternatively, the fixation duration might decrease. Short fixations are seen, for example, for expert readers (e.g., [12,13]). Practice is shown to reduce the location and identity uncertainty in visual search tasks, thereby reducing fixation duration [14,15]. Moreover, the participants were under time pressure (we limited the stimulus presentation to 3 s), a condition also known to reduce fixation duration [16]. Hence, in our experimental conditions, the repetition frequency of the patterns and the co-occurrence of visual chunks may allow participants to gain familiarity with the pattern combinations, adopting strategies that enable them to process relevant stimulus information more rapidly. Such an experimental outcome aligns with findings from previous studies, which suggest that expertise and time constraints can lead to shorter fixation durations as participants become more efficient in their visual search strategies.
If a transition from an ambient to a focal mode of processing occurs during the sequential trials, the saccade amplitude would be expected to decrease in the sequential blocks due to the correlation between the fixation duration and saccade amplitude. Moreover, it has been shown that the repetitive presentation of the patterns leads to a smaller attentional span and, thus, smaller saccade amplitudes [17,18].
The saccade number is tightly related to the number of fixations. It is supposed to reflect the efficiency of information search behavior, the complexity of the inference processes, and information acquisition. We expect that the saccade number will decrease in the sequential blocks of the trials due to the knowledge of the task and the improved discrimination of relevant from irrelevant stimulus information. However, in a study testing repetition effects in visual search [5], the authors related the improvement in search performance to unconscious memory. They showed that the unconscious memory did not affect the saccade number but made each saccade more efficient.
The gaze number reflects the number of regions of interest the participants select to perform the task. We expect that it will decrease due to learning the relevant stimulus characteristics for a task’s performance and the increased efficiency in their selection.
In summary, we expect that acquiring knowledge about the image regularities would affect the gaze behavior, although the direction of this change is not well defined in advance. We hypothesize that it will also depend on the context, i.e., on the similarity of the patterns in the image and the difficulties of their discrimination.
2. Materials and Methods
2.1. Stimuli
The stimuli were twelve patterns of black squares of size 10 × 10 cm and 15 yellow squares (size 1 × 1 cm) inside them (Figure 1). The patterns were divided into three groups, and the members of each group were never presented with the members of another group. The patterns in Groups 1 and 2 always contained two chunks (groups of connected elements) of 5 squares. Two patterns (A and D) in these groups had the same 5-element chunks but in different positions. The other two patterns (B and C) had one common chunk with patterns A and D. The patterns in Group 3 had chunks of variable numbers.
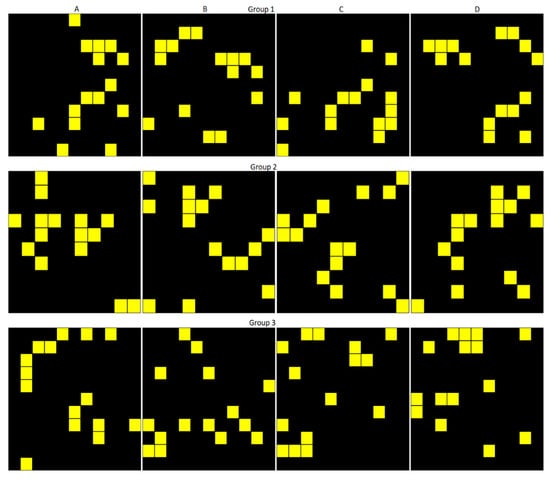
Figure 1.
Pattern set used in the stimuli design. Each column contains patterns A, B, C, and D; each row—the patterns from different groups.
The patterns in each group were combined in pairs. The pattern on the left was presented in its original orientation, while the patterns on the right were rotated by 90°, 180°, or 270°. The patterns from each group were presented on both sides of a stimulus. The stimulus set contained 72 unique combinations of patterns. Only one of the patterns (A) in each group was combined with itself, although in different orientations.
We selected simple geometric shapes forming various chunks of different number and shape to avoid the effect of previous knowledge on the learning process. This choice is typical for many other studies of visual statistical learning (to name a few, [8,19,20,21,22]). Moreover, a recent study [23] showed that preexisting knowledge impacted statistical learning. Abstract shapes or geometric patterns have a better-defined structure that allows for a better identification of learning effects, without the confounding effect of previous experience or the insufficient control of other factors affecting the salience of the visual scenes or top-down factors.
2.2. Procedure
The patterns in a stimulus pair were presented on a gray background in the middle of a computer screen in a vertical direction and 2.5 cm to the left and right of the screen center in a horizontal direction so that the distance between their closest edges was 5 cm. The observers had to respond to whether the two patterns in a pair were the same or different. If the observers did not respond with a mouse click for 3 s, the stimulus disappeared and the screen turned gray. The stimulus duration was determined in a preliminary pilot study performed with experienced participants. This duration allows the task performance in the initial blocks to exceed slightly that of random guessing and avoids ceiling effects in the later experimental blocks. Other studies [24,25,26] also used a 3 s presentation time to explore the oculomotor anticipation in a serial reaction time task.
We included the patterns of Group 3 with a variable number of chunks to examine the effect of chunk co-occurrence on performance during the learning process. The choice of the patterns in the groups also allows for evaluation of the effect of perceptual load and task difficulty on the process of learning the regularities in the stimulus set.
The combination of the same patterns (combination AA) was presented nine times in the stimulus sequence, whereas the other combinations were presented only once. Thus, the stimulus sequence contained 90 stimulus pairs, presented in random order.
Each participant took part in three experimental sessions. In each session, the stimulus sequence was repeated twice; hence, six blocks of stimuli were presented in the same order. We will use the term epoch for the sequential blocks in the experiments.
Before each experimental session, the eye movements of the participants were calibrated using a 9-point calibration procedure. The eye movements were recorded with a head-mounted Jazz-Novo multisensor measurement system (Ober Consulting Sp. z o.o., Poznan, Poland) with a sampling frequency of 1000 Hz. It measures the eye movements of both eyes in horizontal and vertical directions by direct infrared oculography. High temporal precision is not essential for the studied eye movement characteristics, except for the fixation duration evaluation, but this system provides the spatial resolution needed for the present study. The participants sat in a dark room at a distance of 57 cm. Their heads were supported by a chin rest.
2.3. Participants
Ten naïve observers aged 26 to 59 (average age 41.7) participated in the study. They were recruited from the staff of the institutes of the Bulgarian Academy of Sciences and gave written informed consent to participate in the study. The sample size is relatively small, but we used a large set (72) of unique stimuli. Wilming and co-authors [27] showed that in the spatial analysis of eye movements, the sample size and the stimulus set can compensate for each other. The experiment was approved by the Ethical Board of the Institute of Neurobiology, Bulgarian Academy of Sciences (Protocol 48 from 6 June 2023).
2.4. Data Analyses and Measures
Eye tracking software (JazzManager 3.13 created by Ober Consulting Sp. z o.o., Poznan, Poland in cooperation with Nalecz Institute of Biocybernetics and Biomedical Engineering, Polish Academy of Sciences, Warsaw, Poland) was used to divide the eye movements into saccades and fixations using a threshold velocity of 30 deg/s and an acceleration threshold of 8000 deg/s2. The potential calibration errors and eye drifts were corrected using the Iterative Closest Point algorithm [28].
We used the saccade number, the saccade amplitude, fixation duration, and gaze number to characterize the potential change in gaze behavior in the epochs. These characteristics were evaluated only during the stimulus presentation; thus, we excluded the memory-guided eye movements from the analyses.
The gaze number was estimated using the DBSCAN clustering algorithm [29] to aggregate the fixations into regions of interest. The clusters of fixation positions were required to have at least 200 data points (corresponding to a fixation duration of at least 200 msec for sequential eye records).
All statistical analyses were performed in an R environment [30]. We used generalized mixed models to evaluate the effect of stimulus similarity and the potential learning effects on the kinematics of eye movements. The models were fitted with the brms package [31]. This method is more robust for complex data structures and small sample sizes than frequentist methods. We needed to apply generalized mixed models to take into account the specifics of the data, the individual differences between the participants, and the non-normal distributions of the eye movement characteristics. Too often, the frequentist methods do not converge when applied to these types of models.
For all tested characteristics, we treated the pattern combinations not as random factors but as categorical variables, as the stimulus combinations were formed following specific rules. This choice allows us to evaluate the effect of pattern similarity on eye movement characteristics. In the modeling, we started with the complete set of 72 unique pattern pairs, i.e., assuming that the pattern position and orientation would change the gaze behavior. We also tested simpler models in which the pattern orientation or position was disregarded. Models, disregarding only the rotation angle of the patterns on the right, included 24 unique stimulus pairs, whereas when the relative position of the patterns in a pair was also disregarded, the unique stimuli were 15. We used cross-validation for model comparison. This approach depends less on the prior distribution than the model comparison based on the Bayesian factor (BF).
The fixation duration has a skewed distribution of positive values. We used a shifted lognormal distribution for the likelihood. Based on the earlier research data and the high variability in fixation duration, we used a normal distribution with a mean of 5 and a standard deviation of 0.8 as prior distribution for the pattern combinations. This choice implies that the expected saccade duration is about 245 msec and varies with the stimuli and the blocks in the 0 to 8000 msec range. The sigma was assumed to have a normal distribution with a zero mean and a standard deviation of 1.5. The standard deviation of the model parameters was modeled with normal distribution with a zero mean and a standard deviation of 0.5. We used the default values to model the shift in the distribution.
The data for the saccade amplitude have only positive values and could be considered as continuous variables. The exploratory analysis of the amplitudes showed that they had bimodal distributions. We modeled their likelihood function with a hurdle lognormal distribution. We used a normal distribution with a mean of 10 and a standard deviation of 3 for the prior distribution for the effect of the combinations and the epochs. This choice implies that the expected average number of saccades is about 15, and it could change for the different combinations or in the sequential blocks from 12 to 18.
The data for the saccade and gaze numbers are counts, i.e., positive integers. They were modeled first by a Poisson distribution. Both identity and log links were tested, but the post-predictive checks did not fit the experimental data well, so we used a negative binomial distribution for the modeling. This distribution relaxes the assumption of the equality of the mean and the variance characteristic of the Poisson distribution and allows for estimation of the dispersion directly from the data. The prior distribution for the main effects for the saccade number was set to a truncated normal (1, 1), implying the mean expected number of saccades of 10 and a range from 0 to 24. For the gaze number, we used a truncated normal distribution with a mean of three and a standard deviation of 3, meaning that we expected the range for the gaze number to vary from 0 to about 18 with a mean value of around 4.
The choice of prior distributions was governed by the recommendation of [32] to include a range of uncertainties larger than any plausible parameter value.
In modeling, we used 4 to 8 chains and 2000 to 30,000 iterations per chain, with the warm-ups being half of the iteration number. All model choices approximated the distribution of the response variables well, as shown by posterior predictive checks. Visual examination of the model trace plots did not indicate problems with chain mixing. Moreover, the Rhat values, i.e., the ratio of the variance across chains to the variance within chains [33], were less than 1.05, showing model conversion. The effective sample size measures exceed 5000, suggesting that the models provide stable parameter estimates.
We used the 95% credible intervals of the posterior distributions and their overlap to decide whether a difference in model parameters was significant. These intervals specify the uncertainty of the estimates and that the range of values of a parameter generated by the data lies within a 95% probability. Moreover, hypothesis testing on the effect of the experimental factors and the evidence ratio (ER) is provided to quantify the strength of evidence in favor of one hypothesis over another. We estimated the probability of direction (pd) of the model parameters. Its value varies between 50% and 100%, and it could indicate whether a parameter is strictly positive or negative. We assumed that a pd of 95% showed a notable change in a parameter.
As a measure of similarity between the patterns, we evaluated the cross-correlation between the patterns in a pair, the sum of the squared distances between the two patterns, the structure similarity index, the Jaccard similarity coefficient for binary images, and the Sørensen–Dice similarity coefficient. The Sørensen–Dice similarity coefficient gives the intersection between the point sets of the two patterns regarded as binary images divided by their sum.
3. Results
3.1. Fixation Duration
Typically, the fixation duration has skewed distributions to the right with median values around (200–250 msec) and larger mean values around 300–350 msec [10,11,34]. Our study has a few excessively long fixations (over 2 s) due to there being only one participant. These values did not exceed Tukey’s fences and were not excluded from the data. Please note that we have restricted the eye movement analysis only to data obtained during the stimulus presentation. Hence, the largest possible fixation duration could equal the stimulus duration. The range of the fixation duration was 151–3000 msec with a median of 260 msec. The overall mean fixation duration was 314.19 msec. Figure 2 shows the distribution of the fixation duration in the various epochs of our study. It shows the skewed distribution of the fixation times and a decrease in the number of the shortest fixation durations in the sequential blocks. Overall, this trend shifts the median of the distributions to larger values consistent with our hypotheses of an increased fixation time in the sequential blocks.
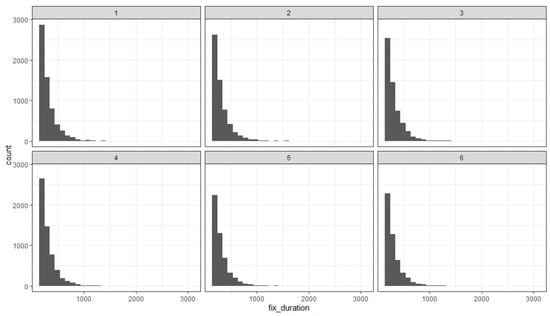
Figure 2.
Distribution of the fixation duration in the sequential epochs (1–6) of the experiment.
We performed three models considering the effect of the pattern position and orientation in a stimulus pair (using all 72 pattern combinations), disregarding the rotation angle (using a stimulus set of 24 combinations), or disregarding the position swap and rotation angle (using a stimulus set of 15 combinations).
The model comparison shows that the simplest model, which disregards the position and rotation angle of the patterns in a stimulus, better describes the experimental data than the full model.
After verifying the model’s plausibility and the chosen prior values, we tested the hypothesis that the fixation duration shortens with practice. Unema and co-authors [11] suggested that the initial image viewing involved shorter fixations and larger saccade amplitudes, representing ambient processing. In contrast, smaller saccade amplitudes and longer fixation duration in the later viewing period represented focal processing. These results, however, concern the fixation duration in a single trial.
Figure 3 and Figure 4 present the conditional effects obtained from the model and the changes in fixation duration for the different stimuli and epochs.
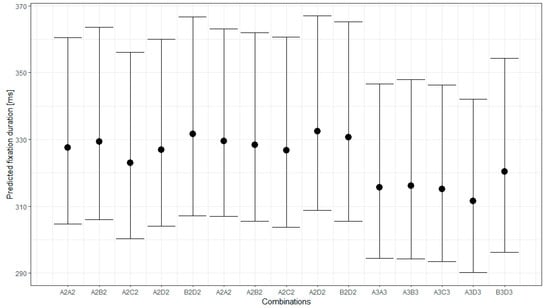
Figure 3.
Predicted fixation duration for the different pattern combinations with 95% credible interval.
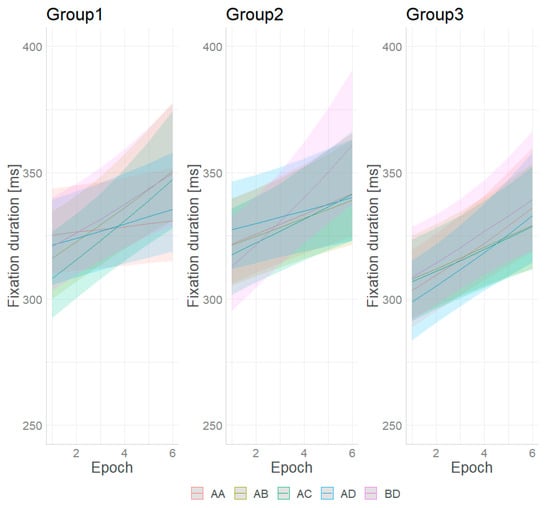
Figure 4.
Predicted fixation duration for the different stimuli and epochs with 95% credible interval.
Figure 4 shows that the pattern combinations do not substantially change the fixation duration. The pairwise comparison of the fixation duration for the different pattern combinations and their 95% credible intervals (CIs) implies that the fixation duration for the pairs in each group and between Groups 1 and 2 did not differ significantly. Most of the stimuli from these groups induce significantly longer fixation durations than the combinations in Group 3. An exception is the combination BD from Group 3, which does not differ significantly in fixation duration from the combinations of Groups 1 and 2. It should be noted that the BD combination is the only one for which the two patterns in the pair did not swap positions.
The effect of learning, if any, is represented by the interaction between the sequential epochs and the combination pairs. Figure 4 shows that the change in fixation duration is largest for the BD pattern combination from Group 2. The epoch has the least effect for the same patterns from Group 1. Figure S1 (Supplementary File) shows the trend of change in the fixation duration in the sequential epochs. It is estimated by using the emtrends function from the package emmeans [35]. The 95% credible intervals of the estimated trend of change differ, implying an unequal effect of the epochs on discriminating the paired combinations. The pairwise comparisons of the trends (after correction for multiple comparisons) show significant differences in the increase in fixation duration for stimulus AA from Group 1, which is lower than that of all other combinations. For the rest of the combinations, the rate of change is similar.
3.2. Saccade Number
The saccade number is related to the number of fixations performed during the task. Figure 5 shows the distribution of the saccade number in each epoch. It shows that the saccade number has a skewed distribution.
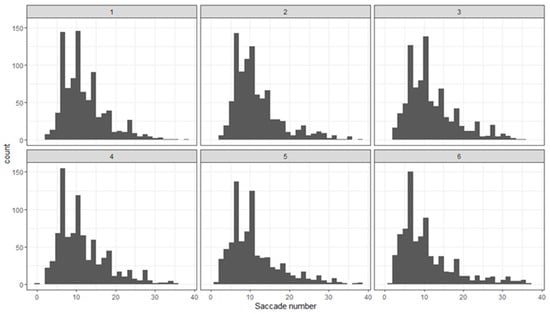
Figure 5.
Distribution of the saccade number in the sequential epochs (1–6) of the experiment.
We tested three models for the effect of the stimuli and epochs on saccade number. The first uses all 72 stimuli, and thus, it assumes that the rotation angle and the position of the patterns affect the exploration activity of the participants. The second model assumes that the rotation angle is ineffective, but the position of the patterns (whether to the left or the right of the stimulus) changes the number of saccades. It includes 24 combinations of patterns. The third model assumes that neither the patterns’ rotation nor position affects the saccade number. It includes 15 pairs of patterns.
The cross-validation for model comparison implied a better fit of the data by the model that ignores the rotation angle and the pattern positions and thus regards only 15 combinations of the patterns. In contrast to the fixation duration, the saccade number varies with the stimulus type. We compared the saccade number for the three groups of patterns and the combinations of the same and the different patterns. The evidence strongly supports the hypothesis that for each group, the same patterns require more saccades than the different ones (Figure 6; Group 1: estimate = 0.26; 95% CI [0.20–0.32]; evidence ratio = Inf; probability = 1.0; Group 2: estimate = 0.08; 95% CI [0.00–0.15]; evidence ratio = 24.13; probability = 0.96; Group 3: estimate = 0.26; 95% CI [0.19–0.34]; evidence ratio = Inf; probability = 1.0). Moreover, the same patterns from the different groups elicited an unequal number of saccades—the largest for Group 1 and about the same for Groups 2 and 3.
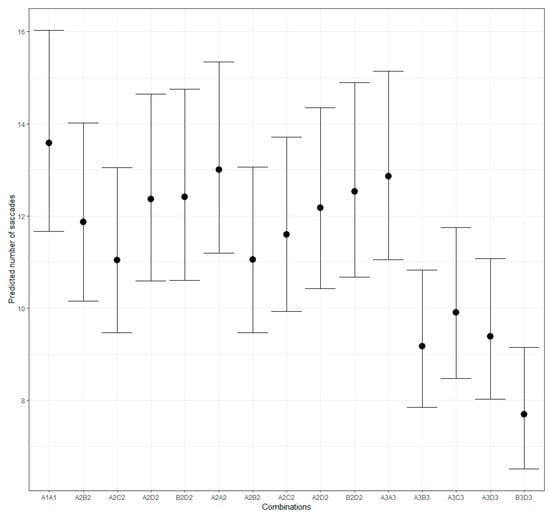
Figure 6.
Predicted number of saccades for different pattern combinations.
The analysis revealed an estimate of 0.15 and 95% credible intervals of 0.08–0.23 for the hypothesis A1A1 > A2A2 with an evidence ratio of 3332.33, and an estimate of 0.19 with 95% credible intervals for the hypothesis A1A1 > A3A3 and an evidence ratio of 9999. Based on the evidence ratio, the data provide strong evidence for more saccades elicited by the same patterns in Group 1 compared to the other groups. The evidence moderately supports the hypothesis that the saccade number for the same patterns in Group 2 exceeds those for the same patterns in Group 3 (hypothesis A2A2 > A3A3: estimate = 0.04; 95% CI [−0.05–0.13]; ER = 3.22; probability = 0.76).
Contrary to our expectations, the number of saccades increases in the different epochs (pd equals 100%; the evidence ratio for the hypothesis that the effect of epoch increases (epoch > 0) and equals Inf with an estimate 0.02; 95% CI [0.0–0.04]), providing strong support for the hypothesis of an increase in saccade number in the sequential blocks.
The saccade number in our study reflects the exploratory eye movements. Its increase in the sequential blocks might represent the gained knowledge of the spatial structure of the stimuli. For example, in [8], the authors showed that both the exploratory and the confirmatory eye movements increased in the sequential trials when the participants had an explicit knowledge about the underlying structure of the visual scenes or during long implicit learning. In our understanding, however, the increase in saccade number in our experimental conditions and task should be considered in combination with the change in the other eye movement characteristics. This result is further discussed in the Section 4.
We evaluated the trend of the epoch effect for the different combinations of patterns using the emtrends function [35]. For all combinations, the trend is positive. It is most prominent for the combination of the B and D patterns from Group 2, A and D from Group 1, and A and A for Group 3. The smallest increase in the saccade number was obtained for the AA pattern from Group 1 (Figure 7 and Figure S2 in the Supplementary File).
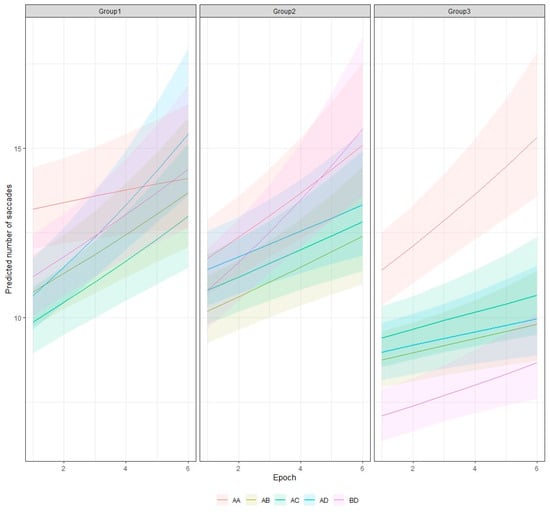
Figure 7.
Predicted number of saccades for different stimuli and epochs with 95% credible interval.
The insignificant effect of the rotation angle and pattern position implies that the dominant factor for searching for information and performing saccades is the number of chunks in the stimuli. The correlation between the estimated effect of pair combinations and the number of chunks is significant (r = −0.59, p = 0.02).
3.3. Gaze Number
Whereas the saccade number in our study has a skewed distribution, the gaze number has a symmetric distribution (Figure 8). Again, we tested three different models for the effect of pattern combinations on gaze number: taking into account the position and rotation angle of the patterns in a pair, ignoring the position, or ignoring both the position and rotation of the patterns. The results suggest a better fit to the data by a model with 15 combinations, thus ignoring the relative position and rotation of the patterns.
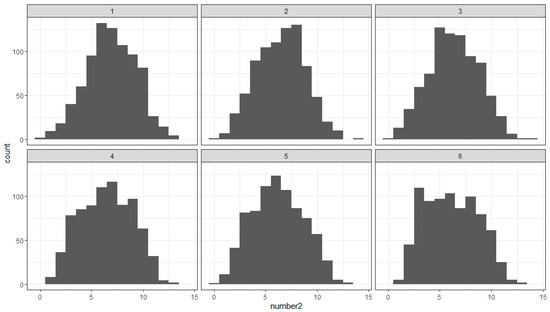
Figure 8.
Distribution of the gaze number in the sequential epochs (1–6) of the experiment.
Figure 9 shows the predicted gaze number for the different pattern combinations. It demonstrates a larger gaze number for the stimuli with the same patterns compared to those with different ones for the patterns in Groups 1 and 3. This observation was confirmed by testing the hypothesis of a larger number of gazes for the same patterns in each group against the null hypothesis of no difference. The evidence strongly supports the alternative hypothesis for Groups 1 and 3, with an estimate of 0.13 and a 95% CI [0.05–−0.21] (ER = 332.33) for Group 1, and an estimate of 0.19 and a 95% CI [0.11–−0.27] (ER = 7999) for Group 3. There is no compelling evidence to suggest a larger gaze number for the same patterns than for the different patterns of Group 2 (estimate = 0, 95% CI [−0.08–−0.08]; ER = 0.91).
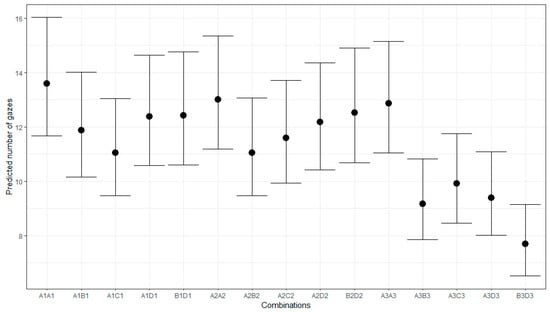
Figure 9.
Predicted number of gazes for different pattern combinations.
The results also suggest that the number of gazes tends to decrease during the sequential epochs of trials. The estimated effect for the hypothesis for the negative effect of the epoch is −0.02 with 95% CI [−0.05, 0.01] and an evidence ratio of 20.24. Hence, whereas the saccade number tends to increase, the gazes tend to decrease, suggesting more localized eye landings in the sequential blocks. The change in the gaze number might reflect a better understanding of the stimulus structure and a better discrimination of the relevant and irrelevant parts of the stimuli. The reduction in gaze number may reflect a more local focus of attention typical for the focal mode of processing.
Figure 10 shows the interaction between the stimuli and the sequential blocks. It shows that the effects of learning varied with the different stimuli and that the reduction in the gaze number is more pronounced for the patterns of Group 3. The pairwise comparisons of the trend of the gaze number change (after correction for multiple comparisons) show significant differences between the stimuli from Groups 1 and 2 with at least two of the different pairs from Group 3 (AB and AD) and insignificant differences with patterns AA and BD from this group (Figure S3, Supplementary File).
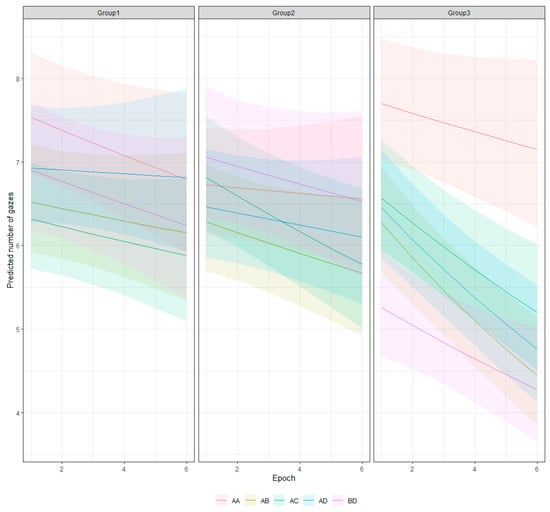
Figure 10.
Predicted number of gazes for different pattern combinations and epochs.
3.4. Saccade Amplitude
The saccade amplitude would depend on the distinctive features of the patterns that allow for better discrimination. Thus, comparing the chunks in a pattern and between the patterns in the stimulus would be needed. Figure 11 shows the distributions of the saccade amplitudes in the sequential epochs. It clearly shows their bimodality. The two modes of these distributions occur because of the eye movements inside the patterns in the stimulus and between them.
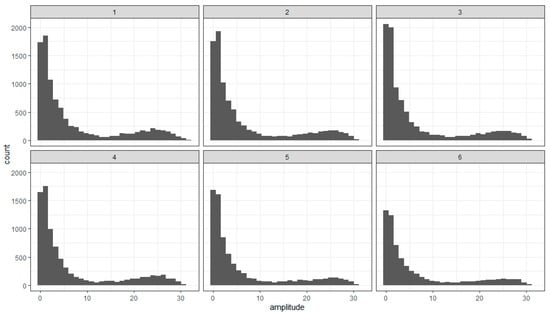
Figure 11.
Distribution of the saccade amplitude in the sequential epochs (1–6) of the experiment.
We tested whether the saccade amplitude varies with the rotation angle of the patterns. Analyzing the overall effect of the rotation angle for the whole set of stimuli is not very meaningful since the rotation angle has different effects for the different stimuli, changing the relative distances between the chunks in the two patterns in a stimulus. The effect of the rotation angle might be shown as a difference between the three stimuli in a group that contains the same patterns in the same position, differing only by the rotation angle. Each group contains eight such triples, with three comparisons in each. The results show that the 90% credible intervals of the amplitudes do not overlap for several members of each group (Figure 12A–C).
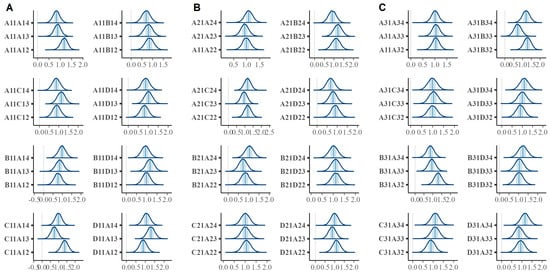
Figure 12.
Posterior distributions for the saccade amplitudes for all stimulus patterns: (A) for the stimuli from Group 1; (B) for the stimuli from Group 2; (C) for the stimuli from Group 3. The shaded regions correspond to the 90% credible intervals of the median.
The comparison of the saccade amplitude shows that it is significantly larger for the same patterns than for the different patterns. The evidence strongly supports the alternative hypothesis of there being a larger saccade amplitude for the same patterns compared to the different patterns against the null hypothesis of no difference (estimate = 0.17; [0.10–0.25], evidence ratio (EF) = for Group 1, estimate = 0.10 [0.03–0.18] for Group 2, and 0.16 [0.08–0.24] for Group 3 (the values in brackets are the 95% credible intervals)).
The highest density interval (HDI) for the epochs is entirely negative, implying a decrease in saccade amplitude during the experiment (estimate = −0.06; 95% CI [−0.11, −0.02], EF = 91.59). For each combination of patterns, however, the HDI is strictly positive. The effect of the epoch is unequal for the different stimulus combinations. The trend in block effect is either negative or insignificant (estimated by the highest posterior density intervals of the emtrends function at the first and the last experimental blocks). No clear difference between the groups is evident.
The decrease in saccade amplitude may be interpreted as resulting from unconscious memory, which reduces the extent to which saccades are made to incorrect regions.
Contrary to the results of [36], we did not find a negative correlation between the fixation duration and saccade magnitude. Our data showed a lack of correlation between the two characteristics of the eye movements (r = 0.09).
3.5. Similarity Measures
We tried to understand whether the pattern similarity might predict the effect of the combinations on the different eye movement parameters. We used several different measures to describe the similarity of the patterns in a pair. Since the images could be regarded as matrices, we can use measures that are appropriate not only for comparing the images but also for matrix comparisons. Moreover, the patterns we used have only two colors. We calculated the mean differences between the values of the left and right patterns, the mean value of the coincidence of their values, the structure similarity index [37], the correlation, and the mean squared error between the left and right patterns. Converting the patterns to logical arrays, we also calculated the Sørensen–Dice similarity coefficient between binary images, the Jaccard similarity coefficient for binary images, and the BF (Boundary F1) contour matching score. All these similarity measures have higher values when the similarity of the patterns is stronger (Figure S4, Supplementary File). The results show that these measures are sensitive to pattern rotation, though typically, two rotation angles for the right pattern lead to equal values. Additionally, the average values of the similarity measures for pairs with swapped positions are equal. Moreover, most similarity measures give some of the lowest values for the pairs of the same but rotated patterns, except the mean squared error and the mean difference between the images (Figure S4, Supplementary File). The effects of the position and the rotation angle imply that the similarity of the patterns in a pair does not determine the performance.
4. Discussion
The study’s results suggest that the attentional selection of relevant image characteristics varies with the experience obtained in experimental task performance. This change suggests an adaptive strategy of the observers that balances exploration and exploitation modes shown in the increased saccade number and the change in the saccade amplitude. They confirmed the usefulness of studying the eye movement characteristics to obtain information on the processes of attention, decision making, and memory.
Statistical learning is typically considered a process involving implicit memory. Studying the role of unconscious memory in a search task in real-world scenes, [5] showed no effect of unconscious memory on the number of saccades. Higuchi and Saiki [7] showed that eye movements were not necessary for implicit learning of spatial configurations, and keeping a stable fixation at the display center is beneficial for rapid learning of the spatial layout. Our results, however, show an increased number of eye movements in the sequential block of trials, but the gaze landings become more localized in the process of practice and learning. One distinctive feature of our study, compared to visual search studies, is that the relevant target or targets for successful task performance are not defined in advance. The participants have to determine which stimulus features to use for task performance. The large display size may facilitate an exploitative behavior with larger saccades in the initial stimulus blocks and more focused ones later on. The increase in fixation duration in the sequential blocks might be considered a switch from exploration to exploitation mode; however, the saccade number should decrease in this case.
Our findings indicate that learning spatial regularities in the stimulus set leads to a transition from ambient to focal processing, a phenomenon commonly observed in single trials [9,10]. Ambient processing is characterized by longer saccades and shorter fixations and is considered to be involved in processing spatial arrangements and extracting contextual information. In contrast, focal processing, which involves smaller saccades and longer fixations, reflects the processing of details and object identification. The increase in fixation duration and the decrease in saccade amplitude in the sequential blocks in our study may be considered as representing a more local focus of attention and a discrimination of the relevant from irrelevant stimulus features for task performance and their deeper exploration.
The study results show a marginal effect of the stimuli on the fixation duration. The more pronounced change in this gaze parameter suggests a transition from ambient to focal processing. The saccade amplitude change also suggests such a transition, as its magnitude decreases in the sequential epochs. Its independence from the rotation angle and the pattern position in a pair implies that the observers compare the relative positions of the chunks in the patterns. The unequal effects of the epoch on the different stimuli imply different learning rates. Based on the fixation duration and saccade amplitude outcomes, the data suggest more rapid learning for the different patterns.
In the present study, we varied the co-occurrence of chunks in the patterns that formed a stimulus pair. Contrary to typical studies manipulating the co-occurrence of objects, in our task, the presence of the same chunks in different patterns makes stimulus discriminability more difficult due to the increased pattern similarity. The large number of unique stimulus pairs would not allow the use of memory for the combinations to discriminate the patterns as the same or different. However, the stimulus set contains statistical regularities that could facilitate the performance in the sequential epochs.
The pattern A from each group appeared on the left side of the stimulus pairs in their original orientation. Moreover, out of the 90 trials in an epoch, each of these patterns appeared on the left 36 times, meaning that the three pattern As from the three groups were shown on the left on 60% of the trials in an epoch. If the participants memorize these patterns, they could use this knowledge to answer “different” whenever the pattern on the left side of the stimulus does not coincide with any of them. This strategy would affect both the saccade amplitude and the number of saccades and gazes—the saccades could explore predominantly the left pattern. This strategy would imply a decrease in saccade amplitude.
When pattern A is on the left side, the effective strategy for Groups 1 and 2 would be to seek the two 5-element chunks characteristic of pattern A in the right pattern. In this case, the number of fixations on pattern A might decrease due to greater exploration of the right pattern, leading to large saccade amplitude for pattern A on the left. This strategy would be less effective for the patterns from Group 3, as identifying pattern A on the left side of the pair would not benefit task performance. We tested the hypothesis that the saccade amplitude depends on the presence of pattern A on the left side of the pairs separately for each group. The results show that the saccade amplitudes for pattern A being on the left are less than the saccade amplitudes for the cases when any of the other patterns were on the left for the stimuli of Group 1 (estimate = −1.17, 95% CI [−2.34–−0.01], ER = 19.47, p = 0.95). No significant differences were observed depending on the position of pattern A in the pair for the stimuli of Groups 2 and 3 (estimate = 0.03; 95% CI [−1.13–−1.19], ER = 0.93; p = 0.48 for Group 2; estimate = −0.07, 95% CI [−1.31–1.17], ER = 1.16; p = 0.54 for Group 3).
These considerations imply changes in saccade amplitude and an effect of pattern position on it—an outcome observed in our results. They correspond to other studies showing that people learn not only the statistical regularities related to task-relevant targets, but also the regularities of the task-irrelevant chunks in the visual images [38].
One specific feature of our results is that only saccade amplitude depends on the rotation angle of the patterns. Interestingly, the saccade amplitude discriminates best between focal and ambient processing [39]. Most image similarity measures are insensitive to the relative positions of the patterns in the pair—being on the left or right—but are sensitive to rotation. Our data suggest that while the position of the patterns in a pair does not change the fixation duration and saccade number, it effectively changes the saccade amplitude. These results imply that similarity measures like cross-correlation or the Sørensen–Dice similarity coefficient could not adequately represent the effect of pattern characteristics on the saccade amplitude. Measures of similarity like Kullback–Liebler divergence might be better suited; however, they require probability distributions. The conversion of the images used in the study into probability distributions of grayscale values could not distinguish the patterns we used, as they contain an equal number of the same color elements. The effective similarity measure should consider both the brightness (color) of the patterns and their position. Strangely, measures of similarity related to image segmentation, like bfscore (Boundary F1), seem better suited to describing the effect of the image manipulations we used on the saccade amplitude size.
The observed change in the saccade number is unexpected as it reflects the efficiency of searching for information, whereas the number of gazes reflects the complexity of the interferential process. The greater number of fixations usually indicates insufficient information on the relevant stimulus or task. Thus, it is more reasonable to expect that the saccade number will decrease in the sequential epochs. Indeed, [9] demonstrated that the participants exhibited fewer saccades with practice with visual search tasks, indicating a shift towards more efficient information processing. Similarly, expert readers tend to make fewer, more targeted saccades, reflecting a refined strategy for extracting relevant information [10]. Wedel and co-authors [16] showed that short saccades with repeated fixations to small regions can be regarded as a way to reduce memory load and they could facilitate target identification. Thus, a potential effect of the increase in the saccade number and a decrease in gaze number in the sequential blocks is an efficient way of reducing the memory requirements of the task when the relevant stimulus characteristics are already determined. Eye movements reflect item memory [40], which may lead to decreased fixation duration and saccade number due to the repetition of patterns on the left stimulus side. The discrimination from the patterns on the right requires relational memory (e.g., [41]). The review on the interaction of eye movements and memory systems shows that relational memory requires at least 500–750 ms (about 2 s in total in a task with three faces, i.e., in a task that required studying face–scene pairs followed by a memory test with 3-face displays superimposed on the studied scenes). In our study, however, there are more objects (chunks) between which the relative positions need to be evaluated; thus, the time needed for relational memory should be longer. One way to reduce the memory load might be by increasing the number of saccades.
Another explanation for the increase in the saccade number might be a change in the number of strategies used by the participants. As suggested by [11], depending on the strategies of the observers and the various contexts, ambient and focal processing can change dynamically and this interplay would affect the eye movement characteristics. The shorter fixation duration in the first epochs of the study may also represent the use of partial information exploration due to making decisions under time pressure. With practice, the observers may switch to more complete information exploration due to a speeded-up allocation of attention to the different stimulus chunks. This change in strategy may allow them to explore more stimulus regions to reduce uncertainty and enhance decision-making accuracy.
5. Conclusions
The results of the study suggest various changes in eye movement characteristics that depend on the repetition frequency, practice, and stimulus characteristics of the patterns. These changes reflect attentional selection, memory involvement, and learning processes. Studying the modifications of the eye movement characteristics jointly provides a better understanding of the complex interaction between these cognitive processes. Learning the spatial regularities in a visual scene allows for the prediction of the future allocation of gaze and may be relevant in computer vision applications and the design of learning environments.
Supplementary Materials
The following supporting information can be downloaded at: https://www.mdpi.com/article/10.3390/app142110055/s1, Figure S1: Trend of change in fixation duration in the sequential epochs for different pattern combinations; Figure S2: Trend of change in saccadic number in the sequential epochs for different pattern combinations; Figure S3: Trend of change in gaze number in the sequential epochs for different pattern combinations; Figure S4: Similarity of the patterns in the pair combinations evaluated by different measures.
Author Contributions
Conceptualization, B.G., N.B. and I.H.; methodology B.G., N.B. and I.H.; software, N.B.; validation, B.G. and I.H.; formal analysis, N.B.; investigation, B.G. and I.H.; data curation, I.H.; writing—original draft preparation, B.G. and N.B.; writing—review and editing, B.G., N.B. and I.H.; visualization, B.G. and I.H.; supervision, B.G. and N.B.; funding acquisition, B.G., N.B. and I.H. Due to the unexpected death of I.H., only B.G. and N.B. approve the final version of the manuscript. All authors have read and agreed to the published version of the manuscript.
Funding
This research was funded by the Bulgarian National Science Fund, grant number KP-06-N52/6 from 12 November 2021. The APC was partially funded by the Bulgarian National Science Fund.
Institutional Review Board Statement
The study was approved with Protocol 48 by the Ethics Committee of the Institute of Neurobiology, Bulgarian Academy of Sciences on 6 June 2023 and was conducted in accordance with the Declaration of Helsinki.
Informed Consent Statement
Informed consent was obtained from all subjects involved in the study.
Data Availability Statement
The data presented in this study are available on request from the corresponding author due to ethical reasons.
Conflicts of Interest
The authors declare no conflicts of interest.
References
- Fiser, J.; Lengyel, G. Statistical Learning in Vision. Annu. Rev. Vis. Sci. 2022, 8, 265–290. [Google Scholar] [CrossRef] [PubMed]
- Nissen, M.J.; Bullemer, P. Attentional requirements of learning: Evidence from performance measures. Cogn. Psychol. 1987, 19, 1–32. [Google Scholar] [CrossRef]
- Zolnai, T.; Dávid, D.R.; Pesthy, O.; Nemeth, M.; Kiss, M.; Nagy, M.; Nemeth, D. Measuring statistical learning by eye-tracking. Exp. Results 2022, 3, e10. [Google Scholar] [CrossRef]
- Turk-Browne, N.B.; Jungé, J.; Scholl, B.J. The automaticity of visual statistical learning. J. Exp. Psychol. Gen. 2005, 134, 552–564. [Google Scholar] [CrossRef]
- Ramey, M.M.; Yonelinas, A.P.; Henderson, J.M. Conscious and unconscious memory differentially impact attention: Eye movements, visual search, and recognition processes. Cognition 2019, 185, 71–82. [Google Scholar] [CrossRef] [PubMed]
- Makovski, T.; Jiang, Y.V. Investigating the role of response in spatial context learning. Q. J. Exp. Psychol. 2011, 64, 1563–1579. [Google Scholar] [CrossRef] [PubMed]
- Higuchi, Y.; Saiki, J. Implicit learning of spatial configuration occurs without eye movement. Jpn. Psychol. Res. 2017, 59, 122–132. [Google Scholar] [CrossRef]
- Arató, J.; Rothkopf, C.A.; Fiser, J. Eye movements reflect active statistical learning. J. Vis. 2024, 24, 17. [Google Scholar] [CrossRef] [PubMed]
- Ryan, J.D.; Cohen, N.J. The nature of change detection and online representations of scenes. J. Exp. Psychol. Hum. 2004, 30, 988–1015. [Google Scholar] [CrossRef]
- Velichkovsky, B.B.; Khromov, N.; Korotin, A.; Burnaev, E.; Somov, A. Visual Fixations Duration as an Indicator of Skill Level in eSports. In Human-Computer Interaction–INTERACT 2019; Lamas, D., Loizides, F., Nacke, L., Petrie, H., Winckler, M., Zaphiris, P., Eds.; Lecture Notes in Computer Science; Springer: Cham, Switzerland, 2019; Volume 11746, pp. 397–405. [Google Scholar]
- Unema, P.J.A.; Pannasch, S.; Joos, M.; Velichkovsky, B.M. Time course of information processing during scene perception: The relationship between saccade amplitude and fixation duration. Vis. Cogn. 2005, 12, 473–494. [Google Scholar] [CrossRef]
- Gegenfurtner, A.; Lehtinen, E.; Säljö, R. Expertise differences in the comprehension of visualizations: A meta-analysis of eye-tracking research in professional domains. Educ. Psychol. Rev. 2011, 23, 523–552. [Google Scholar] [CrossRef]
- Bertram, R.; Helle, L.; Kaakinen, J.K.; Svedström, E. The effect of expertise on eye movement behaviour in medical image perception. PLoS ONE 2013, 8, e66169. [Google Scholar] [CrossRef] [PubMed]
- van der Lans, R.; Pieters, R.; Wedel, M. Online advertising suppresses visual competition during planned purchases. J. Consum. Res. 2021, 48, 374–393. [Google Scholar] [CrossRef]
- Zelinsky, G.J.; Sheinberg, D.L. Eye movements during parallel-serial visual search. J. Exp. Psychol. Hum. 1997, 23, 244–262. [Google Scholar] [CrossRef]
- Wedel, M.; Pieters, R.; van der Lans, R. Modeling Eye Movements During Decision Making: A Review. Psychometrika 2023, 88, 697–729. [Google Scholar] [CrossRef]
- Kaspar, K.; König, P. Overt attention and context factors: The impact of repeated presentations, image type, and individual motivation. PLoS ONE 2011, 6, e21719. [Google Scholar] [CrossRef] [PubMed]
- Kaspar, K.; König, P. Viewing behavior and the impact of low-level image properties across repeated presentations of complex scenes. J. Vis. 2011, 11, 26. [Google Scholar] [CrossRef]
- Fiser, J.; Aslin, R.N. Unsupervised statistical learning of higher-order spatial structures from visual scenes. Psychol. Sci. 2001, 12, 499–504. [Google Scholar] [CrossRef]
- Abla, D.; Okanoya, K. Visual statistical learning of shape sequences: An ERP study. Neurosci. Res. 2009, 64, 185–190. [Google Scholar] [CrossRef]
- Siegelman, N.; Bogaerts, L.; Frost, R. Measuring individual differences in statistical learning: Current pitfalls and possible solutions. Behav. Res. Methods 2017, 49, 418–432. [Google Scholar] [CrossRef]
- Growns, B.; Siegelman, N.; Martire, K.A. The multi-faceted nature of visual statistical learning: Individual differences in learning conditional and distributional regularities across time and space. Psychon. Bull. Rev. 2020, 27, 1291–1299. [Google Scholar] [CrossRef] [PubMed]
- Rogers, L.; Park, S.; Vickery, T. Visual statistical learning is modulated by arbitrary and natural categories. Psychon. Bull. Rev. 2021, 28, 1281–1288. [Google Scholar] [CrossRef]
- Mannan, S.K.; Ruddock, K.H.; Wooding, D.S. Fixation sequences made during visual examination of briefly presented 2D images. Spat. Vis. 1997, 11, 157–178. [Google Scholar] [CrossRef] [PubMed]
- Tal, A.; Bloch, A.; Cohen-Dallal, H.; Aviv, O.; Schwizer Ashkenazi, S.; Bar, M.; Vakil, E. Oculomotor anticipation reveals a multitude of learning processes underlying the serial reaction time task. Sci. Rep. 2021, 11, 6190. [Google Scholar] [CrossRef] [PubMed]
- Wynn, J.S.; Ryan, J.D.; Buchsbaum, B.R. Eye movements support behavioral pattern completion. Proc. Natl. Acad. Sci. USA 2020, 117, 6246–6254. [Google Scholar] [CrossRef] [PubMed] [PubMed Central]
- Wilming, N.; Onat, S.; Ossandón, J.P.; Açık, A.; Kietzmann, T.C.; Kaspar, K.; Gameiro, R.R.; Vormberg, A.; König, P. An extensive dataset of eye movements during viewing of complex images. Sci. Data 2017, 4, 160126. [Google Scholar] [CrossRef]
- Besl, P.J.; McKay, N.D. A Method for Registration of 3-D Shapes. IEEE Trans. Pattern Anal. Mach. Intell. 1992, 14, 239–256. [Google Scholar] [CrossRef]
- Ester, M.; Kriegel, H.P.; Sander, J.; Xu, X. A density-based algorithm for discovering clusters in large spatial databases with noise. In Proceedings of the Second International Conference on Knowledge Discovery and Data Mining, Portland, OR, USA, 2–4 August 1996; pp. 226–231. [Google Scholar]
- RStudio Team. RStudio: Integrated Development for R; RStudio, PBC: Boston, MA, USA, 2020; Available online: http://www.rstudio.com (accessed on 19 February 2024).
- Bürkner, P.C. Brms: An R Package for Bayesian Multilevel Models using Stan. J. Stat. Softw. 2017, 80, 1–28. [Google Scholar] [CrossRef]
- Gelman, A.; Hill, J. Data Analysis Using Regression and Multilevel/Hierarchical Models, 1st ed.; Cambridge University Press: New York, NY, USA, 2007. [Google Scholar]
- Gelman, A.; Rubin, D.B. Inference from iterative simulation using multiple sequences. Stat. Sci. 1992, 7, 457–472. [Google Scholar] [CrossRef]
- Rayner, K. Eye movements in reading and information processing: 20 years of research. Psychol. Bull. 1998, 124, 372–422. [Google Scholar] [CrossRef]
- Lenth, R. Emmeans: Estimated Marginal Means, Aka Least-Squares Means. R Package Version 1.10.4.900001. 2024. Available online: https://rvlenth.github.io/emmeans/ (accessed on 17 May 2024).
- Torralba, A.; Oliva, A.; Castelhano, M.S.; Henderson, J.M. Contextual guidance of eye movements and attention in real-world scenes: The role of global features in object search. Psychol. Rev. 2006, 113, 766–786. [Google Scholar] [CrossRef] [PubMed]
- Wang, Z.; Bovik, A.C.; Sheikh, H.R.; Simoncelli, E.P. Image quality assessment: From error visibility to structural similarity. IEEE Trans. Image Process. 2004, 13, 600–612. [Google Scholar] [CrossRef] [PubMed]
- Theeuwes, J.; Bogaerts, L.; van Moorselaar, D. What to expect where and when: How statistical learning drives visual selection. Trends Cogn. Sci. 2020, 26, 860–872. [Google Scholar] [CrossRef] [PubMed]
- Follet, B.; Le Meur, O.; Baccino, T. New insights into ambient and focal visual fixations using an automatic classification algorithm. i-Perception 2011, 2, 592–610. [Google Scholar] [CrossRef] [PubMed] [PubMed Central]
- Smith, C.N.; Hopkins, R.O.; Squire, L.R. Experience-dependent eye movements, awareness, and hippocampus-dependent memory. J. Neurosci. 2006, 26, 11304–11312. [Google Scholar] [CrossRef]
- Hannula, D.E.; Ranganath, C.; Ramsay, I.S.; Solomon, M.; Yoon, J.; Niendam, T.A.; Carter, C.S.; Ragland, J.D. Use of eye movement monitoring to examine item and relational memory in schizophrenia. Biol. Psychiatry 2010, 68, 610–616. [Google Scholar] [CrossRef][Green Version]
Disclaimer/Publisher’s Note: The statements, opinions and data contained in all publications are solely those of the individual author(s) and contributor(s) and not of MDPI and/or the editor(s). MDPI and/or the editor(s) disclaim responsibility for any injury to people or property resulting from any ideas, methods, instructions or products referred to in the content. |
© 2024 by the authors. Licensee MDPI, Basel, Switzerland. This article is an open access article distributed under the terms and conditions of the Creative Commons Attribution (CC BY) license (https://creativecommons.org/licenses/by/4.0/).