Featured Application
Sharp pipe elbows are commonly used in industrial applications where space is constrained. The flow downstream of a sharp elbow is highly asymmetric, and it is crucial in some cases to determine how far this asymmetry extends. For example, accurate flow meters are usually calibrated based on a fully developed symmetric flow profile. We showed that in turbulent pipe flows, the recovery length is systematically shorter at higher Reynolds numbers () regardless of the criteria used. Specifically, a recovery length of 10–40 pipe diameters (D) is observed at and 10–30 D at . However, for a laminar flow, even a length of 100 D might not be sufficient for the flow to fully recover to a symmetric profile.
Abstract
Pipe bends disrupt the flow, resulting in an asymmetric velocity field across the pipe diameter (D). We examined the recovery length required for the flow to return to a symmetric velocity profile downstream of a sharp elbow. The wall-resolved Large Eddy Simulation (LES) approach was applied to reproduce turbulent fluid flow at Reynolds numbers () of 5600 and 10,000. An additional case in the transitional laminar-turbulent-laminar regime was analyzed at . This analysis explored the behavior of the Dean vortices downstream of the elbow and revealed that, in turbulent cases, these vortices reverse their vorticity direction in the region between 8 D and 10 D. However, they eventually decay in structure as far as 25 D from the elbow. Flow asymmetry was analyzed in a 100 D long pipe section downstream of the elbow using four different criteria: wall shear stress (WSS), streamwise velocity, its fluctuations, and vorticity fields. This study found that in turbulent flows, the distance required for flow recovery is a few tens of D and decreases with increasing . However, in the transitional case, the flow separation within the elbow induces instabilities that gradually diminish downstream, and flow asymmetry persists even longer than the 100 D length of our outlet pipe section. WSS proved sensitive for detecting asymmetry near walls, whereas flow profiles better revealed bulk asymmetry. It was also shown that asymmetry indicators derived from velocity fluctuations and vorticity were less sensitive than those obtained from streamwise velocity.
1. Introduction
In nearly every industrial process involving fluid flow in pipes, the use of pipe bends is unavoidable. Bending redirects flow, causing pressure drops due to changes in flow direction and the creation of secondary flows, which were first conceptualized by [1,2] and later visualised by [3], i.e., the so-called Dean vortices shown in Figure 1a. In laminar flow, this can be easily observed in instantaneous velocity fields, whereas in turbulent flows, one has to analyse the time-averaged velocity fields. In straight pipes, axisymmetric velocity profiles are expected in time-averaged fields when fully developed flow is achieved. However, in curved pipes or downstream of a pipe bend, the flow exhibits asymmetry due to the flow deflection, secondary flows, coherent structures or even a separation bubble [4]. Downstream of a bend, the asymmetry is gradually damped until the flow achieves a fully developed flow condition and forgets the presence of the bend.
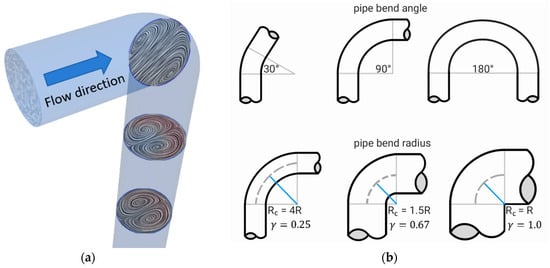
Figure 1.
(a) Dean vortices downstream of the pipe bend; (b) Pipe bends with different bend angles and bend radii.
In many industrial systems, it is important to know how far the flow asymmetry behind the pipe bend propagates. For example, flow meters are usually calibrated to measure flow that is fully developed and undisturbed, as found in long straight pipes. Therefore, in a complex system, it is important to understand the appropriate distance downstream of a bend where such a device should be installed to ensure accurate measurements. In straight pipes, an entrance length is defined as the segment of a pipe, starting from the inlet, where the flow is in the process of developing, and extending up to the point where a fully developed flow is established. The entrance lengths in straight pipes vary widely, typically between 25 D to 60 D for mean velocity profiles and from 70 D to 90 D when higher-order statistics are being specified as criterions [5]. However, the entrance length increases further when large-scale turbulent structures are present [6] or in a laminar-turbulent transition regime [7,8]. An additional complexity is introduced with the pipe bend, which is described with the curvature ratio , with and denoting pipe and bend radius, respectively. A straight pipe corresponds to , whereas, in the other extreme case, corresponds to a sharp internal edge of the pipe bend as shown in Figure 1b. The latter is usually referred to as the pipe elbow and can be found in numerous applications where one has limited space for pipe installation. This study investigates the velocity asymmetry propagation downstream of a 90° elbow with (), a sharp elbow that is, to the best of the authors’ knowledge, still missing in the existing literature.
Most experimental and numerical studies of flow behaviour focus on low and relatively short pipe sections. For example, flow downstream of a 90° pipe bend with was measured at , showing a recovery length of 10 D needed for a symmetrical velocity profile [9]. Similar measurements for a 180° bend revealed longer recovery lengths [10]. Time-resolved stereoscopic Particle Image Velocimetry (PIV) with Proper Orthogonal Decomposition (POD) downstream of a 90° bend with revealed that the dominant structures were not the well-known Dean vortices, but bimodal single-cell structures with alternating directions of rotation, i.e., the swirl-switching mode [11], which was first visualized by Tunstall and Harvey [12]. The analysis indicated that Dean vortices act as a transitional phase in swirl-switching, where one Dean vortex is suppressed, leading to a single swirl. Turbulent swirling flow at the exit of a 90° pipe bend with was investigated for various in the range 14,000–34,000 [13,14,15]. A wide range of imposed swirl flows was employed by axially rotating the pipe section upstream of the bend, and it was found that the secondary motion in a curved pipe gradually diminishes as the swirl flow increases. Unfortunately, the velocity field was measured only at one cross-section at the bend outlet, thus, the asymmetry propagation downstream of the flow was not measured.
High-fidelity simulations, such as Direct Numerical Simulations (DNS) and Large Eddy Simulation (LES), provide deeper insights into flow behaviour. Global stability of laminar flow in curved toroidal pipes has shown that a very small curvature is sufficient to make the flow linearly unstable via a Hopf bifurcation that leads the flow to a periodic regime [16]. Typically, as the curvature increases, the onset of turbulence occurs at lower . Specifically, at a fixed curvature (i.e., ), the Hopf bifurcation occurs at for evenly curved toroidal pipes [16], but at considerably lower [17] and [18] in the flow downstream of 90° and 180° pipe bends, respectively. The primary source of the flow instability in pipe bends is attributed to a strong shear resulting from the backflow in the separation bubble [17]. Interestingly, turbulent flows at higher in curved pipes reveal that overall turbulence decreases with increasing curvature [19,20]. Coherent structures in toroidal pipes [20] resemble the swirl-switching previously observed downstream of pipe bends [11], which originates from a wave-like structure in the bend [21]. Turbulent flow in a 90° pipe bend was studied with LES and the Reynolds-Averaged Navier–Stokes (RANS) approach [22]. LES revealed a correlation between secondary flow motion and wall shear stresses [23], relevant for erosion wear [24,25,26], solid particle accumulation in curved pipes [27] and agglomerate breakage in particle-laden flow [28]. Detached Eddy Simulation (DES) was used to simulate turbulent flow downstream of a 90° bend with [29], as well as in the Wellborn S-duct [30]. Pipe flow in bends with from 0.17 to 0.5 was investigated at from 5000 to 27,000 [31], and low frequency oscillations of the Dean vortices were detected at largest . Similarly, a numerical study of flow in a short, 90-degree elbow with a sharp internal edge also reported that the bend induced low-frequency velocity fluctuations at [32]. A recent study [33] used LES to examine the decay of secondary motion downstream of 180° pipe bends with from 0.15 to 0.5. Results showed that increased curvature enhanced turbulence intensity immediately downstream, reducing the recovery length for restoring the velocity profile. The role of Dean vortices in thermal fatigue was studied in a T-junction with an upstream pipe bend [34], which represents a safety concern in nuclear plant thermal-hydraulic systems, as it may cause unforeseen piping failures as the plant ages. Similarly, thermally stratified flow in a horizontally oriented 90° pipe bend was investigated [35], and the risk of material damage due to thermal fatigue was evaluated for pipe bends with from 0.16 to 0.63, finding that thermal fatigue damage increases as the pipe bend radius decreases. This is attributed to enhanced turbulent mixing in pipes with high curvature, underscoring the need for a comprehensive understanding of flow behaviour, especially in sharp pipe elbows. Although understanding the unsteady nature of flow instabilities downstream of a sharp pipe elbow is important, our present analysis focuses on information that can be derived from time-averaged flow fields. Therefore, special care has been taken to ensure sufficiently long time-averaging to eliminate any transient characteristics of the flow.
In the present study, we investigated the propagation length of flow asymmetry, which was generated by a sharp pipe elbow with a curvature ratio of . In Section 2, the numerical setup is described for the LES approach to three different cases with of 1400, 5600 and 10,000, which correspond to the laminar-turbulent transition regime as well as the fully turbulent regime. These particular flow conditions are relevant for the numerical and experimental studies of slug flow in various pipes [36,37]. The main results of our study are presented in Section 3, where we introduce four different criteria for analyses of the flow asymmetry downstream of the flow, and conclusions are summarized in Section 4.
2. Numerical Setup
Simulations were performed with open-source CFD toolbox OpenFOAM version 10 [38]. The simulations were carried out on the EuroHPC supercomputer Vega [39] at IZUM in Maribor, Slovenia. Most simulations consumed in the order of 1.4–1.8 million CPU hours for each (turbulent) simulated case, which resulted in 2–3 months of wall-clock time using 1024 cores [40].
2.1. Geometry and Computational Domain
The considered geometry consisted of a circular pipe with an inner diameter of D = 25 mm and a sharp 90° elbow with the bend radius of Rc = 1.08R, as shown in Figure 2, where R = D/2 is the pipe radius. The length of the straight pipe sections upstream and downstream of the elbow were 10 D (250 mm) and 100 D (2500 mm), respectively.
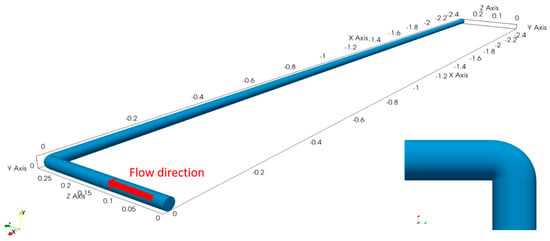
Figure 2.
The entire computational domain with the 10 D long inlet section and a 100 D long straight pipe downstream of the sharp elbow. The origin of the coordinate system is set at the centre of the inlet, and the sharp pipe bending detail is shown in the bottom right side.
2.2. Governing Equations and Numerical Schemes
LES was performed assuming incompressible flow, thus, a set of conservation equations for mass and momentum were solved, i.e.,
where liquid water properties at 30 °C were assumed in our simulations. Namely, a dynamic viscosity and density resulted in a kinematic viscosity of . Turbulent (eddy) viscosity was calculated with the WALE model [41], which resolved the boundary layer and provided proper near-wall scaling of the modelled eddy viscosity.
We applied pimpleFOAM solver, which applies the PISO algorithm for pressure-velocity coupling. Second-order temporal and spatial-numerical schemes were used. Specifically, for time discretization, we applied an implicit backward differencing scheme based on current and two successive old-time step fields. An adjusted time step was used with a maximum Courant number of 0.4. The momentum matrix equation was solved using a smoothSolver, whereas the pressure equation applied the generalized geometric-algebraic multi-grid solver (GAMG). Both linear solvers used Gauss–Seidel smoothing.
2.3. Computational Mesh
Our meshing strategy followed best practice experiences from LES in OpenFOAM [42,43]. We applied fully hexahedral meshes, which were generated with blockMesh utility in OpenFOAM. The coarsest mesh was used for fast calculation only, allowing us to accelerate the attainment of the developed turbulent flow. The obtained turbulent fields were then mapped to the middle and fine mesh as the initial conditions for the main simulations. Special care was taken for the middle and fine mesh to prepare good-quality computational cells with a maximum mesh non-orthogonality of 46° (average is around 4°) and a maximum skewness of 0.88, which all respect the best practice guidelines [42,43]. The meshing details are given in Table 1, and a cross-sectional view of the pipe is shown in Figure 3. It should be noted that the non-dimensional cell sizes presented in Table 1 are calculated based on flow conditions at a Reynolds number of 5600. For our final simulations, the middle mesh was used for Reynolds numbers of 1400 and 5600, while the fine mesh was employed for the simulation at a Reynolds number of 10,000.

Table 1.
Meshing parameters for the three applied meshes. Cell sizes in wall units are calculated for the flow conditions at .
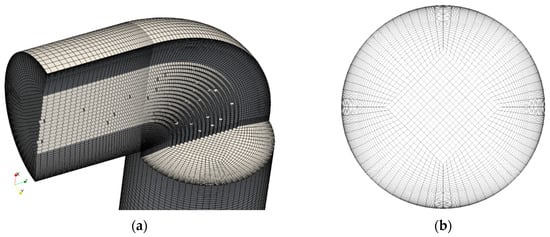
Figure 3.
Two details of the computational meshes: (a) Insight into the elbow section for the middle mesh. (b) Pipe cross-section for the fine mesh.
The first cell height at the pipe walls was kept well below 1 for most of the cells in order to resolve the viscous sublayer of the momentum boundary layer. In the bulk region, we applied cubed cells with an aspect ratio close to 1, which are best suited for isotropic vortices in the turbulent flow. Grading with a constant stretching factor was applied to the adjacent cells in the intermediate region between the bulk region and the walls. The stretching factor was carefully chosen in order to guarantee the accuracy of the computations [42].
2.4. Boundary Conditions and Statistics Accumulation
The standard no-slip boundary condition was used at the walls of the pipe. In order to achieve a fully developed velocity profile at the inlet of the pipe, we applied mapped boundary conditions which recycled the instantaneous velocity field at 5 D downstream of the inlet back to the inlet. This type of the inlet boundary condition is well-known since it has been applied in numerous studies of turbulent pipe flows at similar [44]. The mapped boundary condition was 5 D upstream of the pipe bend in order to avoid the bend-affected zone [4]. The prescribed mean velocities for each of the simulated three cases are given in the Table 2. The pressure gradient was set to zero at the inlet. Contrarily, at the outlet, the Dirichlet boundary condition was prescribed for pressure and the Neumann boundary condition for velocity. Namely, the pressure and the velocity gradient were set at zero at all times, however, if backflow was detected at the outlet boundary, the velocity was locally set to zero.

Table 2.
Duration of time-averaging for all three computations.
Before we started time-averaging the calculations, simulations were run for at least 20 s of simulated time to obtain a fully developed turbulent flow in the entire pipe. For this purpose, we monitored velocity at several monitoring points along the flow. The time-averaging interval was at least 950 convective time units ( and is together with the number of time steps summarized in Table 2 for all three considered cases.
2.5. Validation
Our simulations were validated against the DNS results of turbulent flow in straight pipes at [45] and [46]. Figure 4 shows a comparison between the mean streamwise velocity profiles of our LES results in the recycling inlet section and the DNS results for two . LES results of turbulent flow at were obtained using the middle mesh, whereas the results at were obtained using the fine mesh. Comparison showed a very good agreement with the DNS results for the lower and small discrepancies between the LES and DNS at the higher in the buffer layer. Similarly, Figure 5 shows mean streamwise velocity fluctuations for the two at the same location in the inlet recycling section. Similarly, a very good agreement between LES and DNS was observed at , and slightly larger discrepancies were observed at , particularly in the buffer layer. Nevertheless, these discrepancies are reasonable for the applied LES method and are attributed to several factors, which are part of our numerical approach. Namely, the observed overprediction in the peak of the streamwise velocity fluctuation is related to the inability of the model to redistribute enough energy from the streamwise velocity fluctuation component to the spanwise and wall-normal components. This has been studied by Komen et al. [47], who showed that such behaviour is expected when one applies so-called “industrial LES”: i.e., (a) a finite volume method using a collocated mesh with second-order accurate spatial and temporal discretisation schemes, (b) an implicit top-hat filter, where the filter length is equal to the local computational cell size, and (c) eddy-viscosity-type LES models. This was the case for all our simulations. However, the small discrepancies were noticeable only in higher-order statistics, thus, the achieved accuracy of the applied numerical model was more than sufficient for our investigation of the asymmetry propagation downstream of the pipe bend.
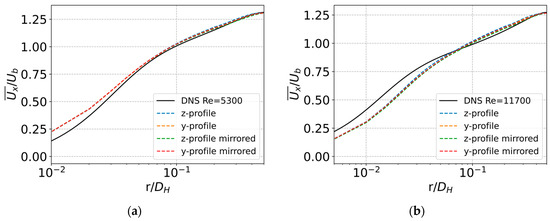
Figure 4.
Time-averaged streamwise velocity profiles for fully developed flow: (a) ; (b) .
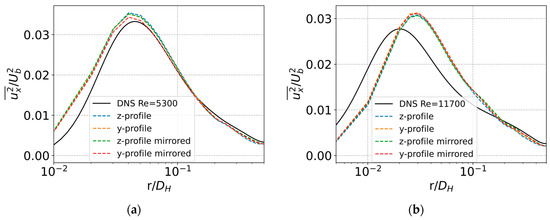
Figure 5.
Time-averaged streamwise velocity fluctuations for fully developed flow: (a) ; (b) .
3. Results
The main characteristics of the instantaneous velocity field in a pipe upstream and downstream of the sharp bend is shown in Figure 6. Clearly, the velocity boundary condition at the inlet provided a fully developed flow, which was axisymmetric in time-averaged fields, regardless of the . This resulted in a laminar flow upstream of the elbow for the lowest , , and a turbulent flow for the other two flow conditions, and . For each simulated case, there was a strong flow separation observed in the elbow of the pipe. The boundary layer detached at the sharp internal edge of the elbow, bent and reattached further downstream of the flow. The flow from the inlet pipe section impinged into the outer wall of the pipe in the elbow as well as downstream of it. Further downstream of the elbow, flow again achieved fully developed velocity conditions; however, the exact recovery length was not evident from the instantaneous velocity fields.
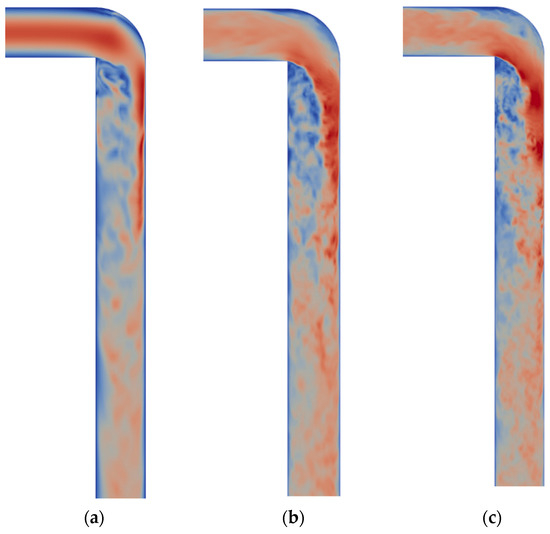
Figure 6.
Instantaneous velocity magnitude field for the three simulated cases: (a) ; (b) ; (c) . Blue and red color correspond to small and large velocity magnitude, respectively.
The influence of the pipe elbow was more clearly depicted in the time-averaged velocity fields, which highlighted the development of Dean vortices. As illustrated in Figure 7, these vortices persisted for up to 25 D downstream of the elbow. At first, the Dean vortices displayed nearly perfect symmetry up to around 7 D. However, between 8 D and 10 D from the elbow, this symmetry broke down, resulting in chaotic behavior of the Dean vortices. In the region from 8 D and 10 D, the vorticity of the Dean vortices reversed direction, with the left vortex switching from clockwise to counterclockwise and the right vortex doing the opposite, as indicated by the coloured fields in Figure 7. Downstream of this region, the Dean vortices maintained their vorticity direction until approximately 26 D, where they began to decay in structure. These results were based on turbulent flow conditions at , though similar behavior was observed at , with vorticity reversal occurring between 8 D and 11 D and the Dean vortices persisting up to 20 D. In contrast, under laminar conditions at , the development of the Dean vortices differed, with four strong vortices appearing between 8 D and 11 D, which gradually decayed further downstream.
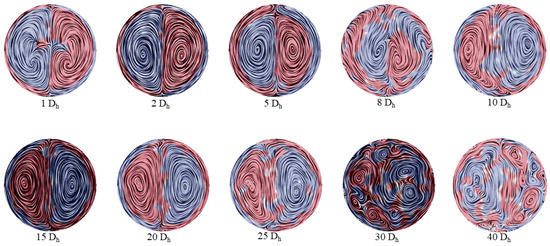
Figure 7.
Evolution of Dean vortices downstream of the pipe elbow shows that these structures persist at a distance as far as 25 D. The coloured fields illustrate the direction of vorticity component x: blue is negative (counterclockwise) and red is positive (clockwise). Clearly, there is a shift (reversal) in vorticity direction at a distance between 8 D and 10 D. These results have been calculated on a time-averaged velocity field for flow at .
In order to estimate the flow recovery length, we calculated time-averaged velocity fields and introduced four different criteria. Namely, the first applied criterium was based on calculation of the time-averaged wall shear stress. This criterium gives useful information about flow anisotropy in the near-wall region; however, it reveals no or minimal insight about the flow anisotropy in the bulk region. For that reason, we also introduced profile asymmetry parameter , which integrates discrepancies between profile function and across the pipe diameter , i.e.,
where , , and are axial, radial and azimuthal coordinates in the pipe downstream of the pipe elbow and is the pipe radius. Clearly, the flow asymmetry is proportional to the area between curve and its mirrored counterpart , as shown with the purple area in Figure 8. For each axial location, a single value for is calculated, offering a concise insight into the flow’s asymmetry. We calculated the flow asymmetry parameter in two perpendicular (azimuthal) directions, i.e., y- and z-profiles, at all distances downstream of the elbow starting at 0 up to 100 D. The asymmetry parameter was calculated for mean streamwise velocity , streamwise velocity fluctuations , and vorticity magnitude at all axial locations downstream of the pipe elbow. All introduced criteria are summarized in Table 3, and results are presented in the following subsections.
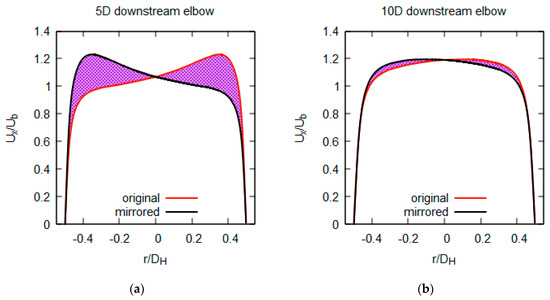
Figure 8.
The original profile (red) and its mirrored counterpart (black) of the time-averaged velocity across the pipe diameter at the distance of 5 D (a) and 10 D (b) downstream of the elbow. The profile’s asymmetry is proportional to the purple area between the two profiles.

Table 3.
The introduced asymmetry parameters for different flow variables in Equation (3).
3.1. Asymmetry in Wall Shear Stress
Wall shear stress (WSS) was used as the first criterium for estimation of the flow recovery length. WSS is defined as
where , , and are axial, radial and azimuthal coordinates in the pipe downstream of the pipe elbow, is the magnitude of the time-averaged velocity and is the pipe radius. Figure 9 shows the calculated WSS at the pipe walls downstream of the exit of the sharp elbow. Location corresponds to the outlet of the elbow, whereas azimuth corresponds to the direction of the inlet pipe flow, i.e., direction in Figure 2. It is evident that the WSS was much smaller for the transitional case than the other two turbulent cases. In the transitional case, the WSS gradually decreased along the axial (streamwise) direction, but it did not achieve a converged final value within the 100 D long domain. Contrarily, in the two turbulent cases, the converged final value of WSS was achieved at a distance of about 30–40 D and 20–30 D downstream of the elbow at the of 5600 and 10,000, respectively. In the flow-developing region, the WSS exhibited dependence not only in the axial coordinate but also in azimuth , i.e., at constant , the WSS was smaller at than at , which corresponds to the flow-impinging wall of the pipe. Furthermore, WSS exhibited strong dependence on with shorter recovery length at a larger , which can be attributed to better mixing in highly turbulent flows.
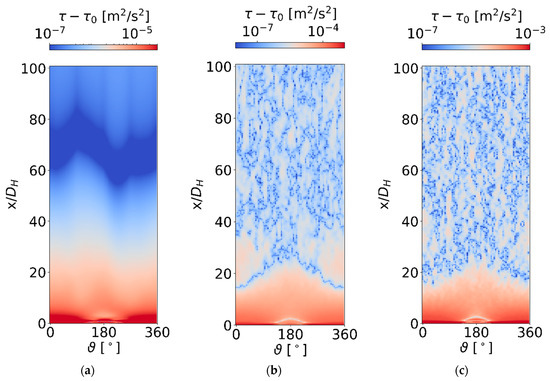
Figure 9.
Calculated time-averaged wall shear stress downstream of the pipe elbow is a function of axial and azimuthal coordinates, as well as : (a) ; (b) ; (c) . In order to visualize small variations in the calculated WSS, we plotted in logarithmic scale with being a positive value of at , at and at .
3.2. Asymmetry in Mean Velocity Profiles
While WSS effectively indicates flow asymmetry in the near-wall region, it offers no information on the flow behaviour in the core (bulk) flow region of the pipe. Thus, we examined the flow asymmetry of different time-averaged flow fields in radial profiles, which crossed the centre of the pipe in two perpendicular directions: the y-profile (perpendicular to the elbow plane) and z-profile (parallel to the elbow plane). For fully developed flow in long straight pipes, both of these profiles should be symmetric, and the asymmetry parameter should approach zero with the increased duration of time-averaging. Thus, it is important to show that the observed asymmetry is indeed the effect of the pipe bending and not an artefact of short time-averaging or any other reason.
Figure 10 shows the calculated asymmetry parameter of the time-averaged streamwise velocity component as a function of axial location downstream of the elbow for three different . The blue and green curves are calculated for y- and z-profiles, respectively, while the red curve is calculated in the velocity recycling part of the inlet section, which corresponds to an “infinite” straight pipe and serves as a threshold indicator when the asymmetry parameter reaches the value typical for an axisymmetric flow. The recycling part section measures only 5 D in length, leading to the results being periodically extended in the plots of Figure 10. They serve merely as an indicator of the anticipated outcome under symmetric flow conditions, given the specified duration of time-averaging. It should also be noted that while this value (red curve) should be zero in the laminar case, interpolation and rounding errors result in a very low nonzero value. The results clearly showed that the asymmetry propagates longer in the flow with lower . In fact, for the transitional case, the 100 D long pipe was too short for the flow recovery into a symmetric flow. For the two turbulent cases, the recovery length is about 20–40 D at and 10–15 D at . The exact recovery length depends also on profile direction, i.e., it is systematically shorter for the y-profiles than for the z-profiles. The reason for that is the symmetry of the entire computational domain. Namely, the inlet pipe points in z-direction, which means that the entire system exhibits reflection symmetry in y-direction but not in the z-direction.

Figure 10.
Obtained asymmetry parameter for time-averaged velocity field calculated in y- and z-profiles at different : (a) ; (b) ; (c) . Red curve indicates same quantity calculated in the recycling inlet pipe section, where no asymmetry is expected.
3.3. Asymmetry in Velocity Fluctuation Profiles
The calculated asymmetry parameter in the variance of the streamwise velocity fluctuation component is shown in Figure 11. In the transitional laminar-turbulent flow in a straight pipe, the velocity fluctuations are, by definition, zero in the inlet region. However, in the flow downstream of the pipe elbow, instabilities are triggered by the elbow due to the flow separation, which are gradually damped along the pipe. Thus, the flow slowly approaches the laminar flow again; however, the 100 D long pipe section is too short to obtain the same level of asymmetry parameter , as it is obtained in a straight inlet pipe, i.e., the achieved 10−7 is attributed mainly to the rounding error. For the turbulent flows, the recovery length is about 20–40 at and 10 D at , which is qualitatively in agreement with our previous observations using WSS criterium. It can be concluded that the flow asymmetry in velocity fluctuations does not seem to be more persistent than the asymmetry in time-averaged velocity profiles.

Figure 11.
Asymmetry parameter for streamwise velocity fluctuations calculated in y- and z-profiles at different : (a) ; (b) ; (c) . Red curve indicates same quantity calculated in the recycling inlet pipe section, where no asymmetry is expected.
3.4. Asymmetry in Vorticity Profiles
The asymmetry parameter utilizes the magnitude of vorticity field, including all three components of the vorticity field. Therefore, it considers a local flow behaviour not only in the streamwise, but in all flow directions. Figure 12 shows the calculated downstream of the elbow for the three different . Again, in transitional flow the asymmetry is gradually decreased along the axial direction; however, the 100 D length is too short to retain the symmetric flow conditions attained in the pipe upstream of the elbow, i.e., the red curve in Figure 12. In turbulent flows, the recovery length is about 10–40 D at and about 10 D at , which agrees well with our previous asymmetry indicators. In conclusion, our observations revealed that the asymmetry parameter does not seem to be more sensitive to the flow asymmetry than other asymmetry parameters applied in this study.

Figure 12.
Asymmetry parameter for vorticity field calculated in y- and z-profiles at different : (a) ; (b) ; (c) . Red curve indicates same quantity calculated in the recycling inlet pipe section, where no asymmetry is expected.
4. Conclusions
This study investigates propagation of flow asymmetry downstream of a sharp pipe elbow with a bend curvature ratio . Numerical simulations of incompressible turbulent flow at of 1400, 5600 and 10,000 were performed using the LES approach. Results of the turbulent cases were first validated against the DNS results of pipe flow in straight pipes. We examined the dynamics of the Dean vortices downstream of the elbow and discovered that, in turbulent cases, these vortices reversed their vorticity direction within the region between 8 D and 10 D, but they persisted up to a distance of 25 D from the elbow. Then, we introduced profile asymmetry parameters and analysed flow asymmetry in a 100 D long pipe section downstream of the elbow using four different criteria, which resulted in similar observations.
The recovery length to symmetric flow is defined as the distance downstream of the elbow where the asymmetry parameter reaches the value expected in a long straight pipe. However, since the asymmetry parameter does not always decrease monotonically with distance from the elbow, we slightly relaxed this criterion. As a result, we now consider a broader range of values, from nearly symmetric (lower value) to fully symmetric flow profiles (higher value). In the turbulent cases, the recovery length is systematically shorter at larger regardless of the criteria applied. Specifically, a recovery length of 10–40 D was observed at and 10–30 D at . This analysis involved investigation into asymmetries of the wall shear stress, streamwise velocity component, streamwise velocity fluctuations and vorticity fields. Wall shear stress turned out to be a sensitive indicator of flow asymmetry in the near-wall region; however, it offers very limited or no information on the flow behaviour in the core (bulk) flow region. Contrarily, analysing flow profiles across the pipe diameter offers an improved understanding of flow asymmetry in the bulk region. It was found that the asymmetry parameter, when based on velocity fluctuations and vorticity, did not yield significantly more sensitive results compared to those based on the streamwise velocity component.
At , the flow is laminar at the inlet; however, flow separation inside the elbow triggers flow instabilities which can be described as non-developed turbulence. After that, the vortices are gradually damped as the flow approaches laminar again. Nevertheless, the flow asymmetry is so persistent and the laminarization so slow that the 100 D long pipe is not long enough for the flow to recover back to a fully developed symmetric profile.
Author Contributions
Conceptualization, B.M. and I.T.; methodology, B.M., K.C. and I.T.; software, K.C.; validation, B.M. and K.C.; formal analysis, B.M. and K.C.; investigation, B.M., K.C. and I.T.; resources, I.T.; data curation, K.C.; writing—original draft preparation, B.M.; writing—review and editing, K.C. and I.T.; visualization, K.C.; supervision, I.T.; project administration, B.M.; funding acquisition, I.T. All authors have read and agreed to the published version of the manuscript.
Funding
This research was funded by the Slovenian Research Agency, grants P2-0026 and NC-0026.
Institutional Review Board Statement
Not applicable.
Informed Consent Statement
Not applicable.
Data Availability Statement
The data presented in this study are available on request from the corresponding author. The data are not publicly available due to privacy.
Acknowledgments
The authors gratefully acknowledge the financial support provided by the Slovenian Research Agency through the grants P2-0026 and NC-0026. The authors also gratefully acknowledge the HPC RIVR consortium (https://www.hpc-rivr.si (accessed on 19 August 20204)) and EuroHPC JU (https://eurohpc-ju.europa.eu (accessed on 19 August 20204)) for funding this research by providing computing resources of the HPC system Vega at the Institute of Information Science (https://www.izum.si (accessed on 19 August 20204)). The authors are thankful to Jakob Jakše for his work in illustrating and providing Figure 1b.
Conflicts of Interest
The authors declare no conflicts of interest. During the preparation of this work, the authors used ChatGPT 4 in order to improve language and readability of the manuscript. After using this tool, the authors reviewed and edited the content as needed and take full responsibility for the content of the publication.
References
- Dean, W.R. LXXII. The Stream-Line Motion of Fluid in a Curved Pipe (Second Paper). Lond. Edinb. Dublin Philos. Mag. J. Sci. 1928, 5, 673–695. [Google Scholar] [CrossRef]
- Dean, W.R.; Hurst, J.M. Note on the Motion of Fluid in a Curved Pipe. Mathematika 1959, 6, 77–85. [Google Scholar] [CrossRef]
- Prandtl, L. Essentials of Fluid Dynamics: With Applications to Hydraulics, Aeronautics, Meteorology and Other Subjects; Blackie & Son: Glasgow, UK, 1952. [Google Scholar]
- Kalpakli Vester, A.; Örlü, R.; Alfredsson, P.H. Turbulent Flows in Curved Pipes: Recent Advances in Experiments and Simulations. Appl. Mech. Rev. 2016, 68, 050802. [Google Scholar] [CrossRef]
- Düz, H. Numerical and Experimental Study to Predict the Entrance Length in Pipe Flows. J. Appl. Fluid Mech. 2019, 12, 155–164. [Google Scholar] [CrossRef]
- Doherty, J.; Ngan, P.; Monty, J.; Chong, M. The Development of Turbulent Pipe Flow. In Proceedings of the 16th Australasian Fluid Mechanics Conference, Gold Coast, Australia, 3–7 December 2007; pp. 266–270. [Google Scholar]
- Avila, M.; Barkley, D.; Hof, B. Transition to Turbulence in Pipe Flow. Annu. Rev. Fluid Mech. 2023, 55, 575–602. [Google Scholar] [CrossRef]
- Mullin, T. Experimental Studies of Transition to Turbulence in a Pipe. Annu. Rev. Fluid Mech. 2011, 43, 1–24. [Google Scholar] [CrossRef]
- Sudo, K.; Sumida, M.; Hibara, H. Experimental Investigation on Turbulent Flow in a Circular-Sectioned 90-Degree Bend. Exp. Fluids 1998, 25, 42–49. [Google Scholar] [CrossRef]
- Sudo, K.; Sumida, M.; Hibarra, H. Experimental Investigation on Turbulent Flow through a Circular-Sectioned 180° Bend. Exp. Fluids 2000, 28, 51–57. [Google Scholar] [CrossRef]
- Hellström, L.H.O.; Zlatinov, M.B.; Cao, G.; Smits, A.J. Turbulent Pipe Flow Downstream of a Bend. J. Fluid Mech. 2013, 735, R7. [Google Scholar] [CrossRef]
- Tunstall, M.; Harvey, J. On the Effect of a Sharp Bend in a Fully Developed Turbulent Pipe-Flow. J. Fluid Mech. 1968, 34, 595–608. [Google Scholar] [CrossRef]
- Sattarzadeh, S.S. Experimental Study of Complex Pipe Flow. Master’s Thesis, Royal Institute of Technology, Stockholm, Sweden, 2011. [Google Scholar]
- Kalpakli, A.; Örlü, R. Turbulent Pipe Flow Downstream a 90° Pipe Bend with and without Superimposed Swirl. Int. J. Heat Fluid Flow 2013, 41, 103–111. [Google Scholar] [CrossRef]
- Kalpakli Vester, A.; Sattarzadeh, S.S.; Örlü, R. Combined Hot-Wire and PIV Measurements of a Swirling Turbulent Flow at the Exit of a 90° Pipe Bend. J. Vis. 2016, 19, 261–273. [Google Scholar] [CrossRef]
- Canton, J.; Schlatter, P.; Örlü, R. Modal Instability of the Flow in a Toroidal Pipe. J. Fluid Mech. 2016, 792, 894–909. [Google Scholar] [CrossRef]
- Lupi, V.; Canton, J.; Schlatter, P. Global Stability Analysis of a 90°-Bend Pipe Flow. Int. J. Heat Fluid Flow 2020, 86, 108742. [Google Scholar] [CrossRef]
- Massaro, D.; Lupi, V.; Peplinski, A.; Schlatter, P. Global Stability of 180°-Bend Pipe Flow with Mesh Adaptivity. Phys. Rev. Fluids 2023, 8, 113903. [Google Scholar] [CrossRef]
- Di Liberto, M.; Di Piazza, I.; Ciofalo, M. Turbulence Structure and Budgets in Curved Pipes. Comput. Fluids 2013, 88, 452–472. [Google Scholar] [CrossRef]
- Noorani, A.; Schlatter, P. Swirl-Switching Phenomenon in Turbulent Flow through Toroidal Pipes. Int. J. Heat Fluid Flow 2016, 61, 108–116. [Google Scholar] [CrossRef]
- Hufnagel, L.; Canton, J.; Örlü, R.; Marin, O.; Merzari, E.; Schlatter, P. The Three-Dimensional Structure of Swirl-Switching in Bent Pipe Flow. J. Fluid Mech. 2018, 835, 86–101. [Google Scholar] [CrossRef]
- Röhrig, R.; Jakirlić, S.; Tropea, C. Comparative Computational Study of Turbulent Flow in a 90° Pipe Elbow. Int. J. Heat Fluid Flow 2015, 55, 120–131. [Google Scholar] [CrossRef]
- He, X.; Apte, S.V.; Karra, S.K.; Doğan, Ö.N. An LES Study of Secondary Motion and Wall Shear Stresses in a Pipe Bend. Phys. Fluids 2021, 33, 115102. [Google Scholar] [CrossRef]
- Al-Baghdadi, M.A.; Resan, K.K.; Al-Waily, M. CFD Investigation of the Erosion Severity in 3D Flow Elbow during Crude Oil Contaminated Sand Transportation. Eng. Technol. J. 2017, 35, 930–935. [Google Scholar] [CrossRef]
- Ma, R.; Tang, R.; Gao, Z.; Yu, T. Optimized Design of Pipe Elbows for Erosion Wear. NATO Adv. Sci. Inst. Ser. E Appl. Sci. 2024, 14, 984. [Google Scholar] [CrossRef]
- Ma, G.; Ma, H.; Sun, Z. Simulation of Two-Phase Flow of Shotcrete in a Bent Pipe Based on a CFD–DEM Coupling Model. NATO Adv. Sci. Inst. Ser. E Appl. Sci. 2022, 12, 3530. [Google Scholar] [CrossRef]
- Henríquez Lira, S.; Torres, M.J.; Guerra Silva, R.; Zahr Viñuela, J. Numerical Characterization of the Solid Particle Accumulation in a Turbulent Flow through Curved Pipes by Means of Stokes Numbers. NATO Adv. Sci. Inst. Ser. E Appl. Sci. 2021, 11, 7381. [Google Scholar] [CrossRef]
- Khalifa, A.; Gollwitzer, J.; Breuer, M. LES of Particle-Laden Flow in Sharp Pipe Bends with Data-Driven Predictions of Agglomerate Breakage by Wall Impacts. Fluids 2021, 6, 424. [Google Scholar] [CrossRef]
- Gotfredsen, E.; Kunoy, J.D.; Mayer, S.; Meyer, K.E. Experimental Validation of RANS and DES Modelling of Pipe Flow Mixing. Heat Mass Transf. 2020, 56, 2211–2224. [Google Scholar] [CrossRef]
- Wojewodka, M.M.; White, C.; Shahpar, S.; Kontis, K. Numerical Study of Complex Flow Physics and Coherent Structures of the Flow through a Convoluted Duct. Aerosp. Sci. Technol. 2022, 121, 107191. [Google Scholar] [CrossRef]
- Rütten, F.; Schröder, W.; Meinke, M. Large-Eddy Simulation of Low Frequency Oscillations of the Dean Vortices in Turbulent Pipe Bend Flows. Phys. Fluids 2005, 17, 035107. [Google Scholar] [CrossRef]
- Alabdalah, A.; Wnos, L. Numerical Simulation and Flow Analysis of a 90-Degree Elbow. Int. J. Civ. Mech. Energy Sci. 2020, 6, 10–13. [Google Scholar] [CrossRef]
- Bilde, K.G.; Sørensen, K.; Hærvig, J. Decay of Secondary Motion Downstream Bends in Turbulent Pipe Flows. Phys. Fluids 2023, 35, 015102. [Google Scholar] [CrossRef]
- Tunstall, R.; Laurence, D.; Prosser, R.; Skillen, A. Large Eddy Simulation of a T-Junction with Upstream Elbow: The Role of Dean Vortices in Thermal Fatigue. Appl. Therm. Eng. 2016, 107, 672–680. [Google Scholar] [CrossRef]
- Zhou, M.; Costa Garrido, O.; Ma, S.; Zhang, N. Numerical Investigation of Turbulent Thermal Stratification at a Horizontally Oriented 90° Pipe-Elbow with Varied Elbow Radiuses. Int. J. Therm. Sci. 2023, 185, 108092. [Google Scholar] [CrossRef]
- Kren, J.; Frederix, E.M.A.; Tiselj, I.; Mikuž, B. Numerical Study of Taylor Bubble Breakup in Counter-Current Flow Using Large Eddy Simulation. Phys. Fluids 2024, 36, 023311. [Google Scholar] [CrossRef]
- Kren, J.; Zajec, B.; Tiselj, I.; Shawish, S.E.; Perne, Ž.; Tekavčič, M.; Mikuž, B. Dynamics of Taylor Bubble Interface in Vertical Turbulent Counter-Current Flow. Int. J. Multiph. Flow 2023, 165, 104482. [Google Scholar] [CrossRef]
- OpenFOAM V10. Available online: https://openfoam.org/version/10/ (accessed on 17 February 2024).
- HPC Vega. Available online: https://en-vegadocs.vega.izum.si/ (accessed on 17 February 2024).
- Cerkovnik, K. Simulacija Turbuletnega Toka z Metodo Velikih Vrtincev v Cevi s Kolenom. Master’s Thesis, Faculty of Mathematics and Physics, University of Ljubljana, Ljubljana, Slovenia, 2023. [Google Scholar]
- Nicoud, F.; Ducros, F. Subgrid-Scale Stress Modelling Based on the Square of the Velocity Gradient Tensor. Flow Turbul. Combust. 1999, 62, 183–200. [Google Scholar] [CrossRef]
- Komen, E.; Shams, A.; Camilo, L.; Koren, B. Quasi-DNS Capabilities of OpenFOAM for Different Mesh Types. Comput. Fluids 2014, 96, 87–104. [Google Scholar] [CrossRef]
- Mikuž, B.; Tiselj, I. Wall-Resolved Large Eddy Simulation in Grid-Free 5×5 Rod Bundle of MATiS-H Experiment. Nucl. Eng. Des. 2016, 298, 64–77. [Google Scholar] [CrossRef]
- Frederix, E.; Tajfirooz, S.; Hopman, J.; Fang, J.; Merzari, E.; Komen, E. Two-Phase Turbulent Kinetic Energy Budget Computation in Co-Current Taylor Bubble Flow. Nucl. Sci. Eng. 2023, 197, 2585–2601. [Google Scholar] [CrossRef]
- Fukagata, K.; Kasagi, N. Highly Energy-Conservative Finite Difference Method for the Cylindrical Coordinate System. J. Comput. Phys. 2002, 181, 478–498. [Google Scholar] [CrossRef]
- El Khoury, G.K.; Schlatter, P.; Noorani, A.; Fischer, P.F.; Brethouwer, G.; Johansson, A.V. Direct Numerical Simulation of Turbulent Pipe Flow at Moderately High Reynolds Numbers. Flow Turbul. Combust. 2013, 91, 475–495. [Google Scholar] [CrossRef]
- Komen, E.M.J.; Camilo, L.H.; Shams, A.; Geurts, B.J.; Koren, B. A Quantification Method for Numerical Dissipation in Quasi-DNS and under-Resolved DNS, and Effects of Numerical Dissipation in Quasi-DNS and under-Resolved DNS of Turbulent Channel Flows. J. Comput. Phys. 2017, 345, 565–595. [Google Scholar] [CrossRef]
Disclaimer/Publisher’s Note: The statements, opinions and data contained in all publications are solely those of the individual author(s) and contributor(s) and not of MDPI and/or the editor(s). MDPI and/or the editor(s) disclaim responsibility for any injury to people or property resulting from any ideas, methods, instructions or products referred to in the content. |
© 2024 by the authors. Licensee MDPI, Basel, Switzerland. This article is an open access article distributed under the terms and conditions of the Creative Commons Attribution (CC BY) license (https://creativecommons.org/licenses/by/4.0/).