Article

Transfer Learning in Multimodal Sunflower Drought Stress Detection

1
Faculty of Technical Sciences, University of Novi Sad, Trg Dositeja Obradovića 6, 21000 Novi Sad, Serbia
2
Institute of Field and Vegetable Crops, Maksima Gorkog 30, 21000 Novi Sad, Serbia
*
Author to whom correspondence should be addressed.
Appl. Sci. 2024, 14(14), 6034; https://doi.org/10.3390/app14146034
Submission received: 21 May 2024 / Revised: 18 June 2024 / Accepted: 22 June 2024 / Published: 10 July 2024

Abstract

:
Efficient water supply and timely detection of drought stress in crops to increase yields is an important task considering that agriculture is the primary consumer of water globally. This is particularly significant for plants such as sunflowers, which are an important source of quality edible oils, essential for human nutrition. Traditional detection methods are labor-intensive, time-consuming, and rely on advanced sensor technologies. We introduce an innovative approach based on neural networks and transfer learning for drought stress detection using a novel dataset including 209 non-invasive rhizotron images and 385 images of manually cleaned sections of sunflowers, subjected to normal watering or water stress. We used five neural network models: VGG16, VGG19, InceptionV3, DenseNet, and MobileNet, pre-trained on the ImageNet dataset, whose performance was compared to select the most efficient architecture. Accordingly, the most efficient model, MobileNet, was further refined using different data augmentation mechanisms. The introduction of targeted data augmentation and the use of grayscale images proved to be effective, demonstrating improved results, with an F1 score and an accuracy of 0.95. This approach encourages advances in water stress detection, highlighting the value of artificial intelligence in improving crop health monitoring and management for more resilient agricultural practices.

1. Introduction

Almost 70% of all water resources worldwide are used in agriculture. It has become the largest consumer of water at the global level, highlighting the need for developing efficient water supply mechanisms. Such measures are important because they not only conserve resources but can also increase crop yield and food production [1]. Consequently, timely detection of crop water stress is crucial, especially for crops such as sunflowers. Sunflowers are one of the most important sources of edible oil in the world, and their oil is considered to be of the highest quality for human consumption. They have a moderate drought tolerance, but despite this, prolonged exposure to drought significantly reduces their yield, which affects oil quality [2]. Although traditional methods for detecting crop water stress exist, they are usually labor-intensive and time-consuming and rely on advanced sensor technologies [3].
Advances in applied artificial intelligence (AI) lead to the possibility of addressing these problems in a promising way. AI-based technologies are helping to improve efficiency in almost every area of agriculture, including areas dealing with crop yield, irrigation, soil water content detection, crop monitoring, weeding, and crop placement [4,5]. In the wide spectrum of applications of AI in agriculture, there are studies on crop yield prediction using machine learning (ML) [6,7], plant disease image recognition technologies [8], IoT solutions for smart farming [9], big data in agriculture [10], and agriculture 4.0 [11,12,13]. In addition, the integration of ML with image processing techniques represents a leap forward from standard practices, enabling rapid and non-invasive assessment of water stress [14]. ML methods proved to be reliable for the classification of drought stress in plants using leaf reflectance spectra, which highlights the potential of spectral analysis combined with advanced computational techniques [15]. Moreover, deep learning (DL), through the use of convolutional neural networks (CNNs), has revolutionized image classification in agriculture. Also, DL, in combination with transfer learning (TL), has emerged as a promising tool for automating the process of early water stress detection in various crops [16]. For example, the identification and classification of drought stress in maize were performed using deep CNNs [17]. The power of TL in agriculture is reflected in the adaptability of pre-trained networks to new tasks [18]. These studies not only showed high accuracy in predictions but also proved to be non-invasive, economical, and scalable solutions compared to traditional stress detection methods.
Although DL can have a great positive impact on agricultural problems, such as timely drought detection, various challenges with agricultural datasets can compromise the effectiveness of the results. DL models need very large datasets to achieve good results [19,20]. Since the size of datasets in real-world scenarios is usually limited, it is common practice to use lightweight CNN architectures for image classification. These models have demonstrated a promising balance between high classification accuracy and computational efficiency in many fields [21]. Furthermore, using TL can improve model accuracy without requiring more data [18]. However, agricultural images are domain-specific, and the pre-trained models used in TL are not trained on such images but on general image datasets for computer vision. Another problem can be the class imbalance, which can also degrade the performance of DL models, including in agricultural applications. This can be seen in the paper, which represents an application of transfer learning through the ResNet50 architecture to detect two common apple diseases [22]. The obtained accuracy was 97%, with an accuracy of only 51% for mixed diseases, which was caused by class imbalance [22]. Therefore, it is often necessary to enrich and balance the existing data to increase not only the accuracy of the model but also its robustness and generality [23]. In addition to data augmentation, which is often used, another way this can be performed is using synthetically generated data [23]. Additionally, since the quantity of information that can be gleaned from a single source is constrained, data gathered from several sources could also be used, which can increase the robustness of the model [24].
In this paper, we aim to leverage technologies to contribute to the enhancement of plant performance, aligning with global sustainability objectives and marking an advancement in agricultural science and technology. The main contributions of this research are the following:
  • Introducing a novel application of an image dataset for sunflower drought stress prediction, consisting of 584 images of sunflower roots and shoots;
  • Using shoot, root parts, and rhizotron images to provide a comprehensive understanding of sunflower responses to drought;
  • Applying targeted data augmentation to address the issues with limited and imbalanced datasets to improve model performance;
  • Setting up a novel pipeline for sunflower drought stress detection based on a CNN and TL that combines multimodal images and customized augmentation strategies.

2. Materials and Methods

2.1. Experimental Framework

A pipeline framework for predicting sunflower drought stress using multimodal images applied in this paper is shown in Figure 1. During the initial phase of the experiment, sunflower inbred lines were chosen for their drought resistance, productivity, and response to fungal diseases. Substrate preparation, which involved adjusting moisture levels, was followed by the simulation to determine the drought tolerance of these lines under controlled growth chamber conditions. A second pipeline stage involved the creation of two separate image collections. One collection contained photographs of root images while they were in rhizotrons with the Canon EOS 850D, while another was obtained by scanning manually prepared sunflower shoot and root parts with WinRhizo Pro 2021 software (Regent Instruments Canada Inc., Quebec, QC, Canada). The data were standardized through data preprocessing and then divided into training, validation, and testing subsets. We leveraged the robustness of pre-trained CNN models by applying TL to our dataset. We used five CNN models that were well suited to address the task, as described in Section 2.4. The model’s performance was evaluated on the test subset using the evaluation metrics outlined in Section 2.5. The model that performed the best was chosen and used in further experiments to see if some data augmentation technique could improve the model’s performance, additionally. We evaluated the model using different data augmentation configurations. Finally, based on these results, we proposed the most effective data augmentation configuration for the selected model. This approach, through its innovative use of multimodal images and customized data augmentation methods, could improve the model’s robustness, present fresh approaches to improving the dataset, and set new benchmarks for plant science and agricultural predictive modeling.

2.2. Planting Setup

A focused selection of twelve sunflower inbred lines was undertaken at the Institute of Field and Vegetable Crops, Novi Sad, Serbia, based on prior evaluations of drought resistance, productivity, and their response to fungal diseases, such as Marophomina phaseolina and Diaporthe helianthi. These inbred lines are noteworthy for their roles in breeding programs, particularly as the female parents in the production of sunflower hybrids [25].
The growth chamber of the Institute of Field and Vegetable Crops, situated at Rimski Šančevi, close to Novi Sad, Serbia (45°19′44.7204″ N, 19°49′39.29916″ E), was used for the experiments. The experiment was conducted under controlled conditions to evaluate the response of sunflower inbred lines to drought conditions. In factorial experiments with a completely randomized design, inbred lines were cultivated under three distinct soil moisture statuses: well watered (70% gravimetric water content [GWC]) and drought stress (42% and 50% GWC). In a growth chamber with artificial lighting, the experiment was carried out at 23 ± 2 °C, 16/8 h of light and dark, and about 70% relative humidity. The rhizotrons used in the experiment had inner dimensions of 29 × 59 × 1.5 cm. The majority of the roots would be visible on the transparent side of the rhizotron due to the 45° rhizotron placement angle. The substrate Klasmann Deilmann Potground P was placed inside each rhizotron, and its GWC was measured with the Moisture Analyzer DBS 60-3 Kern & Sohn GmbH (Balingen, Germany). Before being sown, the sunflower seeds were kept at 23 °C for 24 h on damp filter paper. One seed that was beginning to germinate was placed at a one-centimeter depth into a rhizotron. On the surface of the soil, a 1 cm layer of Perlit was applied to decrease water loss. One rhizotron was considered to be one replicate. At one GWC level, there were ten randomly distributed replicates of each genotype. The plants were grown in rhizotrons with a 70% GWC until the main root of each plant reached the base of the rhizotron. The majority of young sunflower plants reached the growing stage of first true leaves in the control (70% GWC) and cotyledon stage under drought stress (50% GWC).

2.3. Dataset

There was a total of 584 images in the dataset, which consisted of images from two data sources. The first data source contained a total of 209 non-invasive rhizotron images that give important information about root morphology at different GWC levels from a subsurface perspective, as shown in Figure 2a. Non-invasive rhizotron images were taken on the 14-day-old plant in a box with artificial light and a camera placed at a fixed distance. The rhizotrons had a black square of known size placed on the transparent side of the rhizotron for calibration before using WinRhizo Pro software for measurement.
In order to provide a more accurate assessment of the effects of drought stress on the visible plant features, we used the second data source, which included 375 photos of sunflower root parts and shoots that have been manually cleaned to remove extraneous material, as shown in Figure 2b,c. Those images were obtained following the fourteenth day of cultivation, when the plants were removed from rhizotrons, the soil was washed out, and any last bits of soil were carefully cleaned off the roots. Measurement and scanning of the root systems and above-ground parts were performed using WinRhizo Pro software and a scanner by placing the roots directly on the scanner glass.
The dataset was divided into training (80% of the dataset), validation (20% of the training subset), and testing sets (20% of the dataset).

Data Augmentation Strategies

The dataset was class imbalanced, with 228 photos of plants experiencing drought stress (42% and 50% GWC) and 356 photos of well-watered plants (70% GWC). The imbalance occurred because a significant number of plants exposed to a drought level of 42% failed to grow, indicating that the drought level was too severe. To address this problem and simplify the classification process, we adapted our experimental design. Instead of categorizing plants into three different groups based on the exact GWC percentages (42%, 50%, and 70%), we grouped them into two broad classification categories: stressed (drought stressed) and non-stressed (well watered). This adjustment not only reflects the practical results of stress levels on plant growth but also helps manage class imbalances within the dataset by consolidating stress categories. However, the dataset remained imbalanced, so we included data augmentation strategies in our pipeline when using the optimal CNN model.
Also, data augmentation techniques were used to strengthen the model’s resilience to changes in image orientation, light, scale, and deformation. This could enhance the model’s generalization abilities, which are particularly important when dealing with a limited dataset. Instances of the ImageDataGenerator class from the Keras library [26] were used for data augmentation on the training set and for rescaling on both the training and test sets.
After several experiments, we discovered that the best parameters for the data augmentation generator are as follows:
  • Horizontal flipping;
  • Rotation range: ±20 degrees;
  • Width shift range: ±20%;
  • Height shift range: ±20%;
  • Zoom range: ±20%;
  • Brightness range: 0.1–0.9.
Our second approach to increasing the diversity and representativeness of the dataset was augmenting the data by adding new images based on existing images [27,28,29]. This initiative was driven by the need to address inherent limitations in the original dataset, specifically the lack of images that captured partial root views under drought stress. This was explained by the fact that under stress, roots tend to be smaller in size and can usually fit completely inside one image frame, providing no room for partial views. We decided to create new images based on existing ones to close this gap and simulate a wider variety of drought stress scenarios. New images were created by dividing 13 randomly selected original root images from the drought-stressed group, both horizontally and vertically [30]. In the well-watered group, which consists of 356 images, 66 images contained plant parts, constituting approximately 18.5% of the total well-watered images. Thus, we selected 13 images from the drought-stressed group, since it was approximately 18.5% of the total drought-stressed dataset after adding newly generated images.

2.4. Convolutional Neural Networks and Transfer Learning

The most popular feedforward DL model for two-dimensional input data, like an image, is the CNN. We focused on drought stress prediction in sunflower plants using five pre-trained neural networks: VGG16, VGG19, InceptionV3, DenseNet, and MobileNet. All models were pre-trained on ImageNet, which provided robust frameworks due to their deep and complex architectures tailored for image recognition tasks [31].
These CNN models were chosen due to several factors. Initially, we considered the design tenets and features of each architecture. Next, we selected architectures that have demonstrated strong performance on the ImageNet dataset. Computational efficiency was also factored into our selection, ensuring the model’s amenability to fine tuning within our resource constraints. Additionally, our choice was informed by prior successful applications of these CNN models in agricultural contexts, suggesting their potential efficacy in our domain-specific task [32,33]. Finally, all CNN architectures are accessible via TensorFlow Hub [34].
We compared models’ performance and identified the most effective CNN architecture, which was subsequently employed as the foundational model for developing a predictive framework for drought stress detection.

2.5. Evaluation Metrics

In order to assess the neural network models and select our base model, we concentrated on their performance. This is performed to assess how well the models detect the input images of sunflowers according to the drought stress that the plants have experienced. We used several metrics relevant to our classification task: accuracy, precision, recall, and F1 score.
Accuracy is a metric that quantifies the overall performance of a classifier (1).
A c c u r a c y = T P + T N T P + T N + F P + F N
Precision measures the proportion of true positive predictions out of all positive predictions made by the classifier (2).
P r e c i s i o n = T P T P + F P
The percentage of true positive outcomes among all actual positives is measured by recall (3).
R e c a l l = T P T P + F N
F1 score provides a single metric that balances precision and recall by capturing the overall effectiveness of the model in terms of positive class predictions (4).
F 1   S c o r e = 2 P r e c i s i o n R e c a l l P r e c i s i o n + R e c a l l
where
  • TPs (true positives) are the number of instances correctly predicted as positive;
  • FPs (false positives) are the number of instances incorrectly predicted as positive when they are actually negative;
  • TNs (true negatives) are the number of instances correctly predicted as negative;
  • FNs (false negatives) are the number of instances incorrectly predicted as negative when they are actually positive.

3. Results and Discussion

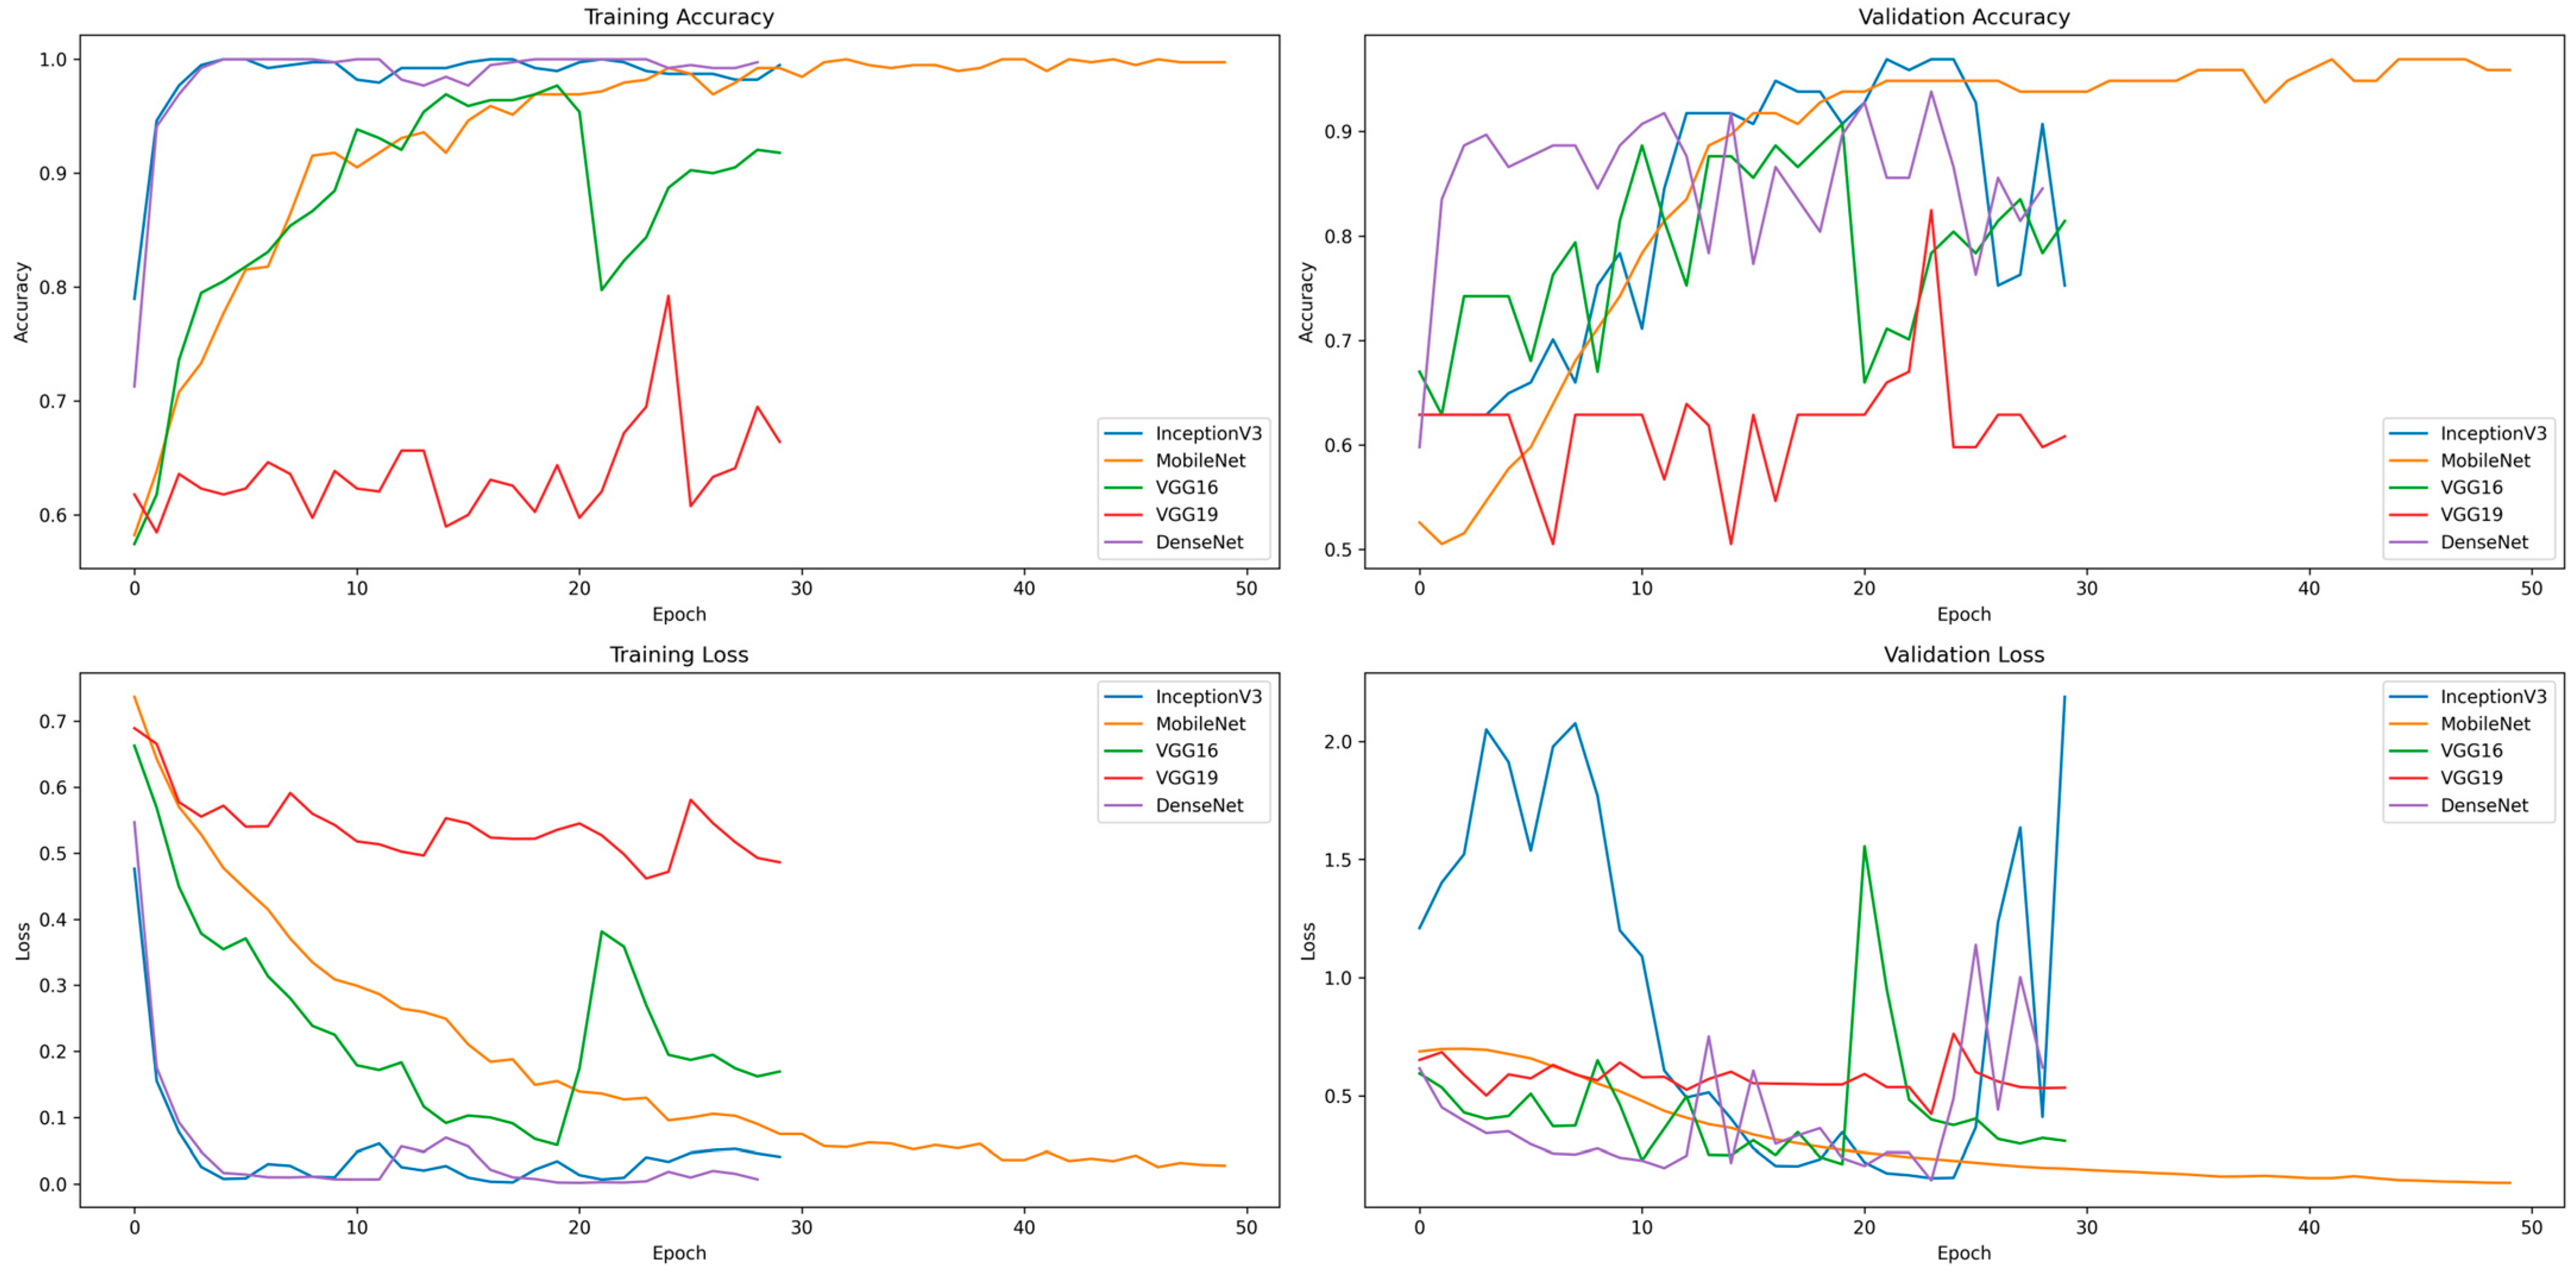
3.1. Configuration of CNN Models

The CNN framework for drought stress detection in sunflower images, proposed in this paper, consists of six layers. The first layer is the input layer, which takes images as inputs. The second layer is a pre-trained model on ImageNet images, and it is the base model in our framework. The next layer is the global average layer, which reduces the dimensionality and complexity of the computation. After that, a fully connected dense layer with ReLU activation was added to introduce non-linearity. The next layer is the dropout layer with a rate of 0.5, which was added to reduce overfitting by randomly omitting a subset of features [35]. The last layer is a dense layer, consisting of a single neuron with a sigmoidal activation function, and it produces a probability output, indicating the probability that the sunflower plant was under drought stress. The model is compiled with the Adam optimizer and binary cross-entropy loss. Finally, it was evaluated against standard metrics commonly used in binary classification with an imbalanced dataset to evaluate its effectiveness [36,37].
All five CNN models were trained multiple times with different manually adjusted parameters to find optimal parameters and improve performance. This was performed for both the original and grayscale datasets to determine the optimal learning rates, batch sizes, and number of epochs. In the preprocessing step, images were resized to 224 × 224 and rescaled by dividing pixel values by 255 to adjust them from a range of 0–255 to 0–1. This step simplifies the data, speeding up the learning and convergence of neural networks. We tested batch sizes of 16, 32, and 64 and discovered that 32 produced the best initial results for all models. This size provides good computing efficiency without exhausting the system memory. A batch size of 64 may result in memory limitations and maybe less consistent gradient estimations, whereas a batch size of 16 was less effective and slowed down the training process. Moreover, we determined that VGG16 required a lower learning rate of 0.00001 and a longer training period of 50 epochs. In contrast, VGG19, DenseNet, Inception V3, and MobileNet were successfully trained over 30 epochs at a higher learning rate of 0.0001 (Table 1). We used grayscale images to determine whether color information is necessary for accurate drought stress detection in sunflowers since in agriculture simplified imaging methods, like grayscale, can be effectively utilized for detecting and categorizing plant stress [38,39].
The goal was to determine which CNN architecture and dataset, original or grayscale images, give the best results in terms of generalization and prediction accuracy. Once the optimal underlying CNN architecture was chosen, the capacity of the models to use the enriched dataset was evaluated. Enhancement of the dataset involved standard data augmentation techniques, which included horizontal flipping, rotation, width shift, height shift, zoom, and brightness adjustments. Additionally, we employed targeted data augmentation, which incorporated new images based on well-known image features related to drought stress characteristics in sunflowers.

3.2. Initial Experiments Results

Five different CNN architectures processed in both original and grayscale formats were compared, as presented in the quantitative evaluation of models in Table 2. The performance of the MobileNet architecture was demonstrated by its accuracy and F1 score, which were 0.91 for the original color format. With an accuracy and F1 score of 0.89, this model was also effective in grayscale. DenseNet achieved the best grayscale accuracy and F1 score of 0.93 on grayscale images, surpassing its first color image accuracy of 0.85 and F1 score of 0.87. Likewise, InceptionV3 achieved high performance for the grayscale images—it achieved an accuracy and an F1 score of 0.93. However, the performance of the original color did not remain that high. While the VGG19 model performed slightly better in grayscale, the VGG16 and VGG19 models demonstrated moderate to lower performance metrics in comparison with other models.
The average epoch time for training these models varied significantly. MobileNet was the most time efficient at 56.6 s for original and 33.29 s for grayscale images, suggesting an advantage in processing speed without sacrificing model accuracy and reliability.
We further analyzed model performance by plotting the training accuracy and loss curves for all models on the training and validation datasets. Figure 3 and Figure 4 show the accuracy and loss progress for each model over the epochs for the original and grayscale images. The VGG models, VGG16 and VGG19, performed the worst across both datasets and showed low stability. MobileNet achieved high accuracy, stability, and minimal divergence, and its learning curves showed a robust and steady learning pattern. Inception V3 performed inconsistently, with noticeable variations in validation accuracy and a high loss in the original dataset. DenseNet showed high accuracy, and it maintained a low and stable loss curve. However, MobileNet had the shortest training time and the most consistent and convergent validation loss and accuracy over epochs. It was chosen for subsequent experiments due to its stable performance, quick training duration, and consistent results.

3.3. MobileNet Augmented Experiments Results

Table 3 shows the numerical evaluation of MobileNet’s performance when training with different types of data enrichment. When trained with non-augmented original data, the model achieved a high accuracy (0.91), precision (0.92), recall (0.90), and F1 score (0.91). When data augmentation was applied to the original color dataset, its accuracy and recall decreased to 0.73 and 0.57, respectively, but its precision stayed high at 0.88. On the contrary, applying targeted data augmentation to the original images led to better performance. The accuracy and F1 score increased to 0.92, which indicates that MobileNet can effectively learn from variations added by targeted data augmentation.
When using original, non-augmented data, MobileNet performed marginally worse on grayscale images. It achieved an accuracy and F1 score of 0.89. When using a dataset with grayscale augmented images, the accuracy decreased to 0.74 and the recall decreased to 0.61. However, applying targeted data augmentation to grayscale images showed superior performance, surpassing all other variations with an accuracy of 0.95, a precision of 1.0, and an F1 score of 0.95. It also generated the lowest test loss at 0.17. These results are supported by the loss metrics in Figure 5, which shows that the model is highly efficient when using that parametric combination.
Figure 5 illustrates how well-targeted data augmentation, particularly in grayscale, performs in terms of accuracy and loss measures. The added variety and complexity that targeted data augmentation to the data brings may be the cause of performance increases. The lack of color depth and variance in the grayscale data could be the reason why the model achieved better results, allowing the model to focus more on the structural features without the distraction of color variations.
Confusion matrices for both the original and grayscale datasets are shown in Figure 6. Their results indicate that while data augmentation is frequently used to reduce overfitting and boost a model’s resilience to fresh data, the efficiency of this approach varies by the task and how it is implemented. When generated properly, targeted data augmentation seems to work especially well for tasks that demand high specificity and sensitivity since they may more accurately represent the key traits of the classes.
With a low initial increase in the false positive rate (FPR) and a large true positive rate (TPR) gain, all receiver operating characteristic (ROC) curves rise quickly from their origin, as seen in Figure 7. This suggests that all configurations of the model perform well on the classification task. All configurations show strong classification abilities, as indicated by curves that consistently stay well above the diagonal line. This suggests that the MobileNet model retains a basic level of efficiency in drought detection, regardless of the data augmentation techniques used and the subtle differences in efficiency these techniques lead to.
The ROC curve of the grayscale targeted augmented dataset, with the highest area under the curve (AUC) at 0.99, is the best performer, indicating that the model with this configuration provides excellent discrimination between the positive and negative classes with minimal error. On the other hand, the curve of the original augmented dataset, with the lowest AUC at 0.90, is the least effective but still shows good performance.
One of the primary concerns in this research was the small size and limited diversity of our dataset, which could impact the model’s ability to adapt to different real-world problems. Even under these challenging conditions, DenseNet, InceptionV3, and MobileNet demonstrated their capability to recognize if the plant is exposing drought stress with an accuracy between 0.85 and 0.93 and an F1 score between 0.87 and 0.93. Our findings reveal that MobileNet provided the most efficient, stable, and reliable performance. DenseNet and InceptionV3 also produced good results but lacked consistency across different data formats and took a longer time to train.
When it comes to the application of data augmentation, it was shown that standard data augmentation did not improve the model’s performance, while targeted data augmentation improved the results. Applying targeted data augmentation on grayscale images proved to be effective, demonstrating improved results, with an F1 score and an accuracy of 0.95 for MobileNet. This can be explained by the fact that this kind of data augmentation addressed the distinctiveness in image characteristics between classes by adding features that were initially absent in drought-stressed classes. These results show that the use of targeted data augmentation can help address the problem of data limitation, which is a significant concern in AI-based agricultural applications. Moreover, we determined that using grayscale images produced better results, especially when combined with targeted data augmentation. This could be due to reduced complexity in the grayscale image data, allowing the model to focus more on the structural features without the distraction of color variations. The results acquired using the proposed methodology are binary, meaning that they indicate whether or not a plant is exposed to drought stress, making them simple for agricultural experts to comprehend. The suggested approach might be used to automatically determine which inbred lines grown under controlled conditions show lower drought tolerance. In that way, the obtained results provide a basis for making informed choices regarding which inbred lines are more resilient and suitable for specific environmental conditions. For more effective management of agricultural resources when it comes to field-grown plants, this information can be crucial when making decisions about the use of irrigation, which is especially important in seed production. This, in consequence, would enable farmers to use this insight to more effectively manage water resources and prioritize care for those lines.

4. Conclusions

The early detection of drought stress in sunflowers is important because it can increase crop yield, which leads to higher food production while preserving water resources. Furthermore, it allows systematical identification of inbred lines with lower drought tolerance under controlled conditions, which can provide detailed insights into the physiological and morphological responses of these lines to drought stress. Therefore, it is important to develop technologies that could automate drought detection, and AI has significant potential to impact the field. In this study, we applied five different CNN TL models to detect drought stress in sunflower images collected from two different sources. MobileNet with targeted data augmentation on grayscale images provided the most promising results, with an accuracy and F1 score of 0.95 for the test data, along with precision and recall values of 1.00 and 0.90, respectively.
The exploration of TL CNN models within our novel pipeline for sunflower drought stress detection has shown promising results. While our study concentrated on using learning models on a small dataset, we believe that a larger and more varied dataset will eventually allow the development of models with even greater accuracy. In addition, it would be interesting to use Generative Adversarial Networks (GANs) for synthetic data generation to enrich and enlarge the dataset. The use of GANs can lead to increased and balanced datasets, further improving the generalizations of the model. Moreover, in future developments, our model’s interpretability can be improved using a technique called Gradient-weighted Class Activation Mapping (Grad-CAM), which shows the areas in sunflower images that influence the model’s predictions. Using this method, agricultural specialists might identify precisely which sunflower parts, such as certain segments of the root or shoot, are important indicators of drought stress. Future advancements may also include remote sensing technology, including field cameras that monitor plant growth and send data to our model in real time, allowing for rapid cultivation responses and immediate decision making related to the water needs of the crops in the field. The use of cutting-edge computer techniques, like DL, will surely be crucial to future studies and applications as agriculture continues to evolve.

Author Contributions

Conceptualization, O.L. and S.C.; methodology, O.L.; software, O.L.; validation, O.L., D.M. and S.C.; formal analysis, O.L.; investigation, O.L. and S.C.; resources, O.L., B.D., S.C., S.J. and D.M.; data curation, O.L. and B.D.; writing—original draft preparation, O.L.; writing—review and editing, O.L., S.C., S.J., B.D. and A.K.; visualization, O.L.; supervision, O.L. and S.C.; project administration, O.L. and S.C.; funding acquisition, O.L., S.C., S.J., D.M., B.D. and A.K. All authors have read and agreed to the published version of the manuscript.

Funding

This research was funded by the Science Fund of the Republic of Serbia through the IDEAS project “Creating climate smart sunflower for future challenges” (SMARTSUN), grant number 7732457. This research was supported by the Ministry of Science, Technological Development, and Innovation (Contract No. 451-03-65/2024-03/200156) and the Faculty of Technical Sciences, University of Novi Sad, by the “Scientific and Artistic Research Work of Researchers in Teaching and Associate Positions at the Faculty of Technical Sciences, University of Novi Sad” project (No. 01-3394/1). S.C., B.D., S.J., and D.M. were also supported by the Centre of Excellence for Innovations in Breeding of Climate-Resilient Crops—Climate Crops of the Institute of Field and Vegetable Crops.

Institutional Review Board Statement

Not applicable.

Informed Consent Statement

Not applicable.

Data Availability Statement

The datasets presented in this article are not readily available because the data are part of an ongoing study. Requests to access the datasets should be directed to the corresponding author.

Conflicts of Interest

The authors declare no conflicts of interest.

References

  1. Agriculture|UN World Water Development Report. 2022. Available online: https://www.unesco.org/reports/wwdr/2022/en/agriculture (accessed on 17 April 2024).
  2. Hussain, M.; Farooq, S.; Hasan, W.; Ul-Allah, S.; Tanveer, M.; Farooq, M.; Nawaz, A. Drought Stress in Sunflower: Physiological Effects and Its Management through Breeding and Agronomic Alternatives. Agric. Water Manag. 2018, 201, 152–166. [Google Scholar] [CrossRef]
  3. Safdar, M.; Shahid, M.A.; Sarwar, A.; Rasul, F.; Majeed, M.D.; Sabir, R.M. Crop Water Stress Detection Using Remote Sensing Techniques. Environ. Sci. Proc. 2023, 25, 20. [Google Scholar] [CrossRef]
  4. Kim, Y.; Evans, R.G.; Iversen, W.M. Remote Sensing and Control of an Irrigation System Using a Distributed Wireless Sensor Network. IEEE Trans. Instrum. Meas. 2008, 57, 1379–1387. [Google Scholar] [CrossRef]
  5. Talaviya, T.; Shah, D.; Patel, N.; Yagnik, H.; Shah, M. Implementation of Artificial Intelligence in Agriculture for Optimisation of Irrigation and Application of Pesticides and Herbicides. Artif. Intell. Agric. 2020, 4, 58–73. [Google Scholar] [CrossRef]
  6. van Klompenburg, T.; Kassahun, A.; Catal, C. Crop Yield Prediction Using Machine Learning: A Systematic Literature Review. Comput. Electron. Agric. 2020, 177, 105709. [Google Scholar] [CrossRef]
  7. Cvejić, S.; Hrnjaković, O.; Jocković, M.; Kupusinac, A.; Doroslovački, K.; Gvozdenac, S.; Jocić, S.; Miladinović, D. Oil Yield Prediction for Sunflower Hybrid Selection Using Different Machine Learning Algorithms. Sci. Rep. 2023, 13, 17611. [Google Scholar] [CrossRef]
  8. Yuan, Y.; Chen, L.; Wu, H.; Li, L. Advanced Agricultural Disease Image Recognition Technologies: A Review. Inf. Process. Agric. 2022, 9, 48–59. [Google Scholar] [CrossRef]
  9. Farooq, M.S.; Riaz, S.; Abid, A.; Umer, T.; Zikria, Y.B. Role of IoT Technology in Agriculture: A Systematic Literature Review. Electronics 2020, 9, 319. [Google Scholar] [CrossRef]
  10. Wolfert, S.; Ge, L.; Verdouw, C.; Bogaardt, M.-J. Big Data in Smart Farming—A Review. Agric. Syst. 2017, 153, 69–80. [Google Scholar] [CrossRef]
  11. Maffezzoli, F.; Ardolino, M.; Bacchetti, A.; Perona, M.; Renga, F. Agriculture 4.0: A Systematic Literature Review on the Paradigm, Technologies and Benefits. Futures 2022, 142, 102998. [Google Scholar] [CrossRef]
  12. Araújo, S.O.; Peres, R.S.; Barata, J.; Lidon, F.; Ramalho, J.C. Characterising the Agriculture 4.0 Landscape—Emerging Trends, Challenges and Opportunities. Agronomy 2021, 11, 667. [Google Scholar] [CrossRef]
  13. de Oliveira, R.C.; Silva, R.D.d.S.e. Artificial Intelligence in Agriculture: Benefits, Challenges, and Trends. Appl. Sci. 2023, 13, 7405. [Google Scholar] [CrossRef]
  14. Chandel, N.S.; Chakraborty, S.K.; Rajwade, Y.A.; Dubey, K.; Tiwari, M.K.; Jat, D. Identifying Crop Water Stress Using Deep Learning Models. Neural Comput. Appl. 2021, 33, 5353–5367. [Google Scholar] [CrossRef]
  15. Barradas, A.; Correia, P.M.P.; Silva, S.; Mariano, P.; Pires, M.C.; Matos, A.R.; Da Silva, A.B.; Marques Da Silva, J. Comparing Machine Learning Methods for Classifying Plant Drought Stress from Leaf Reflectance Spectra in Arabidopsis thaliana. Appl. Sci. 2021, 11, 6392. [Google Scholar] [CrossRef]
  16. Virnodkar, S.S.; Pachghare, V.K.; Patil, V.C.; Jha, S.K. Remote Sensing and Machine Learning for Crop Water Stress Determination in Various Crops: A Critical Review. Precis. Agric. 2020, 21, 1121–1155. [Google Scholar] [CrossRef]
  17. An, J.; Li, W.; Li, M.; Cui, S.; Yue, H. Identification and Classification of Maize Drought Stress Using Deep Convolutional Neural Network. Symmetry 2019, 11, 256. [Google Scholar] [CrossRef]
  18. Al Sahili, Z.; Awad, M. The Power of Transfer Learning in Agricultural Applications: AgriNet. Front. Plant Sci. 2022, 13, 992700. [Google Scholar] [CrossRef]
  19. Halevy, A.; Norvig, P.; Pereira, F. The Unreasonable Effectiveness of Data. IEEE Intell. Syst. 2009, 24, 8–12. [Google Scholar] [CrossRef]
  20. Madsen, S.L.; Mathiassen, S.K.; Dyrmann, M.; Laursen, M.S.; Paz, L.-C.; Jørgensen, R.N. Open Plant Phenotype Database of Common Weeds in Denmark. Remote Sens. 2020, 12, 1246. [Google Scholar] [CrossRef]
  21. Li, W.; Zhang, L.; Wu, C.; Cui, Z.; Niu, C. A New Lightweight Deep Neural Network for Surface Scratch Detection. Int. J. Adv. Manuf. Technol. 2022, 123, 1999–2015. [Google Scholar] [CrossRef]
  22. Thapa, R.; Zhang, K.; Snavely, N.; Belongie, S.; Khan, A. The Plant Pathology Challenge 2020 Data Set to Classify Foliar Disease of Apples. Appl. Plant Sci. 2020, 8, e11390. [Google Scholar] [CrossRef] [PubMed]
  23. Yang, S.; Zheng, L.; Chen, X.; Zabawa, L.; Zhang, M.; Wang, M. Transfer Learning from Synthetic In-Vitro Soybean Pods Dataset for In-Situ Segmentation of On-Branch Soybean Pods. In Proceedings of the 2022 IEEE/CVF Conference on Computer Vision and Pattern Recognition Workshops (CVPRW), New Orleans, LA, USA, 19–20 June 2022; pp. 1666–1675. [Google Scholar]
  24. Kamarudin, M.H.; Ismail, Z.H.; Saidi, N.B. Deep Learning Sensor Fusion in Plant Water Stress Assessment: A Comprehensive Review. Appl. Sci. 2021, 11, 1403. [Google Scholar] [CrossRef]
  25. Škorić, D. Sunflower Breeding for Resistance to Abiotic and Biotic Stresses. In Abiotic and Biotic Stress in Plants—Recent Advances and Future Perspectives; InTech: Vienna, Austria, 2016; ISBN 978-953-51-2250-0. [Google Scholar]
  26. Chollet, F. Keras. 2015. Available online: https://github.com/fchollet/keras (accessed on 27 April 2024).
  27. A Rotation and a Translation Suffice: Fooling CNNs with Simple Transformations. 2017. Available online: https://browse.arxiv.org/pdf/1712.02779v2 (accessed on 22 April 2024).
  28. Shorten, C.; Khoshgoftaar, T.M. A Survey on Image Data Augmentation for Deep Learning. J. Big Data 2019, 6, 60. [Google Scholar] [CrossRef]
  29. Han, J.; Fang, P.; Li, W.; Hong, J.; Armin, M.A.; Reid, I.; Petersson, L.; Li, H. You Only Cut Once: Boosting Data Augmentation with a Single Cut. In Proceedings of the 39th International Conference on Machine Learning, Baltimore, MD, USA, 15 June 2022; pp. 8196–8212. [Google Scholar]
  30. Ben Tamou, A.; Benzinou, A.; Nasreddine, K. Targeted Data Augmentation and Hierarchical Classification with Deep Learning for Fish Species Identification in Underwater Images. J. Imaging 2022, 8, 214. [Google Scholar] [CrossRef] [PubMed]
  31. Deng, J.; Dong, W.; Socher, R.; Li, L.-J.; Li, K.; Fei-Fei, L. ImageNet: A Large-Scale Hierarchical Image Database. In Proceedings of the 2009 IEEE Conference on Computer Vision and Pattern Recognition, Miami, FL, USA, 20–25 June 2009; pp. 248–255. [Google Scholar]
  32. Kamilaris, A.; Prenafeta-Boldú, F.X. A Review of the Use of Convolutional Neural Networks in Agriculture. J. Agric. Sci. 2018, 156, 312–322. [Google Scholar] [CrossRef]
  33. Alfarhood, S.; Alrayeh, A.; Safran, M.; Alfarhood, M.; Che, D. Image-Based Arabian Camel Breed Classification Using Transfer Learning on CNNs. Appl. Sci. 2023, 13, 8192. [Google Scholar] [CrossRef]
  34. TensorFlow Hub. Available online: https://www.tensorflow.org/hub (accessed on 26 April 2024).
  35. Hinton, G.E.; Srivastava, N.; Krizhevsky, A.; Sutskever, I.; Salakhutdinov, R.R. Improving Neural Networks by Preventing Co-Adaptation of Feature Detectors. arXiv 2012, arXiv:1207.0580. [Google Scholar]
  36. Miao, J.; Zhu, W. Precision–Recall Curve (PRC) Classification Trees. Evol. Intell. 2022, 15, 1545–1569. [Google Scholar] [CrossRef]
  37. Riyanto, S.; Sitanggang, I.S.; Djatna, T.; Atikah, T.D. Comparative Analysis Using Various Performance Metrics in Imbalanced Data for Multi-Class Text Classification. Int. J. Adv. Comput. Sci. Appl. 2023, 14, 1082–1090. [Google Scholar] [CrossRef]
  38. Gao, Z.; Luo, Z.; Zhang, W.; Lv, Z.; Xu, Y. Deep Learning Application in Plant Stress Imaging: A Review. AgriEngineering 2020, 2, 430–446. [Google Scholar] [CrossRef]
  39. Zubler, A.V.; Yoon, J.-Y. Proximal Methods for Plant Stress Detection Using Optical Sensors and Machine Learning. Biosensors 2020, 10, 193. [Google Scholar] [CrossRef] [PubMed]
Figure 1. Pipeline framework of the proposed methodology for sunflower drought stress detection.
Applsci 14 06034 g001
Figure 2. Representative dataset images: (a) rhizotron image of sunflower roots; (b) scanned root parts; (c) scanned shoot parts.
Applsci 14 06034 g002
Figure 3. The accuracy and loss curves for all models on training and validation—original data.
Applsci 14 06034 g003
Figure 4. The accuracy and loss curves for all models on training and validation—grayscale data.
Applsci 14 06034 g004
Figure 5. The accuracy and loss curves for all MobileNet configurations on training and validation data.
Applsci 14 06034 g005
Figure 6. Confusion matrix for MobileNet configurations on the test data: (a) original non-augmented data; (b) original standard augmentation; (c) original targeted augmentation; (d) grayscale non-augmented data; (e) grayscale standard augmentation; (f) grayscale targeted augmentation.
Applsci 14 06034 g006aApplsci 14 06034 g006b
Figure 7. Receiver operating characteristic (ROC) curve for MobileNet configurations: (a) original non-augmented data; (b) original standard augmentation; (c) original targeted augmentation; (d) grayscale non-augmented data; (e) grayscale standard augmentation; (f) grayscale targeted augmentation.
Applsci 14 06034 g007
Table 1. The optimal number of epochs and learning rate for the used models.
CNN ModelNumber of EpochsLearning Rate
VGG16500.00001
VGG19300.0001
DenseNet300.0001
Inception V3300.0001
MobileNet300.0001
Table 2. Comparison of performances for all models (the best values for each metric are bolded).
CNN ModelColorAccuracyPrecisionRecallF1 ScoreTest LossAverage Epoch Time (s)
VGG16Original0.820.810.860.840.82250.81
Grayscale0.650.620.840.720.65233.69
VGG19Original0.660.910.390.550.66306.31
Grayscale0.670.810.490.610.67282.62
DenseNetOriginal0.850.781.000.870.85103.00
Grayscale0.930.980.880.930.9390.91
Inception V3Original0.850.781.000.871.6169.16
Grayscale0.930.940.920.930.1351.28
MobileNetOriginal0.910.920.900.910.1956.60
Grayscale0.890.880.900.890.2233.29
Table 3. MobileNet performances on different color and data enrichment combinations (the best values for each metric are bolded).
ColorData AugmentationAccuracyPrecisionRecallF1 ScoreTest Loss
OriginalWithout augmentation0.910.920.90 0.910.19
Standard augmentation0.730.880.570.690.58
Targeted augmentation0.920.980.860.920.21
GrayscaleWithout augmentation0.890.880.90 0.890.22
Standard augmentation0.740.860.610.710.47
Targeted augmentation0.951.000.900.950.17
Disclaimer/Publisher’s Note: The statements, opinions and data contained in all publications are solely those of the individual author(s) and contributor(s) and not of MDPI and/or the editor(s). MDPI and/or the editor(s) disclaim responsibility for any injury to people or property resulting from any ideas, methods, instructions or products referred to in the content.

