Abstract
In recent years, urban rail transportation has rapidly developed in China and become one of the most important modes of travel. Most existing studies on the dynamic characteristics of urban rail trains have been based on single-section trains, and there have been fewer studies on marshaling urban rail trains that incorporate traction transmission systems. The dynamic performance of each carriage directly affects the operational reliability and even the running safety of urban rail trains. For this reason, in this paper, a marshaling urban rail train model with a traction transmission system was established and its accuracy was validated by field tests. This dynamics model enables the consideration of the coupling interactions between the gear transmission motion, the vertical, the lateral and the longitudinal motions of the vehicle. First, the model accuracy was validated by field tests. Then, the relationship between the motor torque and the running time of the urban rail train under traction conditions was calculated. Finally, the dynamic performance of each car of the marshaling train was studied. The research results show that there is a clear difference between the dynamics of the motor car and the trailer, and that the motor car is significantly inferior to the trailer. Among the four motor cars, the dynamic performances of the first and last moving cars were worse than those of the other motor cars. Among the two trailers, the trailer at the back was worse than the trailer at the front. The traction transmission system has a greater impact on the vertical and lateral vibration of the train bogie frame and wheelset, but the impact on the vibration of the car body is negligible. This paper provides theoretical support for the research one train dynamic performance optimization and operation safety.
1. Introduction
In China, with the rapid development of cities, urban rail transit has increasingly become the first choice for people to travel. Compared with other modes of transportation, urban rail transit has the advantages of being economic, safe, convenient, environmentally friendly, highly efficient and able to fundamentally improve the development of public transportation in the process of urban development. In the actual operation process of urban rail trains, they will experience rapid and frequent traction and braking, and each motor car and trailer will be subject to different degrees of shock and vibration. The above phenomenon occurs between different cars will directly affect the operational safety of urban rail trains, as well as their stability and stability. Therefore, it is particularly important that a multicar marshaling model of urban rail trains is established, considering the interaction between the carriages and the traction transmission system, and to analyze its dynamic characteristics.
For a long time, the operational safety problems caused by the dynamic characteristics of urban rail vehicles have attracted extensive attention from scholars. Alexander et al. [1] established a fine finite element model of the car body and the bogie system and studied and analyzed the vibration transmission path of the bogie structure caused by the excitation of the wheel and rail. Simson et al. [2] studied the three-axle bogie locomotive, and the bending performance of the bogie under different track excitations is compared and analyzed. Ribeiro et al. [3] conducted modal test analysis on the closing part of the high-speed train bogie by the modal test method and corrected the finite element model according to the analysis results. Wang et al. [4] studied the time domain response reconstruction method based on using the wavelet transform to obtain the responses of multiple positions, and the vibration transmission paths between the train bogie and the car body are sorted. Ling et al. [5] studied the influence of rail corrugation on the vibration of subway bogies and proposed measures to reduce the vibration of subway bogies and reduce the failure rate of primary suspension springs, which provided a basis for the development of new subway bogies and track maintenance. The traction transmission system plays the role of transmitting force and motion in urban rail trains, and its dynamic performance has a significant impact on the stability and safety of train operations. Traction transmission failures can even lead to catastrophic consequences such as derailment or train collisions. Yang et al. [6,7] researched the time-domain and time–frequency domain responses of the gear system of a vehicle with the wheel flat under variable speed conditions, and the influence of wear parameters on the nonlinear dynamics of gear systems. Wang et al. [8] presented a novel analytical model of TVMS for profile-shifted spur gears, and carried out numerical simulations to analyze the individual and compound shifts. Wang et al. [9] established a gear system model of a railway vehicle, which they proposed in consideration of its time-varying mesh stiffness, nonlinear backlash, transmission error, time-varying external excitation and rail irregularity to investigate the nonlinear dynamics of a time-varying gear system. Wang et al. [10] studied the inner/outer races failure mechanism of axle box bearing. Zhang et al. [11] studied the dynamic responses of the electromechanical coupling model under variable conditions, and the dynamic characteristics of the traction motor were revealed by numerical analysis. Li et al. [12] studied the contribution of each vibration path of the gearbox, determined that the right bearing of the gearbox was the main transmission path of vibration through vibration tests and obtained the transmission law of the vibration transmission path of the gearbox. Zhang et al. [13] established a dynamic model considering the traction motor and gearbox. By comparing the simulation results with the experimental results in the time domain and time–frequency domain and analyzing the gear meshing force and wheel–rail force, it was found that compared with the wheelset, the gear meshing force has a greater impact on the dynamics of the traction motor and gearbox. Wang et al. [14] established the vehicle dynamics model that integrated the flexible gearbox housing, time-varying mesh stiffness and nonlinear gear backlash. The effect of wheel out-of-roundness on the dynamic response of the traction transmission system was studied, and the results show that wheel wear can cause the severe and complex torsional vibration of the gear drive system. Chen et al. [15,16,17] embedded the gear transmission system into the vehicle–track coupling model and considered complex excitations such as gear time-varying mesh stiffness, nonlinear backlash, nonlinear wheel–rail normal contact force and creep force. The vibration responses of the train and gear transmission system under braking conditions were in good agreement with the actual line test results. Zhang et al. [18] established a vehicle-track coupling model and compared and analyzed the models considering and not considering the gear transmission system. The gear system adopts spur gears and verifies the vertical and longitudinal vibration of the gear transmission system to the wheelset and traction motor. There is an obvious effect, but the effect on the lateral vibration of the bogie frame is not obvious. Wang et al. [19] conducted a non-smooth dynamic analysis of the wheelset system. The relationship between the time–frequency dynamic characteristics, slip velocity and nonlinear interaction force between the wheel and rail was studied. Zhou et al. [20,21] established an electromechanical coupling model and verified that the electromechanical coupling effect can be applied to monitor the faults of rotating components in the transmission path of the train transmission system. In addition to heavy-duty locomotives, Wang et al. [22] conducted similar research in the field of high-speed EMUs. Zhang et al. [23] established fully translational and fully rotational vehicle–track coupling models, studied the gear vibration mechanism through the time–frequency analysis method and analyzed the composition of the frequency band components considering gear excitation. Wang et al. [24] established a plane vibration model of the train gear system considering the effect of adhesion and studied the bifurcation characteristics of the gear system at different speeds. Huang et al. [25] established the torsional vibration model of a high-speed train gear system and studied the superharmonic resonance problem and the Hopf bifurcation problem of the system by a semi-analytical method. Kia et al. [26] conducted experiments on a train traction system and found that the vibration characteristics of the traction motor, bearing and gearbox have a significant impact on the motor current. Huang et al. [27] established a high-speed train dynamics model based on the SIMPACK software. The research results show that gear meshing excitation has a significant impact on motor vibration. The running stability and safety of trains are also important research directions. Based on the flexible vehicle–track coupled dynamic model, Chen et al. [28] studied the ride comfort on the straight lines and curves under different excitations, as well as the vibration of the car body at different positions found that the riding comfort is very sensitive to longwave excitation but not to shortwave excitation, and it is not sufficiently accurate to evaluate the ride comfort of subway vehicles only based on the vibration of the center of the floor. Pradhan et al. [29] established a train dynamics model based on the ADAMS VI-Rail software, which included the first five modes of the car body, and studied the comfort of the train.
In addition, the single vehicle model cannot accurately reflect the dynamic characteristics of the train system, and therefore, Belforte et al. [30] established a numerical calculation method for studying the dynamics of heavy freight trains, and the influence of train composition on the operational safety was demonstrated through numerical analysis. Tao et al. [31] established a vehicle–track rigid-flexible coupling dynamic model considering two carriages, studied the influence of wheel–rail interaction caused by the out-of-roundness of the wheel of one wheelset on the wheel–rail interaction of the other seven wheelsets, and found that the wheel–rail interaction dynamic interactions can be transferred from an out-of-round wheelset to another wheelset of the same bogie via the rails. However, more research has focused on the coupler. Wu et al. [32] established a train model consisting of two eight-axle trains and one simplified carriage, and analyzed the working principles and differences between the two coupler systems. Ding et al. [33] established a nonlinear finite element model of the collision between the train and the detailed coupler and studied the collision characteristics of the coupler under different working conditions. Yadav et al. [34] established a simplified and degree-of-freedom model of the coupler to study the effect of the coupler clearance on the longitudinal dynamics of the train. Zou et al. [35] established different marshaling train models, compared the longitudinal dynamic characteristics of the train under different rescue conditions, and analyzed the effect of the longitudinal impulse on the coupler and vehicle dynamic performance. However, the influence of the traction transmission system on the dynamic characteristics of marshaling trains is still unclear at present, so it is difficult to obtain a more accurate dynamic response of marshaling trains under variable speed conditions, and it is difficult to provide an effective reference for traffic safety, optimal design and fault diagnosis.
As a result, in this paper, on the basis of considering the traction transmission, the dynamic model of the marshaling urban rail train is established, and the dynamic characteristics of each carriage under the traction conditions of the train are studied. The specific research contents are as follows: Section 2 introduces the dynamic model of the marshaling urban rail train. Section 3 validates the model. Section 4 analyzes and discusses the dynamic characteristics. Section 5 summarizes the full text.
2. Dynamic Modeling
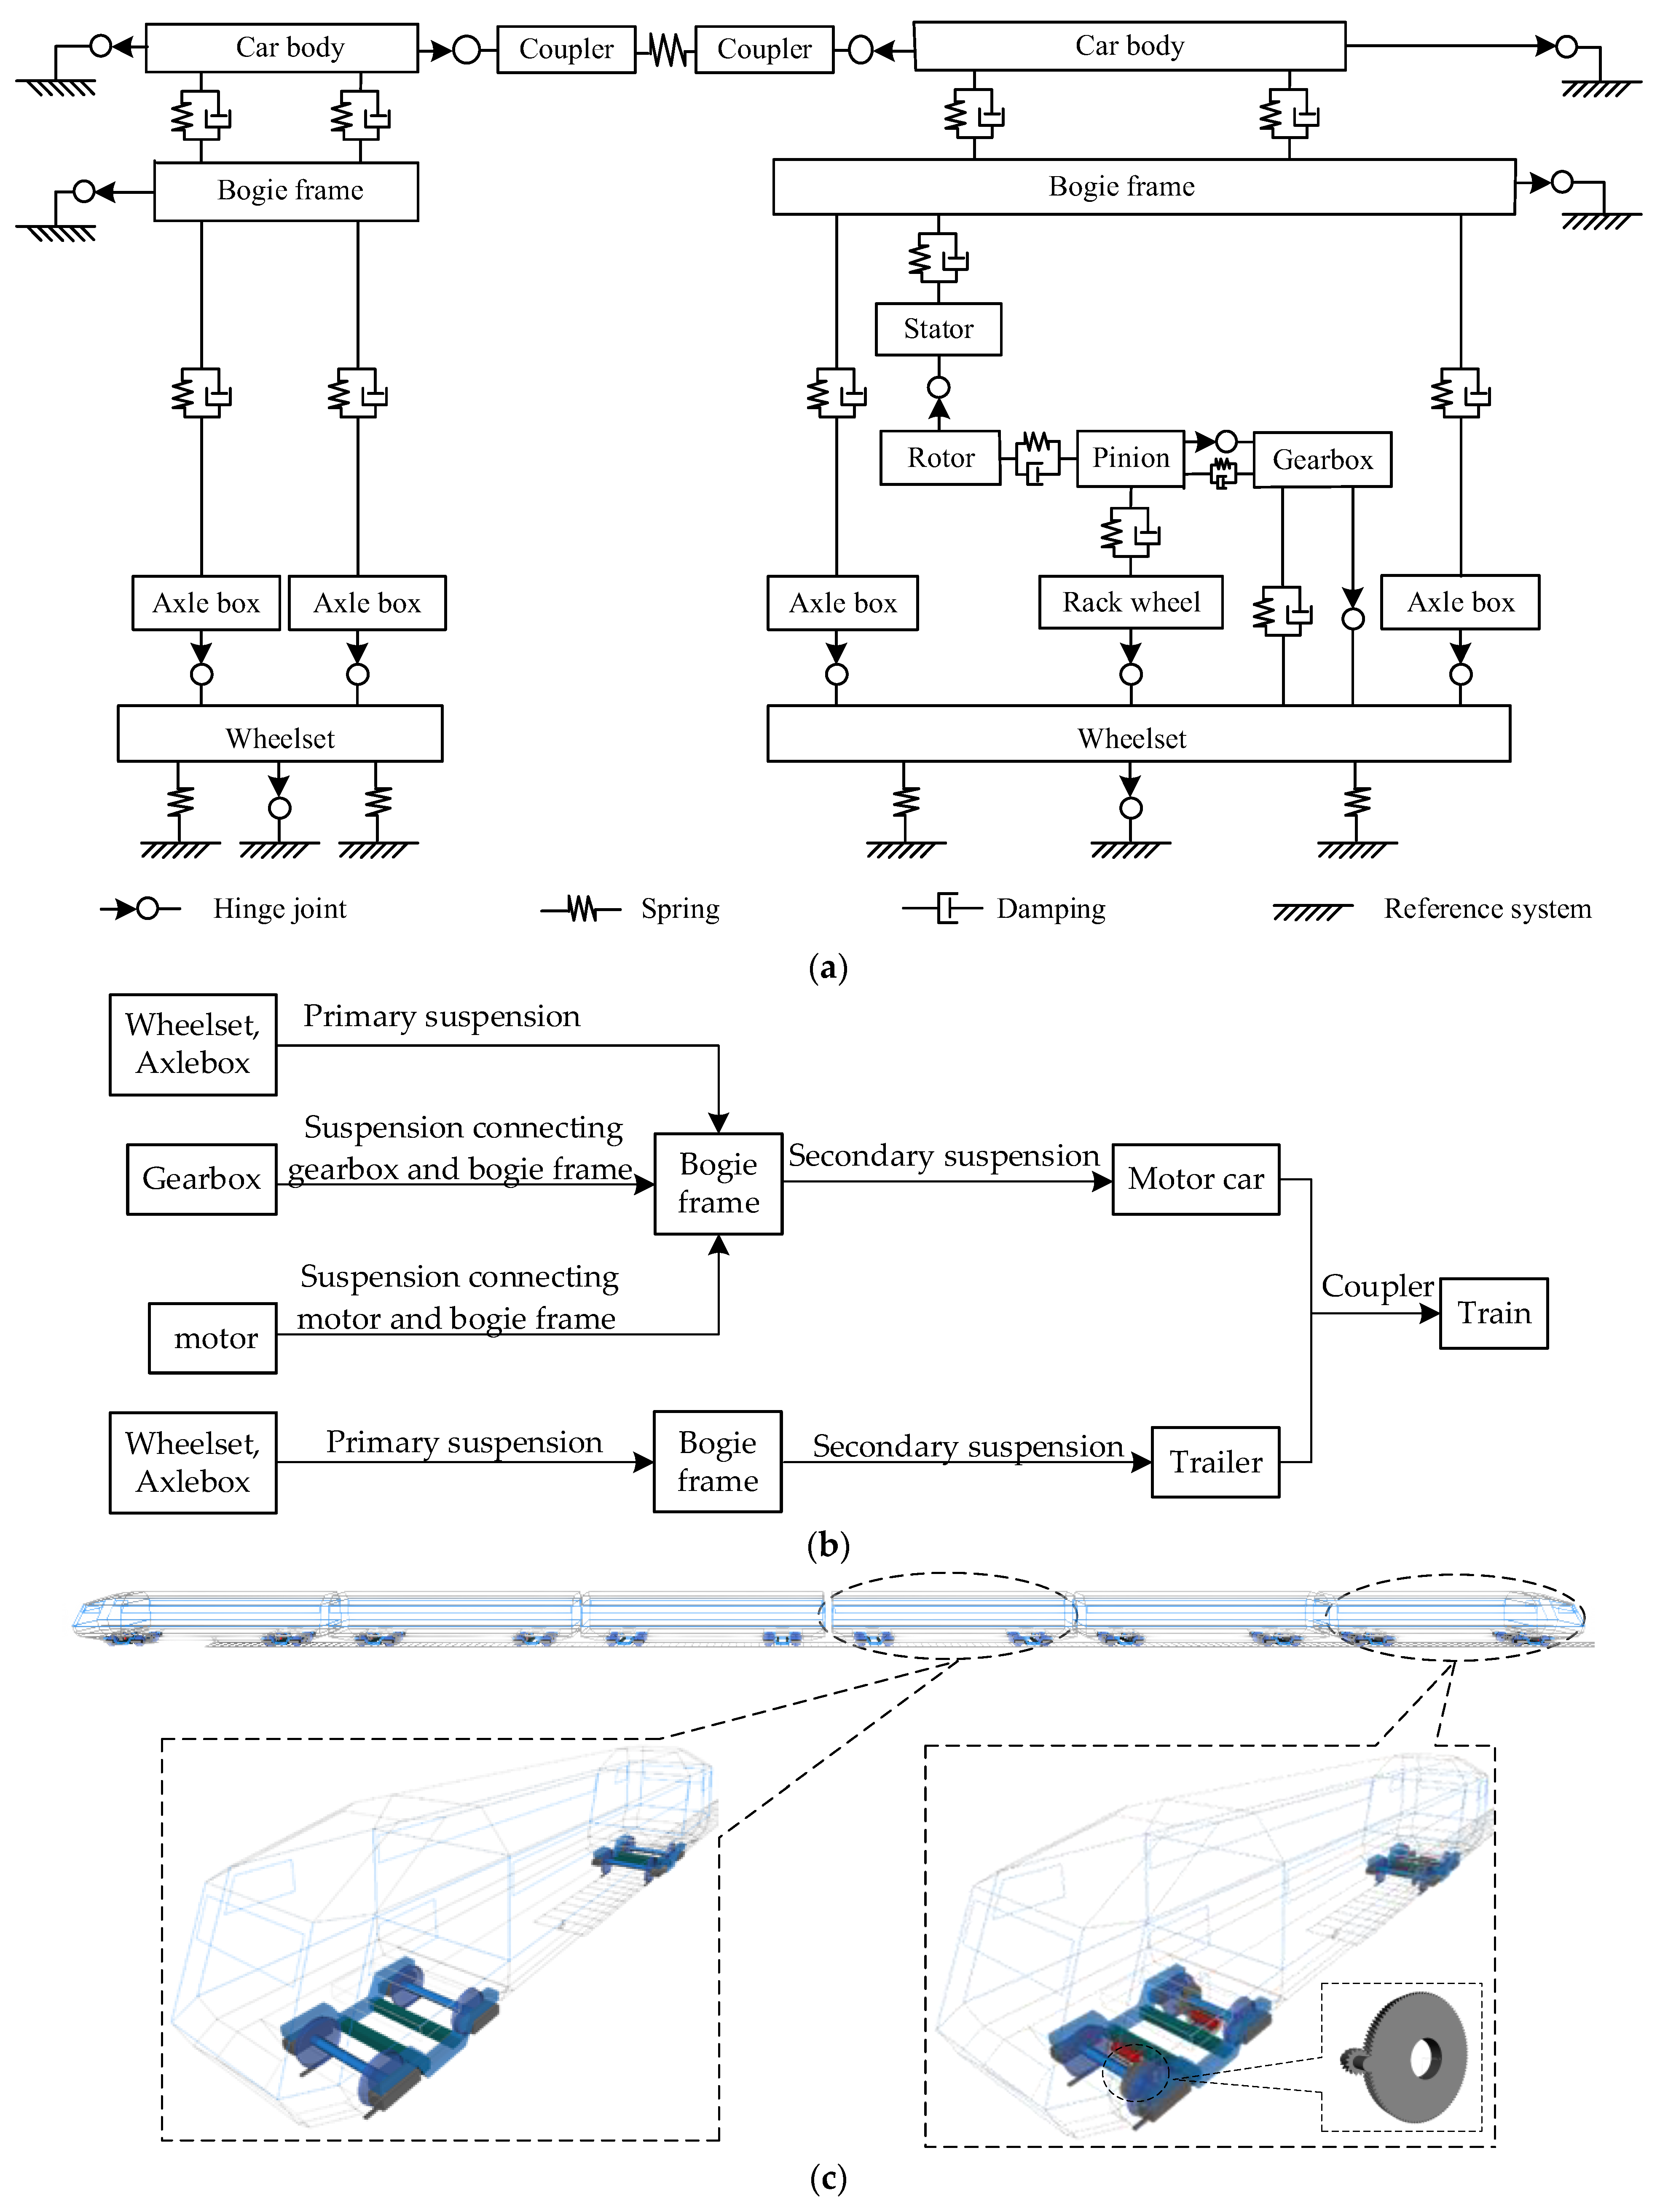
One effective means of solving the dynamics problem of a complex mechanical system is to establish its physical model and analyze it. In this paper, the dynamic model of a domestic urban rail train is established by the SIMPACK software. The train adopts the form of six carriages, and the traction transmission system is considered. Figure 1a shows the connection mode and structural characteristics of the various components of the train. When building this model, all parts were treated as rigid bodies. Figure 1b shows the modeling process.
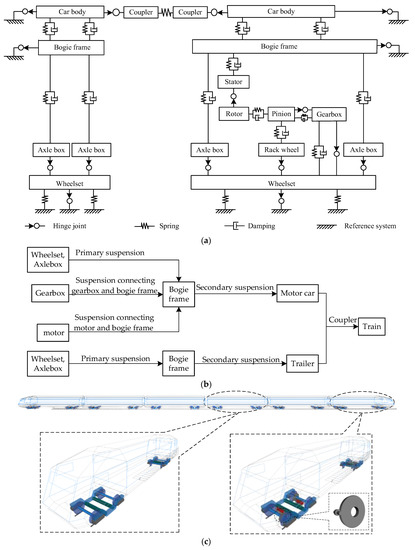
Figure 1.
Marshaling urban rail train dynamics model with the traction transmission system: (a) Topology model of the urban rail train; (b) The modeling flow chart of the marshaling urban rail train; (c) The marshaling urban rail train dynamics model.
The trailer model consists of four wheelsets, eight axle boxes, two bogie frames and a car body. The wheelset is connected to the bogie frame through the primary suspension and then connected to the car body through the secondary suspension. The primary suspension and the secondary suspension were represented by springs and dampers in the model. Some parameters of the trailer are shown in Table 1.

Table 1.
Main parameters of the urban rail train dynamics model.
The motor car model including four wheelsets, eight axle boxes, four gearboxes, four traction motors, two bogie frames and a car body. Compared with the trailer, the motor car has added a traction transmission system. The traction transmission system is composed of a traction motor, gearwheel, pinion and gearbox casing. The traction torque is first transmitted to the pinion through coupling and then transmitted to the gear through the meshing of the gearwheel. When establishing the gear system, the meshing of the gearwheel and the pinion is defined by force element No. 225, which can accurately describe the Young’s modulus, Poisson’s ratio and damping coefficient of the gear pair and establish the profile parameters. The geometric characteristic parameters are shown in Table 2. The traction motor consists of a stator and a rotor. The stator model is first established and connected to the bogie frame through the motor hanger. The rotor is then modeled and hinged to the stator. After that, the rotor is connected with the pinion through the coupling. The coupling is defined by force element No. 43, and reasonable stiffness and damping are set to ensure the torque transmission function of the coupling. The construction of the other parts of the motor car is the same as that of the trailer, and some parameters of the motor car are shown in Table 1.

Table 2.
Main parameters of gear model.
The marshaling train model is shown in Figure 1c, which adopts the marshaling form of “four motor cars + two trailers”: M1–M2–T1–T2–M3–M4 (where M1, M2, M3 and M4 are motor cars and T1 and T2 are trailers). Here, the x axis is longitudinal, the y axis is lateral and the z axis is vertical. Each car is connected by a coupler, and the coupler is defined by force element No. 4.
3. Model Validation
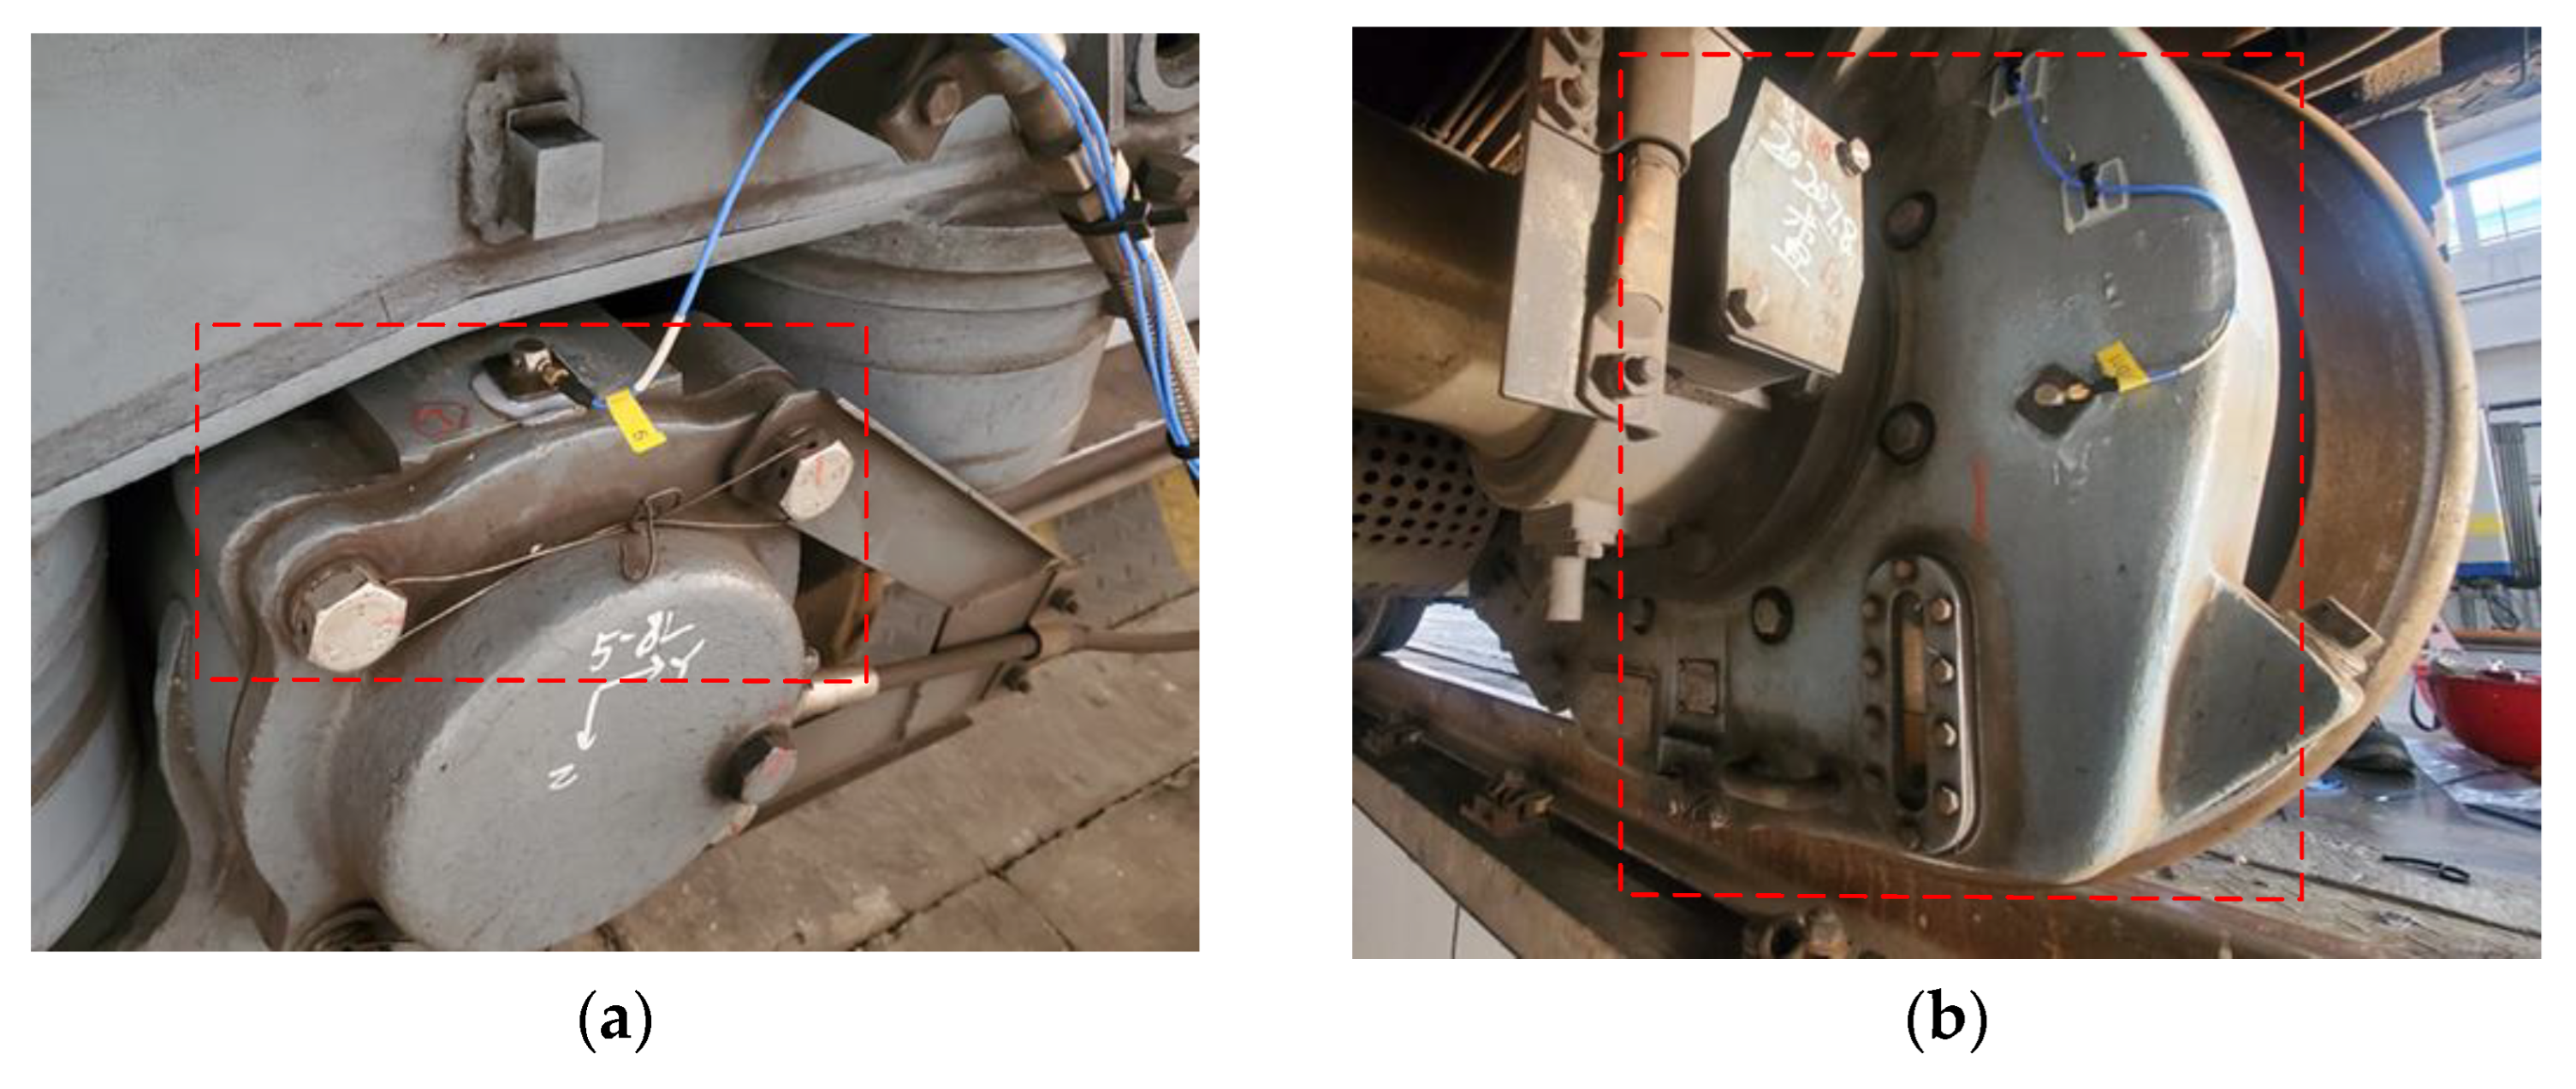
To verify the accuracy and reliability of the urban rail train dynamic model, the measured tracking data and simulation data of a subway line in Beijing were used for comparative analysis, mainly to compare the vertical acceleration of the axle box and the gearbox box. In the actual test train, the fourth vehicle was selected as the test vehicle, the acceleration sensor was arranged on the axle box and the gearbox box for the tracking test, and the acceleration data of the corresponding components were obtained. The sensor uses a three-axis vibration acceleration sensor and the principle is piezoelectric. The gear box uses a vibration acceleration sensor with a range of 500 g, and the axle box uses a vibration acceleration sensor with a range of 50 g. The location of the sensor is above the axle box and to the left of the gear box case. The direction of the sensor: x axis is longitudinal, y axis is transverse and z axis is vertical. The sampling frequency is 10 K Hz. The scene photo is shown in Figure 2.
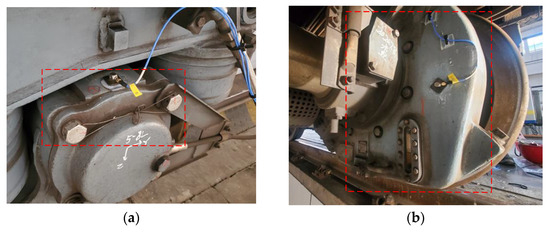
Figure 2.
Sensor layout in the field test. (a) Layout of sensors on axle box, and the red circle indicates that the axle box; (b) Layout of sensors on gearbox, and the red circle indicates that the gearbox.
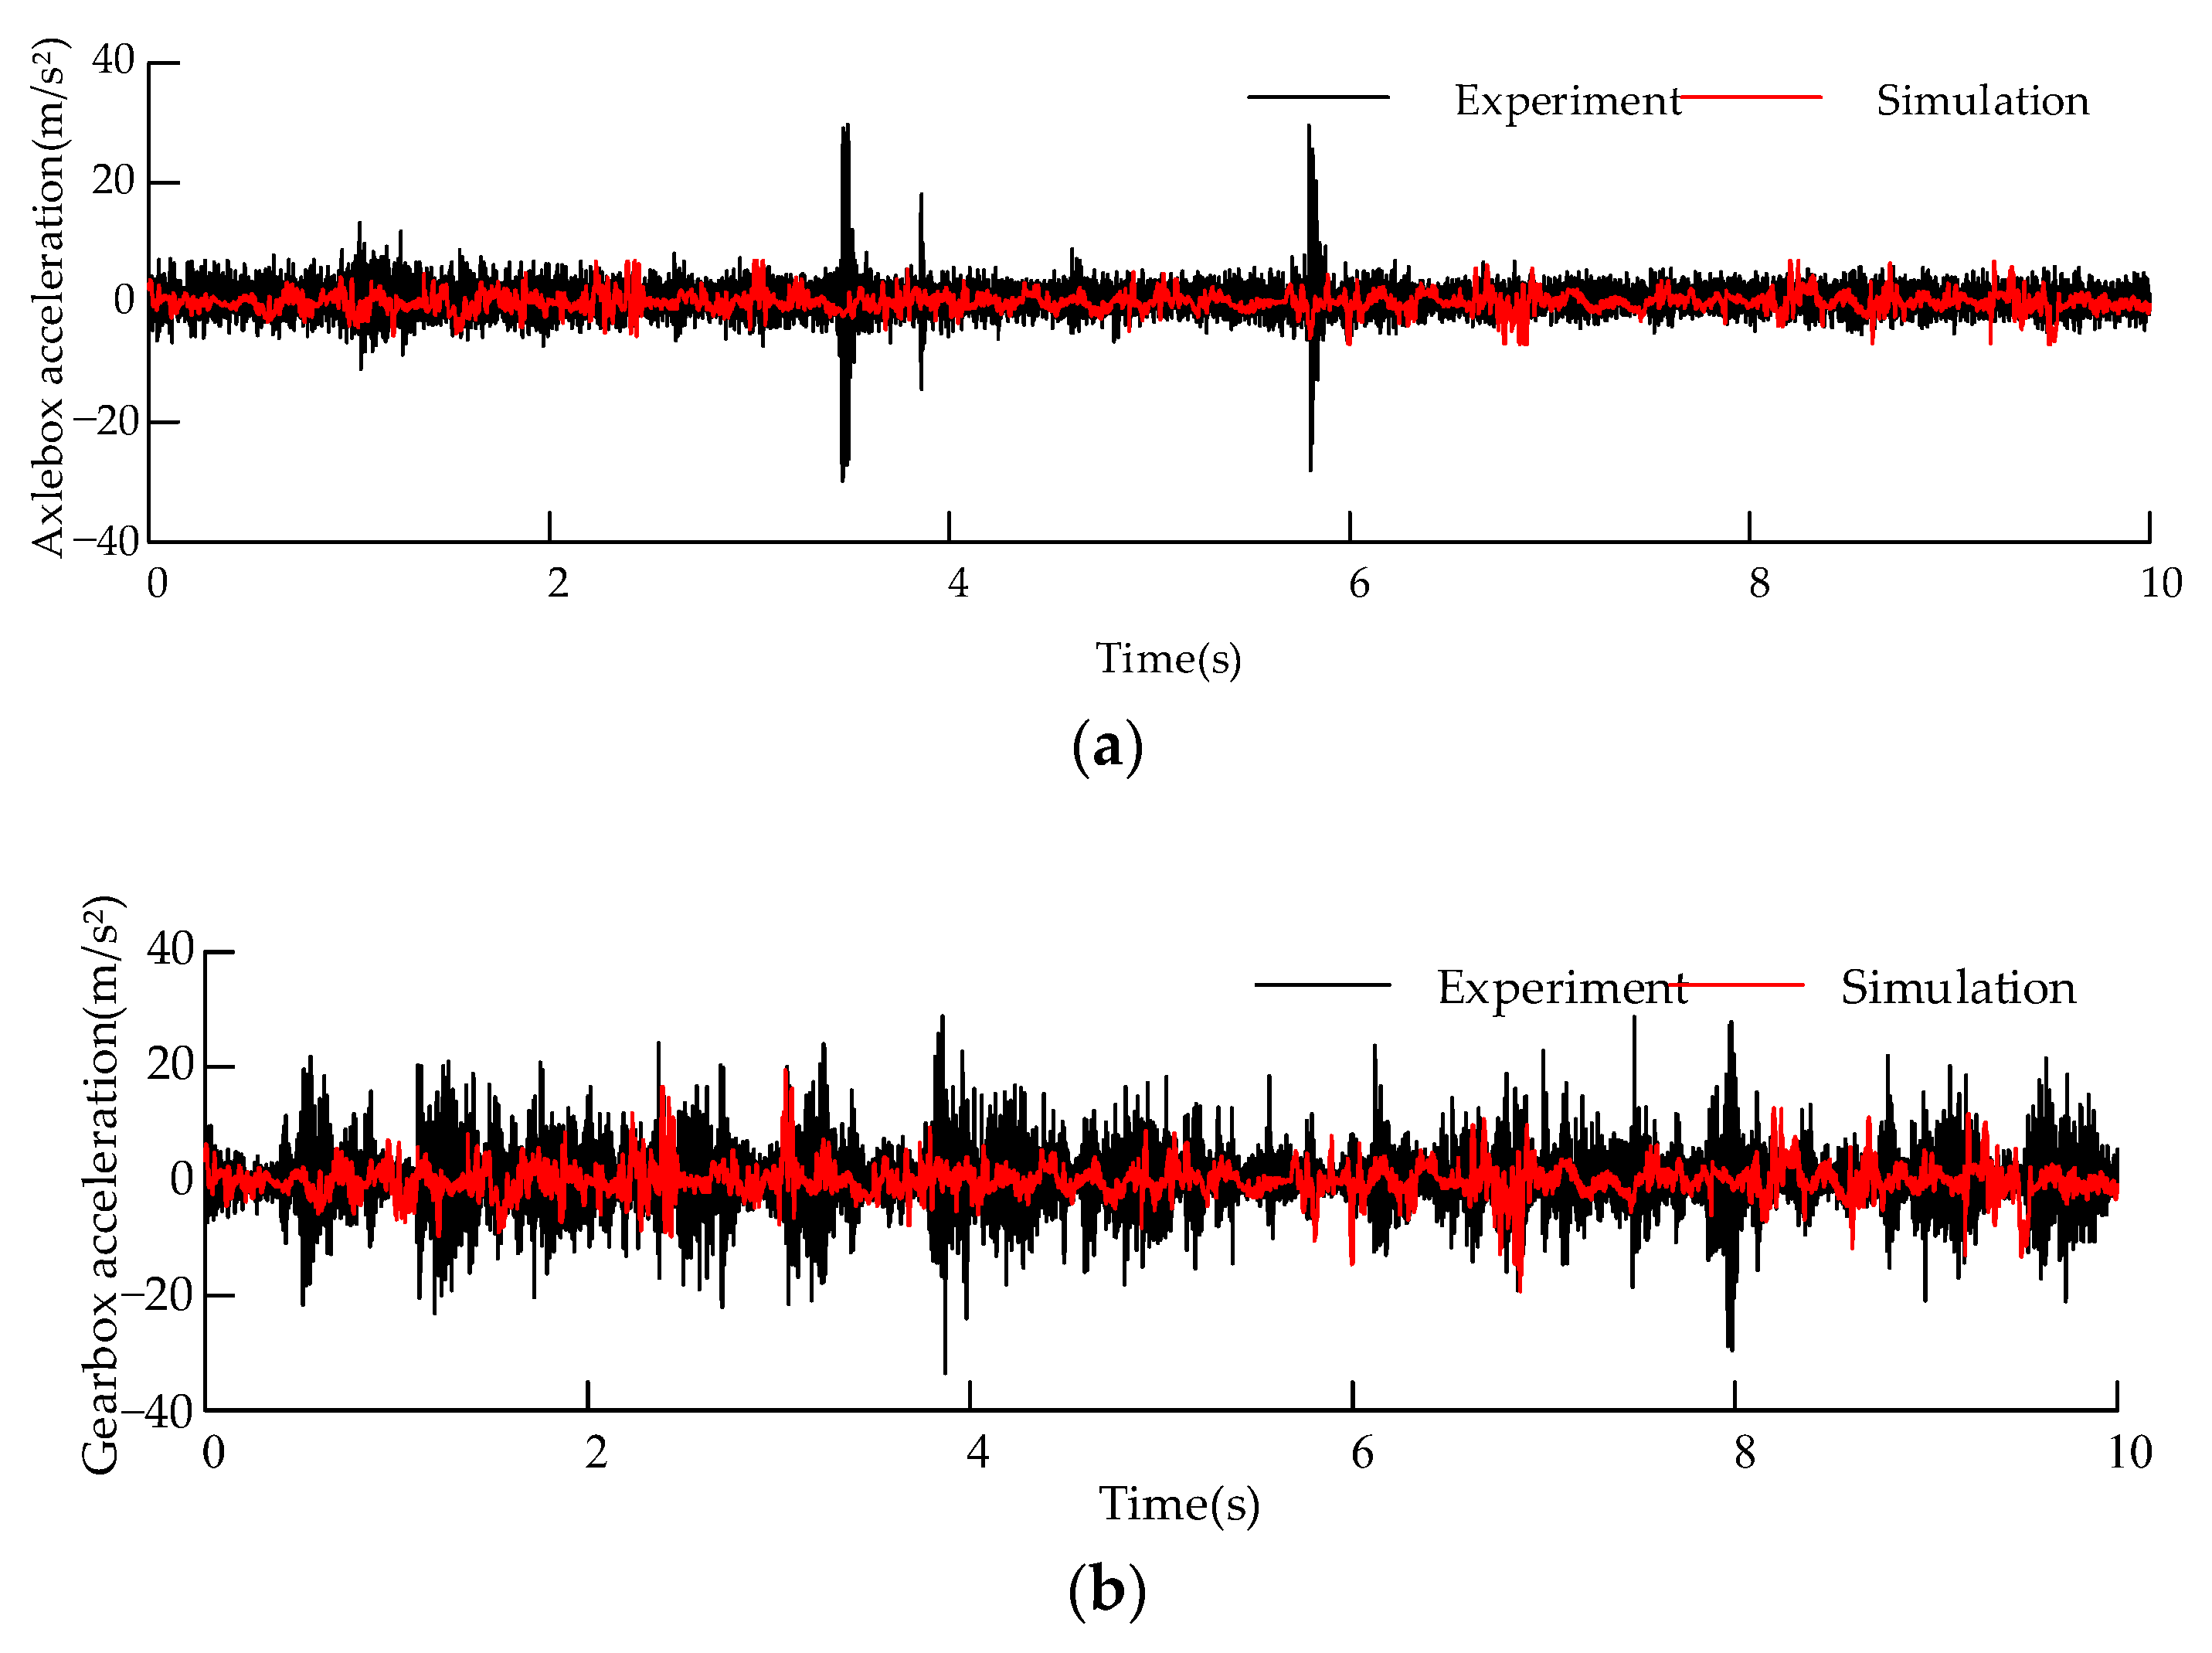
Compared with the actual operating conditions of urban rail trains, the simulated train parameters have certain differences which have a certain impact on the simulation results. The simulation model uses the measured track spectrum of a line in Beijing as the track excitation. The train simulation data and measured data are shown in Figure 3. Because the working conditions of urban rail trains in actual operation are very complex, they will experience continuous acceleration, coasting and braking, and will continue to pass through curves and turnouts, and the measured map will have a larger rail impact. Therefore, the axle box, as the component with the closest contact distance with the wheel and rail, has the most obvious impact on the rail in the measured data. Since this situation is not considered in the simulation model, the overall vibration acceleration of the simulation model is smaller than the measured data. In this paper, the actual acquired vibration signals are low-pass filtered using a digital filter to filter out the high-frequency noise signals in the acquisition process. The comparison between the vertical dynamics simulation data of the urban rail train and the measured data is shown in the figure. Although there is a certain difference between the simulation data and the test data, the overall vibration characteristics are in good agreement with the measured data, so the established simulation model is more reasonable.
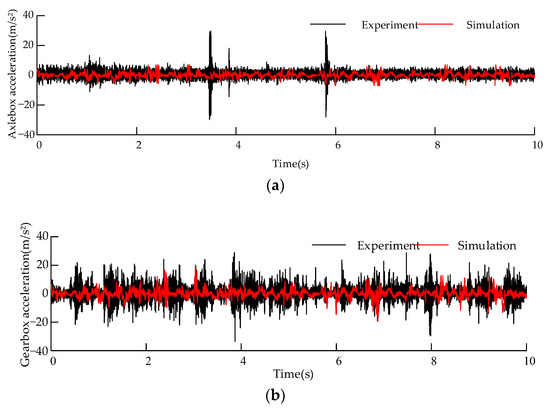
Figure 3.
Comparison of the experimental data and simulation data in the vertical direction: the time series (a) on the axle box and (b) gearbox.
4. Analysis and Discussion
The working conditions studied in this paper adopt the linear traction working conditions, and the track spectrum is based on the measured data of a line in Beijing, the time is 40 s and the sampling frequency is 5000 Hz.
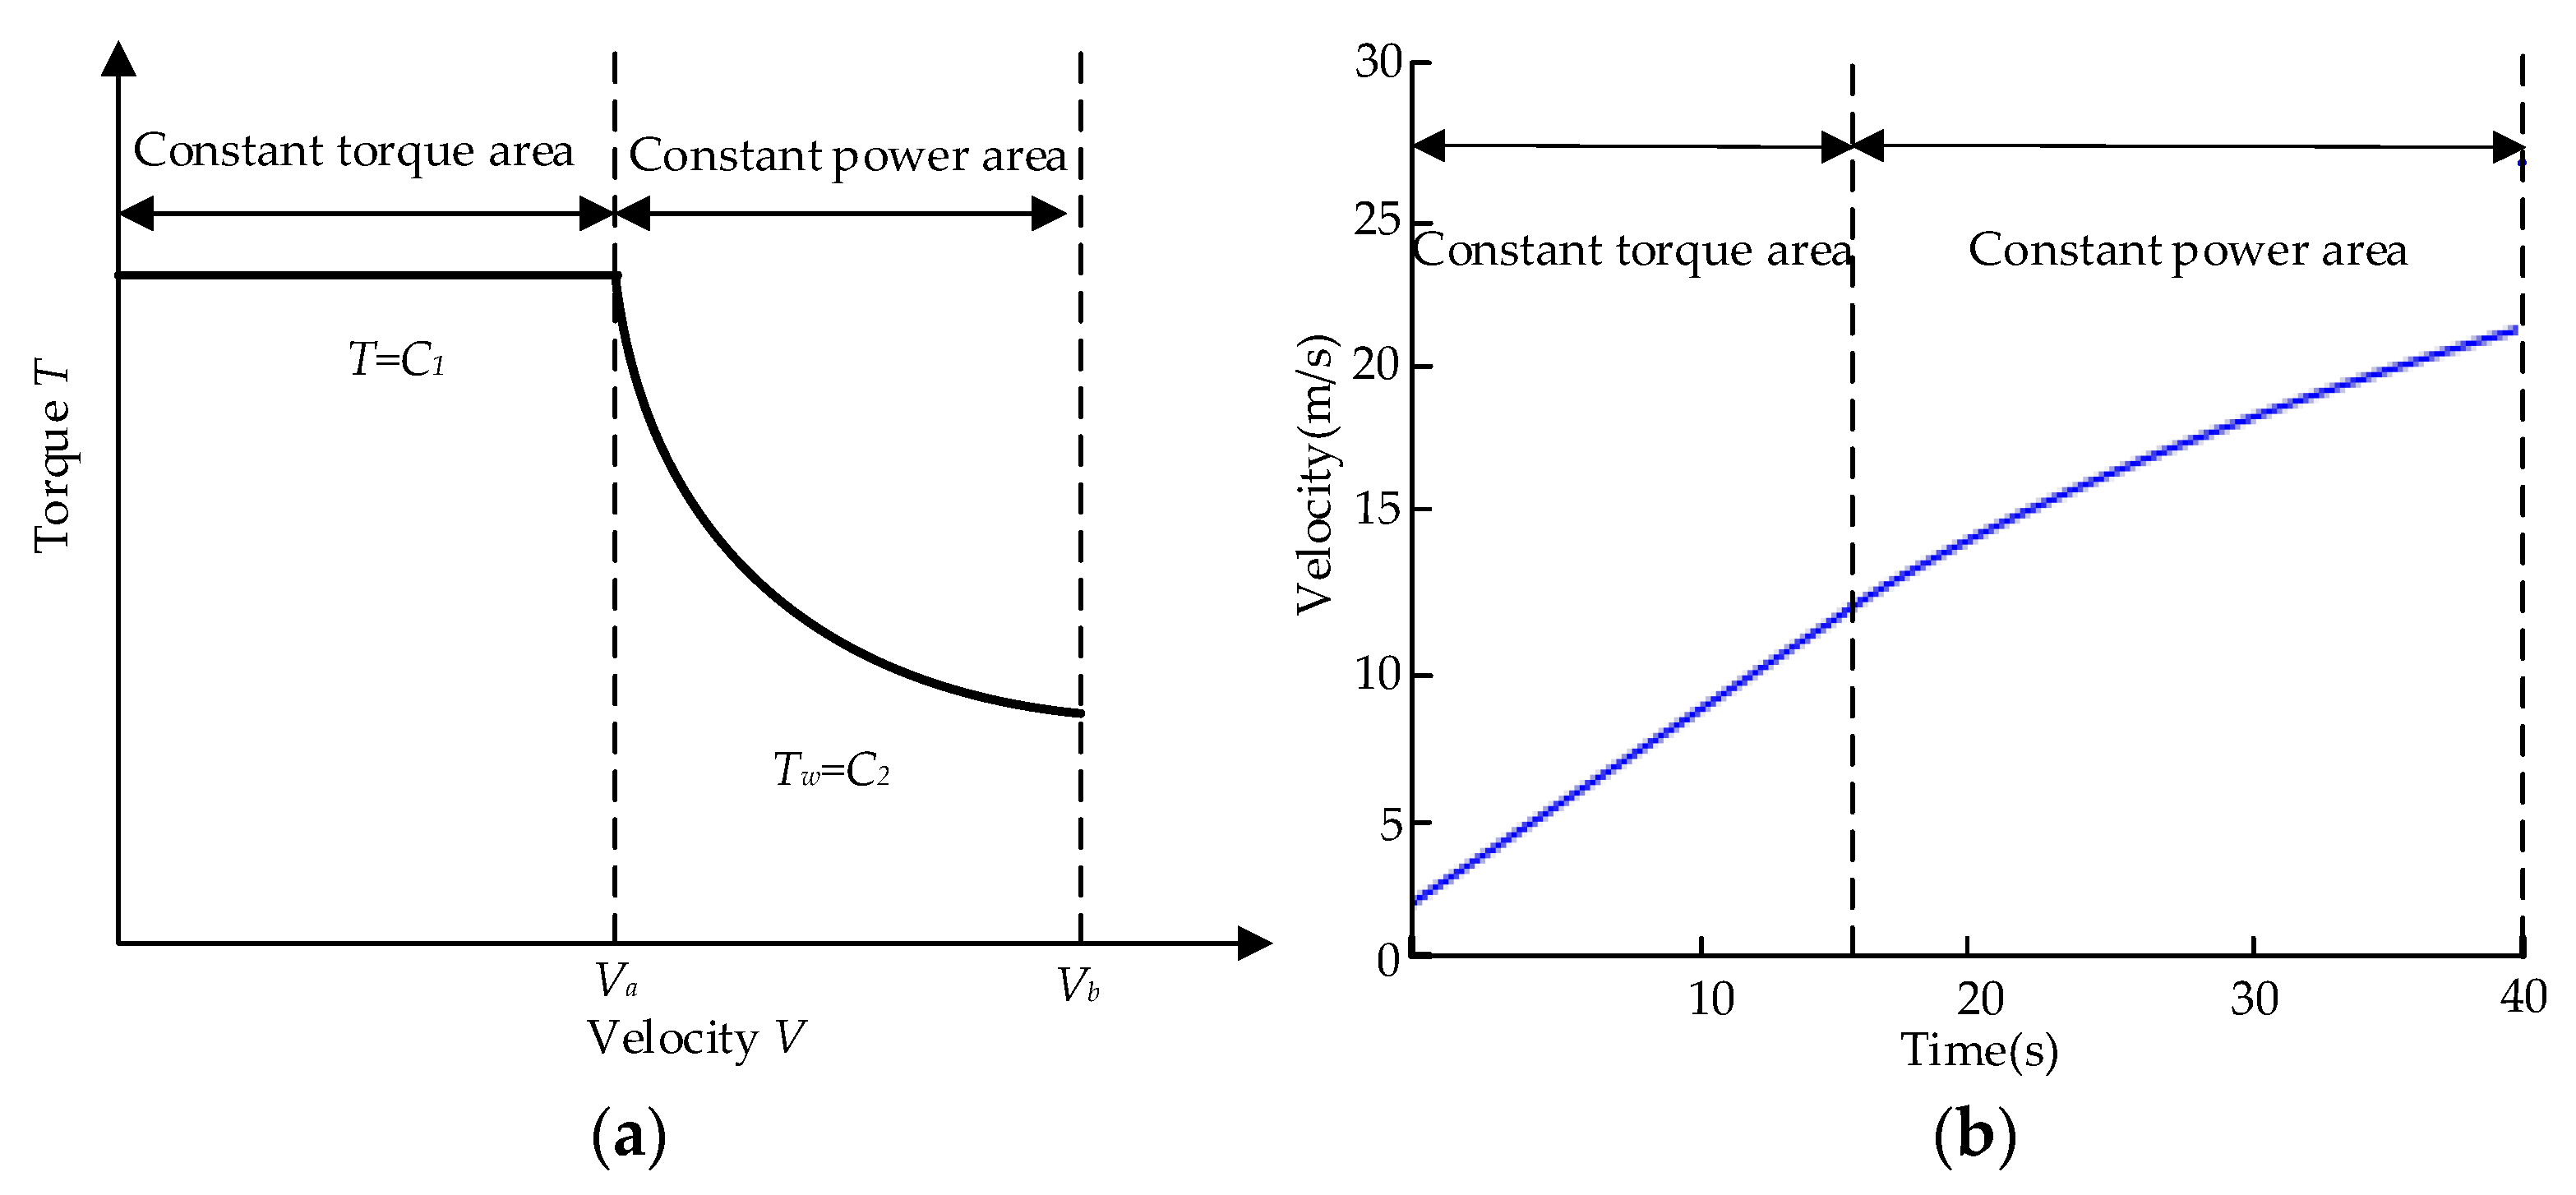
The traction motor of an urban rail train adopts an AC asynchronous motor, and the working speed range of the motor is divided into two parts: a constant torque area and a constant power area. When the traction motor works in the constant torque range, the output torque remains unchanged, and the working range is between the starting speed and the synchronous speed; when the traction motor works in the constant power range, the output power remains unchanged, and the output torque and speed have an inversely proportional relationship. According to the data provided by the traction motor, the motor output torque is obtained as a piecewise function:
where is the driving torque; is the rated torque; is the rated power; is the traction motor speed; and is the motor synchronous torque.
The traction characteristic curve of the urban rail train is shown in Figure 4a. The urban rail train will be affected by the traction force and basic resistance of the motor under traction conditions. According to the literature [9], the speed curve of the urban rail train under traction conditions can be obtained, as shown in Figure 4b. The train performs a uniform acceleration motion in 0–15.7 s, the working range of the traction motor is the constant torque range and the speed reaches 42.6 km/h; the train performs variable acceleration motion in 15.7–70 s and the working range of the traction motor is the constant power range.
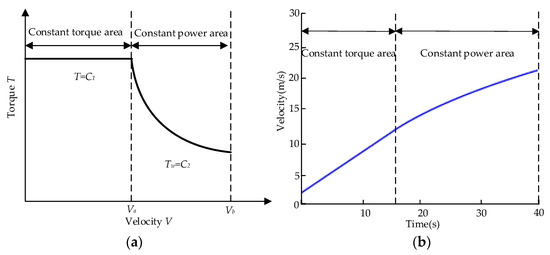
Figure 4.
(a) Traction characteristic curve; and (b) speed curve under traction condition.
The evaluation index of the train’s dynamic performance is an important basis for evaluating the dynamic characteristics of the train. When evaluating the safety of train operation, the derailment coefficient, wheel load reduction rate and other indicators are generally comprehensively evaluated. In this section, based on the dynamic simulation results of urban rail trains under traction conditions, evaluation indicators such as wheel–rail vertical force, wheel–rail lateral force, the derailment coefficient and the rate of wheel load reduction in six carriages are compared and analyzed, and the influence of train dynamics is analyzed.
4.1. Analysis of Safety and Critical Velocity
4.1.1. Security Analysis
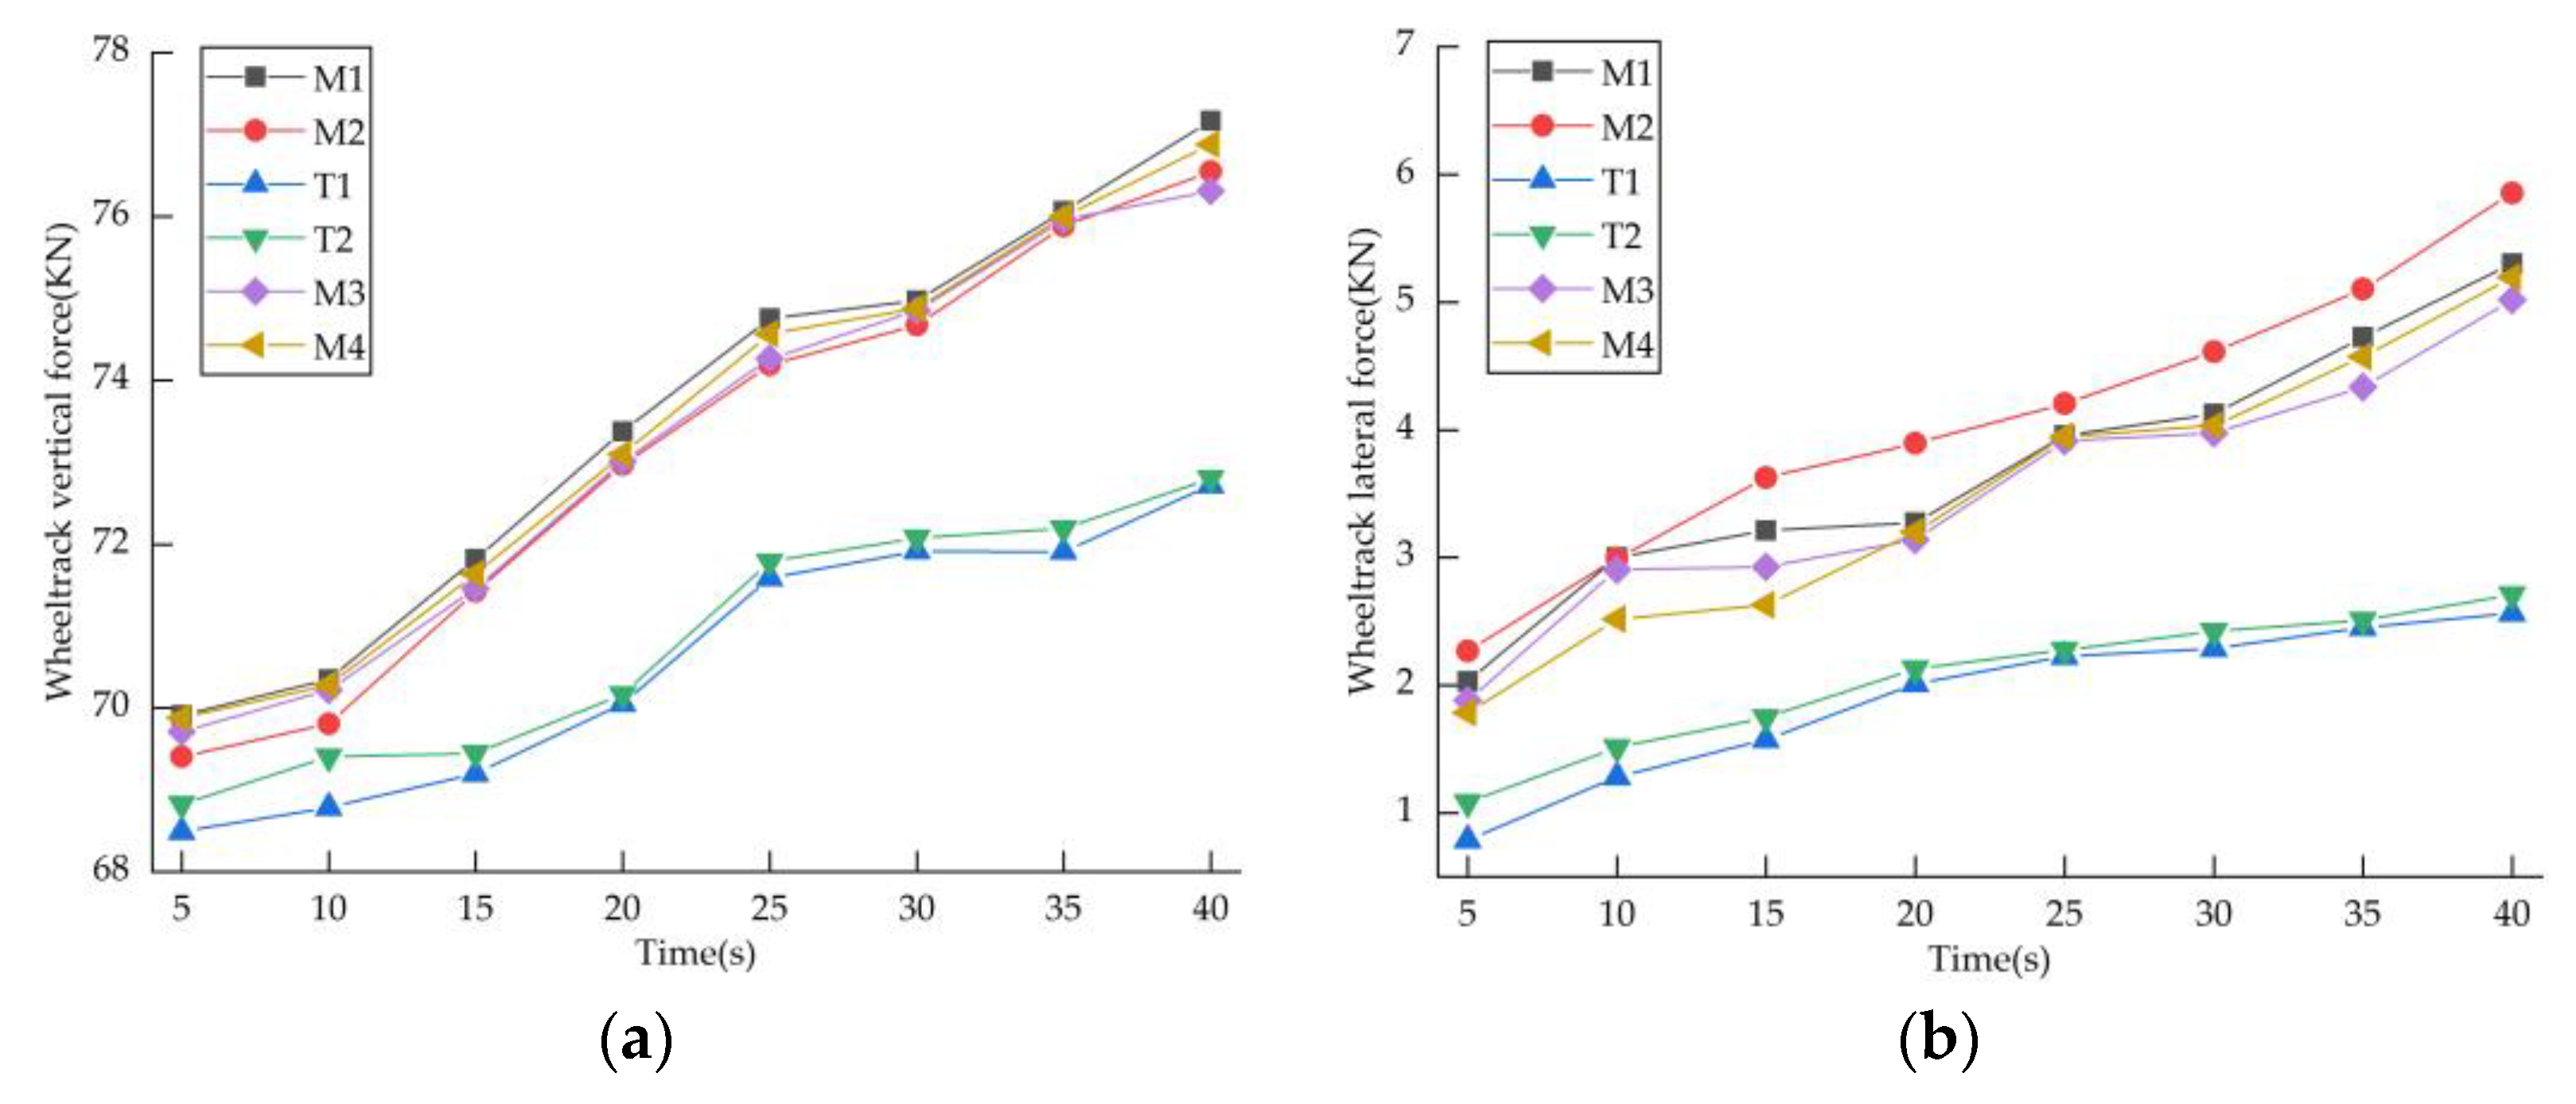
Figure 5a,b show the wheel–rail vertical force and wheel–rail lateral force of each car of the urban rail train under traction conditions, respectively. The simulation data from the position of the axle box divides the 40 s traction condition into eight segments every 5 s and takes the peak value of each segment for comparative analysis. This method is adopted in the subsequent analysis in this section. The wheel–rail vertical force and the wheel–rail lateral force of the six carriages are monotonically increasing. The wheel–rail vertical force of M1 is the largest, and the variation range is 69.91–77.17 KN. The wheel–rail lateral force of M2 is the largest, and the variation range is 2.27–5.96 KN. The wheel–rail vertical force of T1 is smaller than that of T2. The wheel–rail vertical force of the four-section locomotive is significantly greater than that of the two-section trailer because the total mass of the locomotive is greater than that of the trailer and because of the effect of the traction transmission system on the train bogie.
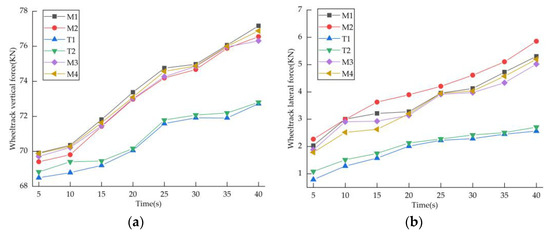
Figure 5.
Wheel–rail force of urban rail train in operation: (a) wheel–rail vertical force; and (b) wheel–rail lateral force.
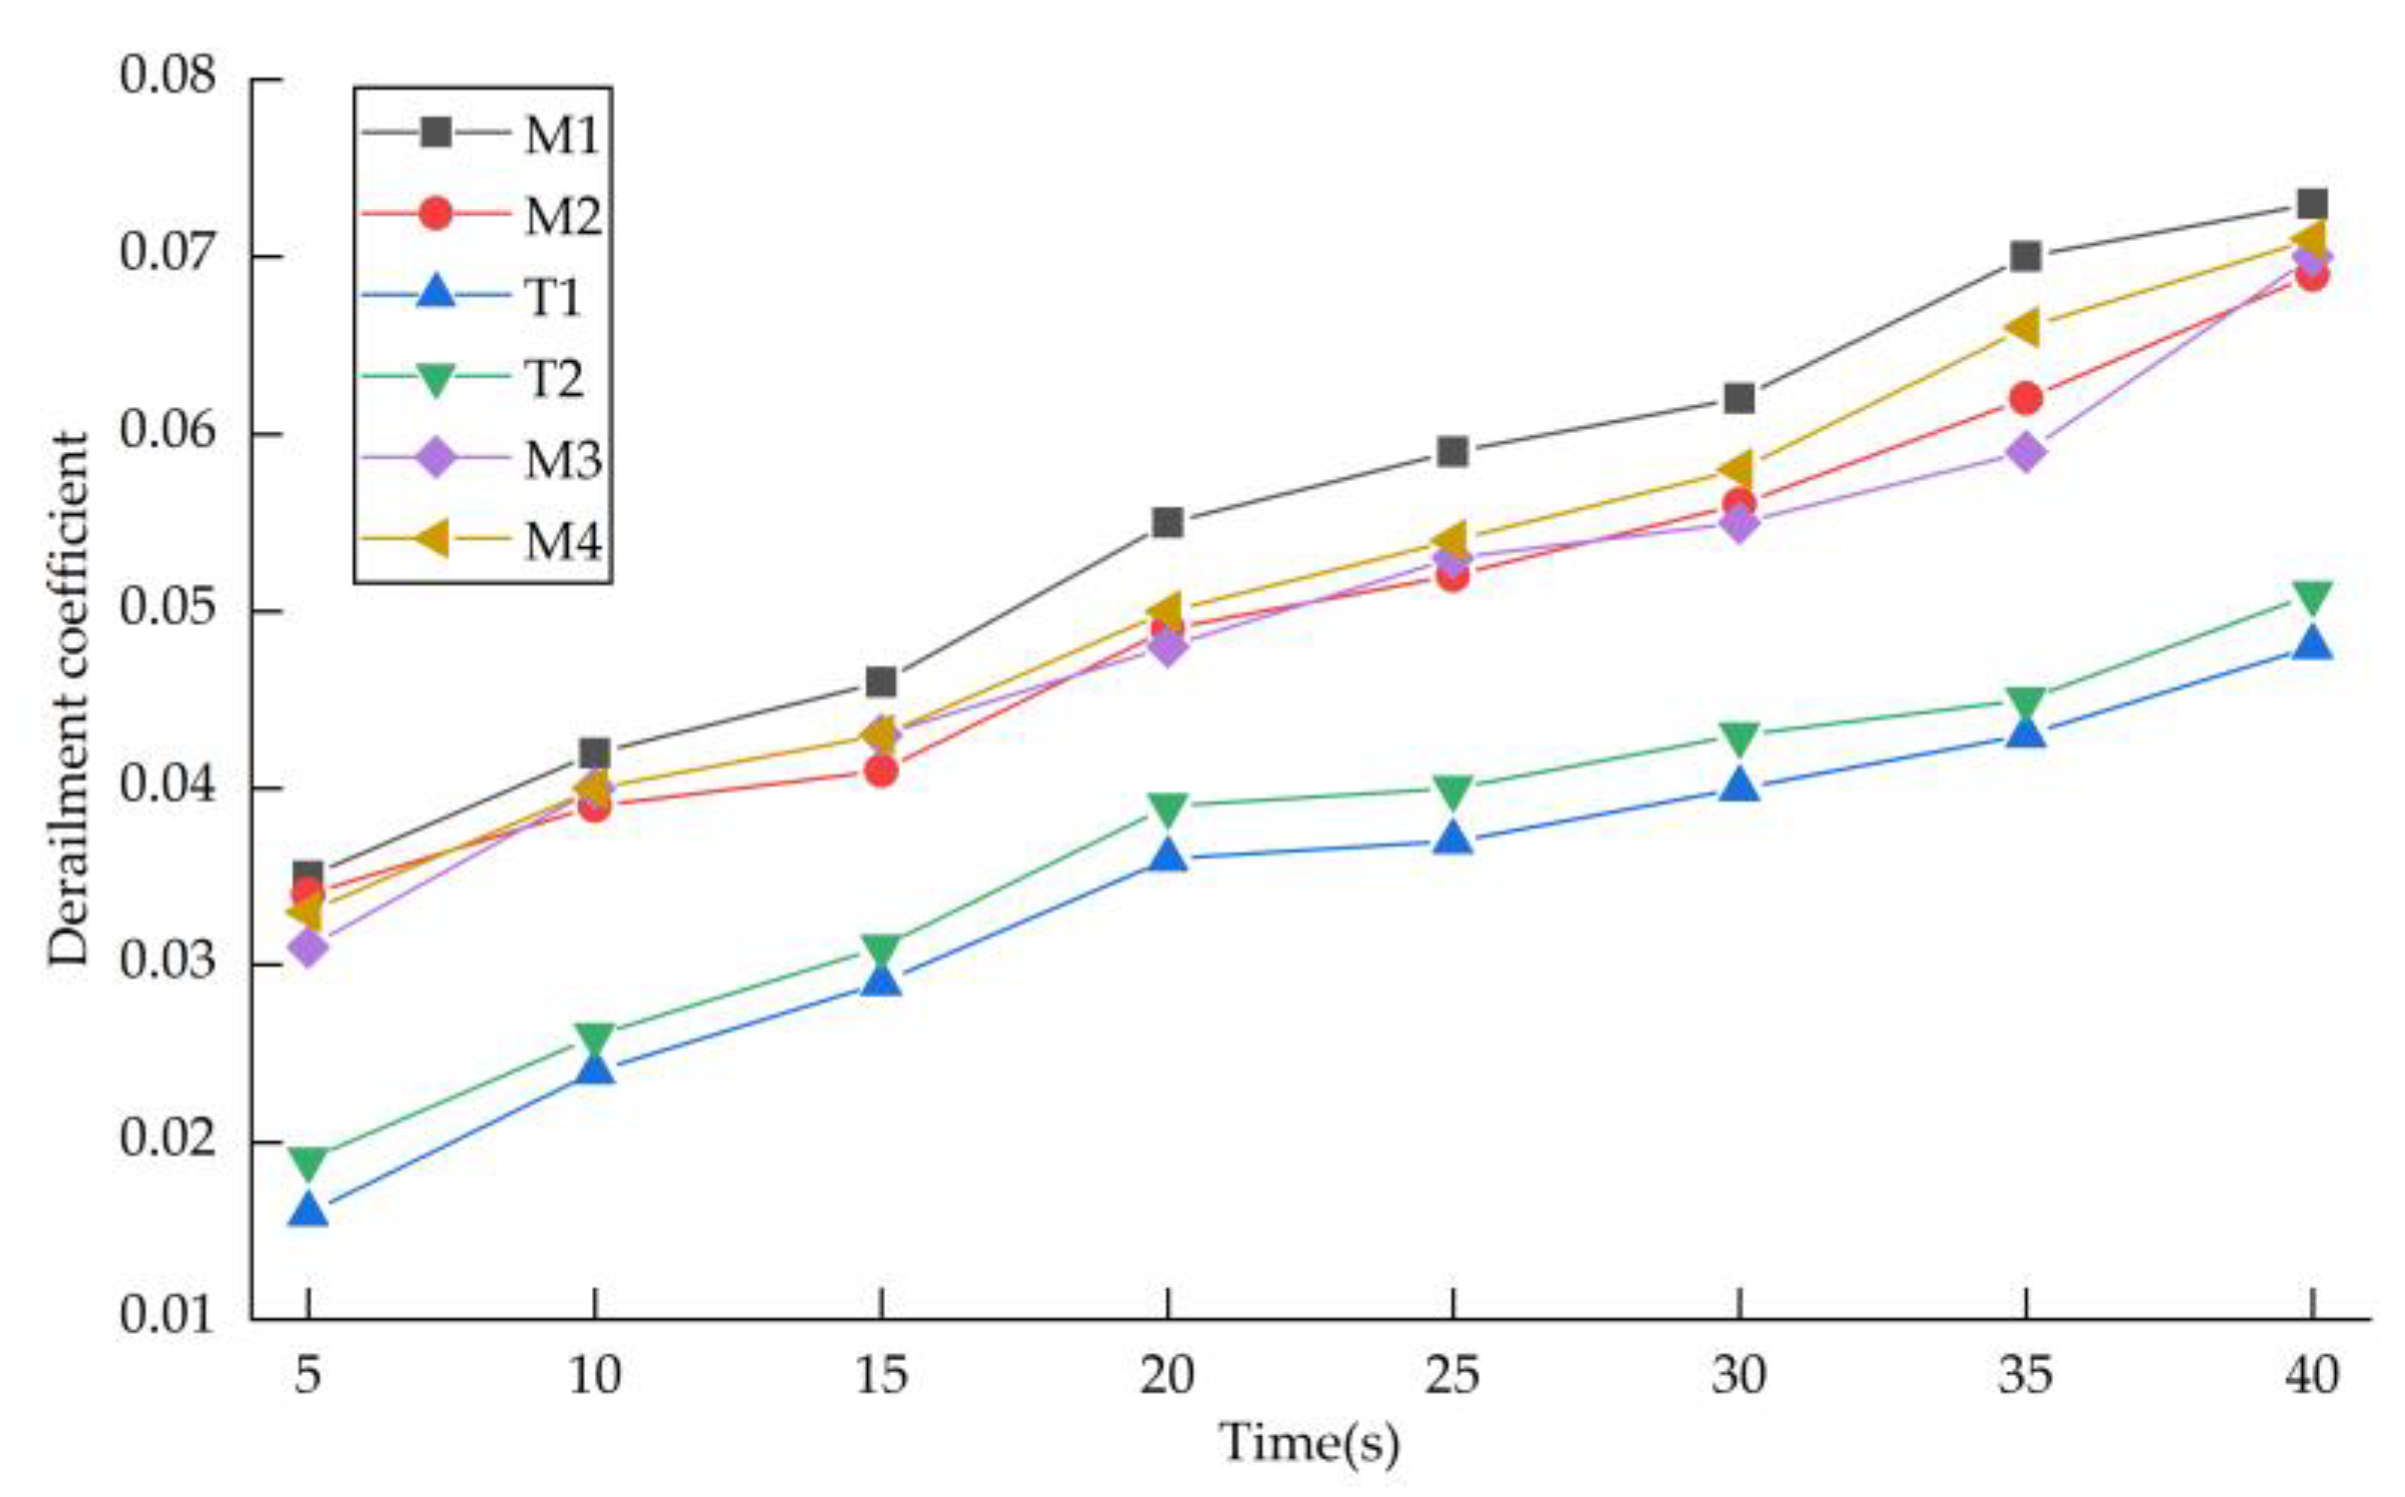
Figure 6 shows the variation in the derailment coefficient of urban rail trains. The derailment coefficients of all cars are monotonically increasing. The derailment coefficient of M1 is the largest, followed by that of M4. The first car and the last car of the train are only connected to one car, which is greatly affected by the longitudinal impact of the train and has poor dynamic performance. The derailment coefficients of the four-section EMUs are significantly greater than those of two-section trailers, indicating that the trailers have better dynamic performance. T1 is smaller than T2, and the variation ranges are 0.016–0.048 and 0.019–0.051, respectively, indicating that the dynamic performance of the trailer in the front is better than that in the rear.
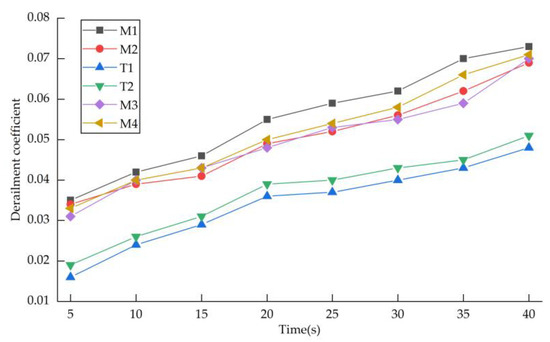
Figure 6.
Derailment coefficient.
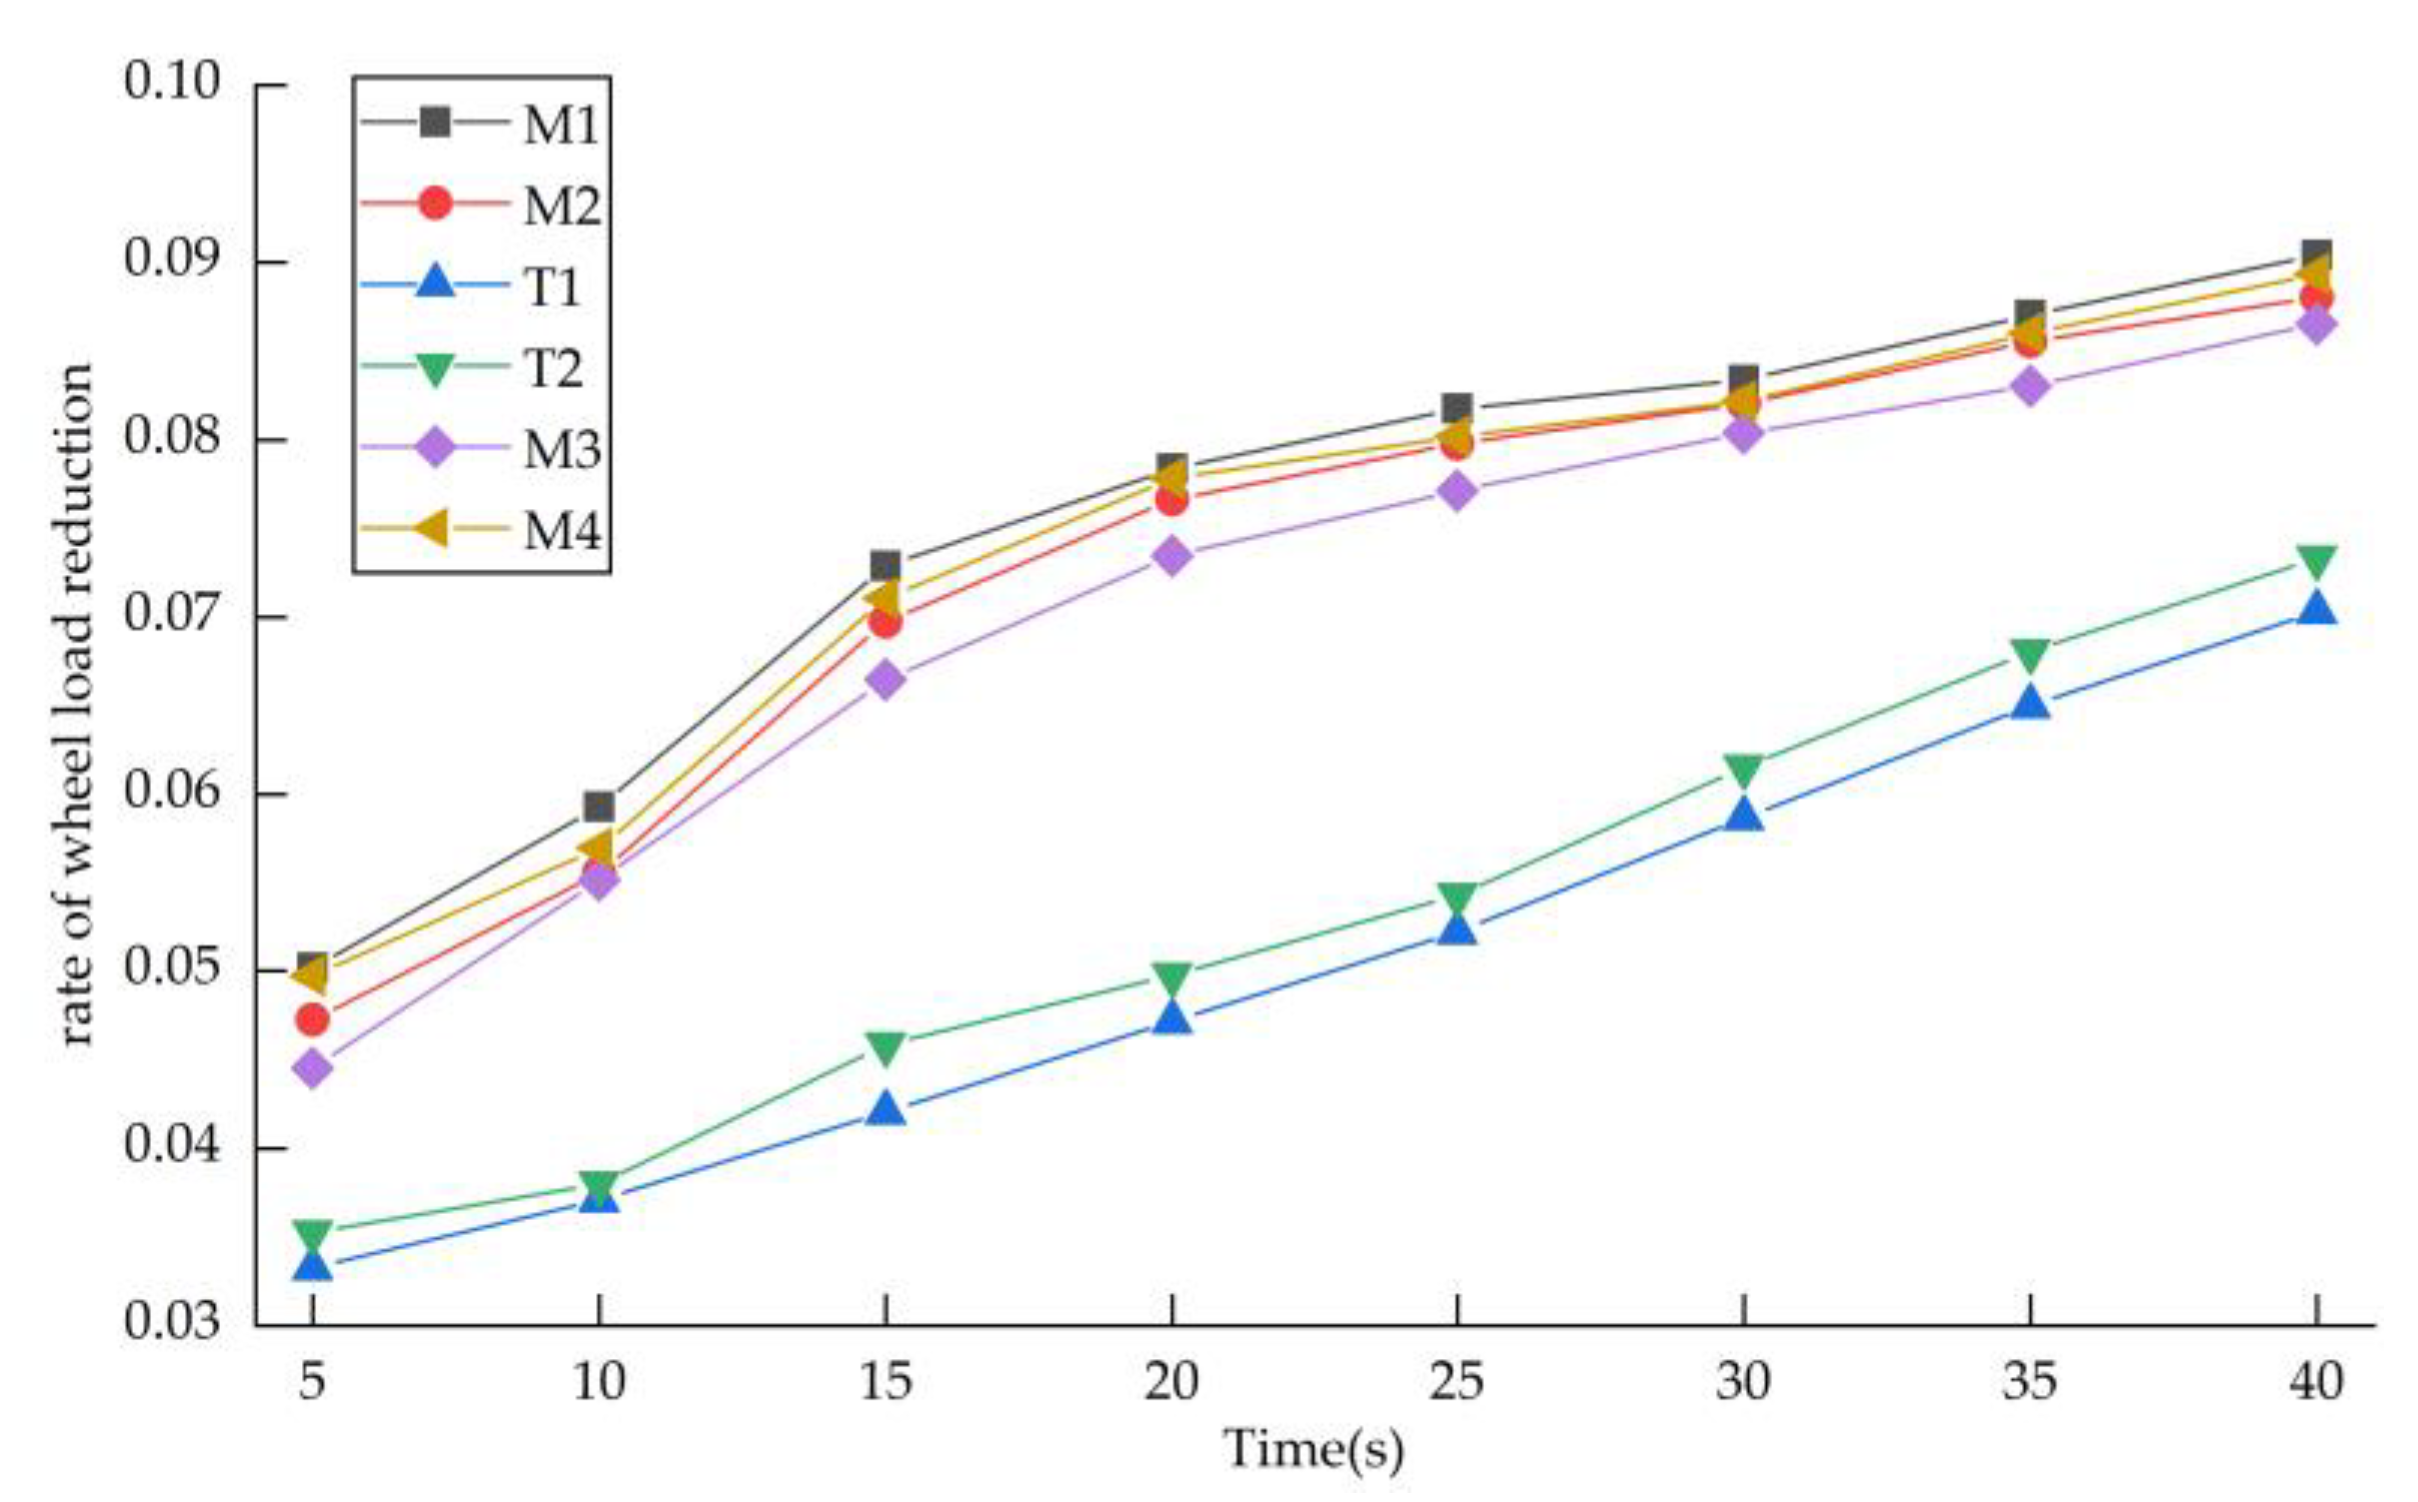
Figure 7 shows the change in the wheel load reduction rate of each car of the urban rail train. The wheel load reduction rate of all cars is monotonically increasing. The wheel load reduction rate of M1 is the largest, followed by M4, and their variation ranges are 0.050~0.090 and 0.049~0.089, respectively, whilst the wheel load reduction rate of the four-segment trains is significantly larger than those of the two-segment trailers, T1 is smaller than T2 and their variation ranges are 0.033~0.070 and 0.035~0.073, respectively. The variation characteristics of the wheel load reduction rate of urban rail trains are similar to the derailment coefficient, which verifies the previous analysis.
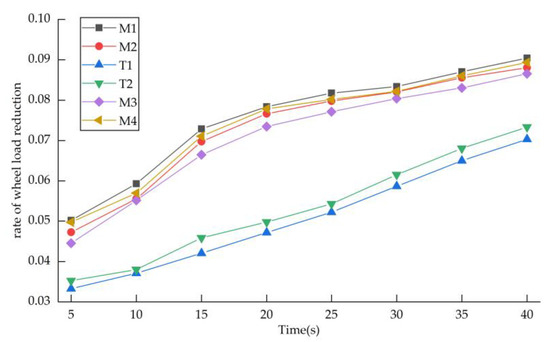
Figure 7.
Rate of wheel load reduction.
4.1.2. Nonlinear Critical Speed Analysis
The critical speed is divided into a linear critical speed and a nonlinear critical speed. In general, the linear critical speed is 10~28% faster than the nonlinear critical speed. Therefore, calculating the critical speed of the train only needs to calculate its nonlinear critical speed. The nonlinear critical speed needs to give the train an initial speed that is much larger than the actual running speed and at the same time apply a force opposite to the running direction of the train body to make the train perform a uniform deceleration motion, let the train pass through a small section of lateral track excitation and then cancel so that the train continues to run on a smooth track. The nonlinear critical speed of the train is judged by observing whether the traverse amount of the wheelset converges in the postprocessing, and the minimum value of the convergence of the traverse amount of the wheelset is the nonlinear critical speed of the train.
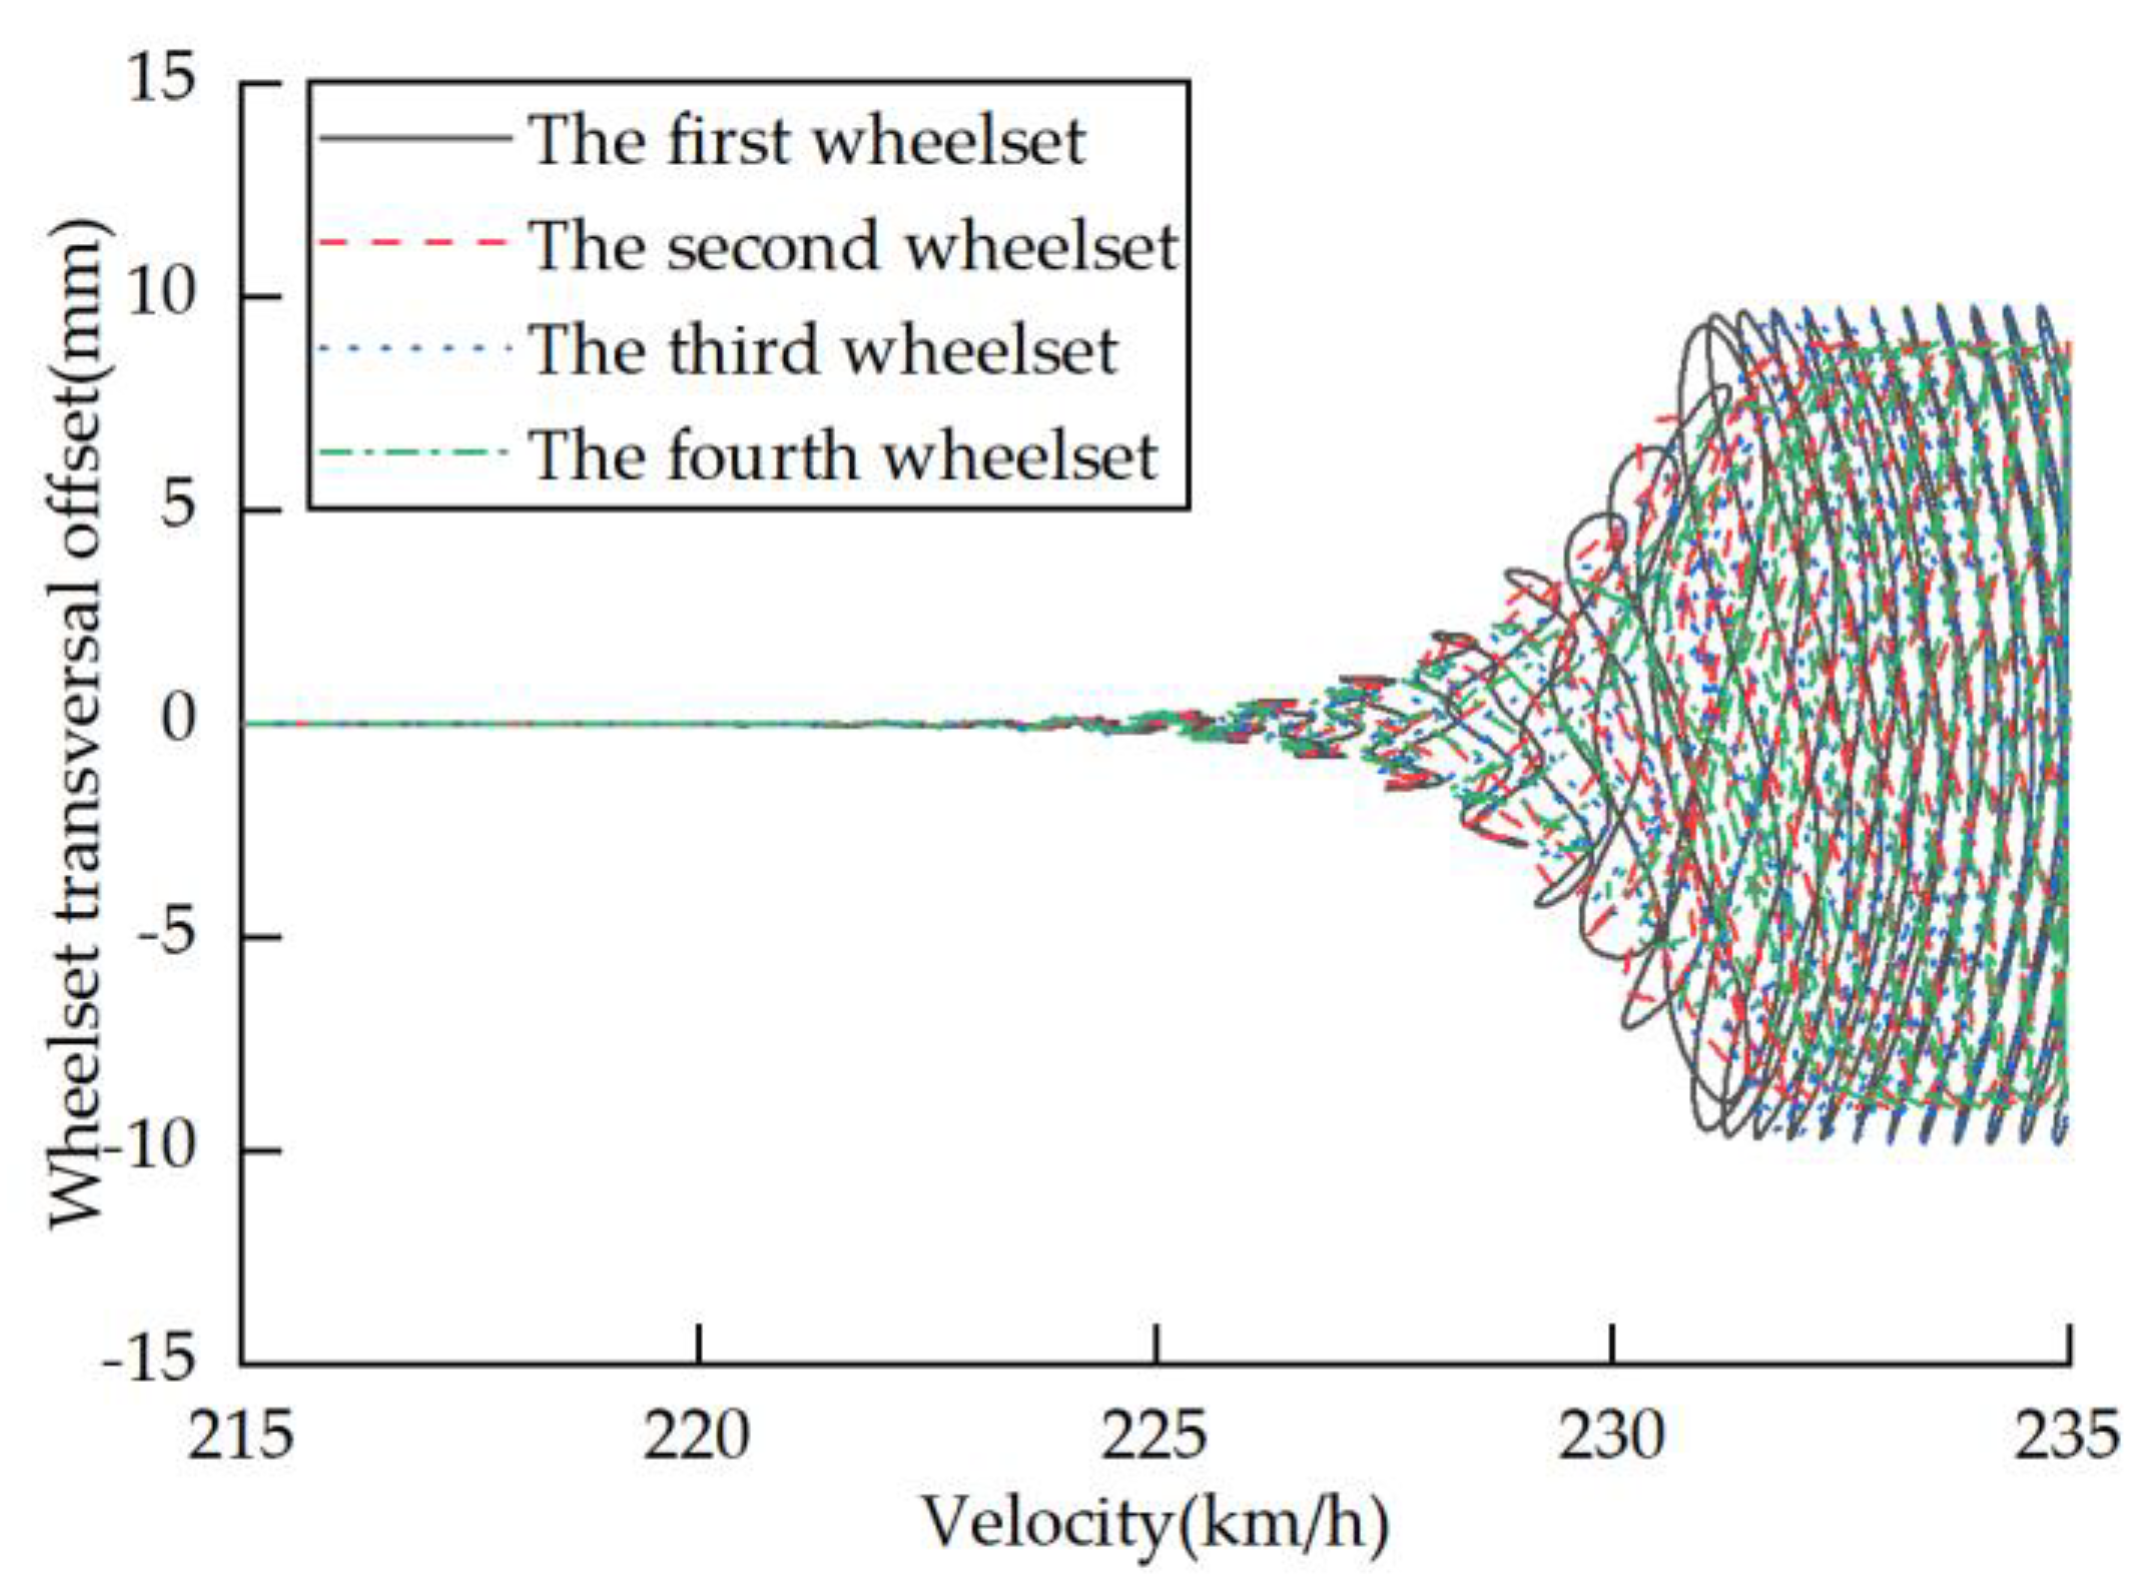
The nonlinear critical speed simulation selects 300 km/h as the initial speed of the train, which is significantly greater than the actual running speed of the train. The simulation results of the single-section trailer are shown in Figure 8. The lateral offset of the four wheelsets of the single-section trailer model is within ±10 mm, and the convergence speed of the lateral offset of the four wheelsets is basically the same. Therefore, it can be concluded that the nonlinear critical speed of the model is 223 km/h.
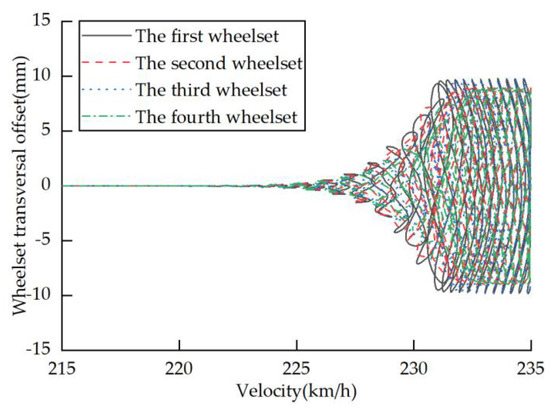
Figure 8.
The nonlinear critical speed of the single trailer.
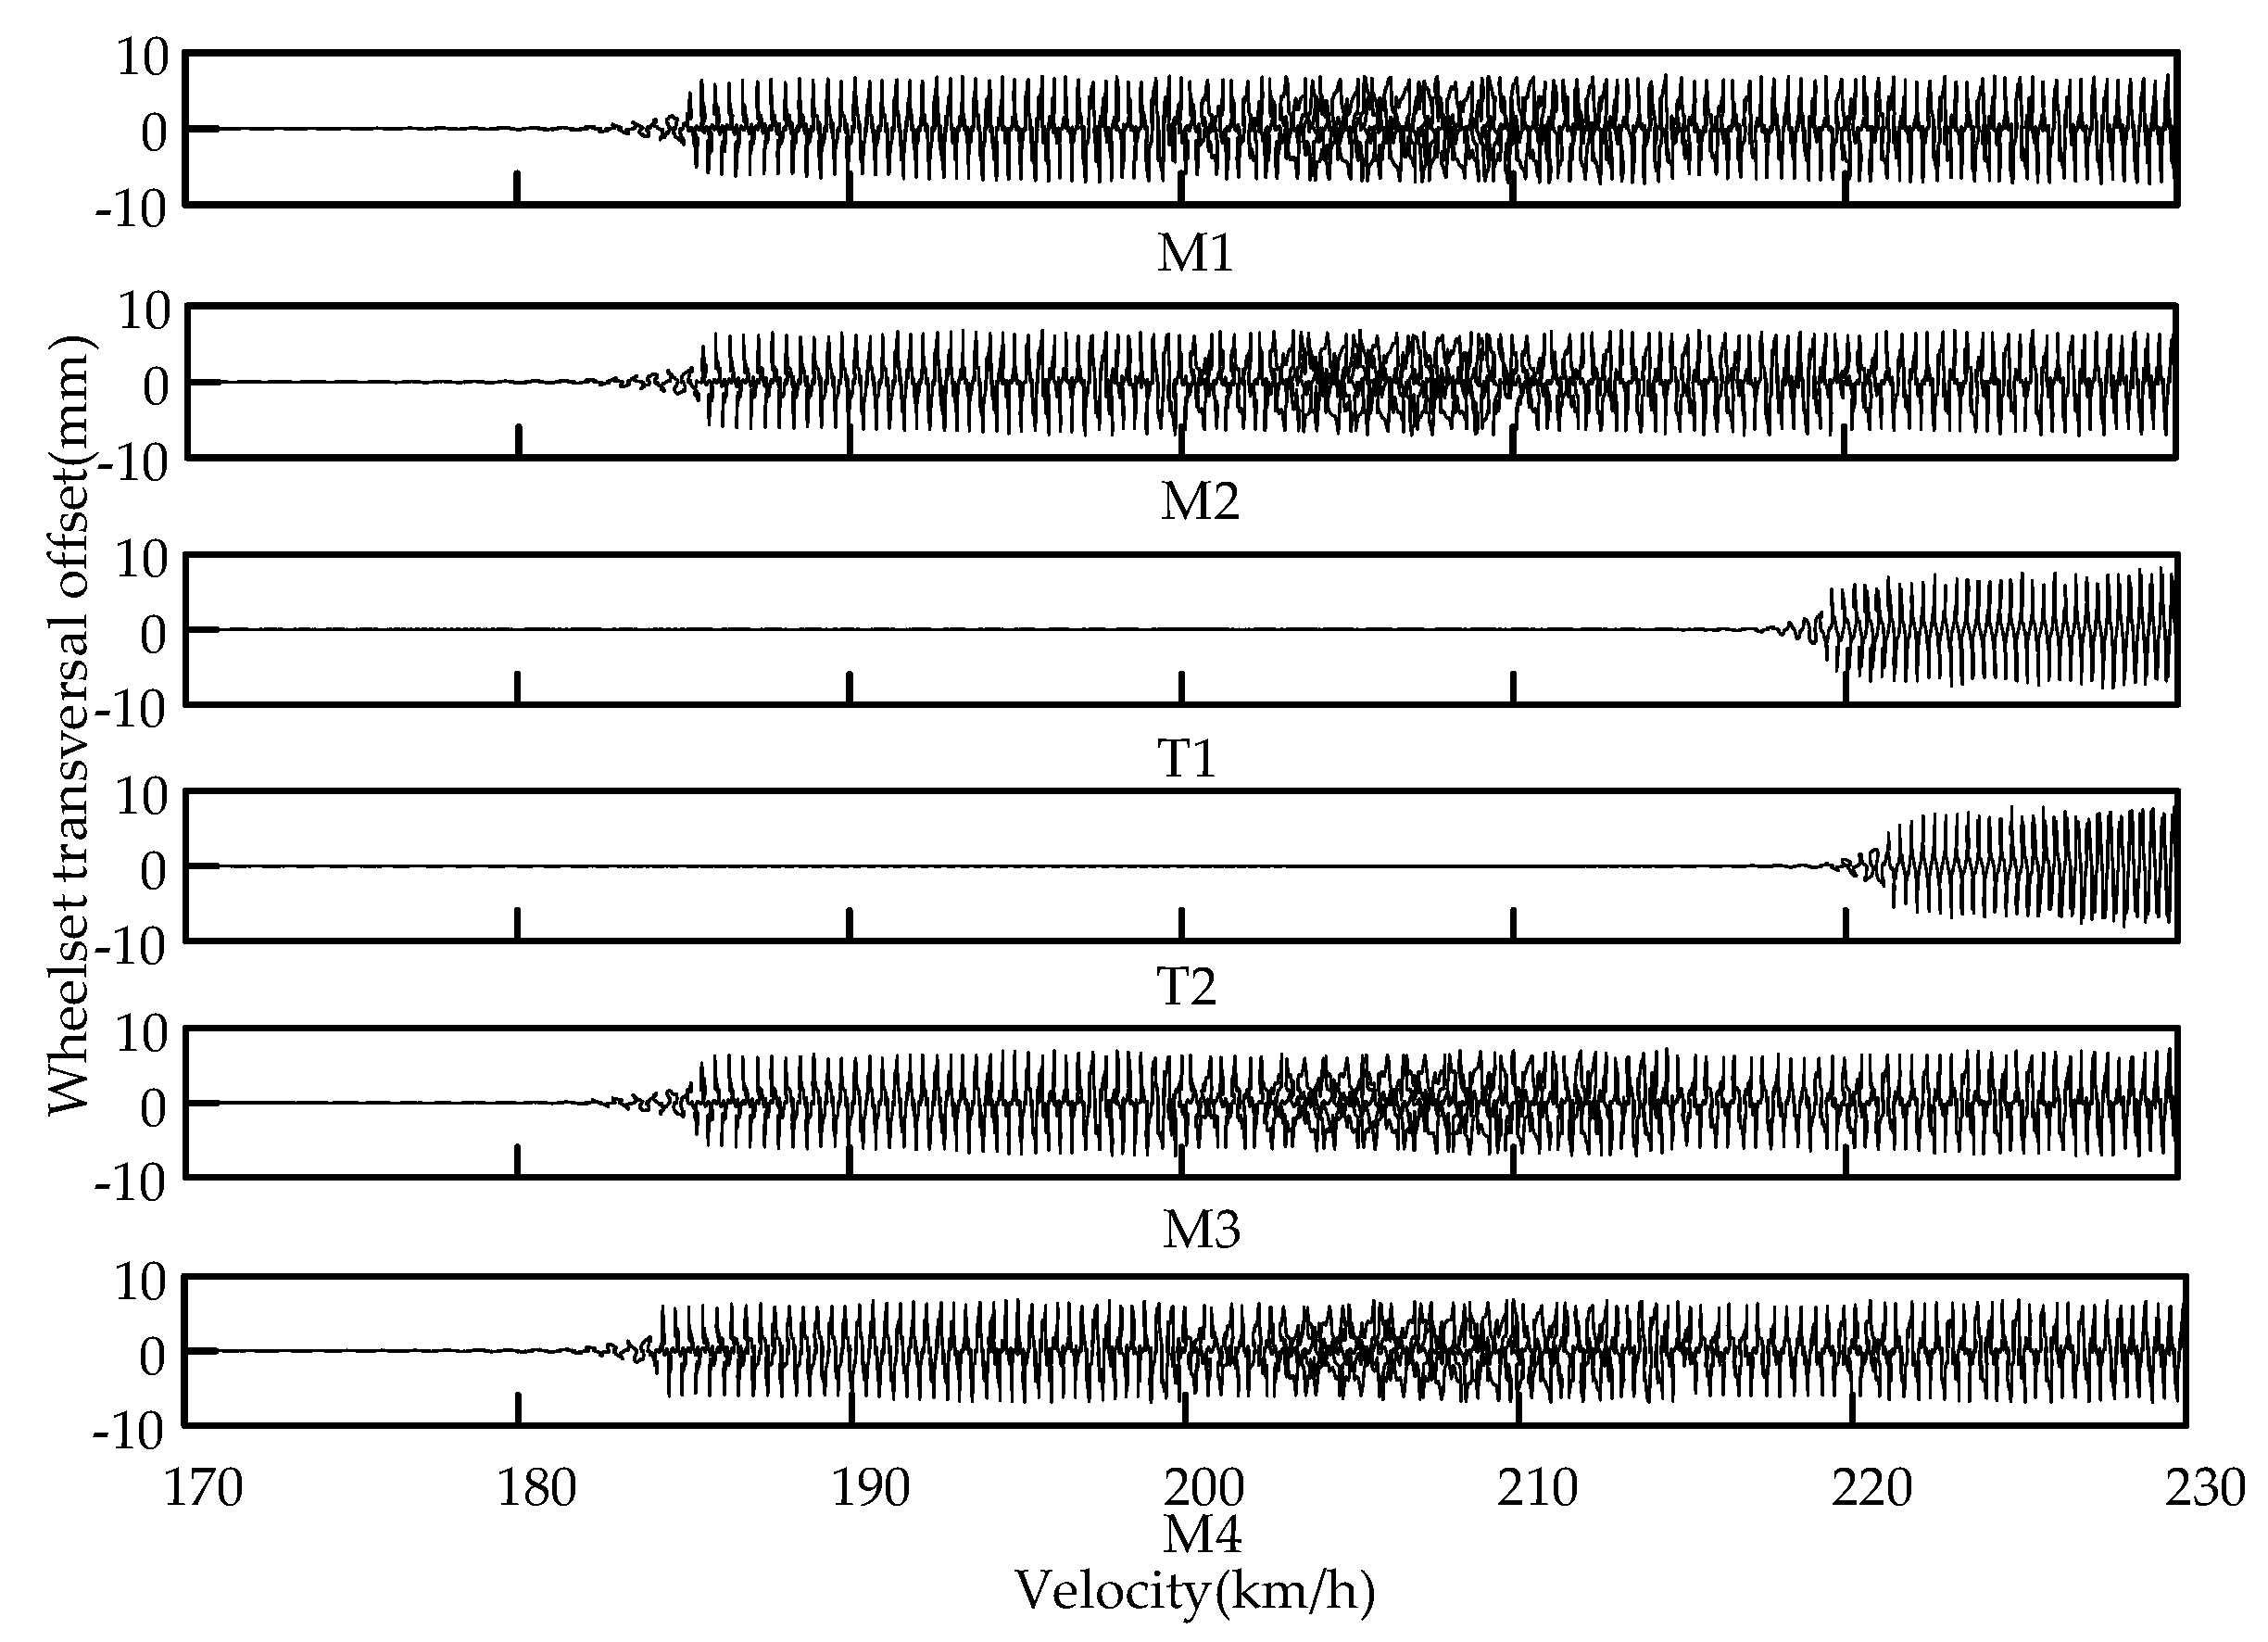
The simulation results of the marshaling train are shown in Figure 9. Figure 9 shows the “M1, M2, T1, T2, M3, M4” carriages of the six-car marshaling urban rail train. As a result, the nonlinear critical speed of each car relative to the single train model is different. The critical speeds of the T1 and T2 trailers are 217.5 km/h and 215.8 km/h, respectively, which are lower than the critical speed of the single-segment model. The critical speeds of the four motor cars M1, M2, M3 and M4 are 181.5 km/h, 183.3 km/h, 183.1 km/h and 181.2 km/h, respectively. Compared with the trailer, the motor vehicle has different parameters and more components, such as a gearbox and traction motor, so the critical speed of the motor vehicle is lower than that of the trailer. The critical speeds of M1 and M4 are lower than those of the other two, indicating that the dynamic performances of M1 and M4 are poor; the critical speed of T1 is greater than that of T2, indicating that the dynamic performance of T1 is better than that of T2, which verifies the previous analysis.
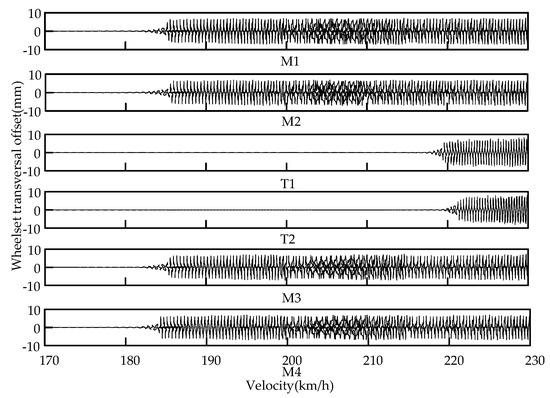
Figure 9.
Nonlinear critical speed of each car of the marshaling urban rail train. Each curve represents the convergence rate of transverse movement of each carriage respectively.
4.2. Vibration and Comfort Analysis of Urban Rail Trains
4.2.1. Vibration Response Analysis
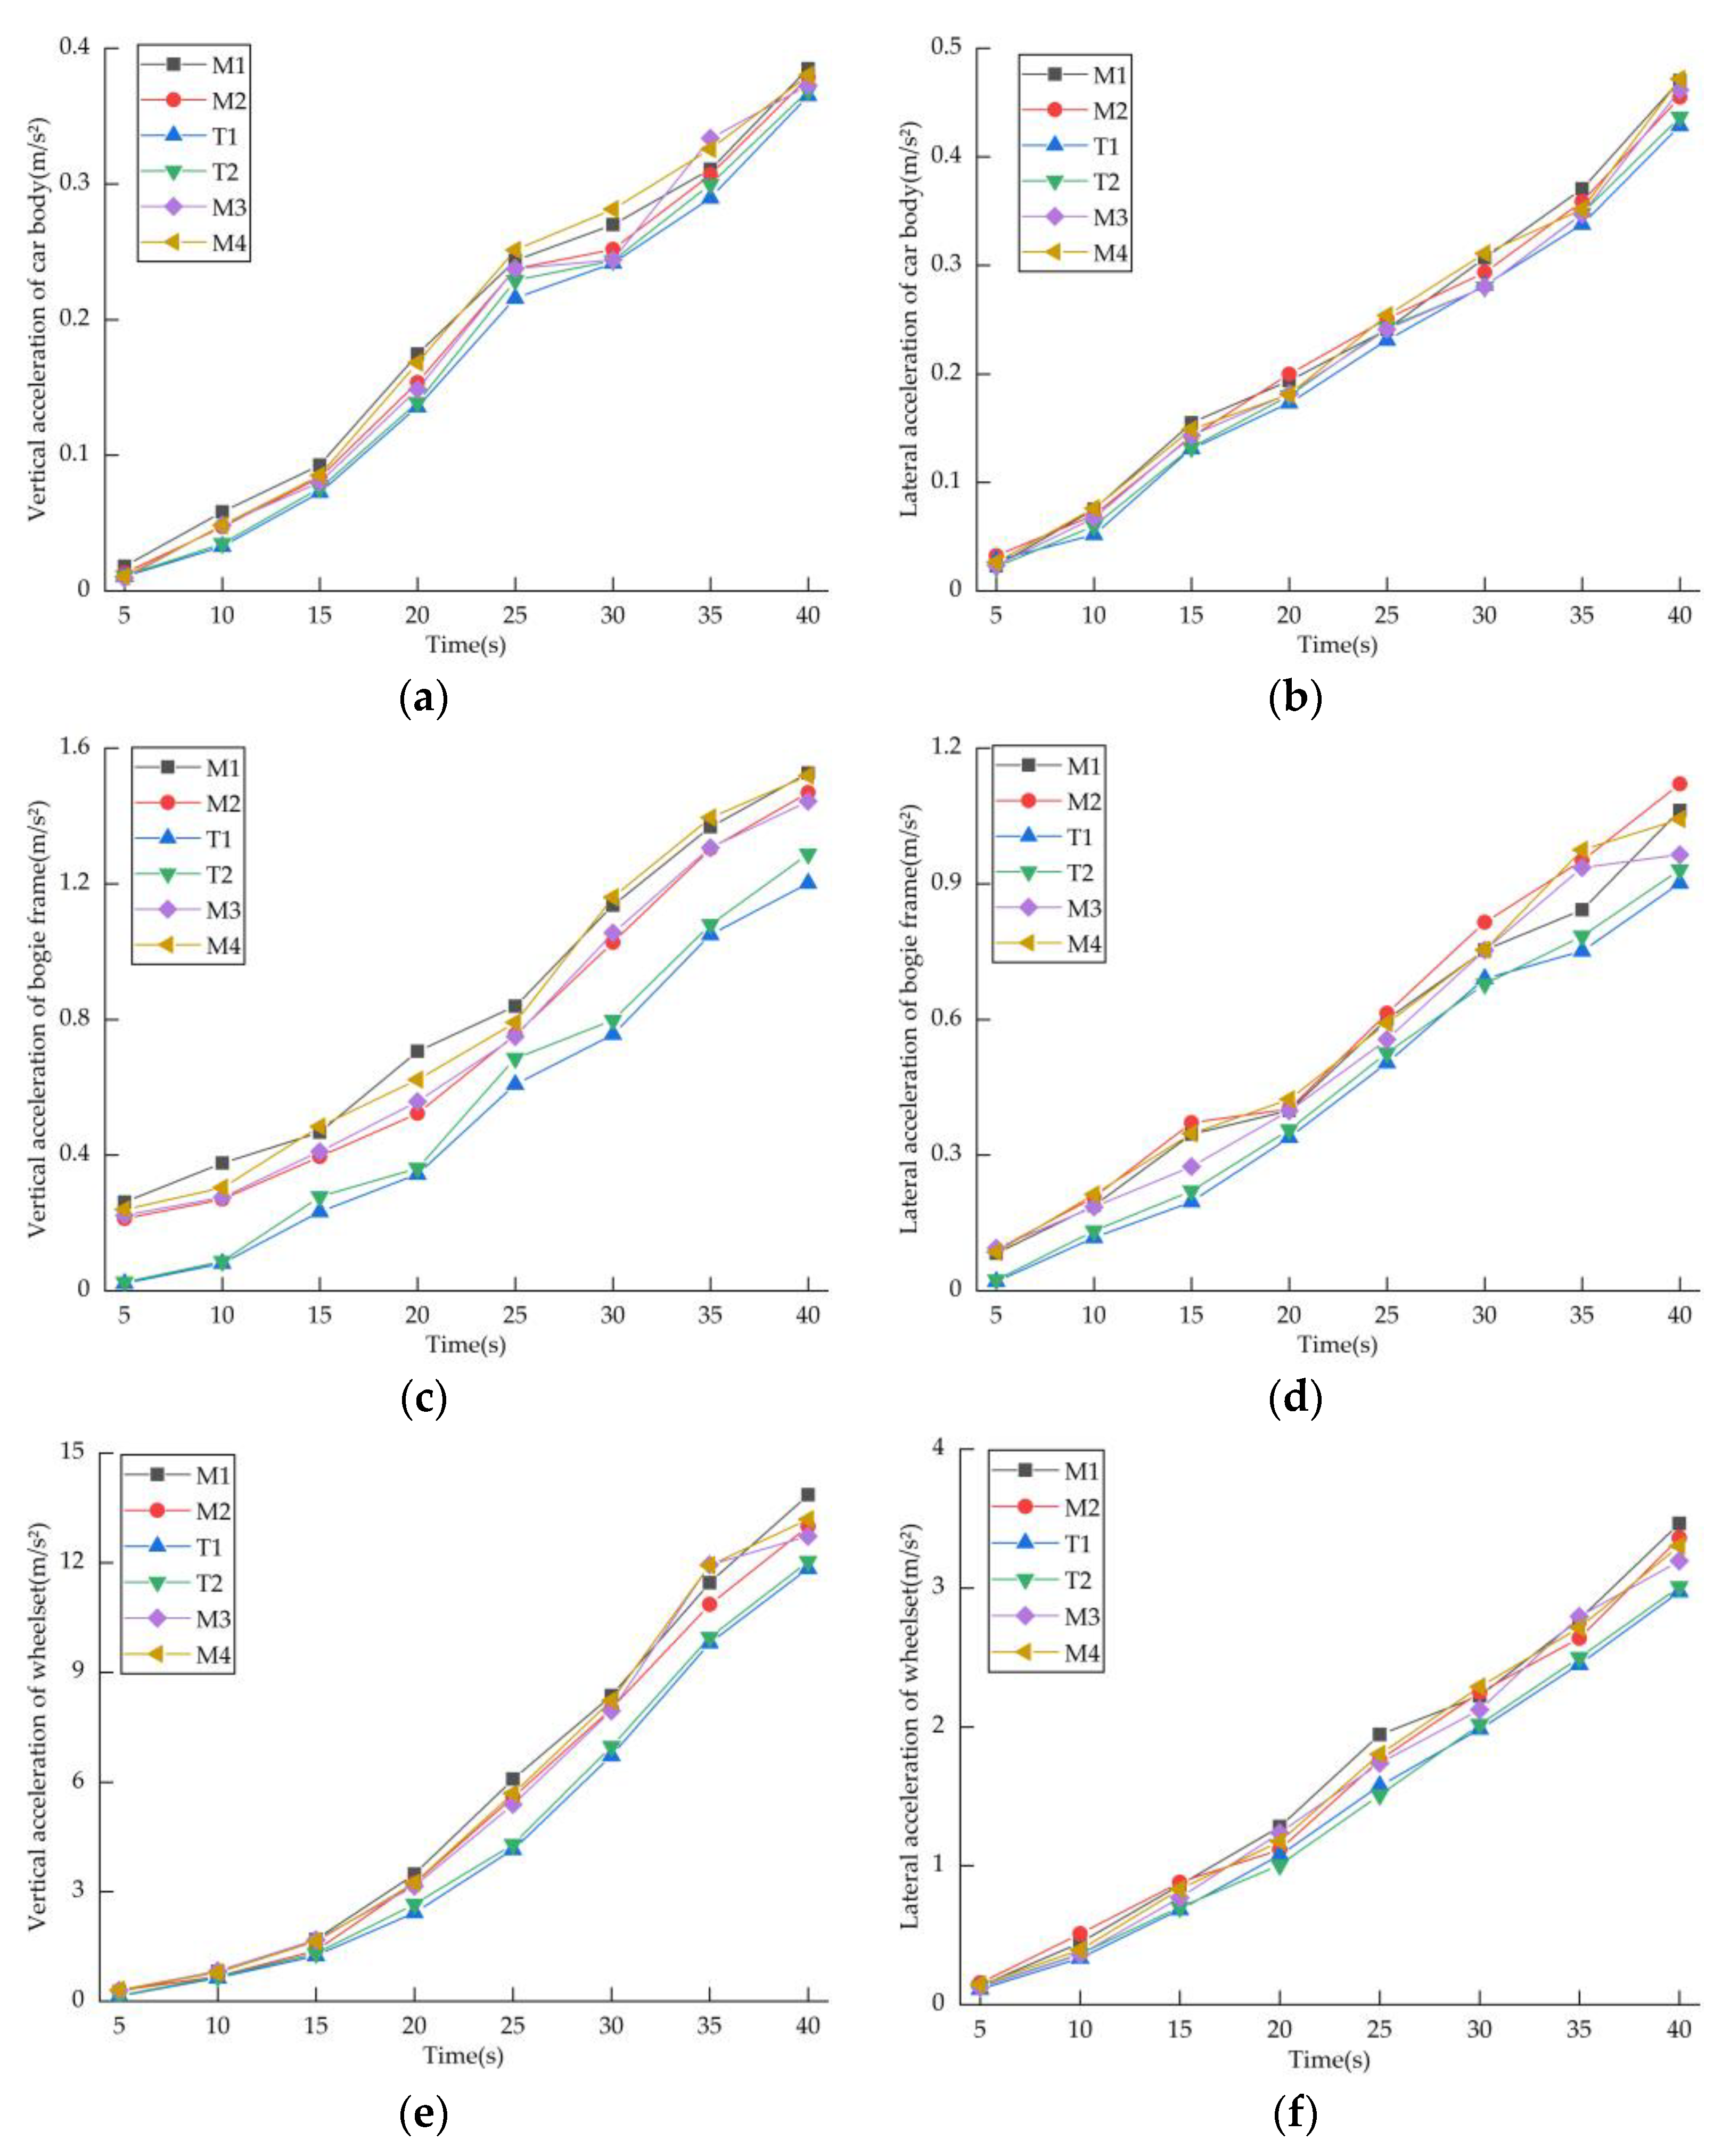
Figure 10a,b show the vertical acceleration and lateral acceleration of each carriage body, respectively. The vertical acceleration and lateral acceleration of the six-carriage car increase monotonically. In terms of vertical acceleration, the motor car is larger than the trailer, but the difference is not obvious. The variation range of M1 is the largest, in the range of 0.018~0.385 m/s2. T1 is the smallest, with a variation range of 0.011~0.365 m/s2. In terms of lateral acceleration, there is no obvious difference between the carriages, and the overall variation range is 0.022~0.472 m/s2.
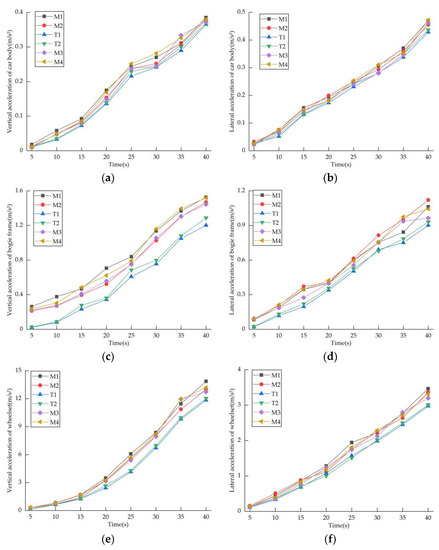
Figure 10.
Vibration acceleration of each component of the marshaling urban rail train: (a) vertical acceleration of car body; (b) lateral acceleration of car body; (c) vertical acceleration of bogie frame; (d) lateral acceleration of bogie frame; (e) vertical acceleration of wheelset; and (f) lateral acceleration of wheelset.
Figure 10c,d show the vertical and lateral accelerations of the bogie frames of each car, respectively. The vertical and lateral accelerations of the six carriages monotonically increase. The vibration accelerations of M1 and M4 are relatively large, the vertical acceleration ranges are 0.262~1.523 m/s2 and 0.239~1.512 m/s2, respectively, and the lateral acceleration ranges are 0.083~1.062 m/s2 and 0.086~1.042 m/s2, respectively. The vibration acceleration of the four motor cars is greater than that of the two trailers because the traction motor will generate large vibration during operation, and the gear mechanism adopts a helical gear which will generate large vertical vibration and lateral vibration during operation. The vertical vibration acceleration has a significant effect.
Figure 10e,f show the vertical and lateral accelerations of the wheelsets of each carriage, respectively. The vertical and lateral accelerations of the six carriages monotonically increase. The vertical and lateral accelerations of the four motor cars are both greater than those of the two trailers, indicating that the traction transmission system has an obvious influence on the vibration acceleration of the train wheels. The ranges of the vertical and lateral accelerations of the motor car are 0.26~13.86 m/s2 and 0.15~11.84 m/s2, respectively, and the ranges of the vertical and lateral accelerations of the trailer are 0.13~3.47 m/s2 and 0.11~3.01 m/s2, respectively. The vibration acceleration of the axle box is significantly greater than that of the bogie frame, and the vibration acceleration of the bogie frame is significantly greater than that of the car body, indicating that the primary suspension and the secondary suspension suppress most of the vibration.
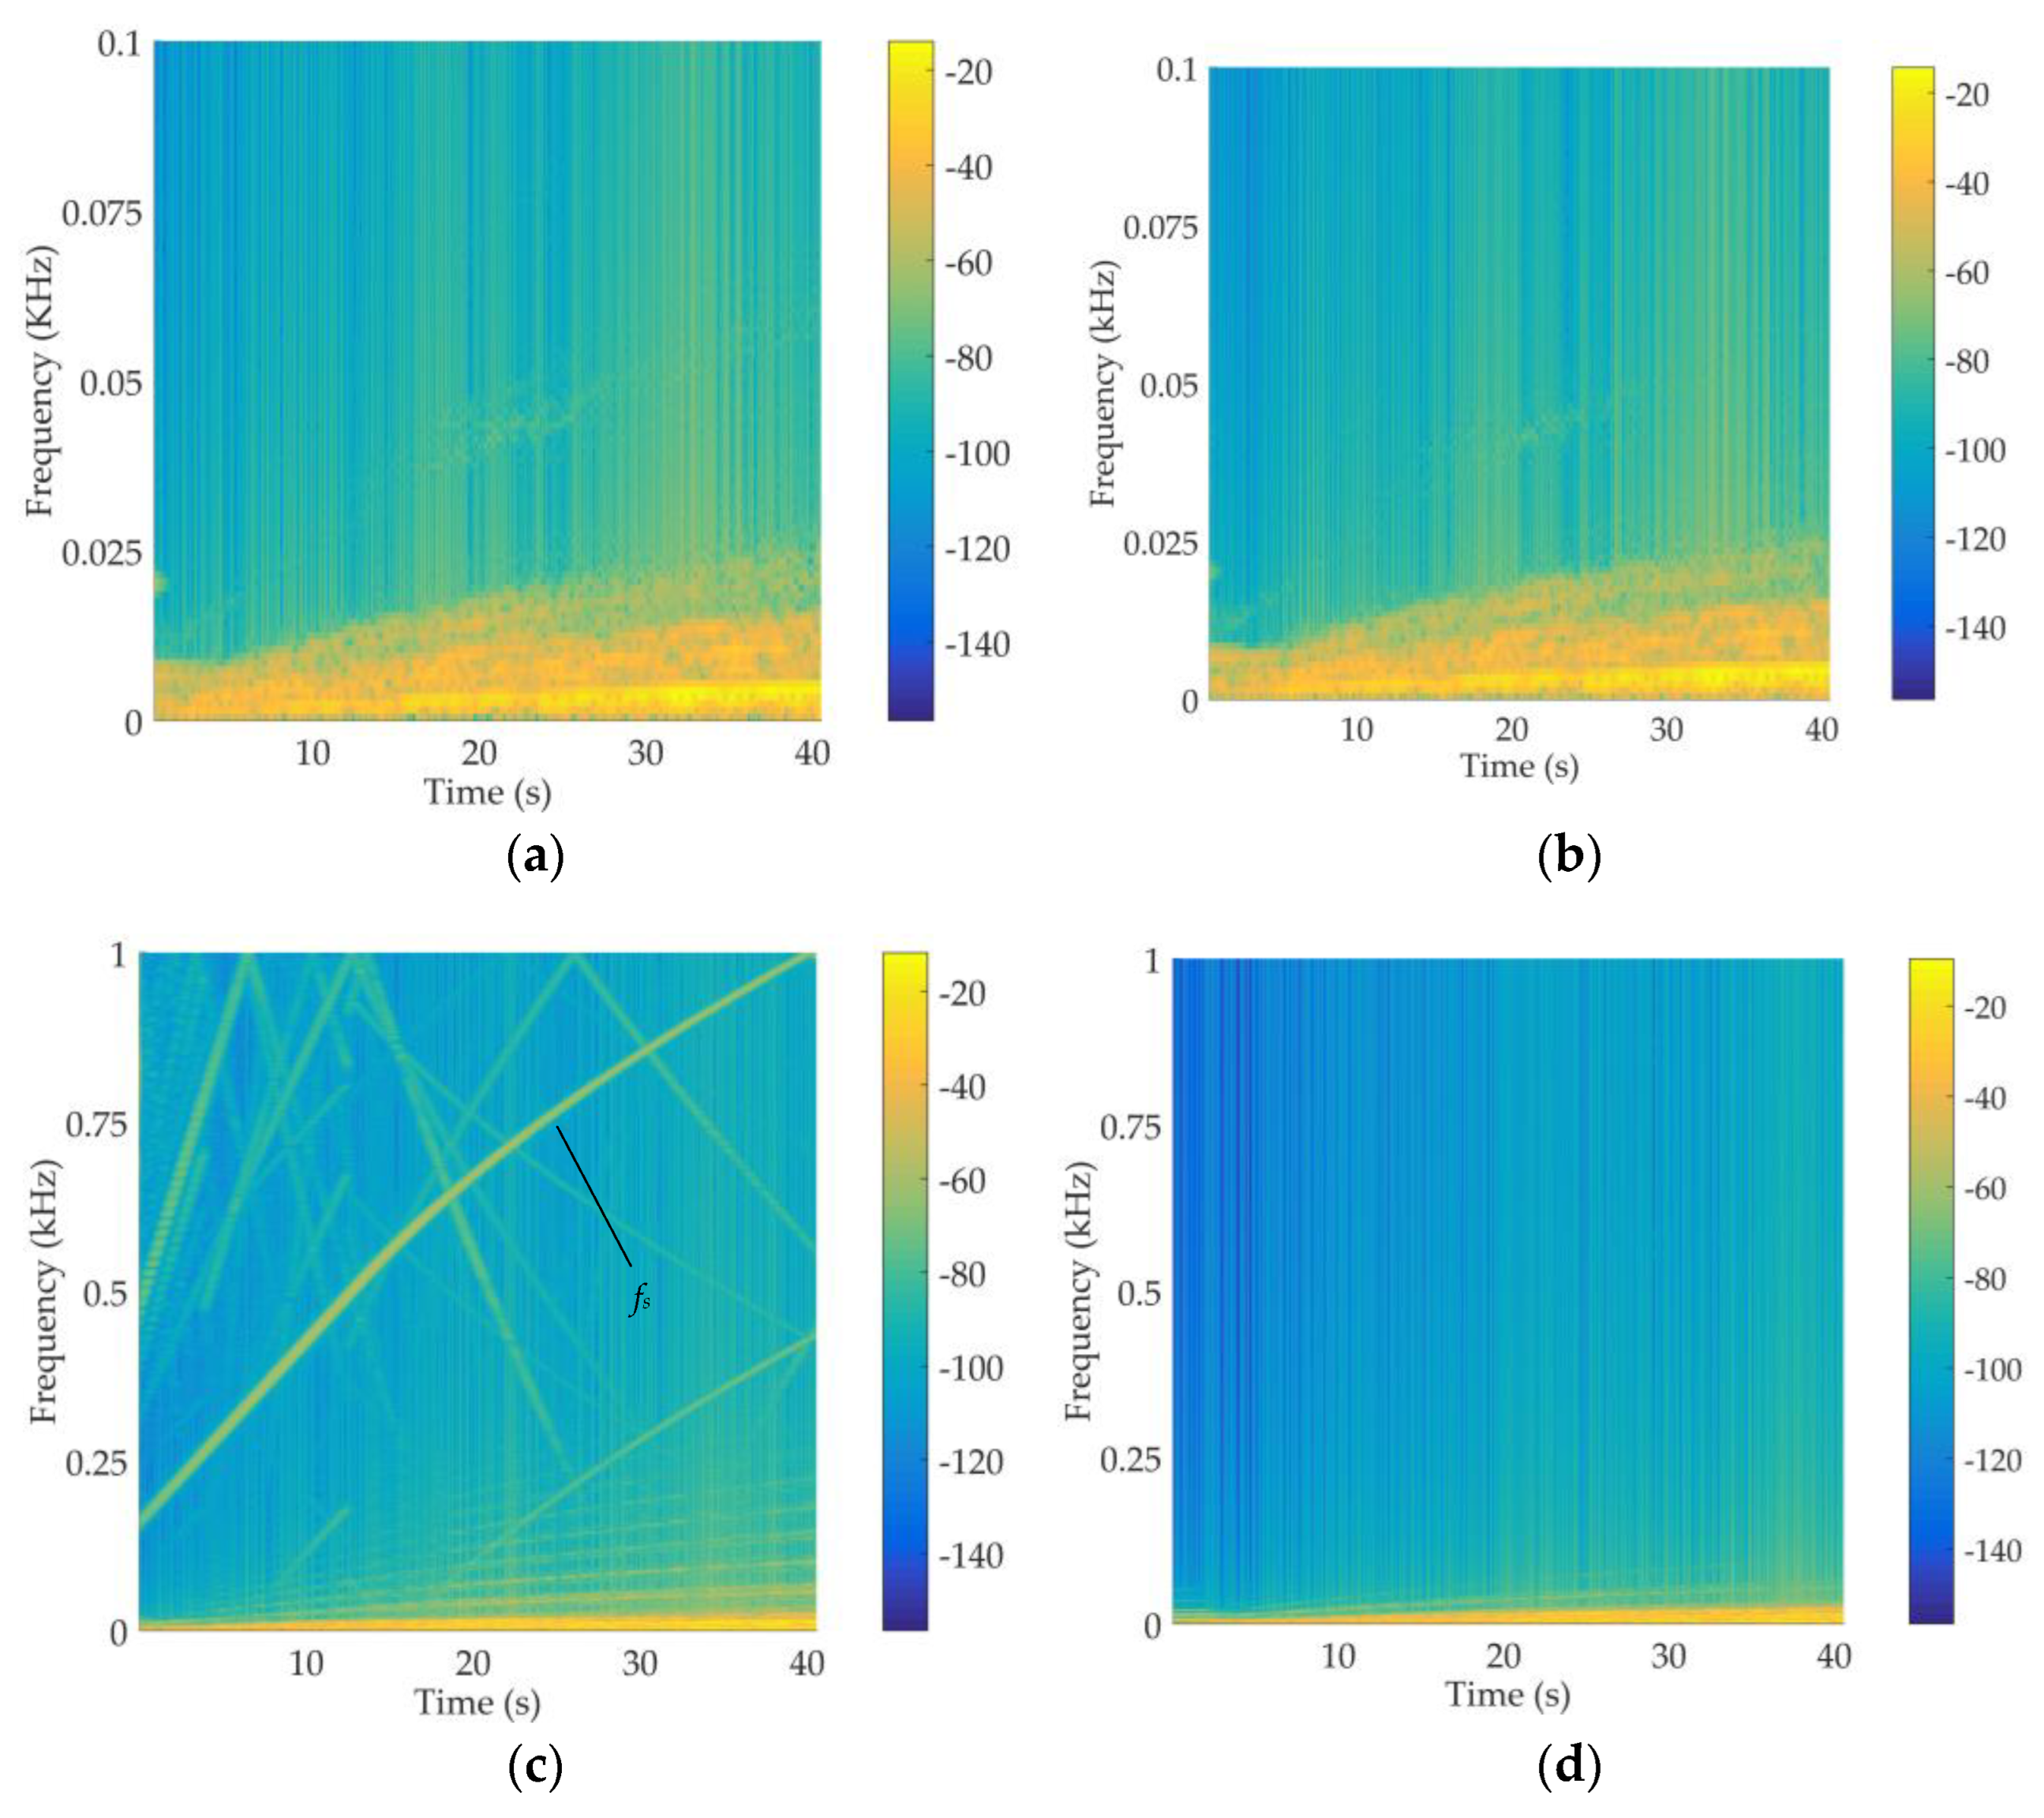
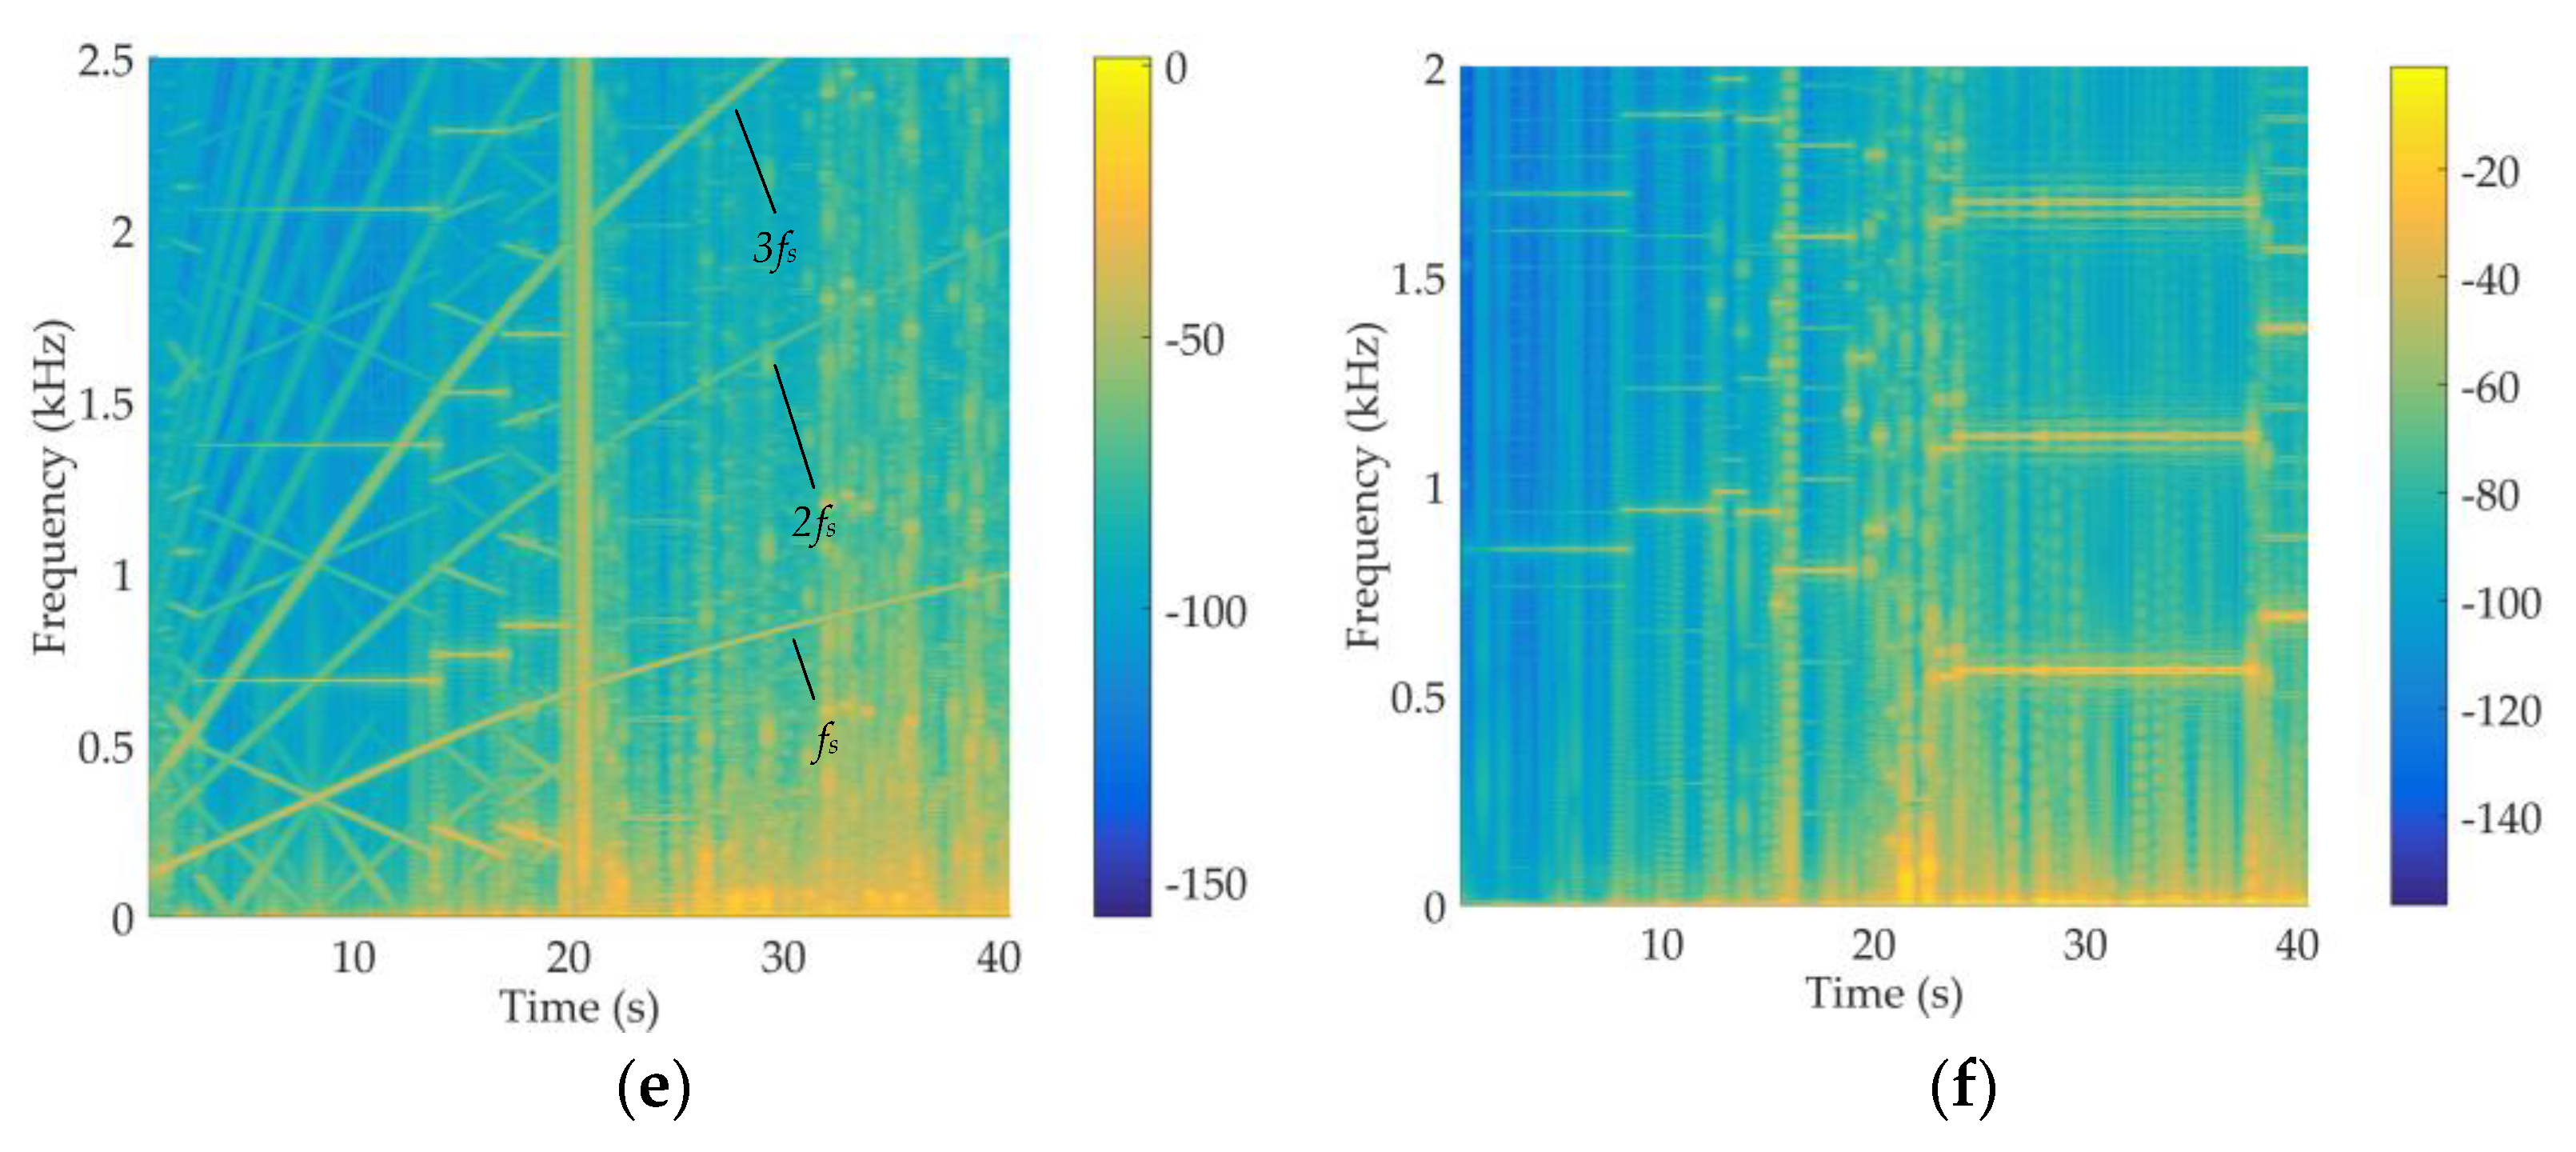
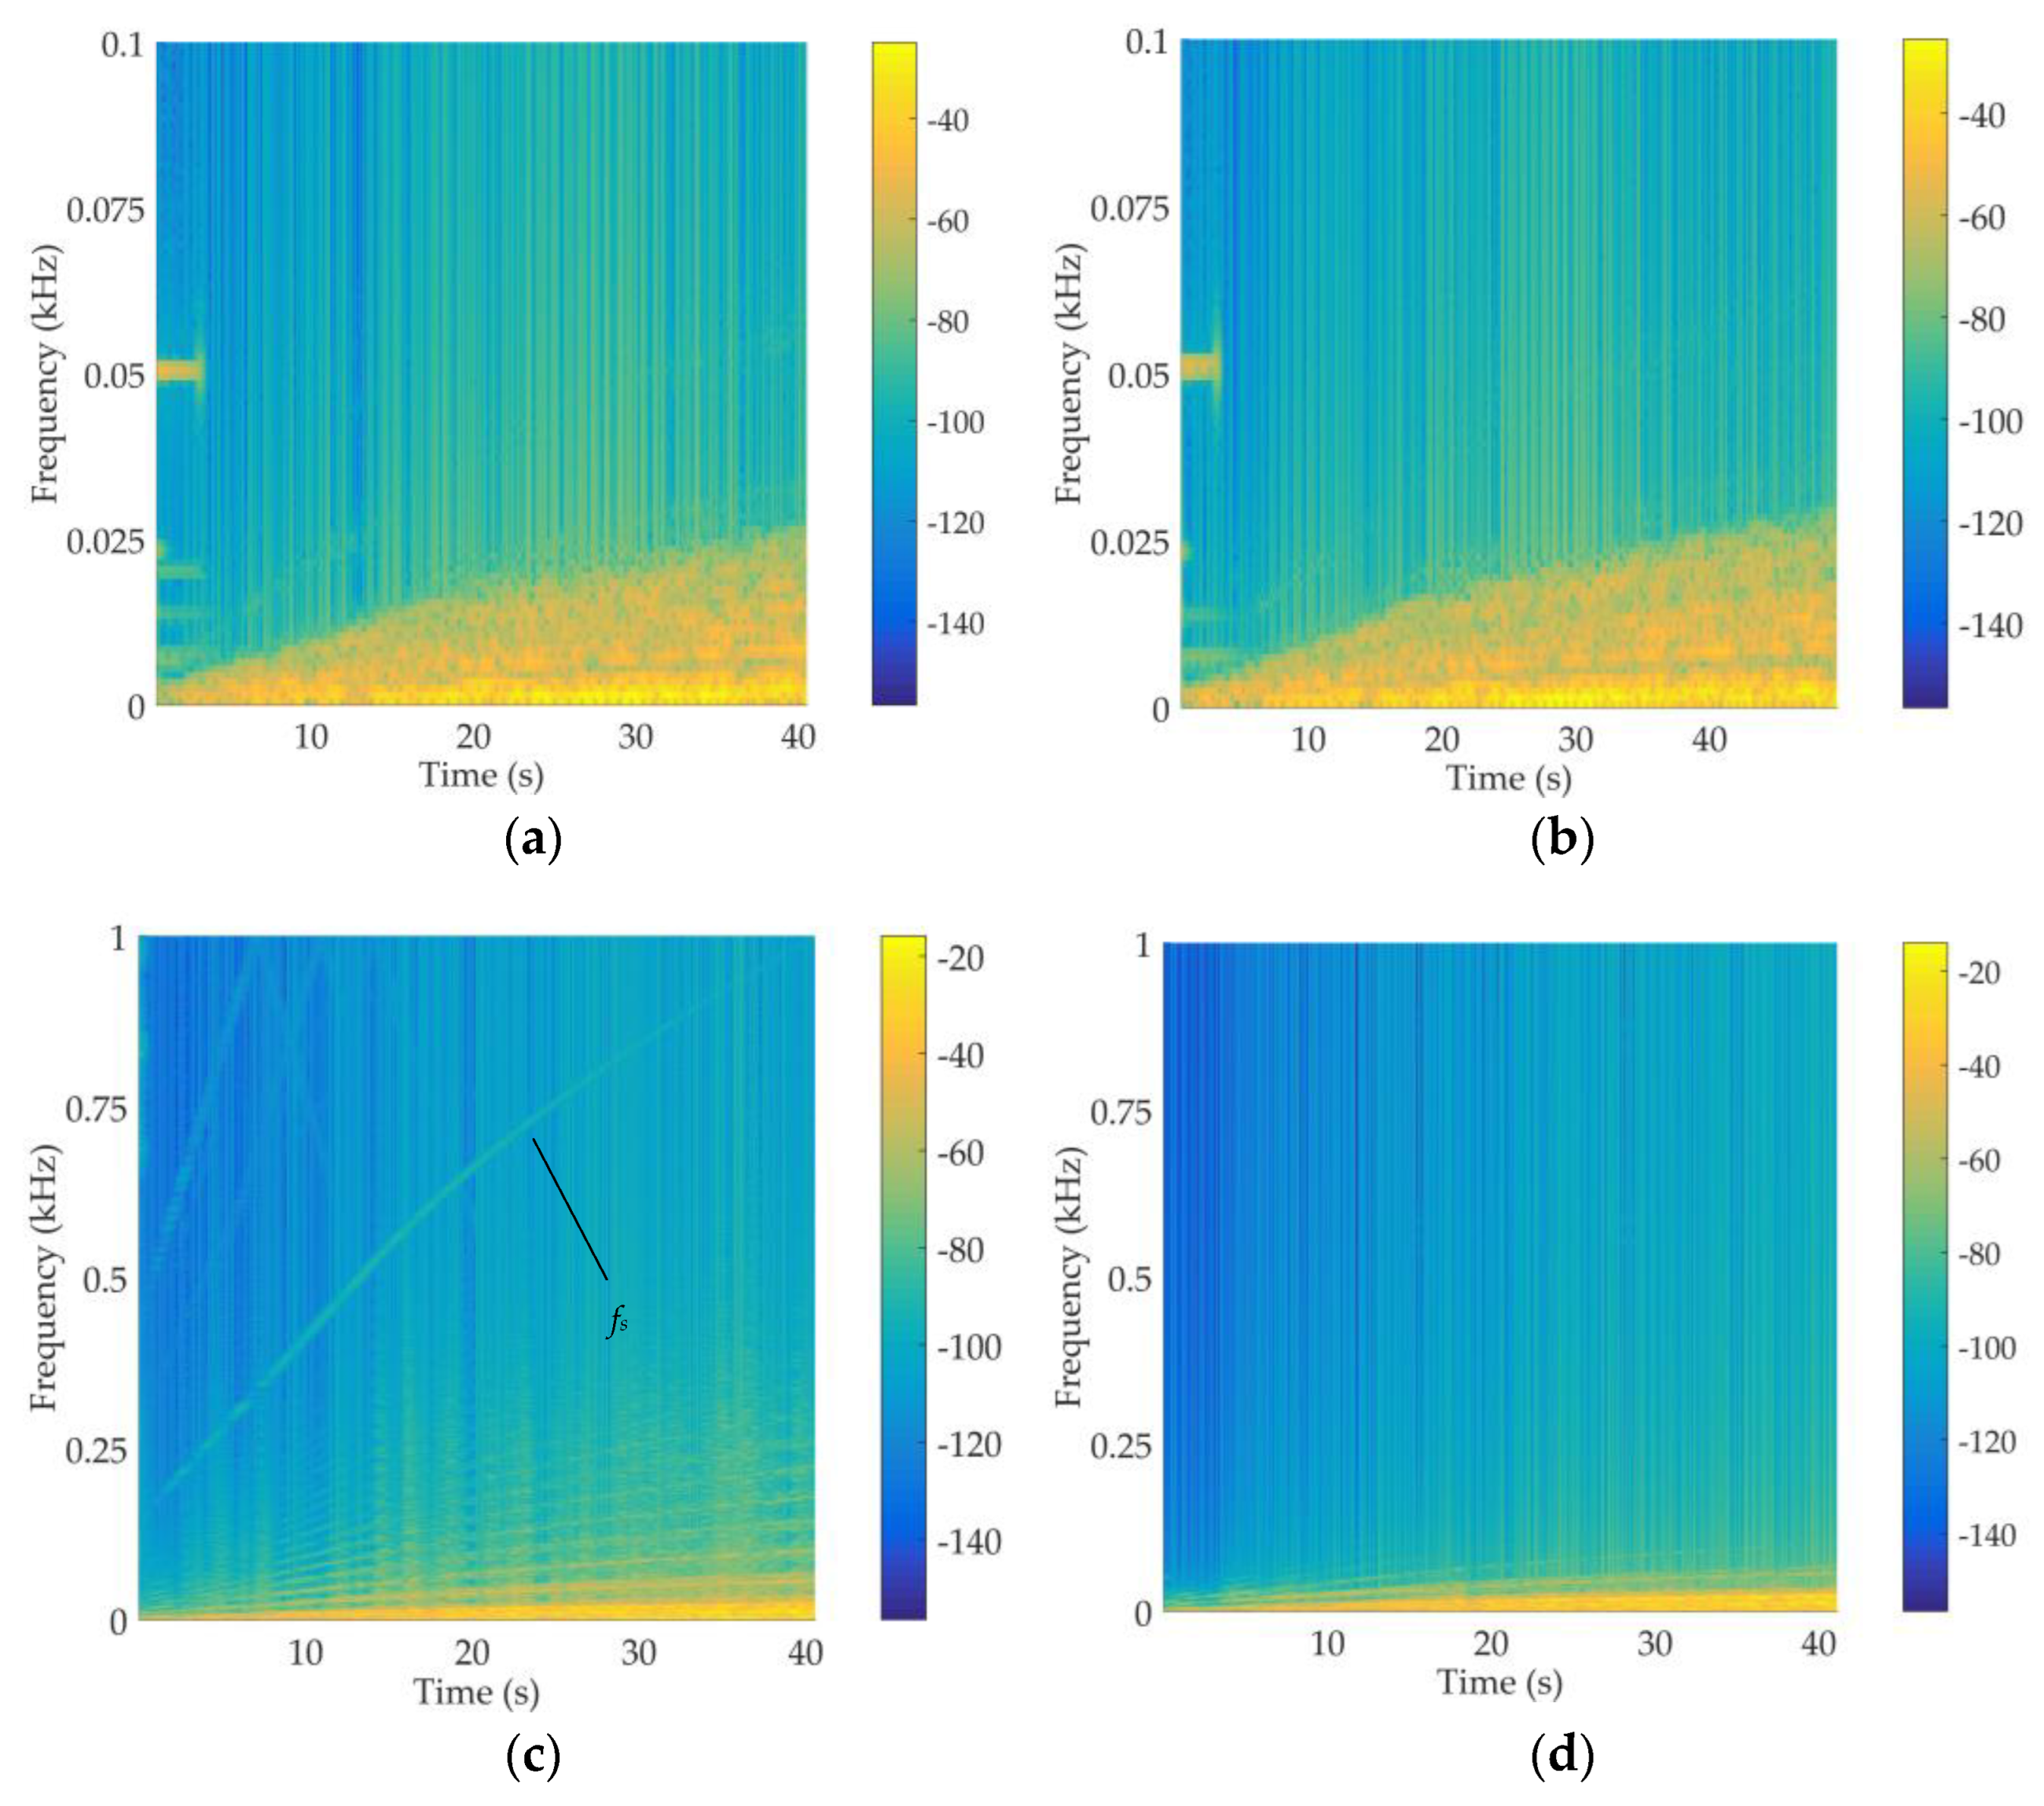
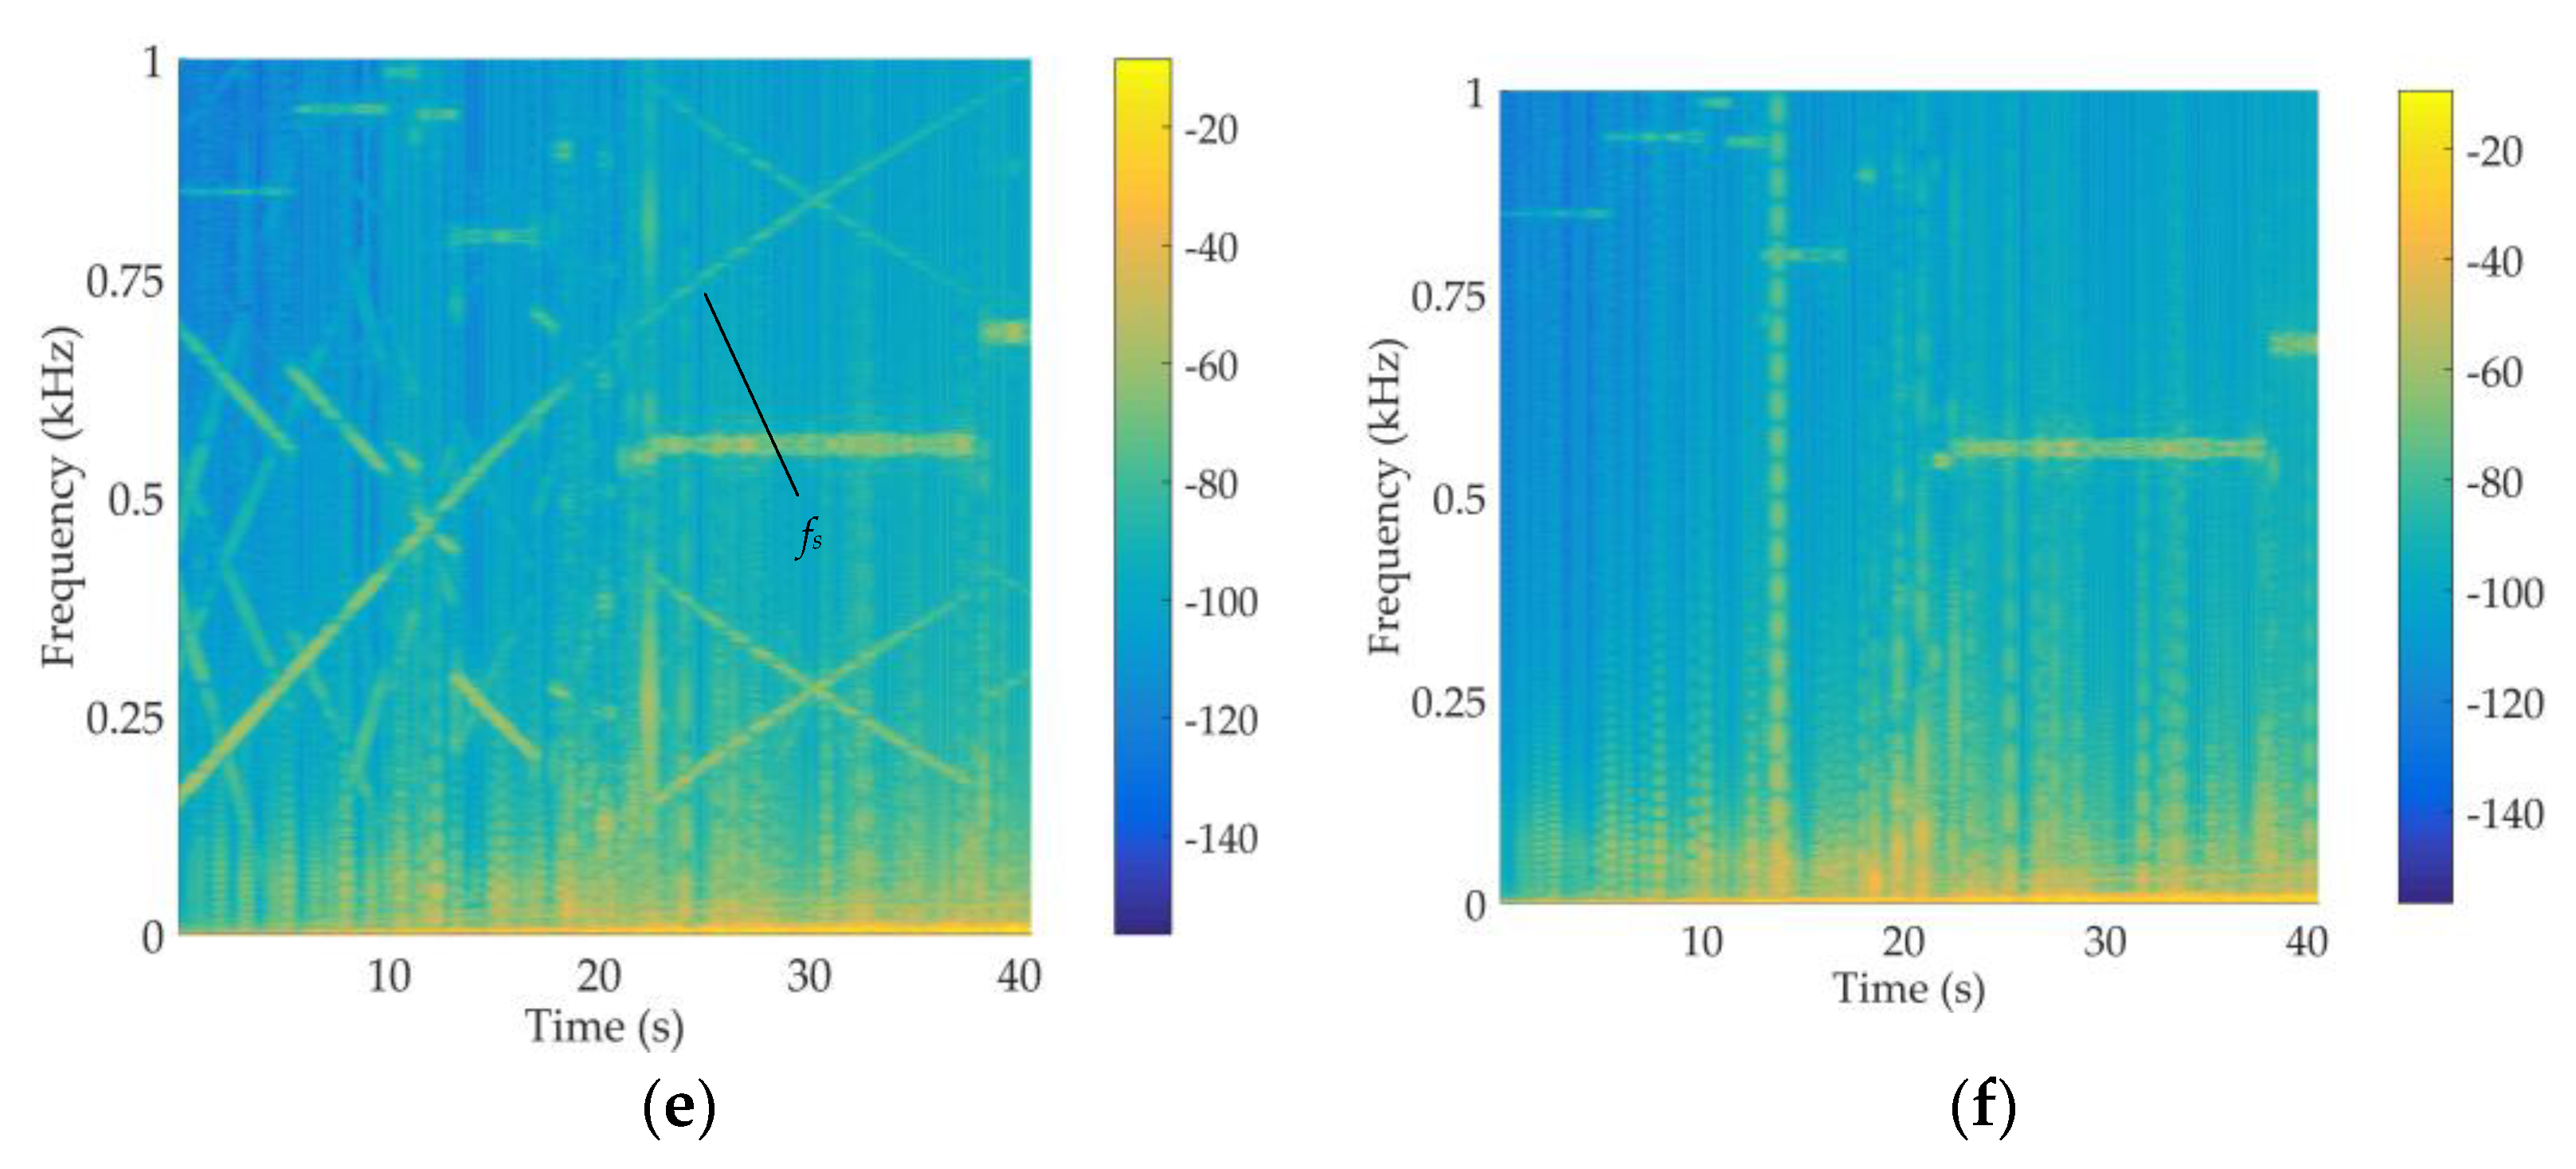
The traction transmission system will generate a large vertical vibration during operation, which will affect the vibration response of each component of the train. Therefore, it is also important to compare and study the vibration frequency of each component of the motor car and the trailer. A short-time Fourier transform is performed on the vibration signals of the car body, bogie frame and axle box of the two adjacent carriages M2 and T1, and the time–frequency diagrams are obtained [36,37], as shown in Figure 11 and Figure 12.
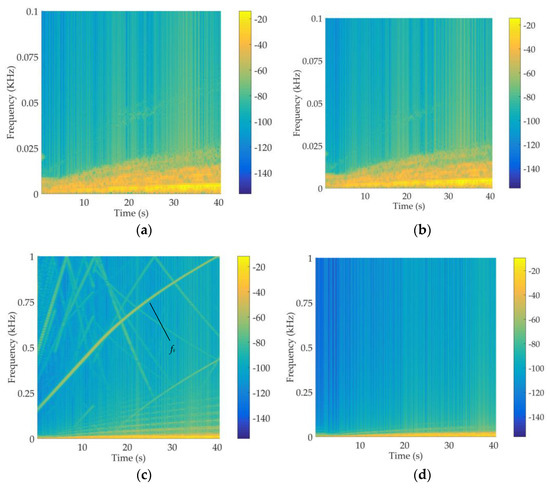
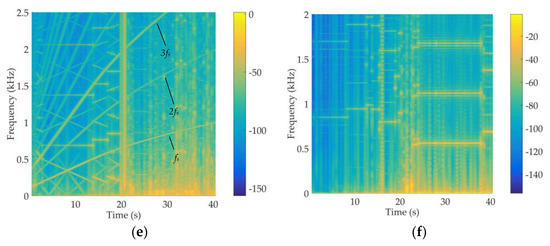
Figure 11.
Time–frequency diagram of the vertical vibration acceleration of the motor car and trailer: (a) car body of the motor car; (b) car body of the trailer; (c) bogie frame of the motor car; (d) bogie frame of the trailer; (e) wheelset of the motor car; and (f) wheelset of the trailer.
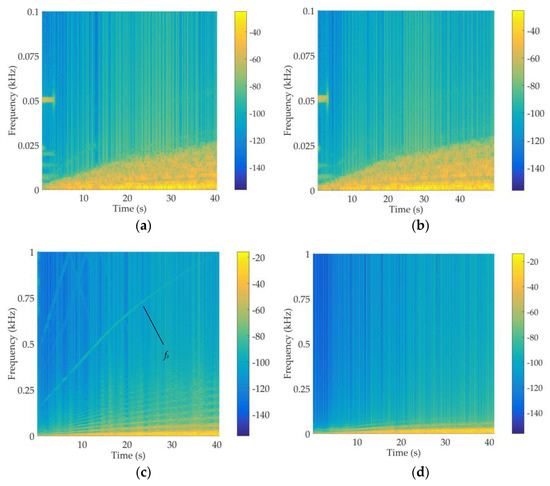
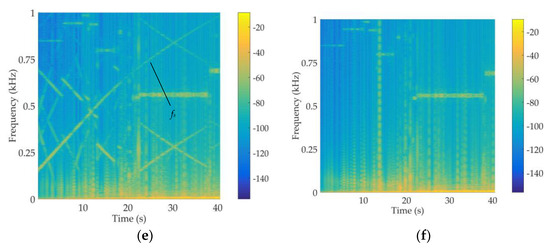
Figure 12.
Time–frequency diagram of the lateral vibration acceleration of the motor car and trailer: (a) car body of the motor car; (b) car body of the trailer; (c) bogie frame of the motor car; (d) bogie frame of the trailer; (e) wheelset of the motor car; and (f) wheelset of the trailer.
Figure 11 and Figure 12 show the time–frequency plots of the vertical and lateral vibration accelerations, respectively, of the M2 and T1 car bodies, bogie frames and wheelsets. There is an obvious energy bar for the vertical vibration and lateral vibration of the M2 car body, with a frequency band in the range of 0~25 Hz. This shows that the traction transmission system has little influence on the vibration frequency band of the motor car and trailer body. The vibration difference between the M2 and T1 bogie frames is obvious. The vertical vibration and lateral vibration energy bars of M2 are mainly concentrated in the ranges of 0~250 Hz and 0~300 Hz, and the meshing frequency of the gearbox can clearly be seen, indicating that the vibration of the gearbox will be obviously transmitted to the bogie frame. The energy bars of the vertical vibration and lateral vibration of the T1 bogie frame are mainly concentrated in 0~100 Hz. The vertical vibration and lateral vibration energy bars of the M2 and T1 wheel sets are mainly concentrated in the low-frequency range of 0~50 Hz. M2 clearly shows the meshing frequency and frequency multiplication of the gearbox, which is due to the hinge joint of the large gear and the axle. The vibration generated by the meshing of the gears will be directly passed to the wheelset. The meshing frequency of the gears is denoted by fs, the double frequency is denoted by 2fs, and the triple frequency is denoted by 3fs. The frequency multiplication response wheel-to-body octave response gradually decreases because of the gradual reduction in the effect of the nonlinear term generated by the nonlinear forces during the Fourier transform. The traction transmission system has a significant impact on the low-frequency vibration of the bogie frame, and the meshing frequency of the gearbox will be significantly transmitted to the bogie frame and the wheelset.
4.2.2. Stability Analysis
The evaluation of the train stability mainly refers to the vibration acceleration, vibration amplitude, vibration frequency and vibration duration of the train body. The running quality is determined by the parameters of the vehicle itself, which is the most widely used dynamic performance of trains in the world. Sperling index is one of the indicators to evaluate the train stability, so this index is also the running stability evaluation Chinese standard specified in GB/T 5599-2019.
The sperling index can be expressed as
where is the vibration acceleration, cm/s2; is the vibration frequency, Hz; and is a weighting factor that considers the sensitivity of the human body to various frequencies of vibration. Here, ≤ 2.5 is excellent grade, ≤ 2.75 is good grade and ≤ 3.0 is a pass grade.
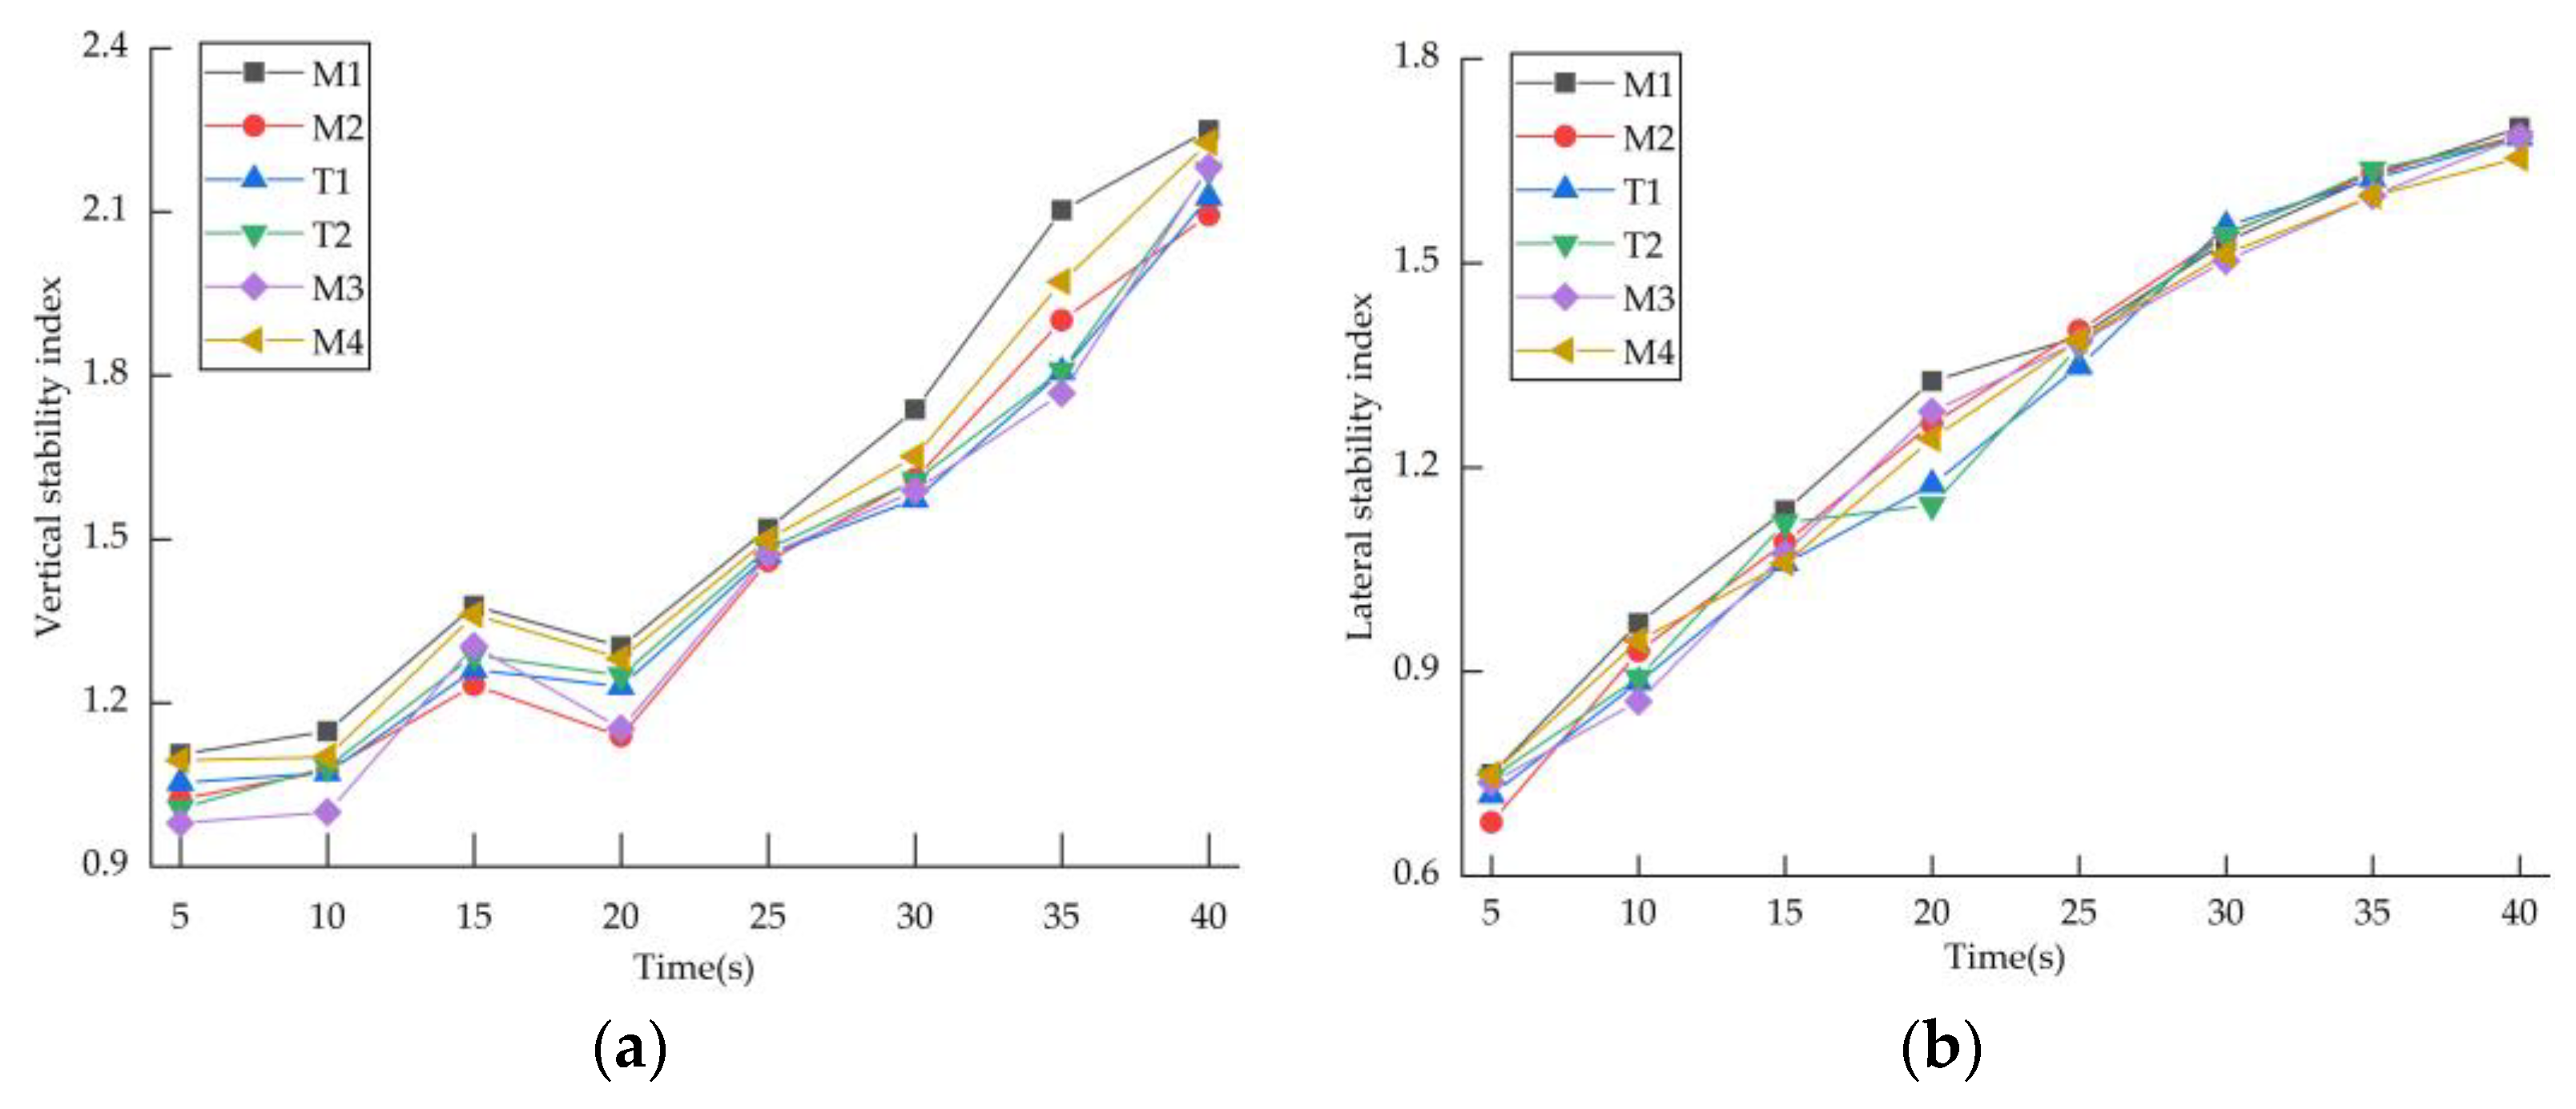
Figure 13 shows the vertical sperling index and the lateral sperling index of each car of the urban rail train during different time periods. In terms of the vertical sperling index, each carriage monotonically increases within 0~15 s and 20~40 s, and the value of the sperling index decreases within 15~20 s because the working condition of the traction motor changes from constant rotation during this time period. The torque area becomes a constant power area, and the torque output by the motor is reduced to optimize the sperling index of each carriage. With increasing vehicle speed, the influence caused by the traction motor gradually decreases, and the value of the stability index gradually increases. The change rate of the four motor cars within 15~20 s is greater than that of the two trailers, indicating that the traction motor has a greater impact on the EMU’s stability index. The value of the vertical sperling index of M1 is the largest, followed by M2, with variation ranges of 1.11~2.25 and 1.09~2.23, respectively. In terms of the lateral sperling index, the values of the lateral sperling index of all carriages monotonically increase, and the difference in the lateral sperling index values of the six carriages is small. The vertical sperling index and lateral sperling index of each car of the urban rail train are both less than 2.5, so the stability level of the urban rail train is excellent.
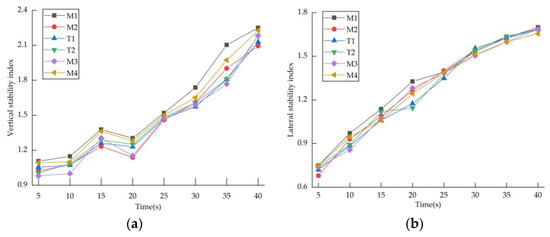
Figure 13.
Sperling index of the marshaling urban rail train: (a) vertical sperling index; and (b) lateral sperling index.
5. Conclusions
(1) When calculating the nonlinear critical speed of urban rail trains, the calculation results of a single car body are quite different from the calculation results of marshaling trains, and the calculation results of marshaling trains are more in line with the actual situation. Therefore, the calculation of the marshaling train model for subsequent simulations is more realistic.
(2) In terms of safety indicators, dynamic indicators such as the wheel–rail force, wheel load reduction rate and derailment coefficient of the motor cars are significantly larger than those of the trailers, indicating that the safety of the motor car is significantly worse than that of the front trailer. In terms of running stability, the difference between the motor car and the trailer is small, and the traction motor will obviously improve the stability of the train when it transitions between the constant torque zone and the constant power zone. In the four-section motor car, the dynamic performance of the first and last sections is poor. In a two-section trailer, the dynamics of the rear car are poor.
(3) In terms of vibration response, the difference in the amplitude of the vibration acceleration between the motor car and the trailer body is small, the vibration acceleration of the motor car bogie frame and wheelset is significantly higher than that of the trailer and the low-frequency vibration frequency of the motor car is significantly larger than that of the trailer, indicating that the traction transmission system has a significant impact on the train bogie frame. The time domain and time–frequency response of vibration have a great influence.
The establishment of the marshaling urban rail train model with a traction transmission system in this paper is of great significance for more accurately determining the dynamic performance of each carriage of the marshaling train and the influence of the traction transmission system on each carriage. The dynamic performance of the train is optimized to improve its dynamic performance, and it can also simplify the maintenance of the marshaled urban rail train in the later stage.
Author Contributions
Conceptualization, Y.Z. (Yichao Zhang) and J.W.; methodology, Y.Z. (Yichao Zhang) and J.Y.; software, Y.Z. (Yichao Zhang) and Y.Z. (Yue Zhao); validation, Y.Z. (Yichao Zhang), J.Y., J.W. and Y.Z. (Yue Zhao); formal analysis, Y.Z. (Yichao Zhang), J.W. and Y.Z. (Yue Zhao); investigation, Y.Z. (Yichao Zhang) and J.W.; resources, J.Y. and J.W.; data curation, Y.Z. (Yue Zhao); writing—original draft preparation, Y.Z. (Yichao Zhang); writing—review and editing, Y.Z. (Yichao Zhang), J.W. and Y.Z. (Yue Zhao); supervision, J.Y.; project administration, J.Y. and J.W.; funding acquisition, J.Y. and J.W. All authors have read and agreed to the published version of the manuscript.
Funding
This research was funded by the National Natural Science Foundation of China (grant numbers 52272385, 52205083), the Beijing Natural Science Foundation (grant numbers L211008, 3214042) and the Pyramid Talent Training Project of Beijing University of Civil Engineering and Architecture (grant number JDYC20220827).
Conflicts of Interest
The authors declare no conflict of interest.
References
- Peiffer, A.; Storm, S.; Röder, A.; Maier, R.; Frank, P.G. Active vibration control for high speed train bogies. Smart Mater. Struct. 2005, 14, 1. [Google Scholar] [CrossRef]
- Simson, S.A.; Cole, C. Simulation of curving at low speed under high traction for passive steering hauling locomotives. Veh. Syst. Dyn. 2008, 46, 1107–1121. [Google Scholar] [CrossRef]
- Ribeiro, D.; Cal Ada, R.; Delgado, R.; Brehm, M.; Zabel, V. Finite-element model calibration of a railway vehicle based on experimental modal parameters. Veh. Syst. Dyn. 2013, 51, 821–856. [Google Scholar] [CrossRef]
- Wang, M.Y.; Sheng, X.Z.; Li, M.X.; Li, Y.G. Estimation of vibration powers flowing to and out of a high-speed train bogie frame assisted by time-domain response reconstruction. Appl. Acoust. 2022, 185, 108390. [Google Scholar] [CrossRef]
- Ling, L.; Li, W.; Foo, E.; Wu, L.; Wen, Z.F.; Jin, X.S. Investigation into the vibration of metro bogies induced by rail corrugation. Chin. J. Mech. Eng. 2017, 30, 93–102. [Google Scholar] [CrossRef]
- Yang, J.W.; Zhao, Y.; Wang, J.H.; Liu, C.D.; Bai, Y.L. Influence of wheel flat on railway vehicle helical gear system under Traction/Braking conditions. Eng. Fail. Anal. 2022, 134, 106022. [Google Scholar] [CrossRef]
- Yang, J.W.; Sun, R.; Yao, D.C.; Wang, J.H.; Liu, C. Nonlinear Dynamic Analysis of high speed multiple units Gear Transmission System with Wear Fault. Mech. Sci. 2019, 10, 187–197. [Google Scholar] [CrossRef]
- Wang, J.H.; Yang, J.W.; Lin, Y.L.; He, Y.P. Analytical investigation of profile shifts on the mesh stiffness and dynamic characteristics of spur gears. Mech. Mach. Theory 2022, 167, 104529. [Google Scholar] [CrossRef]
- Wang, J.H.; Yang, J.W.; Li, Q. Quasi-static analysis of the nonlinear behavior of a railway vehicle gear system considering time-varying and stochastic excitation. Nonlinear Dynam. 2018, 93, 463–485. [Google Scholar] [CrossRef]
- Wang, J.H.; Yang, J.W.; Bai, Y.L.; Zhao, Y.; He, Y.P.; Yao, D.C. A comparative study of the vibration characteristics of railway vehicle axlebox bearings with inner/outer race faults. Proc. Inst. Mech. Eng. F-J. Rail Rapid Transit 2021, 235, 1035–1047. [Google Scholar] [CrossRef]
- Zhang, K.; Yang, J.W.; Liu, C.D.; Wang, J.H.; Yao, D.C. Dynamic Characteristics of a Traction Drive System in High-Speed Train Based on Electromechanical Coupling Modeling under Variable Conditions. Energies 2022, 15, 1202. [Google Scholar] [CrossRef]
- Li, M.; Liu, Q.; Zhu, S.; Ai, S.; Chen, W.; Zhu, R. Contribution analysis of vibration transmission path of planetary reducer box based on velocity involvement loss. J. Low Freq. Noise Vib. Act. Control 2022, 42, 39–53. [Google Scholar] [CrossRef]
- Zhang, T.; Jin, T.M.; Zhou, Z.W.; Chen, Z.G.; Wang, K.Y. Dynamic modeling of a metro vehicle considering the motor-gearbox transmission system under traction conditions. Mech. Sci. 2022, 13, 603–617. [Google Scholar] [CrossRef]
- Wang, Z.W.; Cheng, Y.; Mei, G.M.; Zhang, W.H.; Huang, G.H.; Yin, Z.H. Torsional vibration analysis of the gear transmission system of high-speed trains with wheel defects. Proc. Inst. Mech. Eng. F-J. Rail Rapid Transit 2020, 234, 123–133. [Google Scholar] [CrossRef]
- Chen, Z.G.; Zhai, W.M.; Wang, K.Y. A locomotive-track coupled vertical dynamics model with gear transmissions. Veh. Syst. Dyn. 2017, 55, 244–267. [Google Scholar] [CrossRef]
- Chen, Z.G.; Zhai, W.M.; Wang, K.Y. Dynamic investigation of a locomotive with effect of gear transmissions under tractive conditions. J. Sound Vib. 2017, 408, 220–233. [Google Scholar] [CrossRef]
- Chen, Z.G.; Zhai, W.M.; Wang, K.Y. Locomotive dynamic performance under traction/braking conditions considering effect of gear transmissions. Veh. Syst. Dyn. 2018, 56, 1097–1117. [Google Scholar] [CrossRef]
- Zhang, T.; Chen, Z.G.; Zhai, W.M.; Wang, K.Y.; Wang, H. Effect of the drive system on locomotive dynamic characteristics using different dynamics models. Sci. China Technol. Sc. 2019, 62, 308–320. [Google Scholar] [CrossRef]
- Wang, J.H.; Yang, J.W.; Zhao, Y.; Bai, Y.L.; He, Y.P. Nonsmooth Dynamics of a Gear-Wheelset System of Railway Vehicles Under Traction/Braking Conditions. J. Comput. Nonlin. Dyn. 2020, 15, 081003. [Google Scholar] [CrossRef]
- Zhou, Z.W.; Chen, Z.G.; Spiryagin, M.; Wolfs, P.; Wu, Q.; Zhai, W.M.; Cole, C. Dynamic performance of locomotive electric drive system under excitation from gear transmission and wheel-rail interaction. Veh. Syst. Dyn. 2022, 60, 1806–1828. [Google Scholar] [CrossRef]
- Zhou, Z.W.; Chen, Z.G.; Spiryagin, M.; Arango, E.B.; Wolfs, P.; Cole, C.; Zhai, W.M. Dynamic response feature of electromechanical coupled drive subsystem in a locomotive excited by wheel flat. Eng. Fail. Anal. 2021, 122, 105248. [Google Scholar] [CrossRef]
- Wang, Z.W.; Mei, G.M.; Xiong, Q.; Yin, Z.H.; Zhang, W.H. Motor car-track spatial coupled dynamics model of a high-speed train with traction transmission systems. Mech. Mach. Theory 2019, 137, 386–403. [Google Scholar] [CrossRef]
- Zhang, T.; Chen, Z.G.; Zhai, W.M.; Wang, K.Y. Establishment and validation of a locomotive-track coupled spatial dynamics model considering dynamic effect of gear transmissions. Mech. Syst. Signal Process. 2019, 119, 328–345. [Google Scholar] [CrossRef]
- Wang, J.G.; He, G.Y.; Zhang, J.; Zhao, Y.X.; Yao, Y. Nonlinear dynamics analysis of the spur gear system for railway locomotive. Mech. Syst. Signal Process. 2017, 85, 41–55. [Google Scholar] [CrossRef]
- Huang, G.H.; Xu, S.S.; Zhang, W.H.; Yang, C.J. Super-harmonic resonance of gear transmission system under stick-slip vibration in high-speed train. J. Cent. South Univ. 2017, 24, 726–735. [Google Scholar] [CrossRef]
- Kia, S.H.; Henao, H.; Capolino, G.A. Mechanical health assessment of a railway traction system. In Proceedings of the MELECON 2008—The 14th IEEE Mediterranean Electrotechnical Conference, Ajaccio, France, 5–7 May 2008. [Google Scholar]
- Huang, G.H.; Zhou, N.; Zhang, W.H. Effect of internal dynamic excitation of the traction system on the dynamic behavior of a high-speed train. Proc. Inst. Mech. Eng. Part F J. Rail Rapid Transit 2016, 230, 1899–1907. [Google Scholar] [CrossRef]
- Chen, Z.W.; Zhu, G. Dynamic evaluation on ride comfort of metro vehicle considering structural flexibility. Arch. Civ. Mech. Eng. 2021, 21, 162. [Google Scholar] [CrossRef]
- Pradhan, S.; Samantaray, A.K. Integrated modeling and simulation of vehicle and human multi-body dynamics for comfort assessment in railway vehicles. J. Mech. Sci. Technol. 2018, 32, 109–119. [Google Scholar] [CrossRef]
- Belforte, P.; Cheli, F.; Diana, G.; Melzi, S. Numerical and experimental approach for the evaluation of severe longitudinal dynamics of heavy freight trains. Veh. Syst. Dyn. 2008, 46, 937–955. [Google Scholar] [CrossRef]
- Tao, G.Q.; Liu, M.Q.; Xie, Q.L.; Wen, Z.F. Wheel-rail dynamic interaction caused by wheel out-of-roundness and its transmission between wheelsets. Proc. Inst. Mech. Eng. Part F J. Rail Rapid Transit 2022, 236, 247–261. [Google Scholar] [CrossRef]
- Wu, Q.; Luo, S.; Wei, C.; Ma, W. Dynamics simulation models of coupler systems for freight locomotive. J. Traffic Transp. Eng. 2012, 12, 37–43. [Google Scholar]
- Ding, H.; Zhu, T.; Xiao, S.; Yang, G.; Yang, B.; Lv, R. Study on the collision characteristics of a subway coupler. Int. J. Crashworthines 2022, 1–15. [Google Scholar] [CrossRef]
- Yadav, O.P.; Vyas, N.S. Influence of slack of automatic AAR couplers on longitudinal dynamics and jerk behaviour of rail vehicles. Veh. Syst. Dyn. 2022, 1–21. [Google Scholar] [CrossRef]
- Zou, R.M.; Luo, S.H.; Ma, W.H.; Wu, Q. Dynamic Characteristics of Metro Trains under Rescue Conditions. Shock Vib. 2020, 2020, 8869605. [Google Scholar] [CrossRef]
- Lee, S.; Yu, H.; Yang, H.; Song, I.; Choi, J.; Yang, J.; Lim, G.; Kim, K.S.; Choi, B.; Kwon, J. A Study on Deep Learning Application of Vibration Data and Visualization of Defects for Predictive Maintenance of Gravity Acceleration Equipment. Appl. Sci. 2021, 11, 1564. [Google Scholar] [CrossRef]
- Patil, S.; Pardeshi, S.; Patange, A. Health Monitoring of Milling Tool Inserts Using CNN Architectures Trained by Vibration Spectrograms. Comput. Model. Eng. Sci. 2023, 136, 177–199. [Google Scholar] [CrossRef]
Disclaimer/Publisher’s Note: The statements, opinions and data contained in all publications are solely those of the individual author(s) and contributor(s) and not of MDPI and/or the editor(s). MDPI and/or the editor(s) disclaim responsibility for any injury to people or property resulting from any ideas, methods, instructions or products referred to in the content. |
© 2023 by the authors. Licensee MDPI, Basel, Switzerland. This article is an open access article distributed under the terms and conditions of the Creative Commons Attribution (CC BY) license (https://creativecommons.org/licenses/by/4.0/).

