Article

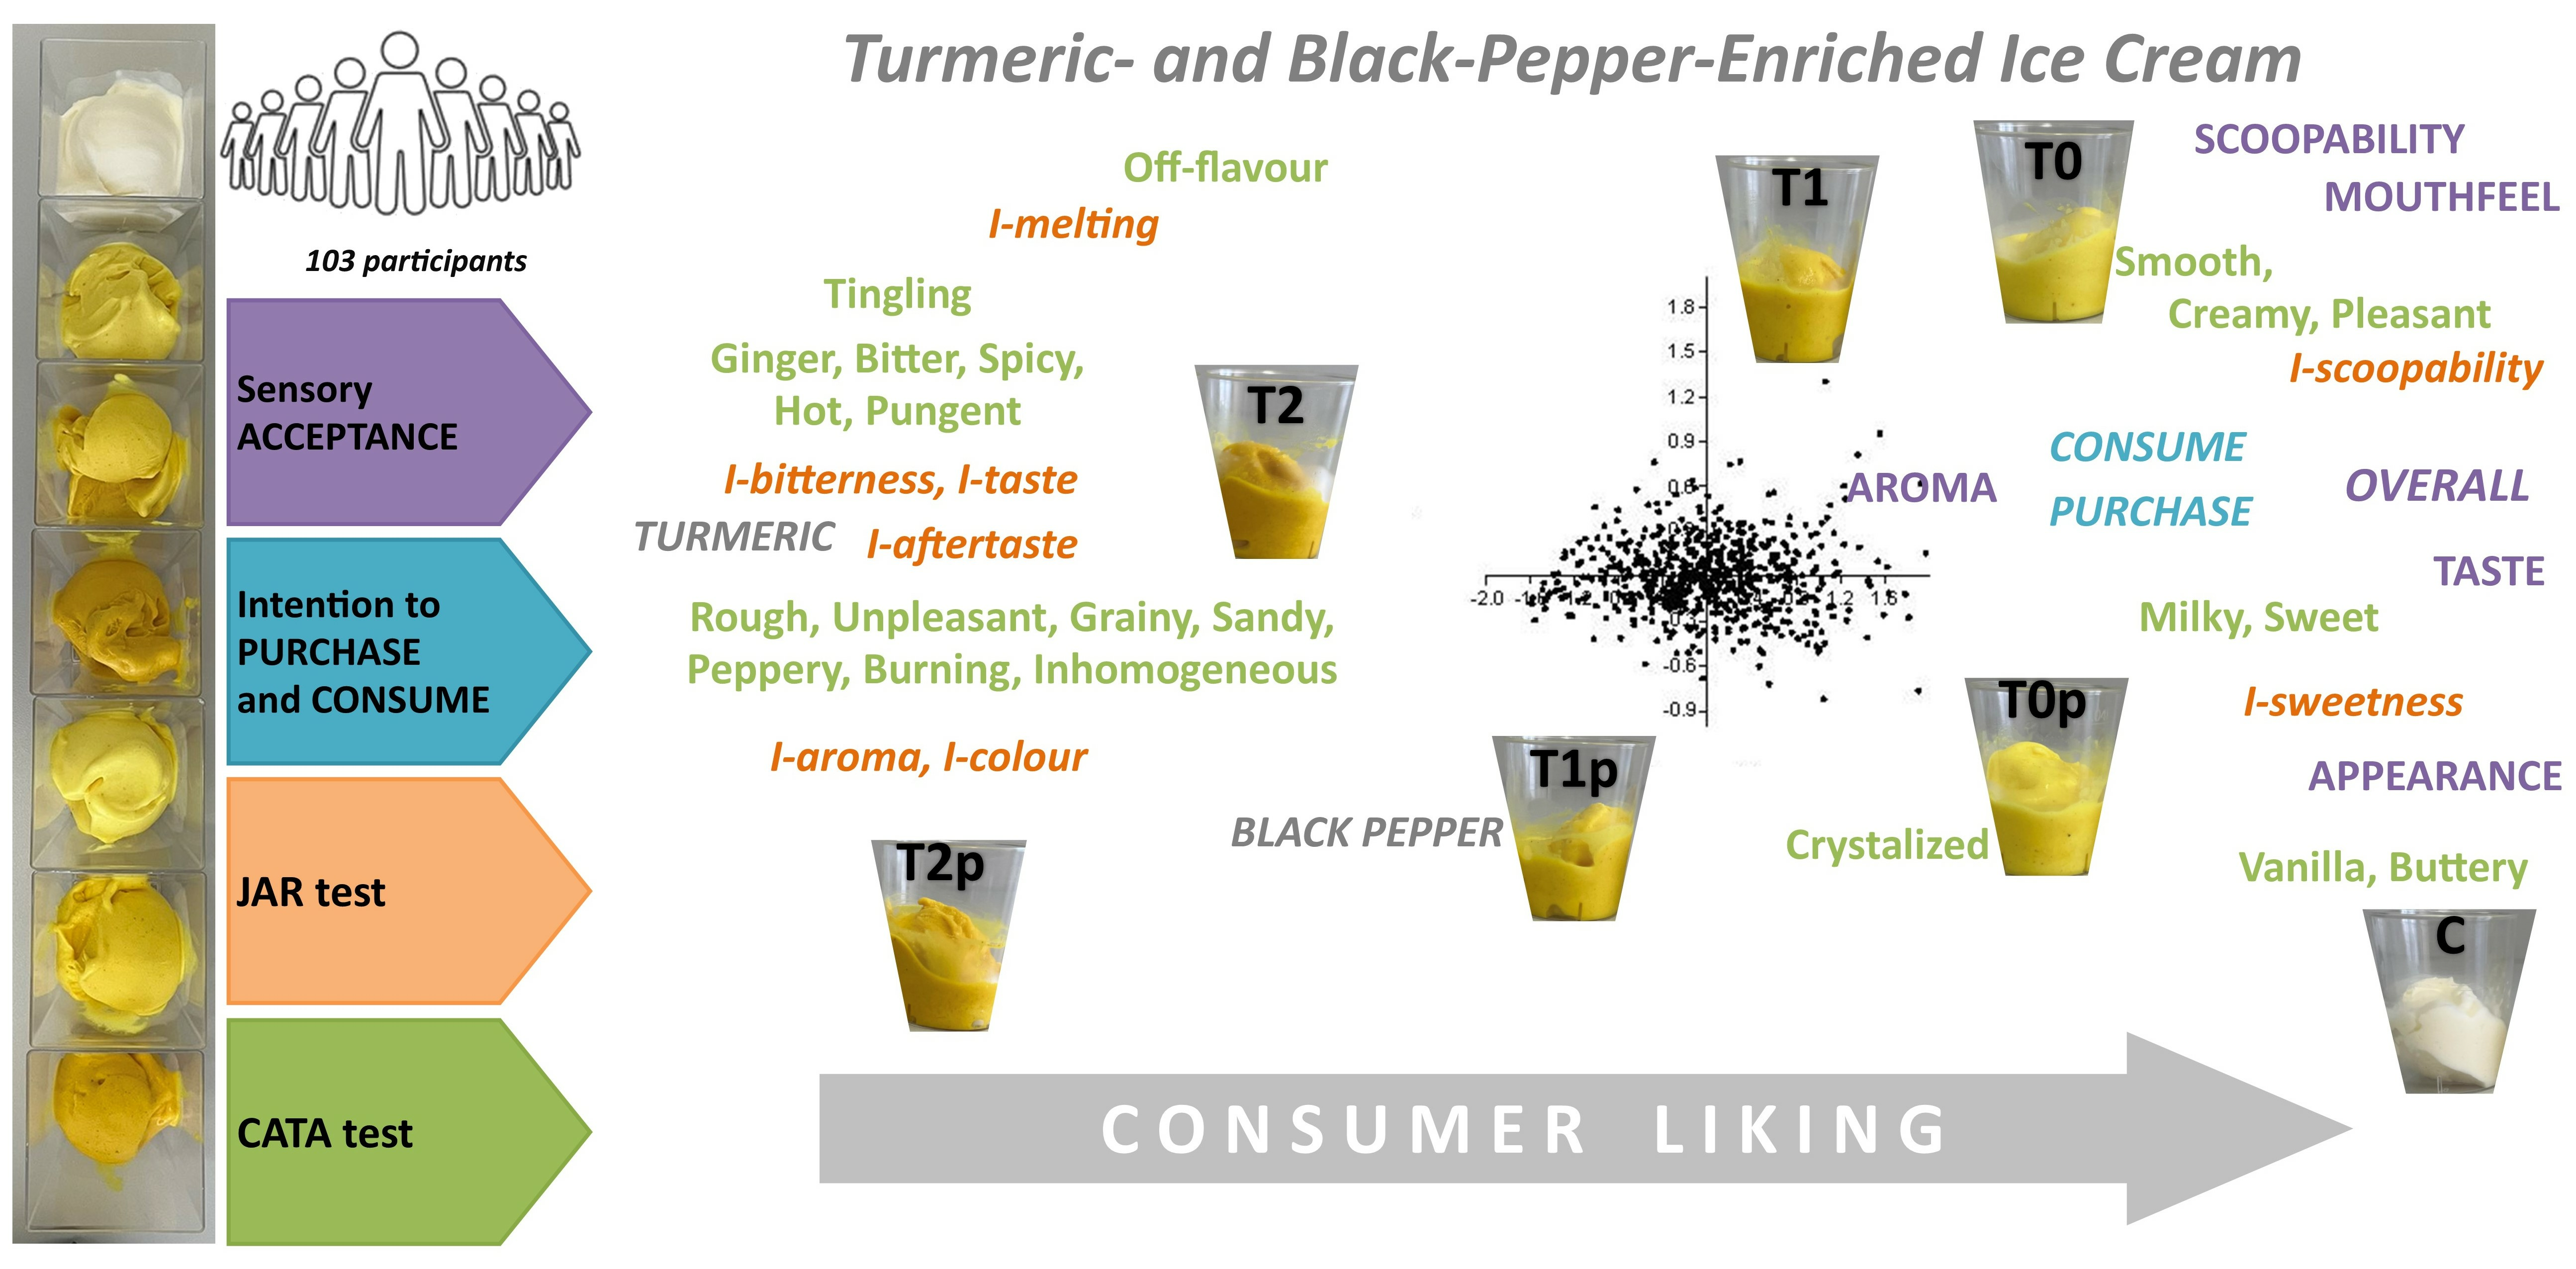
Sensory Acceptance and Characterisation of Turmeric- and Black-Pepper-Enriched Ice Cream

Faculty of Food Technology Osijek, Josip Juraj Strossmayer University of Osijek, Franje Kuhača 18, 31000 Osijek, Croatia
*
Author to whom correspondence should be addressed.
Appl. Sci. 2023, 13(21), 11802; https://doi.org/10.3390/app132111802
Submission received: 29 September 2023 / Revised: 21 October 2023 / Accepted: 26 October 2023 / Published: 28 October 2023
(This article belongs to the Special Issue Sensory Characteristics and Consumers Acceptance of Food Products)

Abstract

:
This study investigated the sensory characteristics and overall acceptability of turmeric- and black-pepper-enriched ice creams. For this purpose, a control sample (C) and a series of flavoured ice creams were prepared as follows: samples with 0.5%, 1.0%, and 2.0% of turmeric powder (T0, T1, and T2), and samples with a mixture of turmeric (0.5%, 1.0%, and 2.0%), and 0.02% of black pepper (T0p, T1p, and T2p). Participants (n = 103) were asked to rate the acceptability of the ice creams using a nine-point hedonic scale, the liking of attributes by a five-point scale, the evaluation of attributes intensity by a just-about-right (JAR) scale, and attribute characterisation through a CATA test. They were also asked about their purchase and consumption intention of prepared ice cream samples. The addition of turmeric powder significantly (p < 0.05) affected the sensory properties of the ice cream, whereas no correlation was found between the addition of black pepper and consumers’ ratings of the evaluated samples. According to the results, besides the control sample, the ice cream with 0.5% of turmeric powder and 0.02% black pepper (T0p) had the most desired attributes and the highest score for overall liking (6.94). In conclusion, these valuable spices could be used in the production of ice cream with potential functional properties.

Graphical Abstract

1. Introduction

Ice cream is a very popular frozen dessert mostly consisting of milk, sweeteners, hydrocolloids and emulsifiers, flavouring, and colouring agents. More precisely, it is a complex medium of dispersed air, fat globules, ice crystals, and a continuous aqueous phase that contains dissolved lactose and mineral salts, and suspended polysaccharides and proteins. From a nutritional point of view, ice cream is rich in valuable milk proteins, lactose, and milk fat. Therefore, its consumption provides a great number of calories, but it is poor in natural antioxidants, phenols, and pigments [1,2,3].
The reason for its popularity lies in its nutritional value and refreshing perception during consumption [4,5,6,7,8]. According to Research and Markets [9], the average consumption of ice cream across Europe is 6.20 L per/capita each year, while the average American eats about 10 kg of ice cream per year [10]. Thus, ice cream is an excellent carrier for the distribution of functional ingredients to human organisms [3]. Furthermore, it is of interest to explore the modification of ice cream ingredients and the addition of various additives in the ice cream formulation in order to highlight their health benefits and improve sensory properties. In terms of ice cream fortification, different ingredients and bioactive compounds were used [11,12,13,14,15,16]. In this study, turmeric and black pepper were used as ice cream fortificants.
Turmeric (Curcuma longa) is a herbaceous evergreen plant belonging to the Zingiberaceae (ginger) family, commonly used in India, China, and Southeast Asia as a spice, food preservative, and colouring agent [17]. Due to the presence of polyphenol curcumin (diferuloylmethane), turmeric exhibits several health properties, such as anti-inflammatory, antioxidant, hepatoprotective, antidiabetic, antibacterial, and anticarcinogenic properties [17,18,19]. Unfortunately, curcumin is poorly absorbed due to its rapid metabolism in the liver and intestinal wall, which limits its medicinal efficiency. To overcome these issues, numerous methods have been recently described [20,21].
Black pepper (Piper nigrum) is a flowering vine extracted from the core of a pepper plant and is used as a spice all around the world. Black pepper belongs to the family Piperaceae, genus Piper and species Piper nigrum. This spice with its characteristic aroma and spicy taste is rich in alkaloids (piperine), terpenes, lignans, and phenylpropanoids. Based on this, it possesses great biological activities, such as antioxidant and radical-scavenging properties, antimicrobial, anti-inflammatory, and analgesic properties, as well as hepatoprotective activity [22,23].
Besides its functional properties, it is reported that piperine from black pepper enhances the bioavailability of curcumin by 2000% [24]. The incorporation of turmeric and black pepper in ice cream formulation could potentially affect its sensory attributes and that could have an effect on consumer preferences of the ice cream.
To better understand consumer preferences, there are several methods for conducting sensory analysis. Hedonic scales, especially nine-point hedonic scales, are used to evaluate the degree of liking on a scale. Another often-used scale is the just-about-right (JAR) scale. This test is used in order to measure if an attribute is present in a product at a level that is too high, too low, or if it is “just about right” [25]. The CATA (check-all-that-apply) method is utilised for the sensory description of food through a list of descriptors from which participants should check all that describe the tested product [26].
Some studies have assessed the potential use of turmeric powder in dairy products, such as paneer [27], ghee [28], yogurt [29,30,31,32,33,34], and milk [35]. Despite this, to the best of our knowledge, there is a lack of literature on the use of turmeric powder for ice cream production, and the consumer perception of turmeric-flavoured ice cream is still unexplained. In this regard, this study aimed to determine the effect of turmeric powder and black pepper combined with turmeric on consumers’ liking and the sensory properties of fortified ice cream. The participants evaluated their liking of samples and sensory attributes using hedonic scales, just-about-right (JAR) scaling, the characterisation of products using check-all-that-apply (CATA) questions and open-ended questions, and finally the intention of purchase and willingness to consume.

2. Materials and Methods

2.1. Materials

UHT milk containing 2.8% milk fat (Vindija d.d. Varaždin, Croatia), UHT cream containing 33.0% milk fat (Dukat d.d. Zagreb, Croatia), skim milk powder containing a maximum of 1.5% milk fat (Dukat d.d. Zagreb, Croatia), sucrose (Viro d.d. Zagreb, Croatia), turmeric powder and black pepper (Nutrigold, Zagreb, Croatia) were purchased from a local grocery store. Soy lecithin was obtained from BDH Prolabo (VWR International GmbH, Darmstadt, Germany), and guar gum was supplied from Sigma-Aldrich (Saint Louis, MO, USA).

2.2. Preliminary Study

An initial study was conducted to estimate acceptable levels of turmeric and black pepper in ice cream production and to select appropriate JAR and CATA terms. Preliminary screening tests were performed by 7 trained participants consisting of PhD students and staff from the Faculty of Food Technology Osijek, Josip Juraj Strossmayer University of Osijek, Croatia.

2.2.1. Development of Flavoured Ice Cream Formulations

Nine-point hedonic scale ranging from 1 for “dislike extremely” to 9 for “liked extremely” was used for the evaluation of ice cream acceptance.
In the preliminary study ice cream mixes (including the control sample) were initially prepared with 0.25%, 0.5%, 1.0%, 2.0%, 3.0%, and 5.0% turmeric powder. For further study, three levels of turmeric powder were selected by a trained sensory panel (N = 7) based on acceptability as follows: 0.5%, 1.0%, and 2.0%. A higher proportion of turmeric powder (3.0% and 5.0%) was found undesirable due to its over-intense taste and colour, and the lowest proportion (0.25%) had no major impact on evaluating properties; therefore, it was omitted from further research.
To optimise the black pepper proportion in ice cream, it was added to selected turmeric-enriched samples (0.5%, 1.0%, and 2.0%) at concentrations of 0.01%, 0.02%, and 0.03%, as shown in Figure S1. Nine samples of ice cream were evaluated by trained participants, and the results indicated that the optimal concentration for functional ice cream production with turmeric powder is the addition of 0.02% of black pepper, with a pleasant aftertaste. The overall acceptability of the sample with 0.03% of black pepper was poor, with a too-intense black pepper flavour and too-strong aftertaste, while the one with 0.01% did not differ in attributes from the sample without black pepper. Therefore, seven samples were selected for further consumer testing: standard milk ice cream (control), three turmeric-flavoured samples (0.5%, 1.0%, and 2.0%), and three turmeric-flavoured samples with the addition of black pepper (0.02%) shown in Table 1.

2.2.2. Pre-Selection of JAR and CATA Terms

The same trained panel proposed JAR and CATA terms for consumer testing based on a review of the literature [36,37,38,39,40,41,42] and on the preliminary sensory results. After an extensive review of literature that deals with the questions of sensory characteristics of ice creams, turmeric powder, and black pepper, an initial list of sensory attributes for JAR and CATA test was compiled. As the most commonly used, the JAR scale with 5 points was selected. Categories were labelled as too weak, slightly weak, ideal (just about right), slightly strong, and too strong.
To generate a list of terms, four samples of ice cream selected in the initial study with the highest and lowest turmeric concentrations, with and without black pepper (T0, T2, T0p, and T2p), were presented to the group. During pilot testing and after analysing the results, minor corrections in the initial list of attributes were carried out. The final questionnaire was obtained after repeating twice.
For the JAR test, 8 sensory attributes that can affect the overall acceptance of ice cream were selected, as follows: colour, scoopability, melting, taste, sweetness, aftertaste, bitterness, and aroma.
The final CATA list contained 24 terms divided into three groups, texture and appearance, taste and aroma, and mouthfeel, as shown in Table 2.

2.3. Ice Cream Production

Ice cream mixes were prepared according to the formulations developed in this study: basic ice cream mixture containing 53.5% UHT milk, 25.5% cream, 5.5% skim milk powder, 15.0% sucrose, 0.3% soy lecithin, and 0.2% guar gum. Ice cream mixes were manufactured according to Goff [43] with slight modifications. Liquid ingredients, i.e., milk and cream, were mixed and heated to 40 °C. Then, dry ingredients (skim milk powder, sucrose, soy lecithin, and guar gum) were mixed and added to the heated liquid mix. The mixture was homogenised using an IKA T 18 basic ULTRA-TURRAX homogeniser (IKA®-Werke GmbH & Co. KG, Staufen, Germany) at 3500 rpm for 3 min. Ice cream mixes were heated to 75 °C, and then turmeric powder (and black pepper in three samples) was added according to the formulation shown in Table 1. After pasteurisation at 80 °C for 25 s, the mixes were kept to mature at 4 °C for 24 h. Seven ice cream mixes (1.3 kg) were prepared in triplicate. The freezing/airing process was conducted in a batch ice cream maker (GELATO 5K CREA i-Green, Nemox, Italy) at −7 ± 1 °C for 20–25 min. Ice cream was sealed in plastic bags and hardened at −18 °C at least 24 h before sensory analysis.

2.4. Sensory Analysis

This research was approved by the Ethics Committee of the Faculty of Food Technology Osijek, Josip Juraj Strossmayer University of Osijek, Croatia (Class number 602-04/23-08/01). In addition, participants signed an informed consent form and reported no known food allergies. The sociodemographic characteristics of participants were also collected.

2.4.1. Participants

Sensory evaluation was conducted by 103 untrained participants, including visitors, students, and staff at the Faculty of Food Technology Osijek, Josip Juraj Strossmayer University of Osijek, Croatia in February, and April, and September 2023. The selection criteria for participation in the study were that they were regular ice cream consumers and had no known allergic reactions towards turmeric and black pepper.
In this study, the participating consumers’ age ranged between 19 and 57 years old, comprising 69 females and 34 males. All participants in this research were frequent consumers of ice cream: more than 60% of participants consumed ice cream at least several times a month during the season, and almost 40% consumed it more than once a week.

2.4.2. Experimental Procedure

The ice cream samples were removed from the freezer (−18 °C) before the evaluation and tempered at room temperature for 5 to 10 min before serving to reach −12 °C. Ice cream samples were presented in transparent 40 mL plastic cups (Figure 1) labelled with random 3-digit codes. The participants were provided with crackers and water to rinse their mouths between sample degustation. To avoid palate saturation, sensory evaluation was performed in three separate sessions with short breaks: (a) the evaluation of control sample, (b) the evaluation of samples with turmeric powder, and (c) the evaluation of samples with turmeric powder and black pepper. The participants evaluated samples using a hedonic scale, JAR test, and CATA questions.
Aroma, taste, and mouthfeel are the most important sensory attributes of ice cream, and flavour is a combination of the perception of these attributes [44]. Aromatic components from ice cream are released during consumption [45,46] due to increasing temperature. Therefore, aroma was evaluated at the end of the test after melting the ice cream in the mouth. Scoopability, a very important quality attribute of ice cream that is directly influenced by firmness [47], was rated as the force required to cut the sample with a spoon.

2.4.3. Consumer Acceptance

Using a 9-point hedonic scale, participants were rated overall acceptance of ice cream samples (1 = dislike extremely, 2 = dislike very much, 3 = dislike moderately, 4 = dislike slightly, 5 = neither like nor dislike, 6 = like slightly, 7 = like moderately, 8 = like very much, and 9 = like extremely) [48]. Acceptance degree for sensory attributes (appearance, scoopability, mouthfeel, taste, and aroma) of the ice cream, was rated on a 5-point category hedonic scale (1 = dislike very much, 2 = dislike slightly, 3 = neither like nor dislike, 4 = like slightly, and 5 = like very much) [49].

2.4.4. JAR Test

The just-about-right (JAR) scale was used to identify whether the sample is just right or has too much or too little of a certain attribute [50]. The intensity of sensory attributes including colour, scoopability, melting, taste, sweetness, aftertaste, bitterness, and aroma was rated on a 5-point category scale: too weak, slightly weak, ideal/just about right, slightly strong, and too strong.

2.4.5. CATA Test

The check-all-that-apply (CATA) test is used for the sensory evaluation of food by verbally describing samples [51]. Participants were asked to mark all terms related to the served ice cream. A total of 24 attributes were previously selected by the trained assessors (Table 2) to characterise the ice cream using the CATA method.

2.4.6. Open-Ended Evaluation

The participants were also asked to describe the ice cream samples in their own words using an open-ended comment question [8]. It was explained that answers were not mandatory.

2.4.7. Purchase Intent and Willingness to Consume

Additionally, participants were asked to rate the buying predisposition from 1 to 5 (1 = certainly would not buy; 2 = possible wouldn’t buy; 3 = maybe would buy/maybe wouldn’t buy; 4 = possible would buy; 5 = certainly would buy). Furthermore, for the intention of consummation, a binomial scale (Yes or No) was used to answer the question: “If this product were available to you, would you consume it?”.

2.5. Microbiological Analysis

To verify sanitary conditions and ensure the safety of participants during ice cream tasting, a microbiological analysis of the ice cream samples was performed. Before sensory analysis, Salmonella spp., Listeria monocytogenes, Enterobacteriaceae, aerobic mesophilic bacteria, and coagulase-positive staphylococci (Staphylococcus aureus) were determined according to standard methods [52,53,54,55,56,57].

2.6. Data Analysis

The results of this experiment were expressed by mean ± standard deviation (SD). The obtained mean values of the hedonic, purchase intent, and JAR data were compared between samples by analysis of variance (ANOVA) and Tukey (HSD) test, with significance set at p < 0.05. Additionally, Pearson’s correlation coefficients between variables were determined at a significance level of 0.05. Cochran’s Q test/McNemari (Bonferroni) procedure and correspondence analysis (CA) were completed based on the results of the CATA question. The JAR and CATA data were analysed using penalty analysis (PA) on overall liking scores. The JAR data were divided into three groups: too little (TL), ideal (JAR) and too much (TM). For each of the selected attributes, mean drops in liking (penalties) were calculated as the differences between the means of the two non-JAR categories and the mean of the JAR category [49]. Penalty analysis was represented graphically for individual samples using a scatter plot of the percentage of the respondents in a non-JAR category on the x-axis and the mean drops on the y-axis. The penalised attributes were those contained in the upper-right quadrant of the penalty plot, when at least 20% of consumers rated attributes with non-JAR, decreasing overall liking by more than 1 point. CATA results were analysed using penalty analysis on overall liking scores and represented visually as a scatter plot, with respondent percentage on the x-axis and the penalty in liking scores on the y-axis. Penalties were calculated as the differences between the mean values of liking scores of the group of consumers who marked the selected terms, and those who did not [58]. CATA descriptors with penalty scores greater than 0.5 and occurrences greater than 20% were represented in the bar chart as a penalty lift analysis (PLA) plot. The obtained data were visualised using principal component analysis (PCA). All statistical analyses were performed using XLSTAT software, version 2019.2.2 (Addinsoft, New York, NY, USA) in Microsoft Excel.

3. Results and Discussion

3.1. Microbiological Safety of Evaluated Samples

Microbiological results of ice cream samples are presented in Table S1. They indicated that all samples were in accordance with the microbiological criteria recommended by international and national agencies [59,60,61] and thus were safe to consume.

3.2. Consumer Acceptance of Turmeric-Flavoured Ice Cream

3.2.1. Sensory Acceptability

The results of the acceptability test of the turmeric- and black-pepper-flavoured ice cream are shown in Table 3.
As expected, the addition of turmeric powder significantly (p < 0.05) affected the overall liking of ice cream and evaluated sensory attributes, as confirmed by Pearson’s correlation test (Table S2). All formulations of flavoured ice cream tended to present lower sensory scores than control formulations regarding overall acceptance and appearance, mouthfeel, taste, and aroma. Concerning the scoopability score, the fortified samples did not differ significantly (p > 0.05) from the standard ice cream. The decreased score for flavour in turmeric-enriched samples is probably due to the content of ketonic sesquiterpenes turmerones, which gives a slightly bitter and distinctive taste and aroma to the product [62,63,64].
Standard milk ice cream formulation (C) as well as ice cream formulations with the addition of 0.5% turmeric powder, with and without the presence of black pepper (T0, and T0p, respectively) received the highest scores for all evaluated attributes, above 4.0 (“like slightly”), and for overall liking, about 7.0 (“moderately like”), indicating an acceptance region. More than 80% of tested consumers liked these three ice creams (Figure S2).
Samples with higher turmeric proportion (T1, T2, T1p, and T2p) received significantly lower (p < 0.05) appearance, mouthfeel, taste, aroma, and overall liking scores compared to the control. Regardless, the samples T1 and T1p (1% of turmeric) were still acceptable to consumers with a mean rating higher than 6.0 (“like slightly”). These samples were rated as acceptable by more than 70% of participants (Figure S2). For many of the respondents (33% and 44%, respectively), samples with 2% added turmeric (T2 and T2p) were not acceptable, with mean grades for overall liking around 5.0 (“neither like nor dislike”) and below 5.0 (“dislike”), respectively. This agrees with the results of studies by other authors [13,14,65] where turmeric powder was added to soft ice cream. They concluded that the optimal concentration of turmeric in ice cream was below 0.5%, although the overall results show that a higher proportion of turmeric also had acceptable ratings.
Contrary to expectations, black-pepper-enriched samples (T0p, T1p, and T2p) did not differ significantly (p > 0.05) in hedonic impressions from samples without black pepper (T0, T1 and T2), with the identical proportion of turmeric (6.94; 6.32; and 4.81 compared to 6.90; 6.32; and 5.31). Conversely, Aumpa et al. [15] and Khawsud et al. [16] concluded that the addition of black pepper in ice cream significantly (p < 0.05) decreased the rating for aroma, flavour, and overall liking. However, they added a higher level of black pepper in a mixture with cinnamon, which could significantly affect overall liking [66]. Our results may indicate that black pepper in a proportion of 0.02% does not adversely affect the acceptability of turmeric-flavoured ice cream.
Analysis of the results of consumer liking of ice cream based on the values of Pearson’s correlation coefficient confirmed a high correlation (p < 0.05) between the addition of turmeric powder and liking scores, while no correlation was found between the addition of black pepper and the sensory acceptance of ice cream (Table S2).
Instrumental colour parameters, overrun, hardness, fat destabilisation index, and rheological parameters for the same samples were also tested and reported in our previous study [67]. A high positive correlation was observed between appearance scores and instrumental measured lightness and hue (0.922, and 0.918, respectively), and a negative correlation with redness value and yellowness index (−0.820, and −0.776, respectively). This means that consumers preferred lighter ice creams with fewer red and yellow shades. An inverse correlation was found for scoopability scores and overrun value (−0.821), which is due to higher air incorporation in ice creams, and therefore less hardness of the product. Although increased viscosity may affect the improvement of sensory properties [68], such a correlation was not observed for ice creams with turmeric and black pepper addition. In these samples, the increased viscosity is due to the addition of spices, which influenced the decrease in sensory ratings.

3.2.2. Willingness to Buy and Consume

The results of the purchase intention for ice creams with and without turmeric and black pepper are shown in Table 4 and Figure S3. The consumer acceptability of ice creams was well correlated with their purchase intention (Table S2). Standard ice cream (C) scored highest (about 4.0), close to the term “possible would buy”. Ice cream samples with 0.5% turmeric (T0 and T0p) had slightly lower ratings (about 3.6), but ANOVA revealed that there was no significant difference (p > 0.05) among the control and samples with the lowest turmeric addition. The low valuations (2.44 and 2.33) obtained for the high-enriched samples (T2 and T2p) were close to the term “possible wouldn’t buy”. This could be attributed to the strong flavour of turmeric powder and the non-acceptance of this spice due to its rare or no consumption [69,70].
The percentages of participants who, after evaluating the ice cream, marked that they would consume it, are shown in Table 4. There were significant (p < 0.05) differences among ice cream samples according to Cochran’s Q test. Similar to the results of the hedonic scale and purchase intent test, for samples with higher proportions of turmeric, the panellist showed less intention to consume (Table S2). For samples T2 and T2p, the panellists showed the least interest in consumption, with about 50% of respondents reporting in the rejection region. All other samples were located in the acceptance region; for them, the intention of consumption was marked by more than 70% of participants.

3.3. Sensorial Characterisation of Turmeric-Flavoured Ice Cream

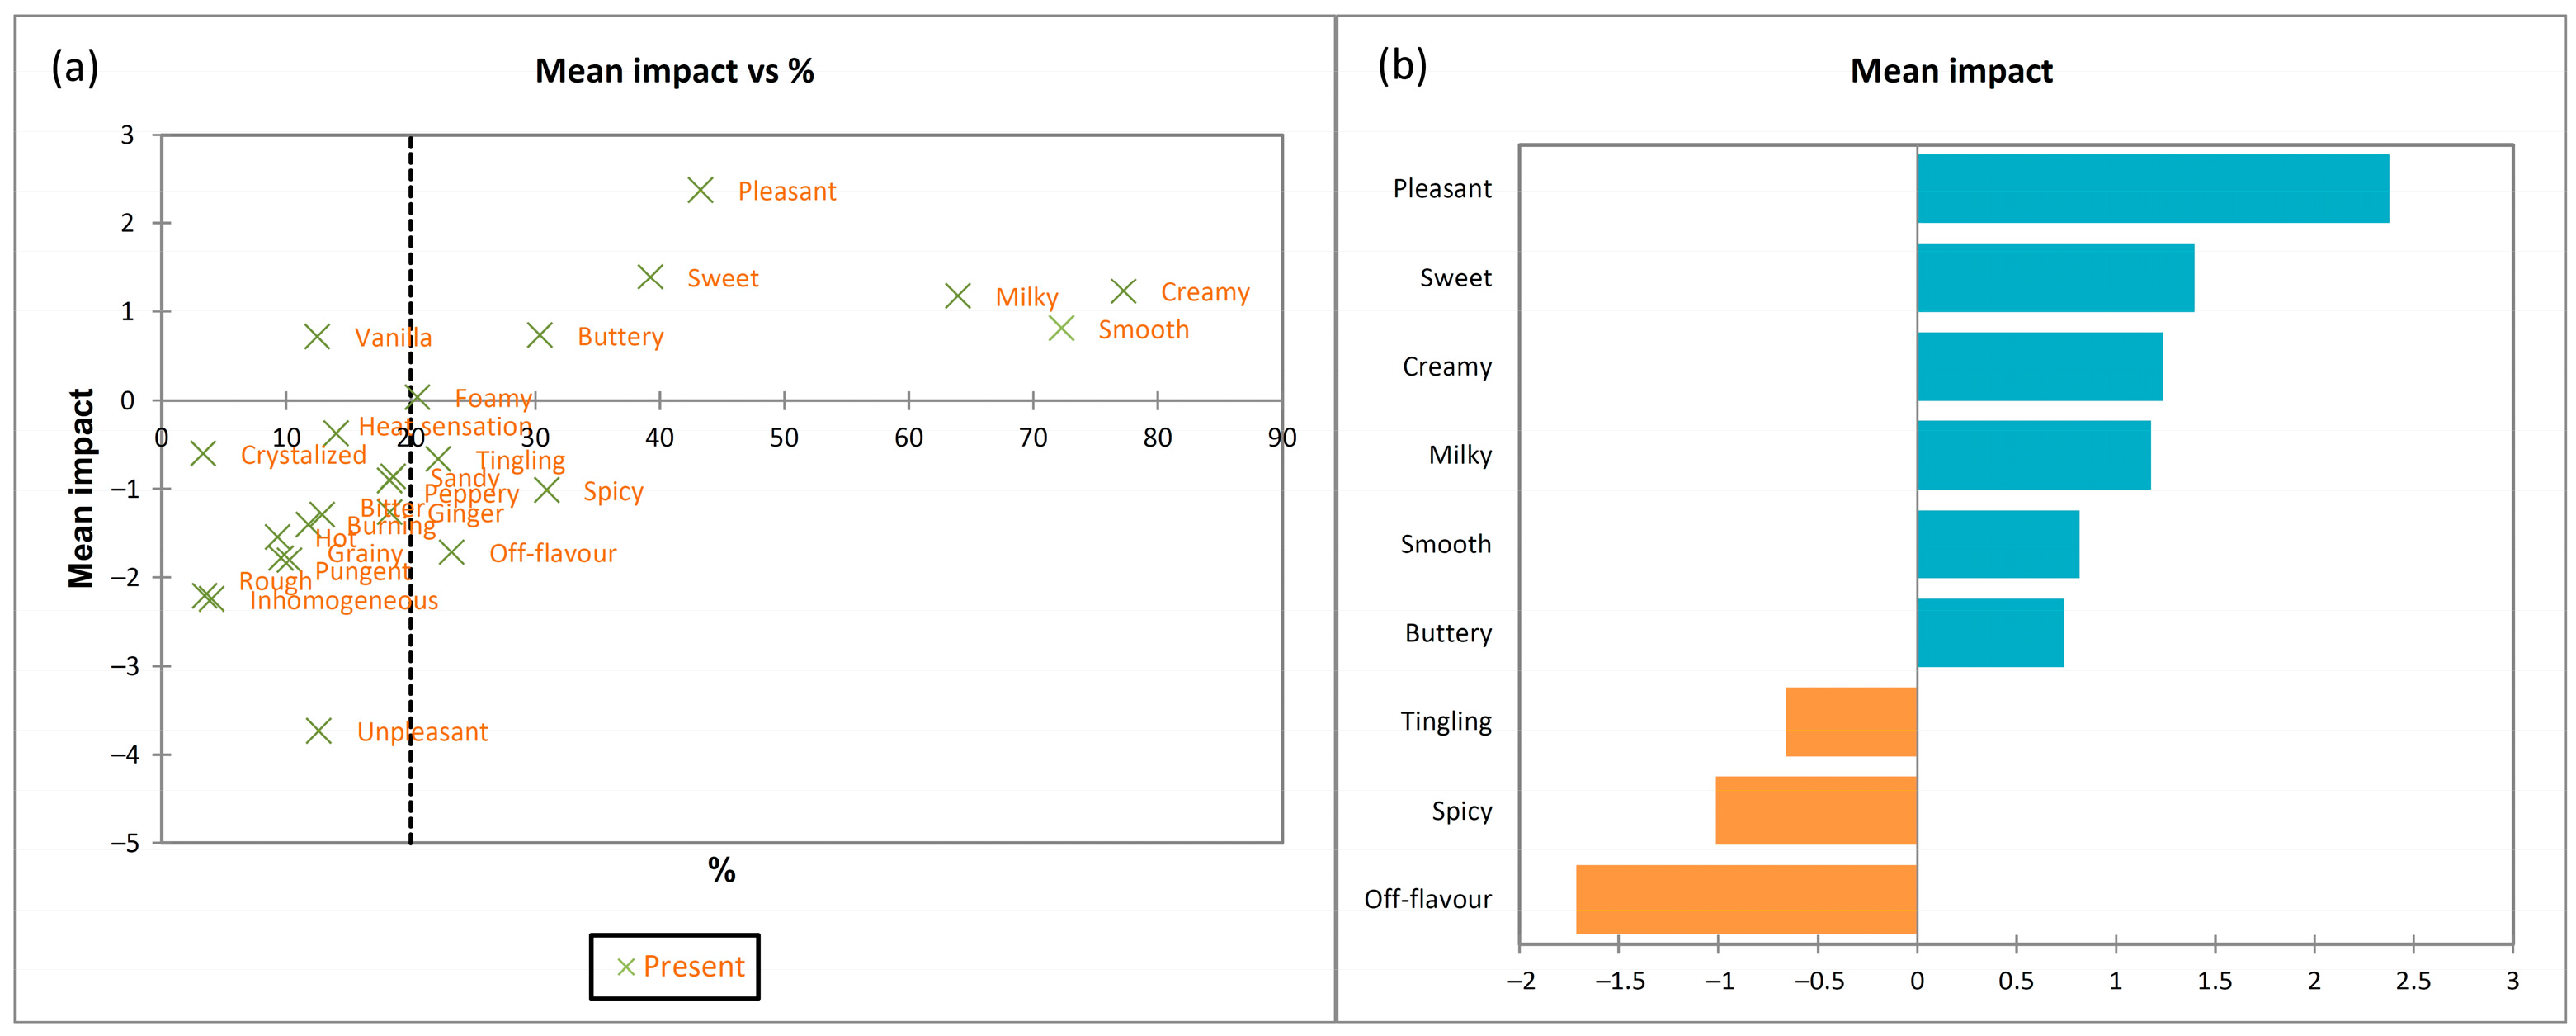
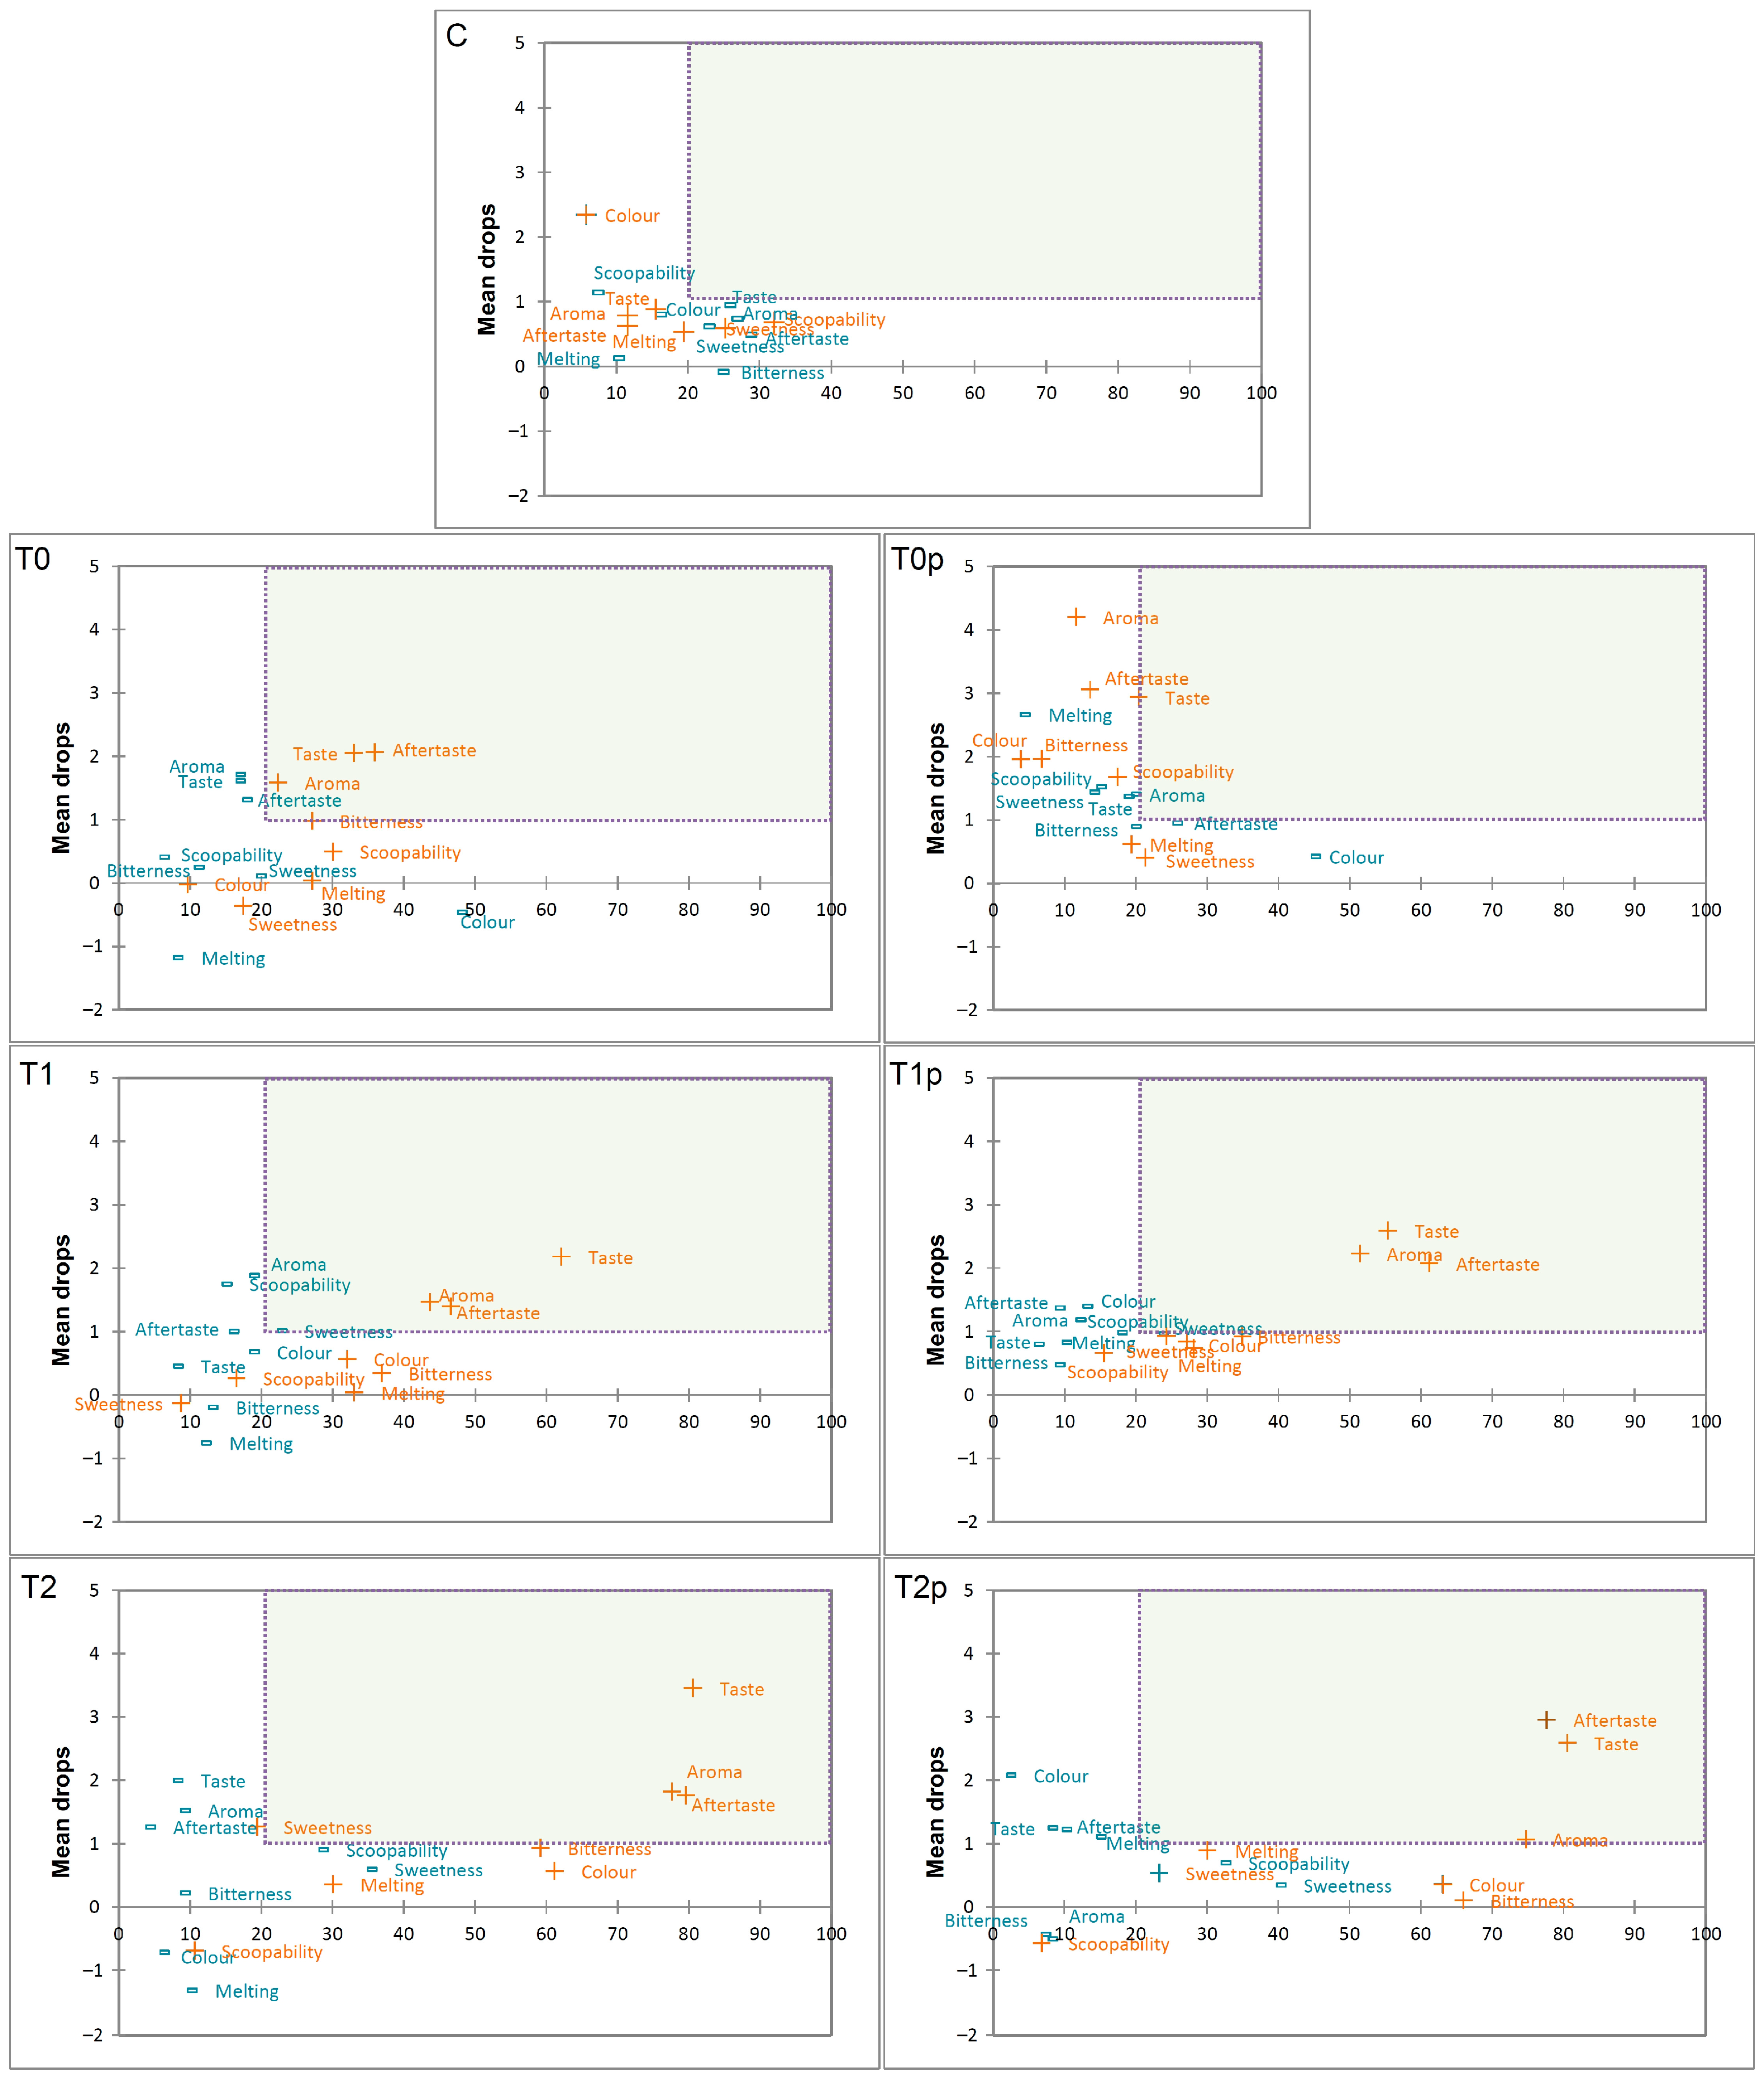
3.3.1. Just-About-Right (JAR) and Penalty Analysis

Table 5 and Figure S4 show the values obtained on the JAR scale for the intensity of colour, scoopability, melting, taste, sweetness, aftertaste, bitterness, and aroma. A rating of 0 in the JAR test is considered ideal, and any deviation below or above this value is considered a loss of quality of the sensory attribute. The overall taste, aftertaste, bitterness, and aroma of the ice cream samples with the medium and maximum concentration of turmeric (T1 and T1p, as well as T2 and T2p) were rated significantly higher (p < 0.05) than the ideal, as shown in Figure S4. However, the intensity scores of melting and sweetness in all samples, were not significantly different (p > 0.05) from the just-about-right value (Figure S4), indicating that these attributes were very close to ideal for all produced ice creams.
The concentration of turmeric powder significantly influenced (p < 0.05) the rating of the intensity of the tested characteristics (Table 5) except for the melting intensity. Turmeric addition contributed to a more intensive colour, overall taste, aroma, aftertaste, and bitterness. Noticeable changes in these attributes of ice cream with the addition of turmeric were detected by panellists who marked the terms “slightly strong” and “too strong” (Figure S5). Lower values for intensity of colour were observed in the T0 and T0p samples, probably as a result of consumers’ expectations of darker colours in these naturally coloured ice creams. Pearson’s correlation coefficients (Table S3) confirm a positive correlation between colour, taste, aftertaste, bitterness, and aroma intensity and spice addition, while turmeric supplementation is negatively correlated with the intensity of scoopability and sweetness.
There was no significant correlation between the intensity of the melting in the mouth rated using the JAR test and the drip-through melting rate obtained using the gravimetric method in our previous studies on the same ice cream samples [67]. Amador et al. [68] and Warren and Hartel [71] also found no correlation between these two parameters, assuming that different temperatures in the mouth and room, as well as the presence of saliva and shear forces from the tongue in the mouth, differently affect the melting of ice crystals and milk fat. Scoopability intensity and instrumental hardness were positively correlated (0.821), since ice creams with more spice addition had lower values for instrumental hardness, and also required less force when scooping. An inverse correlation was observed for sensory colour intensity and instrumental determined lightness value (−0.841), and a positive relationship between colour intensity and redness (0.988), suggesting that participants perceived darker ice creams with a stronger red shade as too intensely coloured.
Similarly, as with the acceptability scores (Table 3), there was no significant difference (p > 0.05) in scores for attribute intensity between a group of samples without black pepper (T0, T1, and T2) and a group with black pepper (T0p, T1p, and T2p). The aftertaste is the residual taste sensation remaining in the mouth after swallowing food and can be retained in the mouth for a few seconds to several minutes [72,73]. Since black pepper can have a burning aftertaste [22,74], the intensity of this attribute was expected to be higher in black pepper samples, but that was not determined by consumers who participated in this study. Probably, this effect is more associated with higher concentrations of black pepper, while in this study the concentration of added black pepper was 0.02%, which may be the cause of the absence of a significant negative difference in the intensity of aftertaste. In our study, a significant difference (p < 0.05) was observed only between T0 and T0p in the scores for aftertaste and bitterness, but the sample with black pepper was described as closer to ideal.
Penalty analysis was conducted to determine which attributes decrease the acceptability of each ice cream sample. The results of penalty analysis are shown in Figure 2 and Figure S5.
The attributes contained in the upper-right quadrant of the penalty plot (when at least 20% of consumers rated attributes with non-JAR, decreasing overall liking by more than 1 point) represented the greatest impact on the mean drop in acceptance. Generally, most of the flavoured ice cream samples were penalised for the same attributes: too much taste, aftertaste, and aroma.
Comparing PA plots of T0 and T0p samples, it can be concluded that black pepper supplementation had a positive effect on the perception of the intensity of the tested attributes of ice cream with 0.5% turmeric powder. This eventually translated to the highest overall liking score among fortified ice creams.
Samples with higher spice addition demonstrated similar PA plots, where more than 40% of participants for samples with medium turmeric concentration (T1 and T1p), and almost 80% of participants for samples with maximum turmeric level (T2 and T2p) significantly decreased their overall liking score for too intensive taste, aftertaste, and aroma. The addition of turmeric and curcumin gives a pungent and bitter flavour, especially when it is found in food in high concentrations as reported Oliveira et al. [70] and Grasso [75]. Turmeric powder is preferred in meat and fish products as well as sour and salty foods [76,77] because its characteristic aroma is more evident when paired with foods that contain a mild or sweet taste [78]. Also, these two samples denoted too high intensity of colour and bitterness, which was observed by more than 60% of the subjects. However, this deviation of those attributes from the ideal value is not penalised with a significant decrease in acceptance. This is contrary to the results of a study of the addition of turmeric to milk [79] where it was concluded that turmeric supplement leads to a decrease in consumer preference because of their dark yellow colour. Despite expectations, none of texture attributes significantly affected the decrease in overall liking.
Although too intensive aroma and taste, and the aftertaste of turmeric have significantly reduced the acceptability rating, turmeric-fortified ice creams, except the T2p sample, were still acceptable (Table 3).
The JAR results indicate that the ideal concentration of turmeric powder to ice cream (with or without black pepper) is 0.5%, as a significant proportion of respondents evaluated the intensity of taste (50.5% and 61.2%, respectively), aftertaste (46.6% and 61.2%, respectively), bitterness (62.1% and 73.8%, respectively) and aroma (61.2% and 68.9%, respectively) of the T0 and T0p sample just-right (Figure S5), and additionally more than 80% of respondents consider the product acceptable (ratings higher than 5.0 on a nine-point hedonic scale; Table 3).

3.3.2. CATA Sensory Profiling

The CATA method was used to define and characterise the ice cream samples with turmeric and black pepper. The frequencies of checked CATA attributes associated with each ice cream sample by consumers are shown in Table 6, and summarised data for all samples are in Figure S6. The most selected attributes were “smooth” (72%) and “creamy” (77%) texture, and “milky” (64%) flavour. In addition, the “pleasant” and “sweet” flavours were associated with the control and lower-flavoured samples, while “spicy” and “peppery” flavours were chosen for those with a higher proportion of supplements.
Cochran’s Q-test (Table 6) showed significant differences in 23 of the 24 attributes analysed among all samples (p < 0.05), indicating the importance of CATA terms in differentiating and characterising ice cream. The exception is the “crystallized” descriptor, for which there was no significant difference (p > 0.05) in frequency between the samples. Although the spice supplement was expected to affect ice crystal size and due to “crystallized” texture, the results suggest that turmeric and black pepper in these proportions do not change the perception of the panellist for iciness.
McNemar (Bonferroni) procedure further explains the connection between samples and CATA terms. The terms “milky” and “buttery” flavour were mentioned significantly less frequently (p < 0.05), while the terms “spicy”, “hot” and “off-flavour” were mentioned significantly more frequently for fortified ice cream samples compared to the control. The samples with added black pepper and with a higher proportion of turmeric (T1p and T2p) were described more frequently (p < 0.05) as “spicy” and “peppery” than the samples without black pepper (T1 and T2). This is probably due to the presence of terpenes, sesquiterpenes, and their derivates from the essential oil of black pepper [74], which contribute to its characteristic aroma. Besides the “pepper-like” flavour, black pepper aroma can be described as “turmeric-like”, “earthy”, “pungent”, “spicy”, and “herbaceous” [80]. Similar aromatic notes characterise turmeric powder [63], which is probably one of the reasons that the addition of black pepper did not significantly adversely affect the sensory perception of turmeric-fortified ice cream.
Pearson’s correlation showed that the addition of turmeric powder highly correlated with the frequency of use of most CATA terms, and that the addition of black pepper was positively correlated with “foamy” and “peppery” (Table S4).
A strong negative correlation (−0.840) was found between the “crystalized” and “creamy” terms, indicating that ice cream with more ice crystals had less mouth-coating properties. Also, ice creams often described as “crystalized” in the present study had lower levels of fat destabilisation in our previous study [67]. A similar finding was presented by Amador [68], who attributed this to decreased lubrication in the mouth due to lower levels of partially coalesced fat. As expected, a strong positive relationship between the CATA term “foamy” and overrun determined in earlier testing [67] was found (0.793). The increased ice cream mix viscosity can influence and improve sensory properties of the resulting ice cream. However, the same correlation between sensory properties and instrumentally determined Kokini viscosity in the previous study [67] was not found. This can be influenced by a number of factors, and one of the most significant is the size of ice crystals that were not measured.
The sensory attributes of the ice cream are summarised visually in Figure 3. The results of the CATA question were analysed with a correspondence analysis to define which sensory descriptors were responsible for the hedonic scores of ice cream samples. The first two dimensions explained 89.50% of the variation (80.30% on the first dimension and 9.21% on the second dimension). This indicates that the terms on the CATA list allowed the participants to describe the sensory differences that they perceived among the samples.
The first dimension separated ice cream based on their flavour attributes: “milky”, “sweet”, “buttery”, “vanilla”, and “pleasant” were on the positive side, while “hot”, “spicy”, “pungent”, “bitter”, “peppery”, and “unpleasant” were on the negative side. In addition, the texture attributes “smooth” and “creamy” were on the right side, and “grainy”, “sandy”, “rough”, and “foamy”, as well as “tingling” and “burning” mouth sensations were on the left side of the plot. Furthermore, the “hot” attribute was situated very close to “spicy” and “pungent”, and “bitter” was very close to “ginger”, while “smooth” was next to “creamy”, which confirmed the strong connection of these sensory descriptors.
The results of the CA confirm the results of hedonic testing (Table 3) and purchase intentions (Table 4). There is a clear separation of the control sample, which was given the highest hedonic score located in the upper-right quadrant, and two groups of flavoured samples. More precisely, lower-concentration turmeric ice creams (T0, T0p, and T1) located in the lower-right quadrant of the CA-plot were described as “sweet”, “milky”, “pleasant”, “smooth”, and “creamy”. On the other hand, higher-enriched turmeric samples (T1p, T2, and T2p) rated with the lowest hedonic scores located in the upper-left quadrant were associated with negative attributes for ice cream, including “hot”, “peppery”, “unpleasant”, “grainy”, “sandy”, “burning” and “heat sensation”. These results showed similar behaviour with JAR test scores, where the samples with the highest concentrations of turmeric powder were perceived as having the most bitter taste, and too strong aftertaste and aroma (Table 5).
Penalty analysis was used to determine which CATA term decreased the overall acceptability of ice cream. Figure 4 visualises which attribute had a positive and which had a negative impact on acceptance. Attributes in the upper-right quadrant are the most important for the higher consumer acceptability of ice cream samples, and attributes in the lower-right quadrants are for decreasing acceptance scores.
These data are summarised by penalty lift analysis (PLA; Figure 4b). Attributes such as “pleasant” flavour, “sweet”, “milky”, and “buttery”, as well as “creamy” and “smooth” texture positively impacted overall liking rates. These terms were all associated with control, T0p, T0, and T1 samples (Figure 3). On the other hand, “tingling” sensation, “spicy” taste and “off-flavour” decreased consumers’ liking of flavoured ice creams. Flavour, particularly “sweet” and “buttery”, as well as “creamy” and “smooth” texture, has been found to drive consumers’ liking of ice creams, which is in accordance with findings reported by Ares et al. [81]. In similar studies with vanilla and chocolate ice creams [8,36,81], it has also been found that the flavour, particularly sweet and buttery, as well as creamy and smooth texture to drive consumers’ liking of ice creams.
Although the terms “sandy”, which used by more than 30% of respondents, and “grainy” by more than 25% of respondents for describing the samples with the highest turmeric content (T2 and T2p), were expected to decrease the product’s acceptability rating, these descriptors did not significantly influence the overall impression of the product.

3.3.3. Open-Ended Comments

At the end of the evaluation, the participants had the opportunity to comment on each sample tasted. Since commenting in this study was optional, not all participants left their responses. The resulting responses for all samples were grouped and listed in Table S5. A good connection with hedonic ratings (Table 3), the JAR scale (Table 5), and the CATA test (Table 6) can be observed. Thus, samples with higher hedonic scores received positive comments (C, T0, and T0p) and samples with lower negative comments (T2, T1p, and T2p). Also, samples with a higher addition of turmeric, including those with the addition of black pepper, were described as having “too intense taste”, as well as being “spicy”, “peppery”, and “bitter”, “with strong aftertaste”. To describe these samples, the participants also used additional terms such as “woody”, “mustard”, “herbal”, and “mint”. Finally, although only a small number of respondents left their answers (about 17%), the obtained open-ended comments clearly showed that the evaluation of turmeric ice cream strongly depends on consumer preferences. Thus, samples that were extremely undesirable to a certain number of participants were highly desirable to others (comments including “unpleasant”, “absolutely not” or “undesirable”, and “pleasant” or “very pleasant” for the same sample).

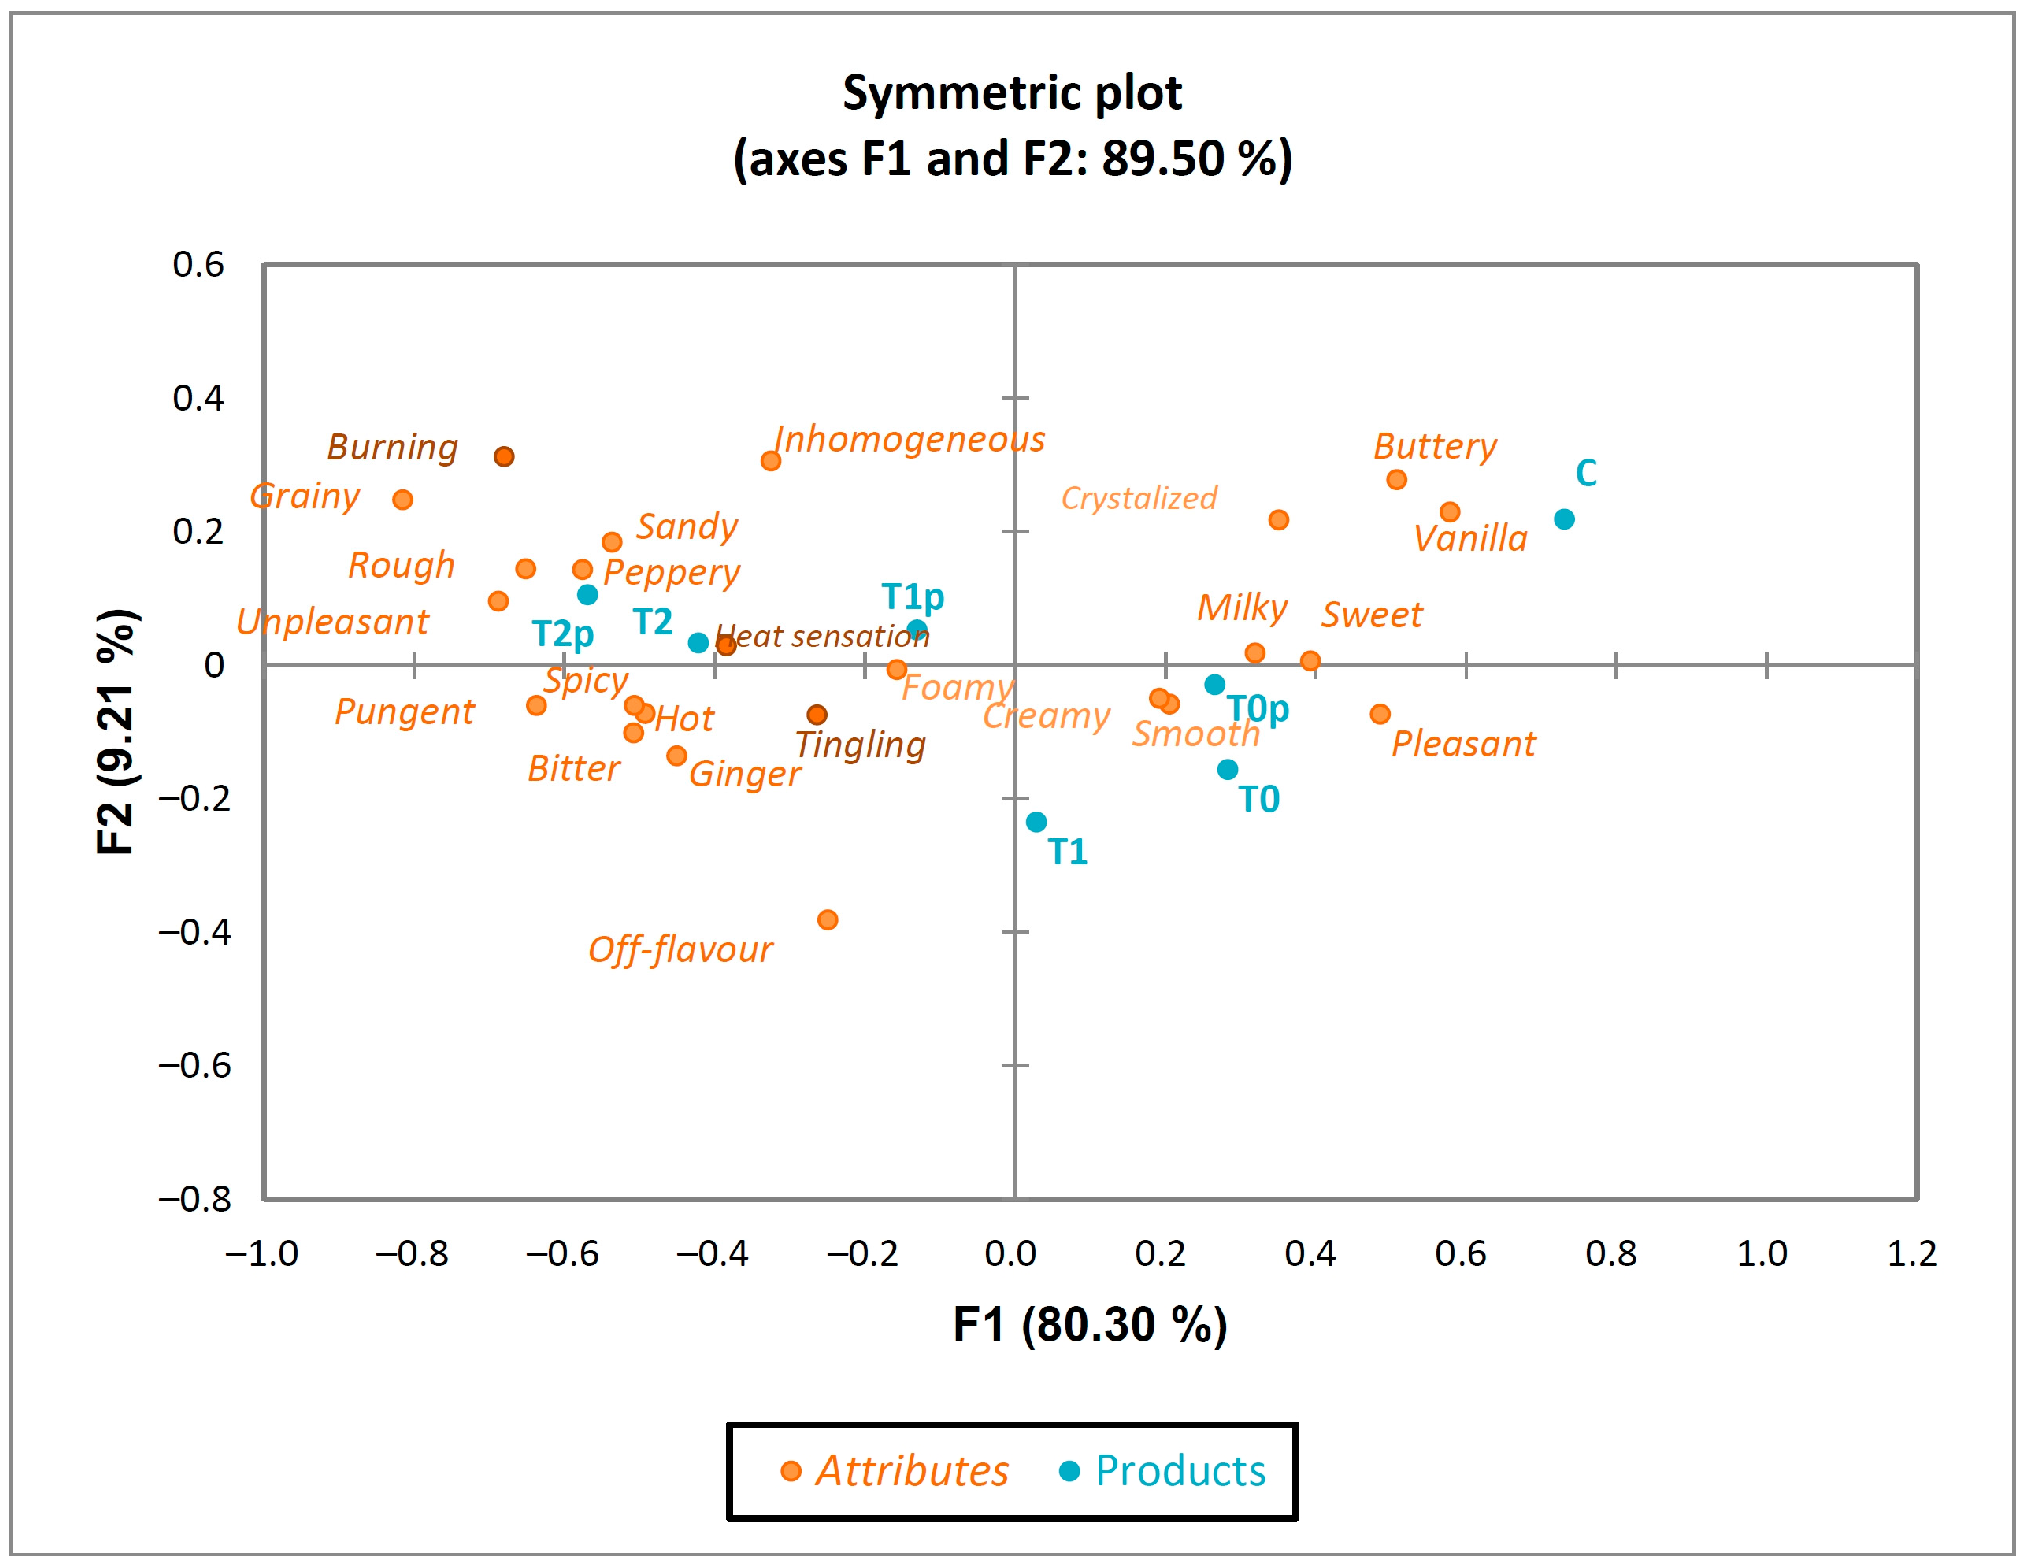
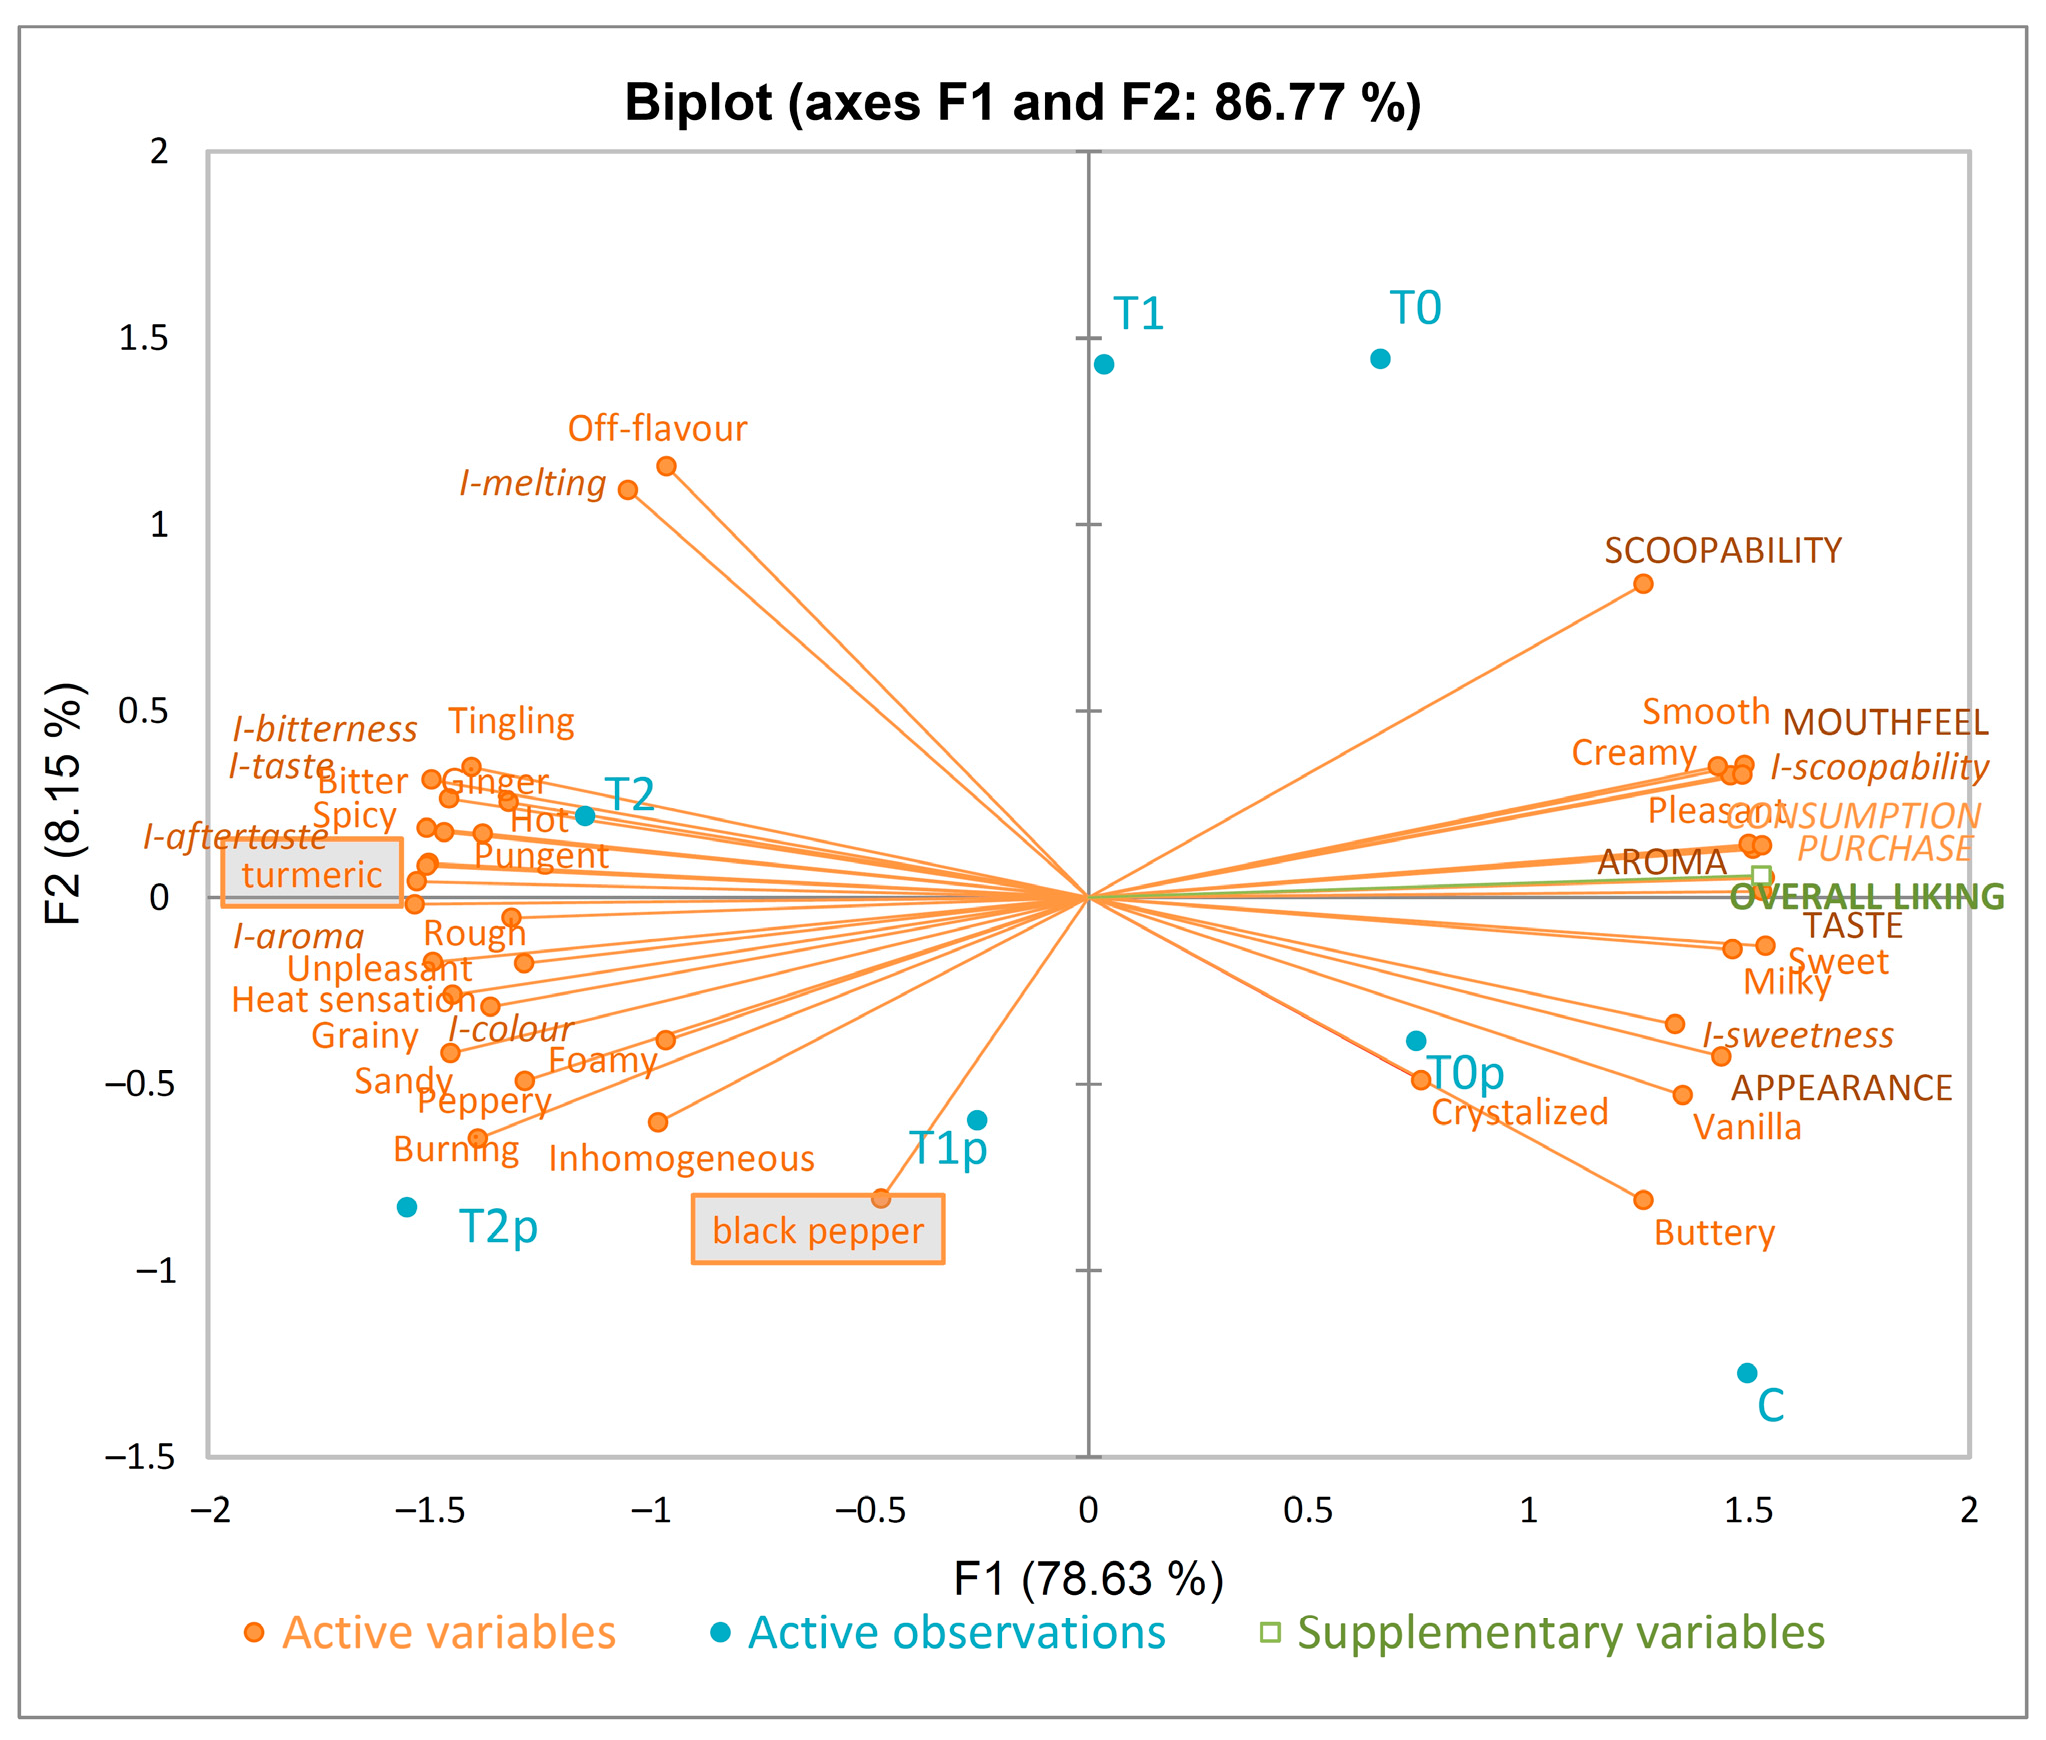
3.4. Principal Component Analysis

Principal component analysis (PCA) was performed using all obtained data to verify the relation among them (Figure 5). The components represented 86.77% of the total variation of the data; the first component corresponded to 78.63% and the second component to 8.15% of the total variability. The terms localised near the overall liking are important and can contribute positively to the acceptance of the product. PCA shows a good correlation between overall acceptance and the intention to purchase and consume.
The higher the intensity of sweetness, the higher the ratings for taste, aroma, mouthfeel and appearance for the ice cream, and it was preferable to consumers. PCA revealed that samples with lower turmeric content were liked more compared to the samples with high supplementation. It can be seen that the T0p sample, with the lowest turmeric proportion and added black pepper, is located closest to overall liking. On this side of the PCA-plot were also localised positively CATA terms, like “milky”, “sweet”, “vanilla”, “buttery”, “creamy”, “smooth”, and “pleasant”, associated with the control sample.
On the other hand, too much aroma, aftertaste, bitterness, and taste are related to a more frequent selection for “bitter”, “spicy”, “pungent”, “hot”, “unpleasant”, and “tingling”, which is associated with the T2 sample (with the highest turmeric content). Similar to the CA of the CATA results (Figure 3), negative terms, such as “grainy”, “sandy”, “peppery”, “burning”, and “inhomogeneous” were used to describe samples with a higher concentration of turmeric and added black pepper (T1p and T2p).
The PCA results confirmed that ice cream with turmeric and black pepper supplementation could be clearly separated based on CATA descriptors selected in the preliminary study.

4. Conclusions

In this study, seven different ice cream formulations were evaluated: one standard, three turmeric-fortified, and three turmeric-fortified with the addition of black pepper. The pungent and spicy aroma and the bitter aftertaste of turmeric and black pepper can be a limiting factor for the application of these spices in the production of ice cream. However, this effect strongly depends on the ratio of spices and on the food matrix to which they are added. The results of the acceptability test and willingness to purchase and consume suggest that it is possible to produce ice cream enriched with turmeric and black pepper that is acceptable to consumers. The JAR test showed that turmeric-flavoured samples were penalised for too much flavour, aftertaste and bitterness, but not for their altered textural properties. Ice cream formulations with lower turmeric addition (T0 and T0p) had the most desired attributes for ice cream, very similar to the standard milk formulation. It can be concluded that the sensory-acceptable ice cream is one with the addition of 0.5% turmeric and 0.02% black pepper. Unexpectedly, the addition of black pepper did not negatively affect the acceptability of the product. Thus, this valuable spice could be used in the production of turmeric ice cream with potential functional properties, increasing its health-benefit value, as it has been proven to enhance the bioavailability of curcumin, the bioactive component of turmeric. Since the results of this study showed consumer acceptance of enriched ice cream samples, this could be a possible starting point for further research, in terms of health benefits evaluations.

Supplementary Materials

The following are available online at: https://www.mdpi.com/article/10.3390/app132111802/s1, Figure S1. Preliminary study design illustrating the stages of the flavoured ice cream samples selection; Table S1. Microbiological results of ice cream samples; Table S2. Pearson’s correlation matrix between the addition of turmeric and black pepper, and liking scores and purchase and consumption intent for ice cream samples; Figure S2. Liking scores percentage of respondents (n = 103) for ice cream samples; Figure S3. Purchase intention scores percentage of respondents (n = 103) for ice cream samples; Figure S4. Deviations of the intensity of sensory attributes from the ideal (JAR) value for ice cream samples; Figure S5. JAR scale percentage of respondents (n = 103) grouped in three levels; Table S3. Pearson’s correlation matrix between the addition of turmeric and black pepper, and JAR values for ice cream samples; Figure S6. Summary CATA frequency (%) for all ice cream samples; Table S4. Pearson’s correlation matrix between the addition of turmeric and black pepper, and CATA terms for ice cream samples; Table S5. Main comments identified about turmeric- and black-pepper-flavoured ice cream samples from the open-ended question.

Author Contributions

Conceptualisation of the study: M.L.Č., methodology: M.L.Č. and M.A., Investigation: M.L.Č., M.A. and I.P., formal analysis: M.L.Č., J.L. and M.J., visualisation: M.L.Č. and M.A., writing—original draft: M.L.Č. and M.A., writing—review and editing: M.L.Č., M.A., J.L. and M.J. All authors have read and agreed to the published version of the manuscript.

Funding

This research received no external funding.

Institutional Review Board Statement

The study was conducted according to the guidelines of the Declaration of Helsinki, and approved by the Ethics Committee of the Faculty of Food Technology Osijek, Josip Juraj Strossmayer University of Osijek, Croatia (Class number 602-04/23-08/01).

Informed Consent Statement

Informed consent was obtained from all subjects involved in the study.

Data Availability Statement

The data presented in this study are available upon request from the authors M.L.Č. and M.A.

Conflicts of Interest

The authors declare no conflict of interest.

References

  1. Goff, H.D. Colloidal aspects of ice cream—A review. Int. Dairy J. 1997, 7, 363–373. [Google Scholar] [CrossRef]
  2. Marshall, R.T.; Goff, H.D.; Hartel, R.V. Ice Cream, 6th ed.; Springer: New York, NY, USA, 2003; pp. 1–91. [Google Scholar] [CrossRef]
  3. Soukoulis, C.; Fisk, I.D.; Bohn, T. Ice cream as a vehicle for incorporating health-promoting ingredients: Conceptualization and overview of quality and storage stability. Compr. Rev. Food Sci. Food Saf. 2014, 13, 627–655. [Google Scholar] [CrossRef]
  4. Hernández, H.; Nunes, M.C.; Prista, C.; Raymundo, A. Innovative and Healthier Dairy Products through the Addition of Microalgae: A Review. Foods 2022, 11, 755. [Google Scholar] [CrossRef]
  5. Genovese, A.; Balivo, A.; Salvati, A.; Sacchi, R. Functional ice cream health benefits and sensory implications. Food Res. Int. 2022, 161, 111858. [Google Scholar] [CrossRef]
  6. Afzaal, M.; Saeed, F.; Arshad, M.U.; Nadeem, M.T.; Saeed, M.; Tufail, T. The Effect of Encapsulation on The Stability of Probiotic Bacteria in Ice Cream and Simulated Gastrointestinal Conditions. Probiotics Antimicrob. Proteins 2019, 11, 1348–1354. [Google Scholar] [CrossRef]
  7. Atallah, A.A.; Morsy, O.M.; Abbas, W.; Khater, E.S.G. Microstructural, Physicochemical, Microbiological, and Organoleptic Characteristics of Sugar-and Fat-Free Ice Cream from Buffalo Milk. Foods 2022, 11, 490. [Google Scholar] [CrossRef]
  8. Fonseca, F.G.A.; Esmerino, E.A.; Filho, E.R.T.; Ferraz, J.P.; da Cruz, A.G.; Bolini, H.M.A. Novel and successful free comments method for sensory characterization of chocolate ice cream: A comparative study between pivot profile and comment analysis. J. Dairy Sci. 2016, 99, 3408–3420. [Google Scholar] [CrossRef]
  9. European Ice Cream Market Report 2021: Average Consumption. Available online: http://globenewswire.com (accessed on 30 June 2023).
  10. Ice Cream Sales & Trends-IDFA. Available online: https://www.idfa.org/ice-cream-sales-trends (accessed on 30 June 2023).
  11. Arslaner, A.; Salik, M.A. Functional Ice Cream Technology. Akad. Gıda 2020, 18, 180–189. [Google Scholar] [CrossRef]
  12. Gowda, A.; Sharma, V.; Goyal, A.; Singh, A.K.; Arora, S. Process optimization and oxidative stability of omega-3 ice cream fortified with flaxseed oil microcapsules. J. Food Sci. Technol. 2018, 55, 1705–1715. [Google Scholar] [CrossRef]
  13. Manoharan, A.P.; Ramasamy, D. Physico-chemical, microbial and sensory analysis of aloe vera (pulp) ice cream with natural colour curcumin in different artificial sweeteners. Indian J. Fundam. Appl. Life Sci. 2013, 3, 106–113. [Google Scholar]
  14. Jadhao, R.; Chavan, S.D.; Shelke, R.R.; Shegokar, S.R.; Mane, S.S.; Walke, R.D.; Nage, S.P. Effect of assimilation of tulsi juice and turmeric powder on sensory quality of softy ice-cream. J. Pharmacogn. Phytochem. 2020, 9, 1162–1164. [Google Scholar]
  15. Aumpa, P.; Khawsud, A.; Jannu, T.; Renaldi, G.; Utama-Ang, N.; Bai-Ngew, S.; Walter, P.; Samakradhamrongthai, R.S. Determination for a suitable ratio of dried black pepper and cinnamon powder in the development of mixed-spice ice cream. Sci. Rep. 2022, 12, 15121. [Google Scholar] [CrossRef]
  16. Khawsud, A.; Aumpa, P.; Junsi, M.; Jannu, T.; Nortuy, N.; Samakradhamrongthai, R.S. Effect of black pepper (Piper nigrum) and cinnamon (Cinnamomum verum) on properties of reduced−fat milk−based ice cream. Food Appl. Biosci. J. 2020, 8, 54–67. [Google Scholar]
  17. Verma, R.K.; Kumari, P.; Maurya, R.K.; Kumar, V.; Verma, R.B.; Singh, R.K. Medicinal properties of turmeric (Curcuma longa L.): A review. Int. J. Chem. Stud. 2018, 6, 1354–1357. [Google Scholar]
  18. Razavi, B.M.; Ghasemzadeh Rahbardar, M.; Hosseinzadeh, H. A review of therapeutic potentials of turmeric (Curcuma longa) and its active constituent, curcumin, on inflammatory disorders, pain, and their related patents. Phytother. Res. 2021, 35, 6489–6513. [Google Scholar] [CrossRef]
  19. Hewlings, S.J.; Kalman, D.S. Curcumin: A review of its effects on human health. Foods 2017, 6, 92. [Google Scholar] [CrossRef]
  20. Tabanelli, R.; Brogi, S.; Calderone, V. Improving curcumin bioavailability: Current strategies and future perspectives. Pharmaceutics 2021, 13, 1715. [Google Scholar] [CrossRef]
  21. Sabet, S.; Rashidinejad, A.; Melton, L.D.; McGillivray, D.J. Recent advances to improve curcumin oral bioavailability. Trends Food Sci. Technol. 2021, 110, 253–266. [Google Scholar] [CrossRef]
  22. Milenković, A.; Stanojević, L. Black pepper: Chemical composition and biological activities. Adv. Technol. 2021, 10, 40–50. [Google Scholar] [CrossRef]
  23. Takooree, H.; Aumeeruddy, M.Z.; Rengasamy, K.R.R.; Venugopala, K.N.; Jeewon, R.; Zengin, G.; Mahomoodally, M.F. A systematic review on black pepper (Piper nigrum L.): From folk uses to pharmacological applications. Crit. Rev. Food Sci. Nutr. 2019, 59, S210–S243. [Google Scholar] [CrossRef]
  24. Shoba, G.; Joy, D.; Joseph, T.; Majeed, M.; Rajendran, R.; Srinivas, P.S. Influence of Piperine on the Pharmacokinetics of Curcumin in Animals and Human Volunteers. Planta Med. 1998, 64, 353–356. [Google Scholar] [CrossRef]
  25. Drake, M.A. Invited review: Sensory analysis of dairy foods. J. Dairy Sci. 2007, 90, 4925–4937. [Google Scholar] [CrossRef]
  26. Valentin, D.; Chollet, S.; Lelièvre, M.; Abdi, H. Quick and dirty but still pretty good: A review of new descriptive methods in food science. Int. J. Food Sci. Technol. 2012, 47, 1563–1578. [Google Scholar] [CrossRef]
  27. Singh, R.R.; Singh, R.; Shakya, B.R. Impact of Turmeric addition on the Properties of Paneer, Prepared from different types of Milk. Int. J. Curr. Eng. Technol. 2014, 4, 1874–1883. [Google Scholar]
  28. Ambhore, S.S.; Padghan, P.V.; Thombre, B.M.; Jamadar, K.S. Studies on turmeric powder (Curcuma longa L.) added ghee. Pharma Innov. 2020, 9, 09–14. [Google Scholar]
  29. Al-Soudy, M.; E-Batawy, O.I.; Abdel Fattah, A.A.; Gohari, S.T.; El-Dsouky, W.I. Production of function yoghurt drink fortified with different types of herbal extracts and its biological attributes in hepatitis rats. Arab. Univ. J. Agric. Sci. 2020, 28, 217–228. [Google Scholar]
  30. Seham, K.; Kebary, K.; Shaheen, K.; Mahmood, M. Effect of Adding Bifidobacreria and Turmeric on the Quality of Yoghurt. J. Home Econ. 2015, 25, 151–174. [Google Scholar]
  31. Guerra, A.S.; Hoyos, C.G.; Velásquez-Cock, J.; Vélez, L.; Gañán, P.; Zuluaga, R. The Effects of Adding a Gel-Alike Curcuma longa L. Suspension as Color Agent on Some Quality and Sensory Properties of Yogurt. Molecules 2022, 27, 946. [Google Scholar] [CrossRef]
  32. Shalaby, S.M.; Amin, H.H. Red Cabbage and Turmeric Extracts as Potential Natural Colors and Antioxidants Additives in Stirred Yogurt. J. Probiotics Health 2018, 06, 1000206. [Google Scholar] [CrossRef]
  33. Eze, C.M.; Aremu, K.O.; Nnami, C.L.; Omeje, P.C.; Omelagu, C.A.; Okonkwo, T.M. Effect of the incorporation of graded levels of turmeric (Curcuma longa) on different qualities of stirred yoghurt. Afr. J. Food Sci. 2020, 14, 71–85. [Google Scholar] [CrossRef]
  34. Rahmatalla, S.A.; Alazeem, L.A.; Abdalla, M.O.M. Microbiological Quality of Set Yoghurt Supplemented with Turmeric Powder (Curcuma longa) During Storage. Asian J. Agric. Food Sci. 2017, 05, 1–6. [Google Scholar]
  35. Gaur, G.K.; Rani, R.; Dharaiya, C.N.; Solanki, K. Development of herbal milk using tulsi juice, ginger juice and turmeric powder. Int. J. Chem. Stud. 2019, 7, 1150–1157. [Google Scholar]
  36. Dooley, L.; Lee, Y.-S.; Meullenet, J.F. The application of check-all-that-apply (CATA) consumer profiling to preference mapping of vanilla ice cream and its comparison to classical external preference mapping. Food Qual. Prefer. 2010, 21, 394–401. [Google Scholar] [CrossRef]
  37. Ares, G.; Varela, P.; Rado, G.; Giménez, A. Identifying ideal products using three different consumer profiling methodologies. Comparison with external preference mapping. Food Qual. Prefer. 2011, 22, 581–591. [Google Scholar] [CrossRef]
  38. Varela, P.; Pintor, A.; Fiszman, S. How hydrocolloids affect the temporal oral perception of ice cream. Food Hydrocoll. 2014, 36, 220–228. [Google Scholar] [CrossRef]
  39. Jardines, A.P.; Arjona-Román, J.L.; Severiano-Pérez, P.; Totosaus-Sánchez, A.; Fiszman, S.; Escalona-Buendía, H.B. Agave fructans as fat and sugar replacers in ice cream: Sensory, thermal and texture properties. Food Hydrocoll. 2020, 108, 106032. [Google Scholar] [CrossRef]
  40. Mendonça, G.M.N.; Oliveira, E.M.D.; Rios, A.O.; Pagno, D.H.; Cavallini, D.C.U. Vegan Ice Cream Made from Soy Extract, Soy Kefir and Jaboticaba Peel: Antioxidant Capacity and Sensory Profile. Foods 2022, 11, 3148. [Google Scholar] [CrossRef]
  41. Muenprasitivej, N.; Tao, R.; Nardone, S.J.; Cho, S. The Effect of Steviol Glycosides on Sensory Properties and Acceptability of Ice Cream. Foods 2022, 11, 1745. [Google Scholar] [CrossRef]
  42. Eze, C.M.; Okpala, C.O.R.; Asogwa, I.S.; Nduka, O.C.; Hassani, M.I.; Anchang, M.M.; Okoronkwo, C.N.; Okoyeuzu, C.F. Quality indices of ice cream produced from dairy milk partially substituted with Bambara groundnut (Vigna subterranean (L)Verdc.) beverage. Mljekarstvo 2023, 73, 196–208. [Google Scholar] [CrossRef]
  43. Goff, H.D. Ice cream and frozen desserts: Manufacture. In Encyclopedia of Dairy Sciences, 2nd ed.; Fuquay, J.W., Fox, P.F., McSweeney, P.L.H., Eds.; Academic Press: San Diego, CA, USA, 2011; Volume 2, pp. 899–904. [Google Scholar]
  44. Liou, B.K.; Grün, I.U. Effect of Fat Level on the Perception of Five Flavor Chemicals in Ice Cream with or without Fat Mimetics by Using a Descriptive Test. J. Food Sci. 2007, 72, S595–S604. [Google Scholar] [CrossRef]
  45. Ayed, C.; Martins, S.I.F.S.; Williamson, A.M.; Guichard, E. Understanding fat, proteins and saliva impact on aroma release from flavoured ice creams. Food Chem. 2018, 267, 132–139. [Google Scholar] [CrossRef]
  46. Soukoulis, C.; Chandrinos, I.; Tzia, C. Study of the functionality of selected hydrocolloids and their blends with κ-carrageenan on storage quality of vanilla ice cream. LWT 2008, 41, 1816–1827. [Google Scholar] [CrossRef]
  47. Clarke, C. Ice cream: A complex composite material. In The Science of Ice Cream, 1st ed.; Clarke, C., Ed.; Royal Society of Chemistry: London, UK, 2004; pp. 135–165. [Google Scholar] [CrossRef]
  48. ISO 11136:2014; Sensory Analysis-Methodology-General Guidance for Conducting Hedonic Tests with Consumers in a Controlled Area. ISO (International Organization for Standardization): Geneva, Switzerland, 2014.
  49. Lučan, M.; Ranilović, J.; Slačanac, V.; Cvetković, T.; Primorac, L.; Gajari, D.; Tomić Obrdalj, H.; Jukić, M.; Lukinac Čačić, J. Physico-chemical properties, spreadability and consumer acceptance of low-sodium cream cheese. Mljekarstvo 2019, 70, 13–27. [Google Scholar] [CrossRef]
  50. Popper, R. Use of Just-About-Right Scales in Consumer Research. In Novel Techniques in Sensory Characterization and Consumer Profiling, 1st ed.; Varela, P., Ares, G., Eds.; Taylor & Francis Group, LLC: Boca Raton, FL, USA, 2014; pp. 137–154. [Google Scholar]
  51. Sensory Analysis: Overview of Methods and Application Areas-DLG Expert Report . Available online: https://www.dlg.org/en/food/topics/dlg-expert-reports/sensory-technology/sensory-analysis-overview-of-methods-and-application-areas (accessed on 30 June 2023).
  52. ISO 21528-2:2017; Microbiology of the Food Chain—Horizontal Method for the Detection and Enumeration of Enterobacteriaceae—Part 2: Colony-Count Technique. ISO (International Organization for Standardization): Geneva, Switzerland, 2017.
  53. ISO 6579-1:2017; Microbiology of the Food Chain—Horizontal Method for the Detection, Enumeration and Serotyping of Salmonella—Part 1: Detection of Salmonella spp. ISO (International Organization for Standardization): Geneva, Switzerland, 2017.
  54. ISO 4833:2013; Microbiology of the Food Chain—Horizontal Method for the Enumeration of Microorganisms—Part 1: Colony Count at 30 °C by the Pour Plate Technique. ISO (International Organization for Standardization): Geneva, Switzerland, 2013.
  55. ISO 11290-1:2017; Microbiology of the Food Chain—Horizontal Method for the Detection and Enumeration of Listeria Monocytogenes and of Listeria spp.—Part 1: Detection Method. ISO (International Organization for Standardization): Geneva, Switzerland, 2017.
  56. ISO 11290-2:2017; Microbiology of the Food Chain—Horizontal Method for the Detection and Enumeration of Listeria Monocytogenes and of Listeria spp.—Part 2: Enumeration Method. ISO (International Organization for Standardization): Geneva, Switzerland, 2017.
  57. ISO 6888-1:2021; Microbiology of the Food Chain—Horizontal Method for the Enumeration of Coagulase-Positive Staphylococci (Staphylococcus Aureus and Other Species)—Part 1: Method Using Baird-Parker Agar Medium. ISO (International Organization for Standardization): Geneva, Switzerland, 2021.
  58. Meyners, M. Testing for differences between impact of attributes in penalty-lift analysis. Food Qual. Prefer. 2016, 47, 29–33. [Google Scholar] [CrossRef]
  59. Ministry of Agriculture Croatia: Regulation on Microbiological Criteria for Foodstuffs. 2008. Available online: https://narodne-novine.nn.hr/clanci/sluzbeni/2008_06_74_2454.html (accessed on 20 June 2023).
  60. Ministry of Agriculture Croatia. Guidance on Microbiological Criteria for Foodstuffs, 3rd ed.; 2011. Available online: http://veterinarstvo.hr/default.aspx?id=4548 (accessed on 20 June 2023).
  61. European Commission. Commission Regulation (EC) No. 2073/2005 of 15 November 2005 on Microbiological Criteria for Foodstuffs. Off. J. Eur. Union 2005, 338, 1–26. Available online: https://eur-lex.europa.eu/legal-content/HR/TXT/?uri=CELEX:32005R2073 (accessed on 20 June 2023).
  62. Delgado-Vargas, F.; Paredes-Lopez, O. Natural Colorants for Food and Nutraceutical Uses, 1st ed.; Delgado-Vargas, F., Paredes-Lopez, O., Eds.; CRC Press: Boca Raton, FL, USA, 2002. [Google Scholar]
  63. Hasegawa, T.; Nakatani, K.; Fujihara, T.; Yamada, H. Aroma of Turmeric: Dependence on the Combination of Groups of Several Odor Constituents. Nat. Prod. Commun. 2015, 10, 1047–1050. [Google Scholar]
  64. Umaraw, P.; Verma, A.K.; Singh, V.P.; Fahim, A. Effect of Turmeric and Aloe Vera Extract on Shelf-Life of Goat and Buffalo Admixture Milk Paneer during Refrigeration Storage. Foods 2022, 11, 3870. [Google Scholar] [CrossRef]
  65. Ghodekar, K.; Shelke, R.N.; Kahate, P.A.; Ingle, S. Studies on sensory evaluation and shelf-life of herbal softy ice cream. Food Sci. Res. J. 2016, 7, 21–26. [Google Scholar] [CrossRef]
  66. Yang, J.; Lee, J. Application of sensory descriptive analysis and consumer studies to investigate traditional and authentic foods: A review. Foods 2019, 8, 54. [Google Scholar] [CrossRef]
  67. Lučan Čolić, M.; Antunović, M.; Lukinac, J.; Babić, J.; Jozinović, A.; Matijević, B.; Nikolić, T.; Jukić, M. Physicochemical Properties of Turmeric and Black Pepper Enriched Ice Cream. Mljekarstvo, 2023; submitted. [Google Scholar]
  68. Amador, J.; Hartel, R.; Rankin, S. The Effects of Fat Structures and Ice Cream Mix Viscosity on Physical and Sensory Properties of Ice Cream. J. Food Sci. 2017, 82, 1851–1860. [Google Scholar] [CrossRef]
  69. Laokuldilok, N.; Thakeow, P.; Kopermsub, P.; Utama-ang, N. Optimisation of microencapsulation of turmeric extract for masking flavor. Food Chem. 2016, 194, 695–704. [Google Scholar] [CrossRef]
  70. Oliveira, A.R.; Ribeiro, A.E.C.; Oliveira, E.R.; Ribeiro, K.O.; Garcia, M.C.; Careli-Gondim, I.; Junior, M.S.S.; Caliari, M. Physicochemical, microbiological and sensory characteristics of snacks developed from broken rice grains and turmeric powder. Int. J. Food Sci. Technol. 2020, 55, 2719–2729. [Google Scholar] [CrossRef]
  71. Warren, M.M.; Hartel, R.W. Structural, Compositional, and Sensorial Properties of United States Commercial Ice Cream Products. J. Food Sci. 2014, 79, E2005–E2013. [Google Scholar] [CrossRef]
  72. Guinard, J.-X.; Mazzucchelli, R. The sensory perception of texture and mouthfeel. Trends Food Sci. Technol. 1996, 7, 213–219. [Google Scholar] [CrossRef]
  73. Higgins, M.J.; Hayes, J.E. Regional variation of bitter taste and aftertaste in humans. Chem. Senses 2019, 44, 721–732. [Google Scholar] [CrossRef]
  74. Hammouti, B.; Dahmani, M.; Yahyi, A.; Ettouhami, A.; Messali, M.; Asehraou, A.; Bouyanzer, A.; Warad, I.; Touzani, R. Black Pepper, the ‘King of Spices’: Chemical composition to applications. Arab. J. Chem. Environ. Res. 2019, 6, 12–56. [Google Scholar]
  75. Grasso, S.M. The Effects of Health Information on the Acceptability of a Functional Beverage Containing Fresh Turmeric. Master’s Thesis, Virginia Polytechnic Institute and State University, Blacksburg, VA, USA, 29 June 2018. [Google Scholar]
  76. Draszanowska, A.; Karpińska-Tymoszczyk, M.; Simões, M.; Olszewska, M.A. The Effect of Turmeric Rhizome on the Inhibition of Lipid Oxidation and the Quality of Vacuum-Packed Pork Meatloaf. Appl. Sci. 2022, 12, 10641. [Google Scholar] [CrossRef]
  77. Tangkham, W. Sensory Characteristics of Three Different Levels of Turmeric Powder on Beef Stick Product. Act. Sci. Nutr. Health 2020, 4, 14–18. [Google Scholar] [CrossRef]
  78. Silva, L.V.; Nelson, D.L.; Drummond, M.F.B.; Dufossé, L.; Gloria, M.B.A. Comparison of hydrodistillation methods for the deodorization of turmeric. Food Res. Int. 2005, 38, 1087–1096. [Google Scholar] [CrossRef]
  79. Partio, E.K.U.; Tedjakusuma, F.; Surya, R. Analysis of antioxidant and hedonic acceptance of turmeric extract-enriched milk. In Proceedings of the 6th International Conference on Eco Engineering Development, Online, 16–17 November 2022. [Google Scholar] [CrossRef]
  80. Mamatha, B.S.; Prakash, M.; Nagarajan, S.; Bhat, K.K. Evaluation of the flavor quality of pepper (piper nigrum l.) Cultivars by GC-MS, electronic nose and sensory analysis techniques. J. Sens. Stud. 2008, 23, 498–513. [Google Scholar] [CrossRef]
  81. Ares, G.; Barreiro, C.; Deliza, R.; Giménez, A.; Gámbaro, A. Application of a check-all-that-apply question to the development of chocolate milk desserts. J. Sens. Stud. 2010, 25, 67–86. [Google Scholar] [CrossRef]
Figure 1. Samples presented to the participants: (a) control (standard) ice cream; (b) turmeric-enriched ice cream; (c) turmeric- and black-pepper-enriched ice cream.
Applsci 13 11802 g001
Figure 2. Penalty analysis (PA) plot of JAR data. Mean drop in overall liking score for the ice cream samples when intensity of attributes was too low or too strong. The too low intensity of attributes are highlighted with blue (−), and too strong with orange (+). The dashed quadrat represents the decrease in overall liking score for more than 1 point by more than 20% of consumers. C—control sample; T0, T1, T2—samples with 0.5%, 1.0%, and 2.0% of turmeric; p—samples with added 0.02% black pepper.
Applsci 13 11802 g002
Figure 3. Correspondence analysis (CA) of CATA test. Symmetric plot. Orange dots are terms used in CATA test (light orange for texture and appearance, medium orange for taste and aroma, and dark orange for mouthfeel terms), and blue dots are the samples of ice cream. No significant differences among samples for terms in non-italic oblique style (Cochran’s Q test). C—control sample; T0, T1, T2—samples with 0.5%, 1.0%, and 2.0% of turmeric; p—samples with added 0.02% black pepper.
Applsci 13 11802 g003
Figure 4. Penalty analysis of CATA data. (a) PA plot: mean drop in overall liking score for the ice cream samples when CATA term was selected; (b) PLA plot of CATA attributes and overall liking (based on the participants’ evaluation of the ice cream samples). Blue bars indicate attributes that increased overall liking, while orange bars indicate attributes that decreased overall liking.
Applsci 13 11802 g004
Figure 5. Principal component analysis (PCA) of all tested attributes of ice cream samples. C—control sample; T0, T1, T2—samples with 0.5%, 1.0%, and 2.0% of turmeric; p—samples with added 0.02% black pepper.
Applsci 13 11802 g005
Table 1. Ice cream samples formulations.
SamplesCT0T1T2T0pT1pT2p
Basic ice cream mixture53.5% UHT milk; 25.5% cream; 5.5% skim milk powder;
15.0% sucrose; 0.3% soy lecithin; and 0.2% guar gum
Turmeric powder (%)-0.51.02.00.51.02.0
Black pepper (%)----0.020.020.02
Ice cream mixesApplsci 13 11802 i001Applsci 13 11802 i002Applsci 13 11802 i003Applsci 13 11802 i004Applsci 13 11802 i005Applsci 13 11802 i006Applsci 13 11802 i007
C—control sample; T0, T1, T2—samples with 0.5%, 1.0%, and 2.0% of turmeric; p—samples with added 0.02% black pepper.
Table 2. Panel-generated sensory terms for CATA test of ice cream.
Texture and AppearanceTaste and AromaMouthfeel
SmoothMilkyBurning
FoamyButteryHeat sensation
InhomogeneousSweetTingling
CrystalizedBitter
SandyHot
GrainySpicy
CreamyPeppery
RoughPungent
Ginger
Vanilla
Off-flavour
Pleasant
Unpleasant
Table 3. Consumer liking scores for sensory attributes and overall acceptance of the ice cream samples.
Ice CreamSensory AttributesOverall Liking
AppearanceScoopabilityMouthfeelTasteAroma
C4.69 ± 0.54 a4.61 ± 0.65 ab4.74 ± 0.59 a4.46 ± 0.62 a4.37 ± 0.77 a7.42 ± 1.25 a
T04.27 ± 1.08 bc4.71 ± 0.54 a4.66 ± 0.59 a4.06 ± 1.05 ab4.26 ± 0.85 ab6.90 ± 1.70 ab
T14.18 ± 1.02 bcd4.62 ± 0.67 ab4.53 ± 0.65 ab3.76 ± 1.22 bc3.92 ± 1.06 b6.32 ± 1.97 b
T23.99 ± 1.07 cd4.50 ± 0.79 ab3.90 ± 1.05 c2.99 ± 1.22 d3.50 ± 1.07 c5.31 ± 2.06 c
T0p4.48 ± 0.88 ab4.60 ± 0.75 ab4.58 ± 0.72 ab4.28 ± 0.91 a4.29 ± 0.90 ab6.94 ± 1.85 ab
T1p4.37 ± 0.95 abc4.52 ± 0.78 ab4.28 ± 0.92 b3.54 ± 1.22 c3.94 ± 1.06 b6.32 ± 2.03 b
T2p3.85 ± 1.22 d4.35 ± 0.89 b3.73 ± 1.21 c2.86 ± 1.18 d3.25 ± 1.19 c4.82 ± 2.33 c
Values are means ± SD (n = 103); values in the same column with different superscripts are significantly different using the Tukey HSD test (p < 0.05). C—control sample; T0, T1, T2—samples with 0.5%, 1.0%, and 2.0% of turmeric; p—samples with added 0.02% black pepper.
Table 4. Purchase and consumption intention of the ice cream samples.
Ice CreamPurchase IntentionIntention to Consume (%)
C3.92 ± 1.06 a95.15 ± 0.22 a
T03.58 ± 1.19 ab84.47 ± 0.36 ab
T13.21 ± 1.27 bc76.70 ± 0.42 b
T22.44 ± 1.19 d53.40 ± 0.50 c
T0p3.64 ± 1.20 ab82.25 ± 0.38 ab
T1p3.04 ± 1.36 c70.87 ± 0.46 b
T2p2.33 ± 1.30 d44.66 ± 0.50 c
Purchase intention was evaluated using a five-point scale (1 = certainly wouldn’t buy; 2 = possible wouldn’t buy; 3 = maybe would buy/maybe wouldn’t buy; 4 = possible would buy; 5 = certainly would buy). Values are means ± SD (n = 103). Values in the same column with different superscripts are significantly different using the Tukey HSD test (p < 0.05). Intention to consume was evaluated using a binomial scale (Yes or No) to answer the question: “If this product were available to you, would you consume it?” Values are the percentages of respondents (n = 103) who answered the question positively. Values in the same column with different superscripts are significantly different using the Cochran’s Q test (p < 0.05). C—control sample; T0, T1, T2—samples with 0.5%, 1.0%, and 2.0% of turmeric; p—samples with added 0.02% black pepper.
Table 5. Just-about-right (JAR) values for the intensity of sensory attributes of the ice cream samples.
Ice CreamColourScoopabilityMeltingTasteSweetnessAftertasteBitternessAroma
C−0.12 ± 0.51 c0.26 ± 0.69 a0.11 ± 0.56 a−0.11 ± 0.66 c0.04 ± 0.79 ab−0.20 ± 0.69 d−0.36 ± 0.68 c−0.21 ± 0.74 d
T0−0.46 ± 0.85 d0.26 ± 0.69 a0.23 ± 0.64 a0.19 ± 0.74 c−0.02 ± 0.66 ab0.22 ± 0.78 c0.16 ± 0.62 b0.01 ± 0.73 cd
T10.22 ± 0.92 b0.03 ± 0.59 ab0.22 ± 0.66 a0.60 ± 0.72 b−0.16 ± 0.59 ab0.35 ± 0.79 bc0.23 ± 0.69 b0.29 ± 0.85 bc
T20.69 ± 0.78 a−0.21 ± 0.68 bc0.23 ± 0.66a1.00 ± 0.84 a−0.23 ± 0.89 b0.92 ± 0.70 a0.58 ± 0.80 a0.75 ± 0.70 a
T0p−0.49 ± 0.74 d0.04 ± 0.59 ab0.16 ± 0.46 a0.03 ± 0.65 c0.11 ± 0.66 a−0.12 ± 0.66 d−0.17 ± 0.62 c−0.08 ± 0.55 d
T1p0.18 ± 0.68 bc−0.02 ± 0.58 b0.19 ± 0.63 a0.54 ± 0.76 b−0.03 ± 0.88 ab0.60 ± 0.76 b0.27 ± 0.63 b0.42 ± 0.72 b
T2p0.80 ± 0.76 a−0.32 ± 0.70 c0.21 ± 0.84 a0.98 ± 0.90 a−0.22 ± 0.97 b0.95 ± 0.89 a0.67 ± 0.83 a0.82 ± 0.78 a
The intensity of attributes evaluated using a five-point JAR scale (−2 = too weak, −1 = slightly weak, 0 = ideal/just about right, +1 = slightly strong, +2 = too strong). Values are means ± SD (n = 103). Values in the same column with different superscripts are significantly different using the Tukey HSD test (p < 0.05). C—control sample; T0, T1, T2—samples with 0.5%, 1.0%, and 2.0% of turmeric; p—samples with added 0.02% black pepper.
Table 6. Frequency of CATA terms for the ice cream samples.
AttributesCT0T1T2T0pT1pT2p
Appearance and TextureSmooth ***82.52 cd78.64 bcd77.67 bcd64.08 b84.47 d68.93 bc49.51 a
Foamy ***9.71 a13.59 ab18.45 ab20.39 ab26.21 ab28.16 b27.18 b
Inhomogeneous *3.88 a0.00 a2.91 a8.74 a1.94 a5.83 a4.85 a
Crystalized ns6.80 a3.88 a2.91 a1.94 a1.94 a1.94 a3.88 a
Sandy ***5.83 a8.74 a11.65 a30.10 b7.77 a28.16 b37.86 b
Grainy ***0.00 a4.85 a2.91 a25.24 b2.91 a10.68 ab25.24 b
Creamy ***87.38 c87.38 c80.58 bc64.08 ab85.44 c76.70 bc59.22 a
Rough *0.97 a2.91 a1.94 a7.77 a0.97 a0.97 a8.74 a
Taste and AromaMilky ***96.12 c69.90 b67.96 b45.63 a66.02 b61.17 b40.78 a
Buttery ***65.05 c29.13 ab18.45 a16.50 a35.92 b29.13 ab18.45 a
Sweet ***60.19 d45.63 cd38.83 bc24.27 ab49.51 cd35.92 abc20.39 a
Bitter ***0.00 a9.71 ab15.53 bc16.50 bc6.80 ab15.53 bc26.21 c
Hot ***0.00 a12.62 bc6.80 abc12.62 bc2.91 ab10.68 abc19.42 c
Spicy ***0.00 a22.33 b32.04 bc43.69 cd18.45 b40.78 c59.22 d
Peppery ***0.00 a6.80 ab11.65 b18.45 bc16.50 bc30.10 cd44.66 d
Pungent ***0.00 a1.94 ab12.62 bcd23.30 d4.85 abc8.74 abcd15.53 cd
Ginger ***0.00 a10.68 ab23.30 cd28.16 d14.56 bc22.33 bcd29.13 d
Vanilla ***27.18 b15.53 ab6.80 a7.77 a14.56 ab10.68 a4.85 a
Off flavour ***0.00 a28.16 bc36.89 c30.10 bc19.42 b21.36 b27.18 bc
Pleasant ***65.05 c63.11 c42.72 b16.50 a60.19 c37.86 b17.48 a
Unpleasant ***0.97 a4.85 a11.65 ab22.33 bc5.83 a10.68 ab32.04 c
MouthfeelBurning ***1.94 a0.00 a4.85 a20.39 bc8.74 ab18.45 bc28.16 c
Heat sensation ***1.94 a8.74 ab8.74 ab24.27 c15.53 bc19.42 bc19.42 bc
Tingling ***10.68 a22.33 abc25.24 bc27.18 bc11.65 ab22.33 abc35.92 c
Values are percentages of frequency of selection of the CATA terms. * indicates p < 0.05, *** indicates p < 0.001, and ns indicates no significant differences among samples for Cochran’s Q test. Values in the same column with different superscripts are significantly different using the post hoc McNemar (Bonferroni) procedure (p < 0.05). C—control sample; T0, T1, T2—samples with 0.5%, 1.0%, and 2.0% of turmeric; p—samples with added 0.02% black pepper.
Disclaimer/Publisher’s Note: The statements, opinions and data contained in all publications are solely those of the individual author(s) and contributor(s) and not of MDPI and/or the editor(s). MDPI and/or the editor(s) disclaim responsibility for any injury to people or property resulting from any ideas, methods, instructions or products referred to in the content.

