Article

Development of Emotion Lexicons to Describe Sugar-Free Chocolate According to Consumers’ PROP Taster Status

The Africa Unit for Transdisciplinary Health Research (AUTHeR), School of Physiology, Nutrition and Consumer Sciences, North-West University, Potchefstroom 2531, South Africa
*
Author to whom correspondence should be addressed.
Appl. Sci. 2023, 13(24), 12994; https://doi.org/10.3390/app132412994
Submission received: 15 November 2023 / Revised: 1 December 2023 / Accepted: 2 December 2023 / Published: 5 December 2023
(This article belongs to the Special Issue Sensory Characteristics and Consumers Acceptance of Food Products)

Abstract

:
Taste sensitivity can have a significant impact on consumers’ food choices. Consumers’ taster status and emotions can be guided by sensory information of sugared products. This paper aimed to develop emotional lexicons for sugar-free chocolates based on consumers’ taster status applying the check-all-that-apply (CATA) methodology. South African respondents’ (n = 153) bitter perception was evaluated with n-propylthiouracil (PROP) paper strips. Respondents received one sugar-free dark chocolate and one sugar-free milk chocolate and completed an electronic questionnaire. Respondents mainly purchased chocolate for its flavour, and enjoyed the taste of the sugar-free dark chocolate more than sugar-free milk chocolate. The non-tasters (>50%) chose positive emotions for sugar-free milk chocolate, while the medium tasters, selected more positive emotions for dark chocolate. The supertasters selected the most negative emotions for the sugar-free dark chocolate. Practical significant associations were found between the non-tasters and the emotion guilty, as well as between the supertasters and the emotions, discontented and disgust. Each taster status requires the development of a distinctive lexicon to be emotionally satisfied by sugar-free products.

1. Introduction

Excessive consumption of dietary sugar is a considerable public health concern as it is often linked to health conditions, such as non-communicable diseases (NCDs) and obesity which is consequently associated with cancer, diabetes, and cardiovascular diseases [1,2,3,4,5]. Currently, more than 50% of South Africans are either overweight or obese [6]. Based on these statistics, immediate action is required to lower consumers’ sugar intake and to provide them sugar-free products that are both healthier and sensory acceptable as taste has been identified as the most influential driver for consumers to accept or reject food products [7,8,9].
In South Africa, consumers often regard low-sugar foods to have an unacceptable taste [10] and perceive them to be predominantly consumed when one experiences certain health related issues such as diabetes or concerns regarding weight gain [11]. Low-calorie sweeteners are frequently used in food product development to substitute the sugar content of food products; however, they may cause an unpleasant taste or bitter aftertaste [12,13].
A bitter taste perception is caused by the taste receptor gene, 25 TAS2R, causing consumers to be sensitive towards a bitter taste [14,15] and as a result avoid bitter-tasting foods [16,17] including sugar-free chocolates, known as a cocoa-based snack with less sugar that may contain sweeteners [18].
Taster status is categorised according to consumers’ sensitivity towards bitterness [19,20], determined by the TAS2R38 gene [21]. A bitter-compound 6-n-propylthiouracil (PROP) is used to determine consumers’ taster status, i.e., non-, medium-, and super tasters [22]. For non-tasters, PROP is none or slightly bitter, for medium-tasters PROP is mildly bitter and for super-tasters, PROP is intensely bitter [23].
Consumers that are sensitive towards a bitter taste tend to display negative emotional responses towards food and beverages with a bitter compound [24]. An emotional response is a reaction towards one’s feelings that is backed by physiological changes that could motivate certain behavioural responses [25]. One’s emotional response of a food product is shaped by the product preference, perception, brands, moods, attitudes, sensory experience, choices, likings, and feelings towards the product. Consumers’ emotional responses towards a food product can be collected in the form of emotional terms known then as emotional lexicons [26,27].
As confirmed, emotional responses are associated with one’s sensory experiences, which affect consumer’s product choices [28]. Taster status influences consumers’ emotional response, consumption and purchasing behaviour towards food products as consumers often use their emotions as a guide during purchasing choices [29,30]. Researchers established a distinct association between bitter taste perception and emotional response [24]. For example, supertasters tend to show a negative emotional response of bitter tasting foods that contain bitter-tasting compounds (e.g., flavonoids, glucosinolates, phenols). Examples of bitter tasting foods include beverages (e.g., beer, coffee, tonic water), dark chocolate and vegetables (e.g., broccoli, brussels sprouts, cabbage) [24].
Limited research has been carried out on consumers’ emotional responses to sugared food products such as chocolates. In addition, very few studies have studied how consumers’ different taster status influence their emotions when consuming chocolate products. Although individual differences are known for consuming chocolate, several reasons why consumers eat chocolate have been reported. For example, chocolate’s beneficial impact on emotions [31] are known as the emotions, joy and pleasant are often associated with chocolate consumption. Chocolate is also often consumed when consumers develop cravings for it or they may also avoid consumption as they experience feelings of guilt [32,33], affected by their emotions.
Therefore, because each consumer’s taster status is different, their preference towards foods will differ, and therefore, it is worth determining the associations between the consumers’ emotional response and their taster status. The aim of this paper was to develop emotional lexicons for one sugar-free milk chocolate and one sugar-free dark chocolate based on respondents’ taster status applying the check-all-that-apply (CATA) methodology.

2. Materials and Methods

2.1. Sampling and Data Collection

For this study, a convenience sampling method was implemented with inclusion and exclusion criteria. Of the 158 of the respondents who collected the samples, only 153 respondents fully completed the online questionnaire. Respondents were included in the study if they were 18 years or older, understood the English language, were computer literate, and enjoyed consuming chocolate. Respondents with any known food allergies were excluded from the study. For data collection, respondents were recruited via social media platforms. Successfully screened respondents collected a chocolate sample bag at a local cafeteria centrally located in the city of Potchefstroom, North-West Province. The sample bag included: three PROP paper strips (Vacutec Pty. Ltd., Johannesburg, South Africa) packed in a resealable plastic bag; one unbranded sugar-free dark chocolate bar and one unbranded sugar-free milk chocolate bar; a bottle of still water (250 mL) and one instruction pamphlet with a link to the online questionnaire.
Data collection occurred in January 2021, during which South Africa entered lock-down level 3 due to the COVID-19 pandemic [34]. The respondents were instructed to complete the tasting and questionnaire within 72 h after collection of the chocolate samples.

2.2. Chocolate Samples

The sugar-free chocolate samples consisted of milk and dark chocolate bars (40 g each), purchased at a reputable food retailer in South Africa. The milk and dark chocolate contained cocoa solids of 36% and 80%, respectively. All chocolate samples contained no added sugar and included sweeteners (erythritol and steviol glycoside) and fibres (dextrin, inulin, oligofructose).
According to the nutritional information (Appendix A), the milk chocolate’s energy, protein, carbohydrates, total sugar, and sodium content was higher, but the dietary fibre content of the dark chocolate was higher. Before the collection of the sample bags, all chocolate bars were unbranded by removing the outer wrapper labels.

2.3. Questionnaire

The electronic questionnaire was administered using QuestionPro© (v20.4, Seattle, DC, USA). The questionnaire consisted of four sections. The first section measured respondents’ PROP taster status. Respondents placed a PROP paper strip on their tongue for 30 s after which they rated their perception of the stimulus on a Labelled Magnitude Scale (LMS) (1 = “barely detectable” to 100 = “strongest imaginable”). The following cut-off criteria for the tasting groups’ classification were applied: non-tasters between 0 and 15.5; medium tasters between 15.5 and 51; and supertasters above 51 [35].
In the second section [27], five-point Likert scales were implemented to determine:
  • The considering factors when purchasing chocolate (1 = flavour; 2 = brand; 3 = packaging; 4 = price; 5 = other reason (specify));
  • Frequency of chocolate consumption (1 = daily; 2 = more than twice a week; 3 = twice a week; 4 = once a week; 5 = once a month or less);
  • Reasons for chocolate consumption (1 = for emotional satisfaction (indulgence); 2 = to overcome hunger; 3 = regard it as healthy; 4 = as a habit; 5 = other reason); and
  • Taste and aftertaste (sensory response) (1 = dislike extremely to 5 = like extremely) and purchase intention (1 = definitely would not buy to 5 = definitely would buy) of sugar-free chocolates.
In the third section, the EmoSensory wheel and CATA method was implemented to determine respondents’ emotional response after the evaluation of the sugar-free chocolates. The EmoSensory wheel consists of 17 emotional terms [36]. CATA is utilized in sensory research because it can generate detailed, discriminative data [37]. An open-ended question was included for respondents to indicate if they would like to add any additional emotional terms during the tasting of the chocolates. In the last section, the researchers collected the demographic characteristics of age and gender.

2.4. Statistical Analysis

Descriptive analysis was performed for all variables, including means, frequencies, and percentages. To assess if there is a significant association between consumers’ taster status, demographics and consumers’ emotions, cross-tabulations with phi coefficient and Cramer’s V were performed. A significance level of p < 0.05 was implemented. All statistical analyses were performed using SPSS 26.0 (SPSS Inc., Chicago, IL, USA).

3. Results and Discussion

3.1. Demographic Characteristics
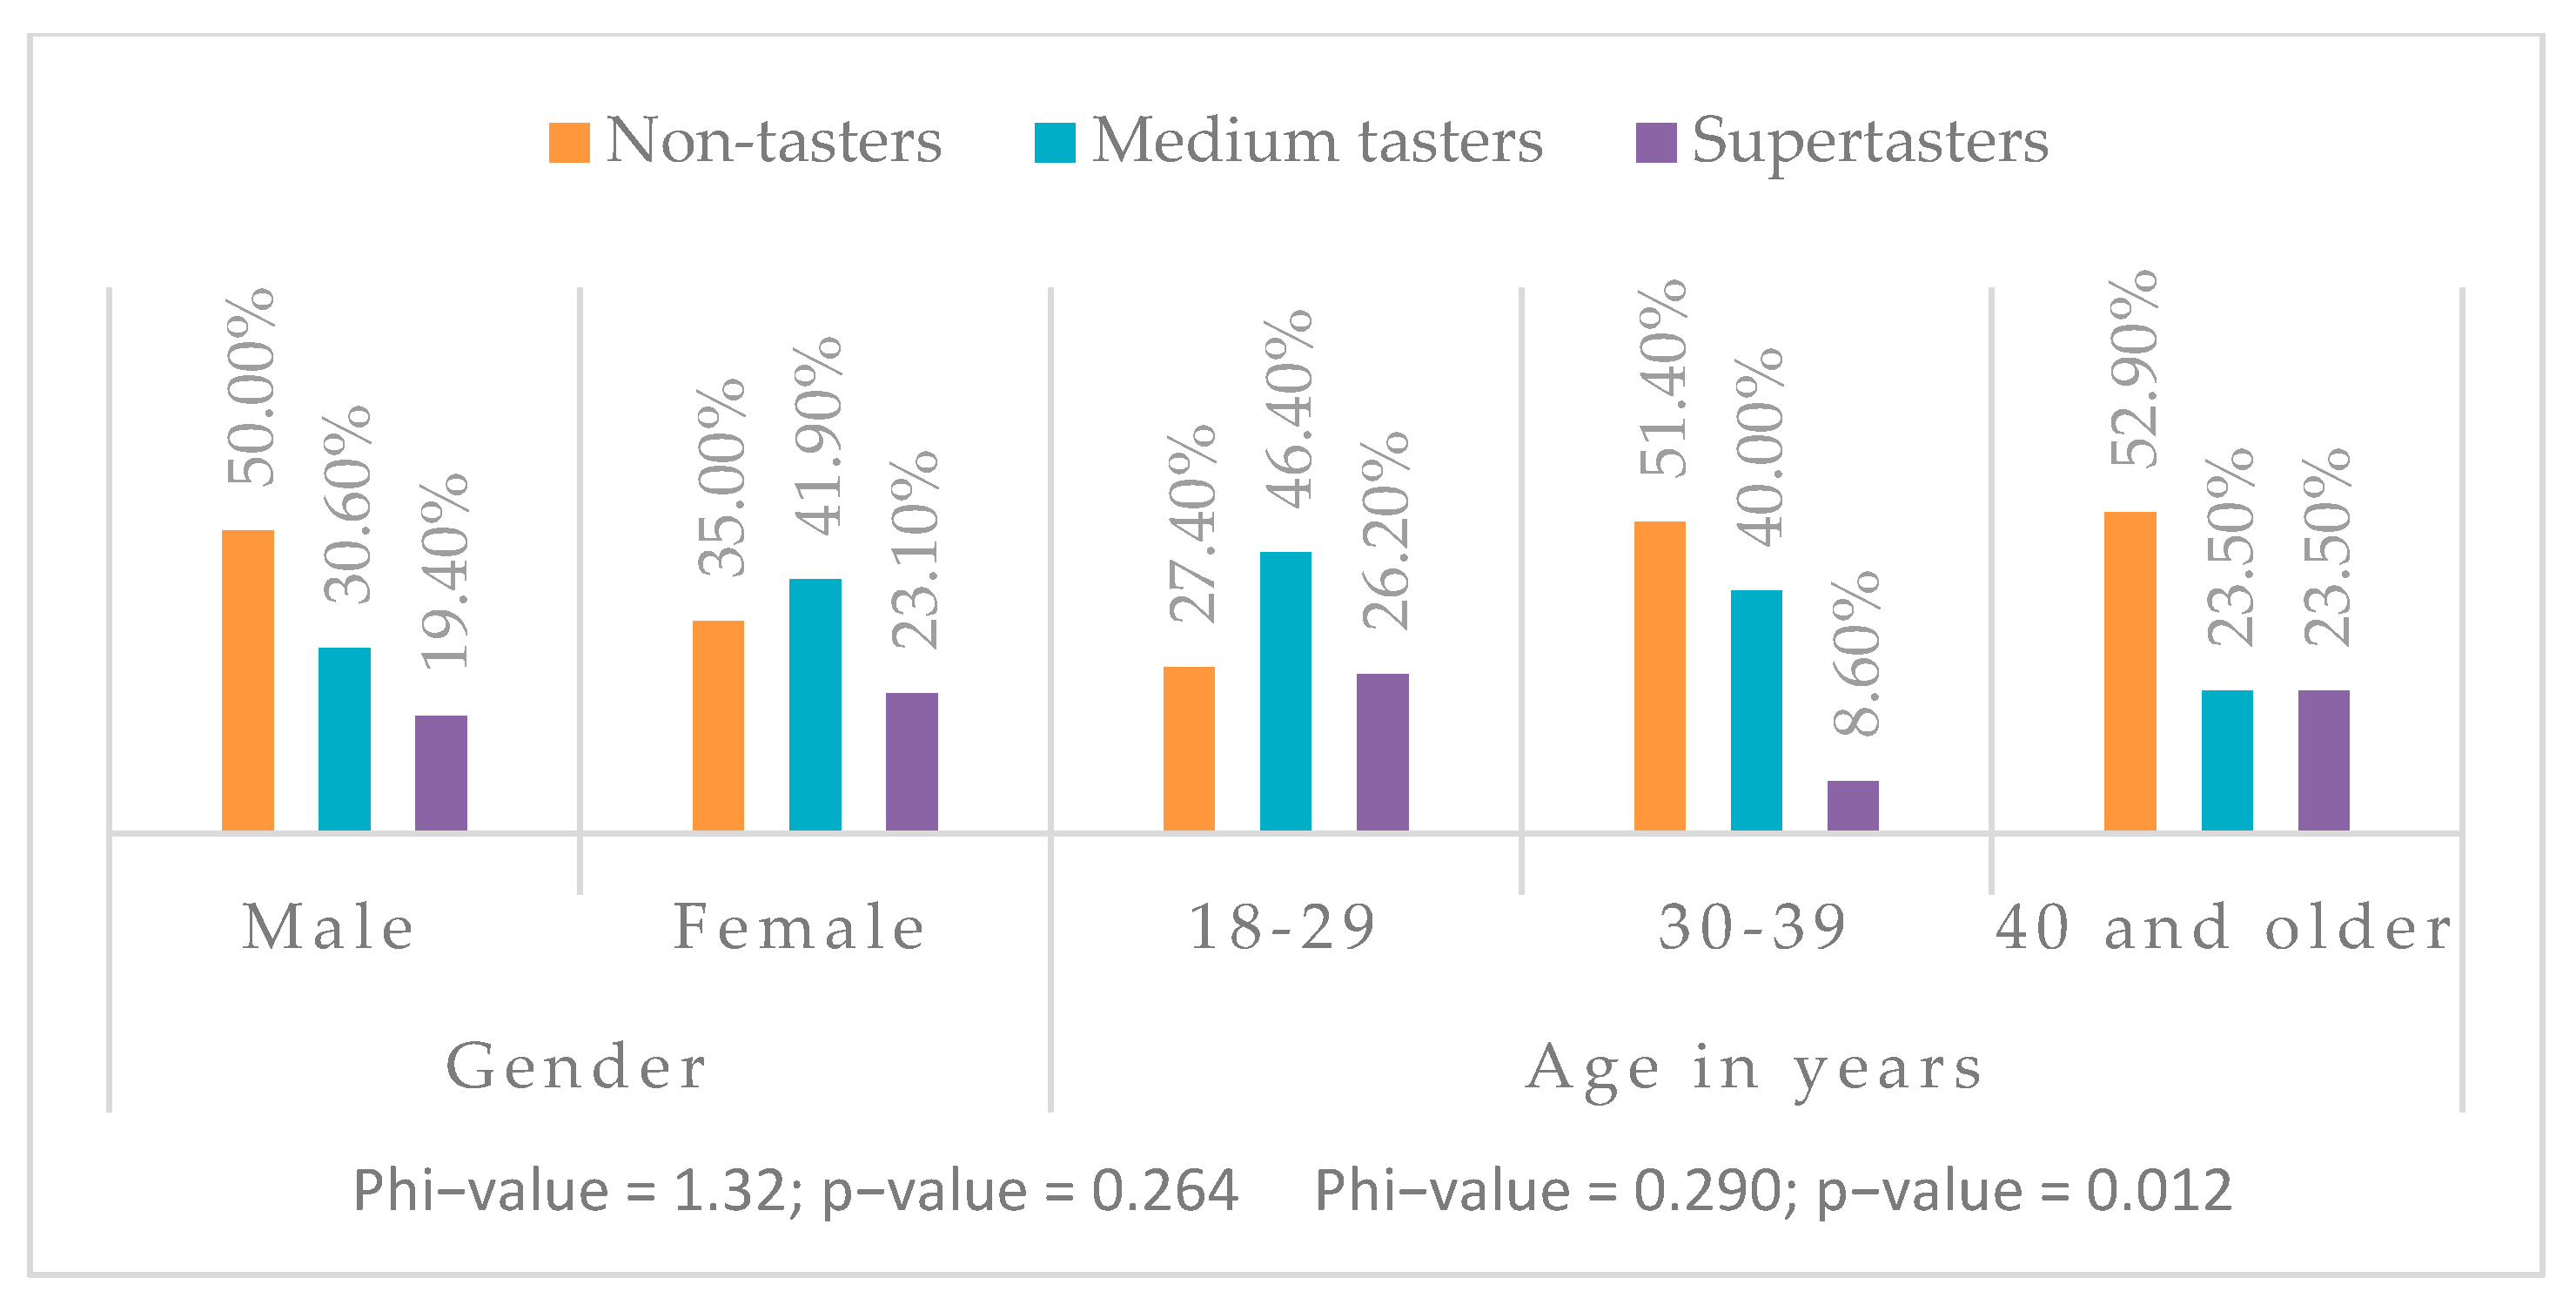
Table 1 indicates the demographic characteristics of the study. Most of the respondents were young people between the ages of 18 and 29 (54.90%), and by gender they were female (75.97%). The relationship between demographic characteristics and South African consumers’ taster status reveals valuable information that can be used by marketers to target a set of consumers. For example, when developing sugar-free foods with bitter notes, they could target male consumers in advertisements, as female consumers are more likely to be supertasters. While some studies reported females to have more fungiform papillae and taste buds [38,39], others found that females perceived PROP intensity higher than males [40,41]. Furthermore, it was found that females perceived the bitter intensity significantly higher than males, therefore females were observed to be the majority of super-tasters [42]. The same principle can be used with the age groups; since ageing has a declining effect on the taste function [43], older consumers can be targeted for stronger flavoured sugar-free products.

3.2. Taster Status

The PROP taster status test indicated an almost equal distribution of respondents between non-tasters (38.6%) and medium tasters (39.9%). The remainder of the respondents were classified as super- tasters (21.5%). The distribution of the taster groups is similar to the distribution in a similar study who reported supertasters as 25.95%, and medium- and non-tasters as 32.06% and 41.98%, respectively [44]. Knowing consumers’ taster status can assist the food industry to develop sugar-free products targeted for consumers’ unique taste profile.

3.3. Chocolate Purchase and Consumption

An overview of consumers’ general chocolate consumption and purchasing behaviour is presented in Table 2. The main considering factors when purchasing chocolate for own consumption are flavour (75.3%), brand (16.5%), and price (8.2%). Similar findings confirm that flavour is the key driver for consumers’ preference and purchase intention with this product category [45].
As consumers’ main reason to purchase chocolate is flavour, it is recommended that the food industry manages its resources, such as the use of consumers’ taster status, which could reveal valuable information for product developers to improve the taste of sugar-free products. For example, due to supertasters being sensitive to bitter tastes, product developers should focus on developing new healthier sugar-free products with less bitter-tasting notes. This could lead to a higher success rate in the sugar-free market because more supertasters will like and purchase these products, as both their specific taste preference and need to consume less sugar will be fulfilled leading to healthier choices as well as consumer satisfaction.
More than 30% of the respondents consume chocolates at least once a week, followed by those consuming chocolate more than twice a week (25.9%). These findings confirm respondents’ regular chocolate consumption.
More than 55% of respondents revealed that emotional satisfaction (indulgence) is the main reason for consuming chocolate. It may be due to cravings [12], a need for elevated mood and energy levels or because it is seen as pleasurable, relaxant, aphrodisiac and may act as an antidepressant [46]. A similar study found that most participants consumed chocolate at least once a week, ate chocolate for satisfaction (indulgence) and flavour was the main reason for purchases [27].

3.4. Acceptance and Purchase Intention of Sugar-Free Chocolates

Respondents’ taste, aftertaste, and purchase intent regarding both chocolate samples are presented in Table 3. Generally, the sugar-free dark chocolate’s taste and aftertaste were more liked than those of the sugar-free milk chocolate. The dark chocolate’s taste was very much liked (4.09 + 0.97). The lower level of sweetness in dark chocolate can be ascribed to the higher levels of cocoa present [18].
Researchers determined the sensory profile and acceptability of reduced calorie chocolates and found that the crucial attributes which determined acceptability in chocolates were sweet aroma, sweetness, and melting rate, whereas bitterness, bitter aftertaste, sandiness, and adherence were drivers of disliking [13]. Researchers also created a sensory lexicon and wheel for white, milk, and dark chocolate that comprised 18 flavour attributes of which the basic flavours, sweet, bitter, and sour were added to these attributes. They found that milk chocolate tasted sweet with a little bitter note, but no significant differences were found for the basic tastes. The flavours that were perceived with the highest intensity were caramel, cocoa, and milk/cream. For the dark chocolate, the bitter taste was found to be most present in dark chocolate and significant differences were reported for cocoa and fruit flavour [47].
Dark chocolate’s purchase intention (3.97 ± 1.171) was somewhat higher than the milk chocolate. More than 30% and 42.7% of the participants revealed their intention to definitely purchase sugar-free milk and sugar-free dark chocolate, respectively. Although taste perception varies from person to person, taste remains an important factor during chocolate purchases and consumption [48] and therefore, affects consumers’ chocolate consumption behaviour [49]. Researchers compared taste sensations and energy intake when milk- and dark chocolate were consumed, and although they found that neither chocolate was liked more than the other, they did find that the dark chocolate promoted satiety. Their results also showed that after consuming the dark chocolate, the consumers showed a lower desire for something sweet and that the dark chocolate suppressed energy intake compared to the milk chocolate [50]. An increase in the consumption of dark chocolate can be attributed to concerns regarding health-related problems while promoting health benefits that are associated with the consumption of dark chocolate [51]. Since consumers may strive to live a healthier lifestyle, sugar-free dark chocolate can be used as a healthier alternative to ordinary chocolate while still enjoying the taste.

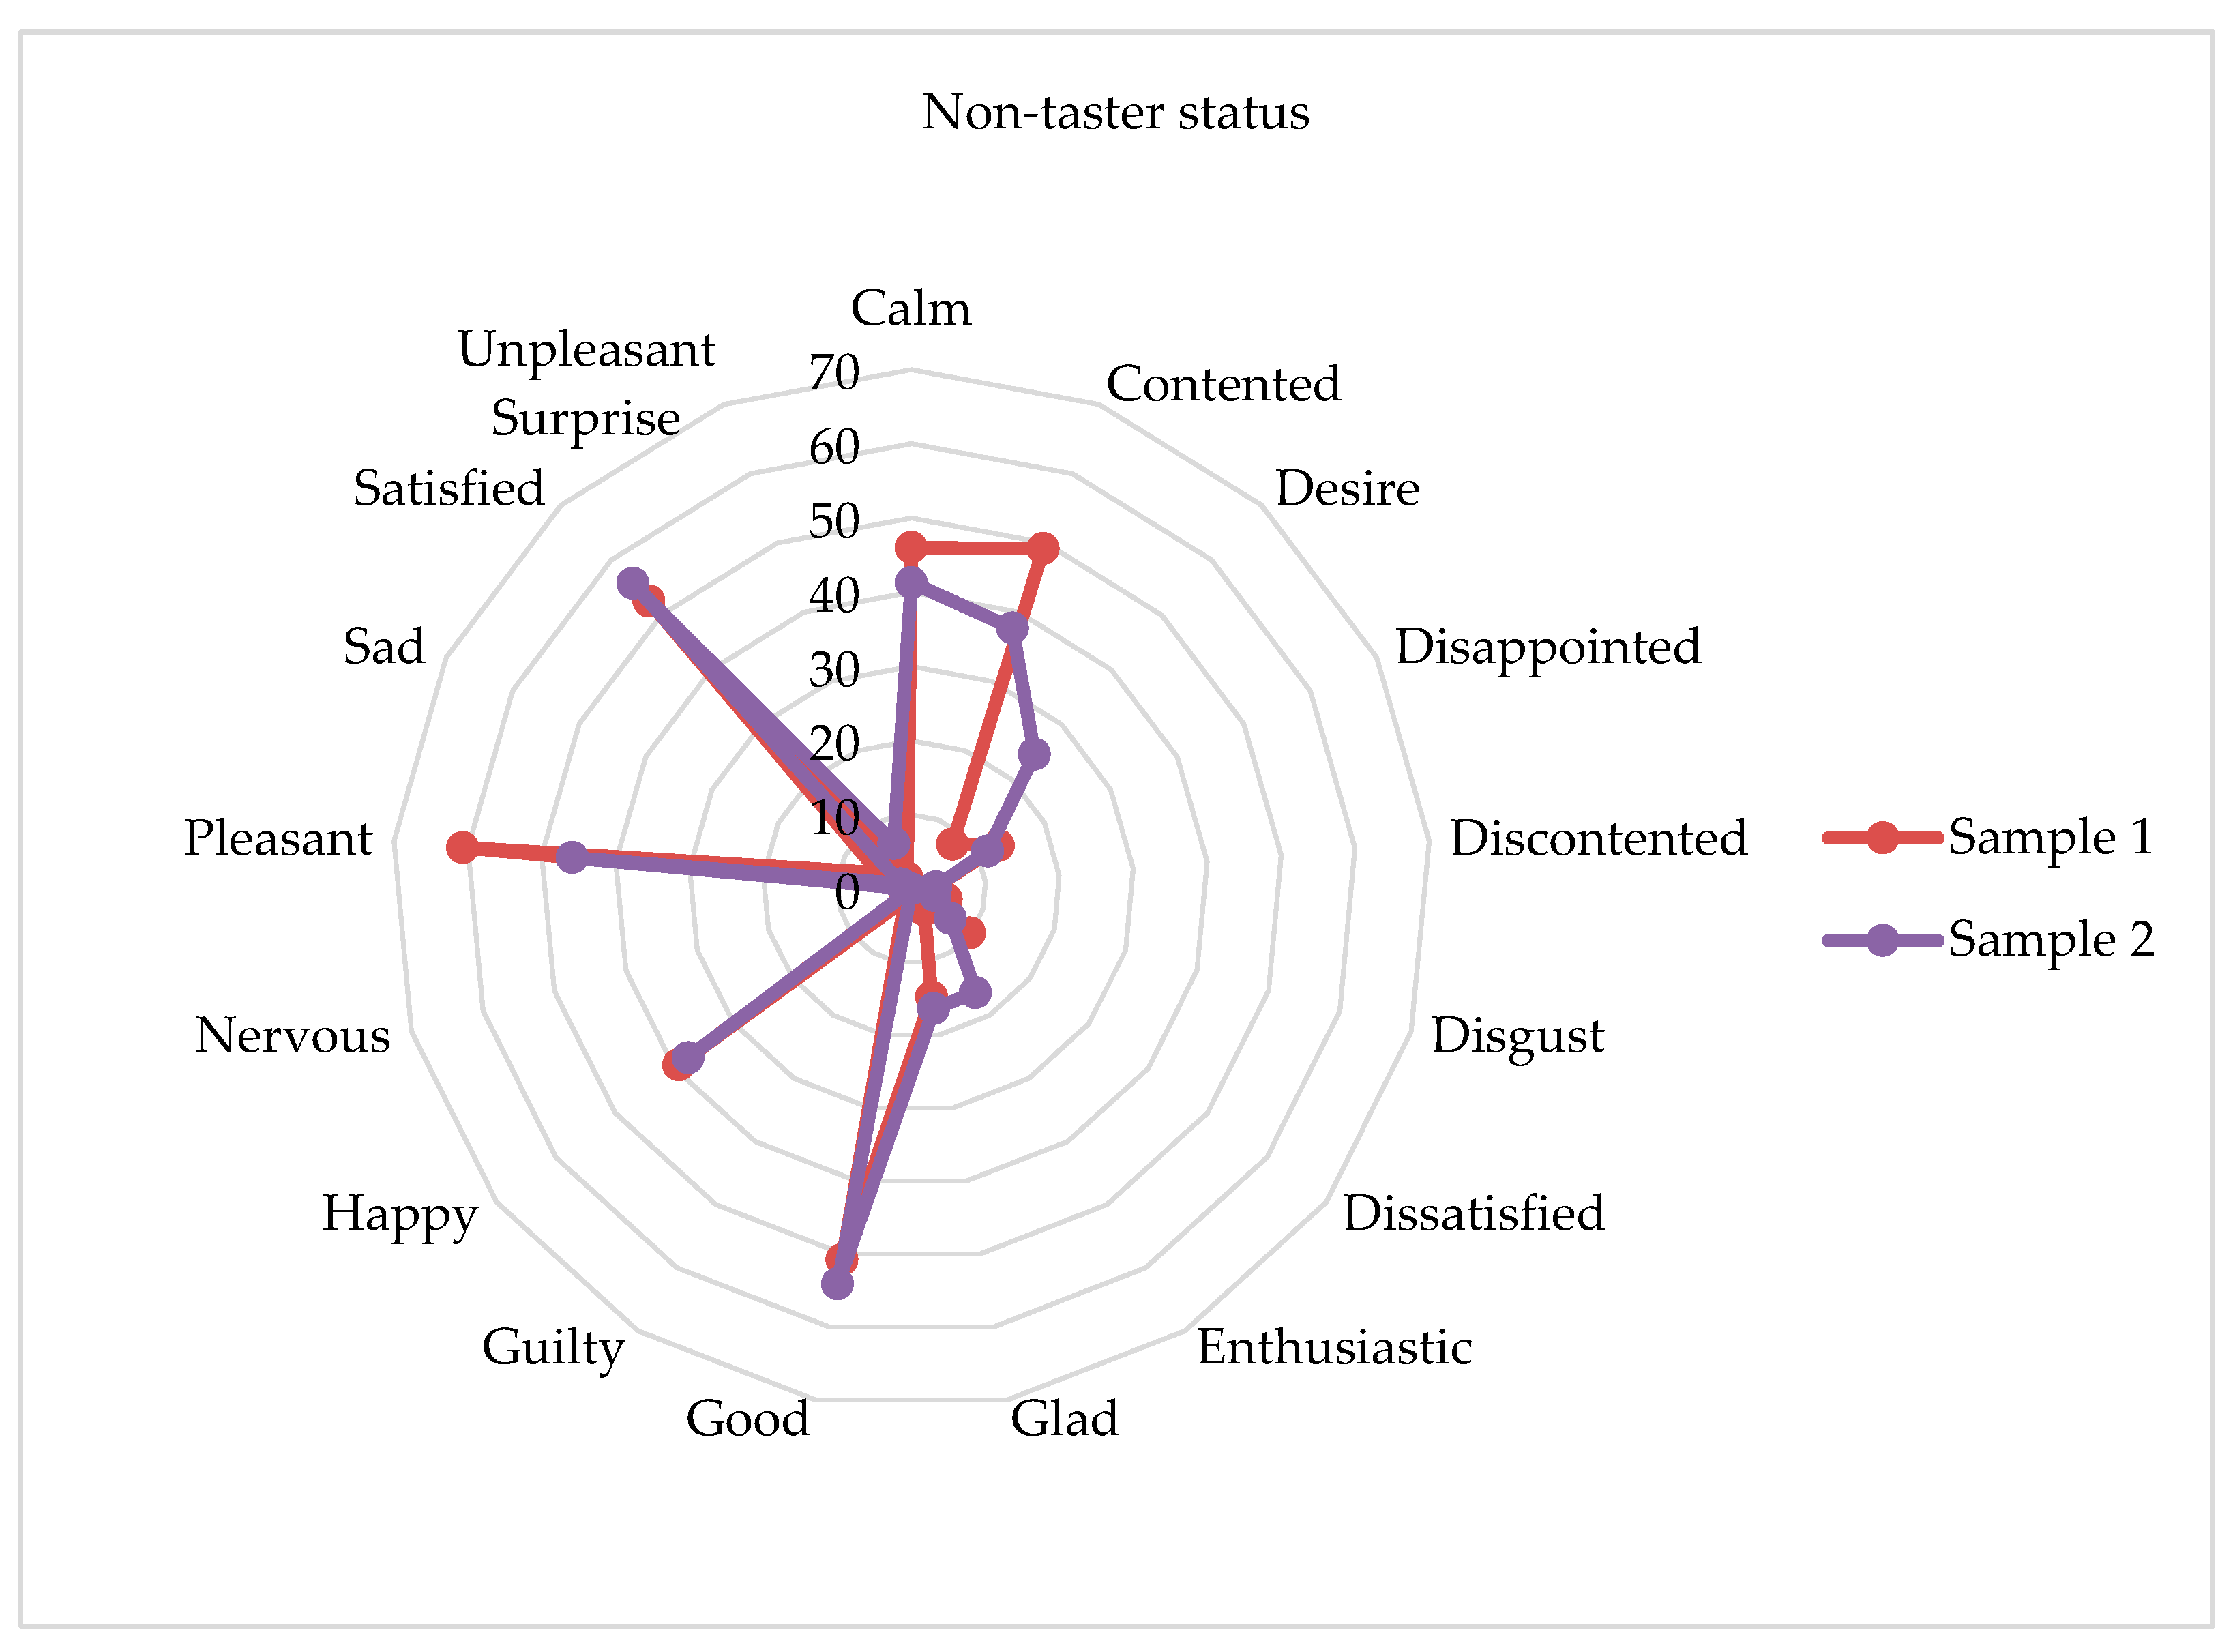
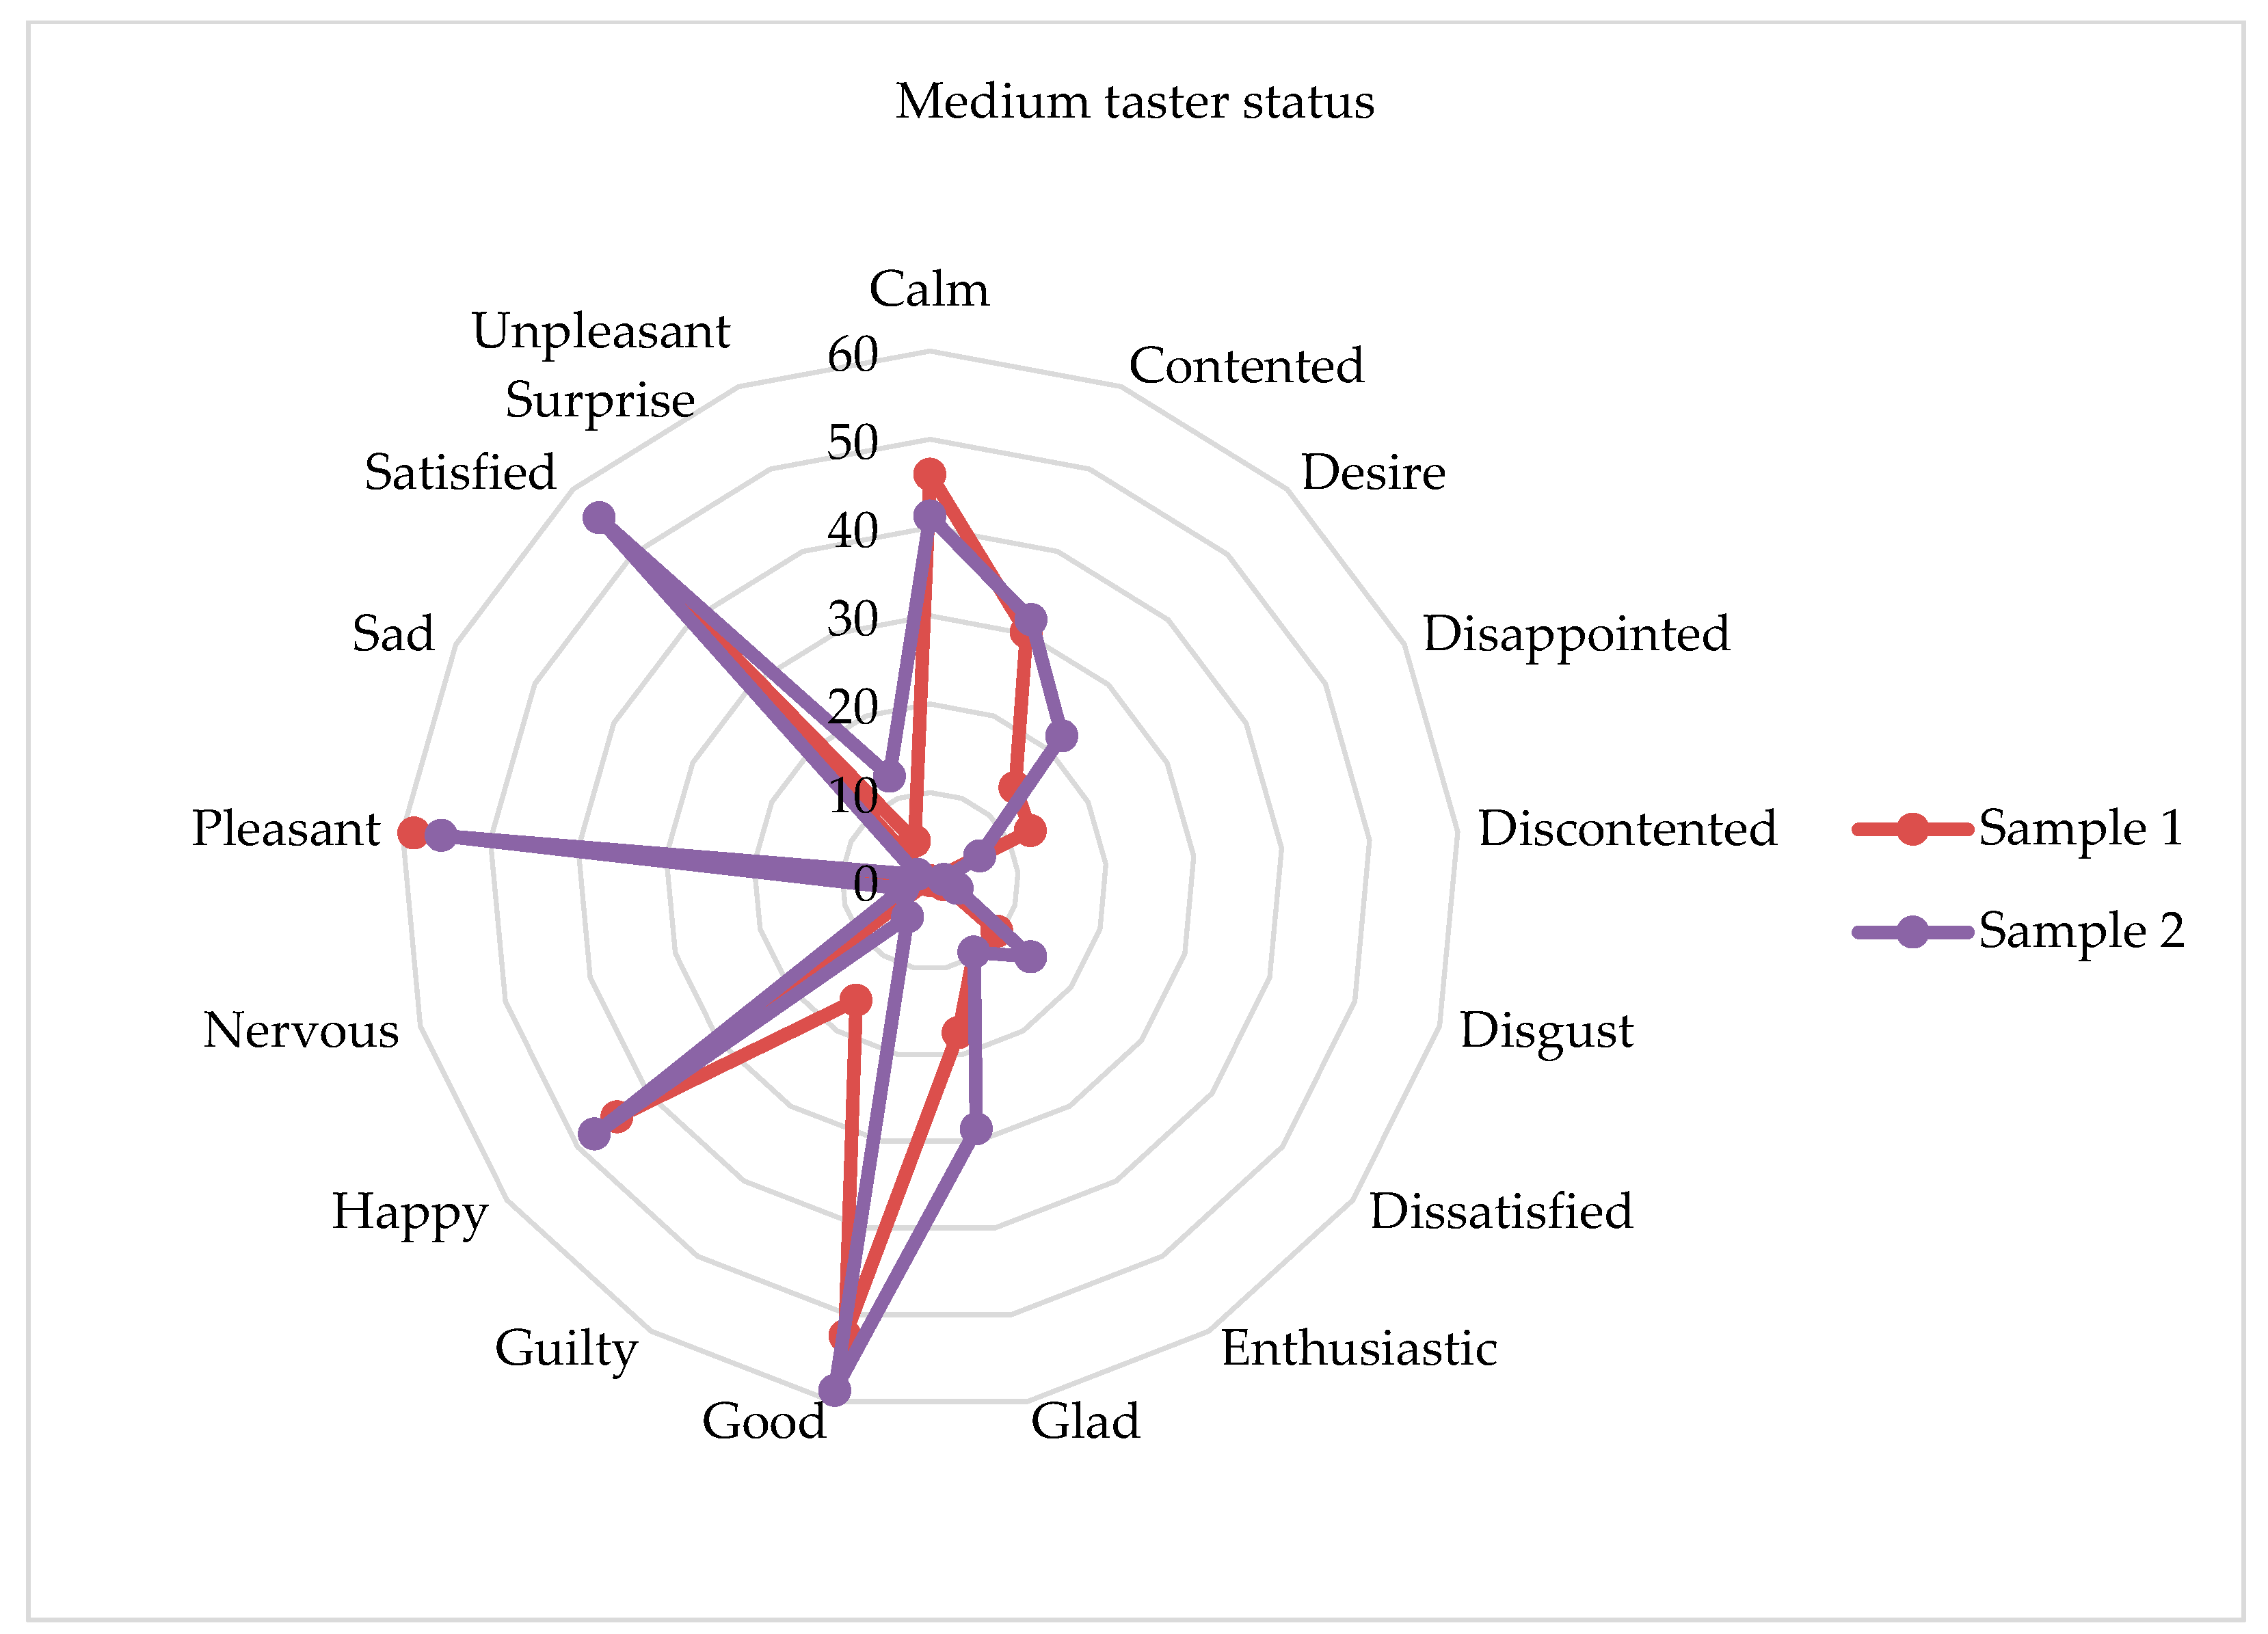
3.5. Emotional Response

The identified emotions for the two chocolate samples are presented in Table 4. Consumers were requested to select all the emotional terms that best describe what they were feeling when consuming the chocolate and they could choose more than one emotional term.
Generally, most of the participants selected positive emotional responses for the milk- and dark chocolate samples, with the emotions, pleasant, satisfied, happy, good, and content being the most selected. The emotion ‘satisfied’ was the most selected for both the sugar-free milk (57.6%) and sugar-free dark chocolate (53.8%). Therefore, it is evident that sugar-free chocolates can be consumed as a guilt-free snack without eliminating the pleasurable experience thereof.
For the open-ended question, respondents felt powerful, fancy, accomplished, wealthy, and extravagant; and emotions were classified as luxury when respondents ate the sugar-free dark chocolate. These findings are in line with previous research that confirmed respondents felt luxurious and sophisticated while consuming dark chocolate and that the emotional terms “powerful” and “energetic” could be associated with the cocoa flavour, while the bitter taste is associated with being confident [52].

3.6. Emotion Lexicons

For each taster status, an emotion lexicon was compiled from which notable differences emerged. Table 5 presents a summary of the emotional terms selected per taster status. The non-tasters indicated a higher selection for the emotion ‘pleasant’ for the sugar-free milk chocolate than the supertasters. As a result of the non-taster’s inability to taste the cocoa’s bitterness and the added sweetener’s bitter aftertaste of the sugar-free chocolate due to sweeteners, the supertasters found bitter tasting chocolates unpleasant.
Compared to the other taster groups, the supertasters felt more disgust, discontented, and disappointed. Despite supertasters being in the minority, emotionally, they felt the most negative. For the sugar-free dark chocolate, the supertasters showed the lowest selection for the emotions, pleasant, happy, and satisfied and may be an indication of their elevated sensitivity towards bitter-tasting ingredients such as high levels of cocoa found in dark chocolate. Furthermore, the medium tasters showed the lowest selection of the pleasant emotion for dark chocolate, since the larger proportion of medium tasters may also be sensitive towards bitter tastes. Therefore, medium tasters may also prefer chocolate products containing more salt.
For the sugar-free milk chocolate, the non-tasters indicated the lowest selection of positive emotions, desire, glad, and enthusiastic. Ideally, sugar-free foods should be developed to evoke the highest selection of positive emotional responses from consumers, and the food product developers should keep a record of which positive emotions are the least selected so improvements can be made.
Looking at the supertasters, this taster status group showed the lowest selection for the emotions satisfied, pleasant, and happy for the sugar-free dark chocolate and may be explained by their elevated sensitivity towards bitter-tasting ingredients, including the higher levels of cocoa found in dark chocolate. Owing to salt, which can mask bitter tastes, supertasters tend to consume more sodium [53].
A feasible solution to mask the bitterness of the cocoa in dark chocolate is for product developers to use different types of salt such as Himalayan salt. The marketing of these products as “low in bitterness” or “saltier” could potentially motivate supertasters to purchase more sugar-free alternatives.
Since the larger proportion of the sample was medium tasters, they may also reveal a higher level of bitter taste sensitivity as they indicated the lowest selection of the pleasant emotion for the dark chocolate. Therefore, medium tasters may also prefer chocolate products with elevated salt levels. The non-tasters indicated the lowest selection for the positive emotions, glad, desire, and enthusiastic for the sugar-free milk chocolate. For this reason, the food industry can improve sugar-free milk chocolate by incorporating stronger spicy notes such as coffee, ginger, and thyme.
Figure 1, Figure 2 and Figure 3 illustrate the emotional lexicon per taster status group. In terms of the emotional lexicons, the three taster status groups are very similar, although there are a few differences. For the pleasant emotion, the non-tasters indicate a higher selection (60.7%) than the supertasters (44.1%) regarding the milk chocolate. For the satisfied emotion, the supertasters are more satisfied (70.6%) than the non-tasters (52.5%) regarding the milk chocolate, although supertasters are the least satisfied with the dark chocolate (47.1%). The supertasters feel more disappointed (14.7% dark), discontented (5.9% milk; 14.7% dark), and disgusted (11.8% dark) than the rest of the respondents. The highest selection of the emotion unpleasant surprise is by the medium-tasters (12.7%) for dark chocolate.

3.7. Associations between Taster Status, Emotion Lexicons, and Demographics

A practical significant association between the non-tasters and the guilty emotion exists for the sugar-free milk chocolate (Table 6). Interestingly, a practical significant association was evident between the content emotion and all taster status groups. A practical significance for the association between supertasters and the emotions ‘disgust’ and ‘discontented’ were revealed for the sugar-free dark chocolate. While most of the female respondents were categorised as medium tasters (41.9%), fifty percent of the male respondents were classified as non-tasters (50%) (Figure 4).
Researchers have reported in their study that they could not distinguish between male and female consumers in perceiving taste, although the findings showed that women (34%) were slightly more likely to be supertasters compared to men (22%) [54]. However, other studies have found that women are significantly more sensitive towards salty, bitter, sweet, and sour taste stimuli compared to men [55,56].
Despite the findings presented above, the results of this study are in line with the above-mentioned results indicating that women are more likely to be supertasters, as supported by other studies [50,57].
A practically visible association (p < 0.05) was shown between age and taster status, with most of the 18- to 29-year-old respondents being categorised as medium-tasters (46.4%), with the remainder of them classified as supertasters (26.2%) and non-tasters (27.4%). The 30- to 39 years and 40 years and older age groups were mainly categorised as non-tasters. The non-tasters being older could be due to smell and taste functions that appear to decline with age [43]. Researchers confirmed that as age increased, consumers seemed to like and consume strong tastes (e.g., strong-tasting vegetables), as bitterness was not a hindrance to liking these foods [58]. Their results indicated that older male respondents seem to be non-tasters and female respondents between the ages of 18 and 29 years are mostly categorised as medium-tasters.

3.8. Value of the Study

The application of consumers’ emotions in food product improvement and optimisation, changes in formulation (e.g., for products under formulation, emotions may identify whether a positive or negative outcome was achieved) and prototype development can be used in food product development [58], ensuring that the focus is on the consumers and their taster status to make a variety of healthier products to choose from.
The findings can provide insight on the influence of taste sensitivity and give some guidance to the confectionery industry and individuals who work with various methods of marketing communication strategies on making use of tasting notes to advertise healthier products. The results can be beneficial to the industry role players, as they can use these developed emotional lexicons in their product development to ensure that the product meets the need of consumers in different segments, which can potentially lead to a more sustainable success rate of their products. As an example, the food industry can imitate a marketing campaign targeted at Generation Z consumers, that will influence their perceptions of sugar-free dark chocolates by marketing it as an affordable luxury item. To focus rather on an individual taster status, it will ensure consumers have access to healthier food options that have been altered to their taste sensitivity. It is therefore evident that in order for the health professionals and the food industry to contribute to reducing the global obesity epidemic, there is an urgent need to develop and produce more sugar reduced/sugar-free products, especially in developing/emerging countries such as South Africa, that also take consumers’ taster status and emotions in consideration. Each taster status therefore requires the development of a distinctive lexicon to be emotionally satisfied by sugar-free products

3.9. Limitations and Recommendations

The current study had some limitations that need to be addressed in similar future studies. To better describe and differentiate between the sugar-free chocolate samples, one should consider including a more extensive list of emotional terms that will identify unique relationships within chocolate samples. The products can be better differentiated by a larger number of emotional terms to evaluate food products [37]. This study made use of a self-reported measurement by asking the respondents to indicate all of the emotions they felt during the chocolate tasting. This method relies on the respondents’ ability to explicitly state their experienced emotions. However, this technique is normally used in research on food-elicited emotion, researchers explain that the more often, the focus is on the message the product conveys to the consumers instead of what the product does to them [23]. This might also have been the case in this study, and it is, therefore, recommended future research should emphasize the implicit measurements of emotion (e.g., facial expressions and skin conductance) [59].
The study’s findings could not be generalised to the entire South African population; however, it broadened the understanding regarding consumers’ emotional response to sugar-free chocolate. For future research, a larger sample group using different consumer groups can be implemented by making use of the findings of this study to serve as a baseline study. Furthermore, future studies should consider attributes such as texture, odour, and flavour, that may influence the consumers’ emotions, consumption, and purchasing behaviour.
The application of the methodology, scales, and tools that were used to collect data can be used on other product categories to understand whether similar relationships between consumers’ emotions and taster status exist beyond the chocolate segment. By using other product categories, more specific lexicons can be developed for the different taster status groups. As this study only made use of one brand of sugar-free milk chocolate and dark chocolate, it is recommended that assorted brands of sugar-free chocolate and sugar-free products should be used, as the ingredients and manufacturing process differ, which may affect the taste. Consumers may then reveal different emotions, resulting in different emotional lexicons.

Author Contributions

Conceptualization, A.M.; methodology, A.M.; validation, A.M., N.l.R. and T.v.Z.; formal analysis, T.v.Z.; investigation, T.v.Z.; resources, A.M.; data curation, T.v.Z.; writing—original draft preparation, T.v.Z.; writing—review and editing, A.M. and N.l.R.; visualization, A.M.; supervision, A.M. and N.l.R.; project administration, A.M.; funding acquisition, T.v.Z. All authors have read and agreed to the published version of the manuscript.

Funding

This research received no external funding.

Institutional Review Board Statement

The study was approved by Health Research Ethics Committee (HREC) of the North-West University, Potchefstroom campus (NWU-00490-20-A1), South Africa. The execution of the study was within the guidelines presented to the ethics committee.

Informed Consent Statement

Informed consent was obtained from all subjects involved in the study.

Data Availability Statement

The data presented in this study are available on request from the corresponding author. The data are not publicly available due to the institutions ethics policy.

Conflicts of Interest

The authors declare no conflict of interest.

Appendix A

Table A1. Nutritional information of sugar-free chocolates.
DescriptionMilk Per 100 gMilk g Per ServingDark Per 100 gDark g Per Serving
Energy (kJ)202481018511851
Protein (g)7.93.25.85.8
Carbohydrate (g)34141818
Total sugar (g)20.98.43.03.0
Total fat (g)36.214.536.336.3
Saturated fat (g)22.99.222.822.8
Monounsaturated fat (g)12.14.812.312.3
Dietary fibre (g)17.06.834.534.5
Sodium (mg)2409688

References

  1. Hagmann, D.; Siegrist, M.; Hartmann, C. Taxes, labels, or nudges? Public acceptance of various interventions designed to reduce sugar intake. Food Policy 2018, 79, 156–165. [Google Scholar] [CrossRef]
  2. Mc Creedy, N.; Shung-King, M.; Weimann, A.; Tatah, L.; Mapa-Tassou, C.; Muzenda, T.; Govia, I.; Were, V.; Oni, T. Reducing sugar intake in South Africa: Learnings from a multilevel policy analysis on diet and noncommunicable disease prevention. Int. J. Environ. Res. Public Health 2022, 19, 11828. [Google Scholar] [CrossRef] [PubMed]
  3. WHO (World Health Organization). World Health Statistics 2018: Monitoring Health for the SDGs, Sustainable Development Goals; WHO: Geneva, Switzerland, 2018. [Google Scholar]
  4. Oliveira, D.; Reis, F.; Deliza, R.; Rosenthal, A.; Giménez, A.; Ares, G. Difference thresholds for added sugar in chocolate-flavoured milk: Recommendations for gradual sugar reduction. Food Res. Int. 2016, 89, 448–453. [Google Scholar] [CrossRef] [PubMed]
  5. Sharma, V.K.; Ingle, N.A.; Kaur, N.; Yadav, P.; Ingle, E.; Charania, Z. Sugar substitutes and health: A review. J. Adv. Oral Res. 2016, 7, 7–11. [Google Scholar] [CrossRef]
  6. Herbst, M.C. Fact Sheet on Obesity and Cancer. Available online: https://www.cansa.org.za/files/2019/02/Fact-Sheet-on-Obesity-and-Cancer-web-Feb-2019.pdf (accessed on 13 March 2020).
  7. Judah, G.; Mullan, B.; Yee, M.; Johansson, L.; Allom, V.; Liddelow, C. A habit-based randomised controlled trial to reduce sugar-sweetened beverage consumption: The impact of the substituted beverage on behaviour and habit strength. Int. J. Behav. Med. 2020, 27, 623–635. [Google Scholar] [CrossRef] [PubMed]
  8. Colares-Bento, F.C.J.; Souza, V.C.; Toledo, J.O.; Moraes, C.F.; Alho, C.S.; Lima, R.M.; Cordova, C.; Nobrega, O.T. Implication of the G145C polymorphism (rs713598) of the TAS2R38 gene on food consumption by Brazilian older women. Arch. Gerontol. Geriatr. 2012, 54, e13–e18. [Google Scholar] [CrossRef] [PubMed]
  9. Rozin, P. Acquisition of stable food preferences. Nutr. Rev. 1990, 48, 106–113. [Google Scholar] [CrossRef]
  10. Crofton, E.C.; Markey, A.; Scannell, A.G. Consumers’ expectations and needs towards healthy cereal based snacks. Br. Food J. 2013, 115, 1130–1148. [Google Scholar] [CrossRef]
  11. Belščak-Cvitanović, A.; Komes, D.; Dujmović, M.; Karlović, S.; Biškić, M.; Brnčić, M.; Ježek, D. Physical, bioactive and sensory quality parameters of reduced sugar chocolates formulated with natural sweeteners as sucrose alternatives. Food Chem. 2015, 167, 61–70. [Google Scholar] [CrossRef]
  12. Velarde, C.; Moore, A.; Boakye, E.A.; Parkhurst, T.; Brewer, D. Consumption and emotions among college students toward chocolate product. Cogent Food Agric. 2018, 4, 1442645. [Google Scholar] [CrossRef]
  13. De Melo, L.L.M.M.; Bolini, H.M.A.; Efraim, P. Sensory profile, acceptability, and their relationship for diabetic/reduced calorie chocolates. Food Qual. Prefer. 2009, 20, 138–143. [Google Scholar] [CrossRef]
  14. Mao, Z.; Cheng, W.; Li, Z.; Yao, M.; Sun, K. Clinical associations of bitter taste perception and bitter taste receptor variants and the potential for personalized healthcare. Pharmacogenomics Pers. Med. 2023, 16, 121–132. [Google Scholar] [CrossRef] [PubMed]
  15. Sandell, M.; Hoppu, U.; Laaksonen, O. Consumer segmentation based on genetic variation in taste and smell. In Methods in Consumer Research; Varela, P., Ares, G., Eds.; Woodhead: Cambridge, UK, 2018; Volume 1, pp. 423–447. [Google Scholar]
  16. Herbert, C.; Platte, P.; Wiemer, J.; Macht, M.; Blumenthal, T.D. Supertaster, super reactive: Oral sensitivity for bitter taste modulates emotional approach and avoidance behavior in the affective startle paradigm. Physiol. Behav. 2014, 135, 198–207. [Google Scholar] [CrossRef] [PubMed]
  17. Eldeghaidy, S.; Marciani, L.; McGlone, F.; Hollowood, T.; Hort, J.; Head, K.; Taylor, A.J.; Busch, J.; Spiller, R.C.; Gowland, P.A.; et al. The cortical response to the oral perception of fat emulsions and the effect of taster status. J. Neurophysiol. 2011, 105, 2572–2581. [Google Scholar] [CrossRef] [PubMed]
  18. Son, Y.-J.; Choi, S.-Y.; Yoo, K.-M.; Lee, K.-W.; Lee, S.-M.; Hwang, I.-K.; Kim, S. Anti-blooming effect of maltitol and tagatose as sugar substitutes for chocolate making. LWT−Food Sci. Technol. 2018, 88, 87–94. [Google Scholar] [CrossRef]
  19. Yang, Q.; Dorado, R.; Chaya, C.; Hort, J. The impact of PROP and thermal taster status on the emotional response to beer. Food Qual. Prefer. 2018, 68, 420–430. [Google Scholar] [CrossRef]
  20. Yang, Q.; Kraft, M.; Shen, Y.; MacFie, H.; Ford, R. Sweet Liking Status and PROP Taster Status impact emotional response to sweetened beverage. Food Qual. Prefer. 2019, 75, 133–144. [Google Scholar] [CrossRef]
  21. Roudnitzky, N.; Behrens, M.; Engel, A.; Kohl, S.; Thalmann, S.; Hübner, S.; Lossow, K.; Wooding, S.P.; Meyerhof, W. Receptor polymorphism and genomic structure interact to shape bitter taste perception. PLoS Genet. 2015, 11, e1005530. [Google Scholar] [CrossRef]
  22. Melis, M.; Sollai, G.; Mastinu, M.; Pani, D.; Cosseddu, P.; Bonfiglio, A.; Crnjar, R.; Tepper, B.J.; Tomassini Barbarossa, I. Electrophysiological Responses from the Human Tongue to the Six Taste Qualities and Their Relationships with PROP Taster Status. Nutrients 2020, 12, 2017. [Google Scholar] [CrossRef]
  23. Pickering, G.; Jain, A.; Bezawada, R. Super-tasting gastronomes? Taste phenotype characterization of foodies and wine experts. Food Qual. Prefer. 2013, 28, 85–91. [Google Scholar] [CrossRef]
  24. Ammann, J.; Hartmann, C.; Siegrist, M. A bitter taste in the mouth: The role of 6-n-propylthiouracil taster status and sex in food disgust sensitivity. Physiol. Behav. 2019, 204, 219–223. [Google Scholar] [CrossRef] [PubMed]
  25. Mosby, A. Mosby’s Dictionary of Medicine, Nursing & Health Professions; Elsevier: Beijing, China, 2006. [Google Scholar]
  26. Thomson, D.M.; Crocker, C. A data-driven classification of feelings. Food Qual. Prefer. 2013, 27, 137–152. [Google Scholar] [CrossRef]
  27. Gunaratne, T.M.; Viejo, C.G.; Fuentes, S.; Torrico, D.D.; Gunaratne, N.M.; Ashman, H.; Dunshea, F.R. Development of emotion lexicons to describe chocolate using the check-all-that-apply (CATA) methodology across Asian and Western groups. Food Res. Int. 2019, 115, 526–534. [Google Scholar] [CrossRef] [PubMed]
  28. Ferrarini, R.; Carbognin, C.; Casarotti, E.; Nicolis, E.; Nencini, A.; Meneghini, A. The emotional response to wine consumption. Food Qual. Prefer. 2010, 21, 720–725. [Google Scholar] [CrossRef]
  29. Mastinu, M.; Melis, M.; Yousaf, N.Y.; Barbarossa, I.T.; Tepper, B.J. Emotional responses to taste and smell stimuli: Self-reports, physiological measures, and a potential role for individual and genetic factors. J. Food Sci. 2023, 88, A65–A90. [Google Scholar] [CrossRef]
  30. Ballco, P.; Piqueras-Fiszman, B.; van Trijp, H.C.M. The Influence of Consumption Context on Indulgent Versus Healthy Yoghurts: Exploring the Relationship between the Associated Emotions and the Actual Choices. Sustainability 2022, 14, 8224. [Google Scholar] [CrossRef]
  31. Paoletti, R.; Poli, A.; Conti, A.; Visioli, F. Chocolate and Health; Springer: New York, NY, USA, 2012. [Google Scholar]
  32. Moreno-Dominguez, S.; Rodríguez-Ruiz, S.; Martín, M.; Warren, C.S. Experimental effects of chocolate deprivation on cravings, mood, and consumption in high and low chocolate-cravers. Appetite 2012, 58, 111–116. [Google Scholar] [CrossRef] [PubMed]
  33. Modrzejewska, A.; Czepczor-Bernat, K.; Brytek-Matera, A. The role of emotional eating and BMI in the context of chocolate consumption and avoiding situations related to body exposure in women of normal weight. Psychiatr. Pol. 2021, 55, 915–930. [Google Scholar] [CrossRef]
  34. WHO. Coronavirus Disease (COVID-19)—World Health Organization. Available online: https://www.who.int/emergencies/diseases/novel-coronavirus-2019 (accessed on 18 April 2021).
  35. Sollai, G.; Melis, M.; Pani, D.; Cosseddu, P.; Usai, I.; Crnjar, R.; Bonfiglio, A.; Barbarossa, I.T. First objective evaluation of taste sensitivity to 6-n-propylthiouracil (PROP), a paradigm gustatory stimulus in humans. Sci. Rep. 2017, 7, 1–12. [Google Scholar] [CrossRef]
  36. Schouteten, J.J.; De Steur, H.; De Pelsmaeker, S.; Lagast, S.; De Bourdeaudhuij, I.; Gellynck, X. An integrated method for the emotional conceptualization and sensory characterization of food products: The emosensory® wheel. Food Res. Int. 2015, 78, 96–107. [Google Scholar] [CrossRef]
  37. Jaeger, S.R.; Swaney-Stueve, M.; Chheang, S.L.; Hunter, D.C.; Pineau, B.; Ares, G. An assessment of the CATA-variant of the EsSense Profile®. Food Qual. Prefer. 2018, 68, 360–370. [Google Scholar] [CrossRef]
  38. Drewnowski, A.; Henderson, S.A.; Barratt-Fornell, A. Genetic sensitivity to 6-npropylthiouracil and sensory responses to sugar and fat mixtures. Physiol. Behav. 1998, 6, 771–777. [Google Scholar] [CrossRef] [PubMed]
  39. Karikkineth, A.C.; Tang, E.Y.; Kuo, P.L.; Ferrucci, L.; Egan, J.M.; Chia, C.W. Longitudinal trajectories and determinants of human fungiform papillae density. Aging 2020, 13, 24989–25003. [Google Scholar] [CrossRef] [PubMed]
  40. Monteleone, E.; Spinelli, S.; Dinnella, C.; Endrizzi, I.; Laureati, M.; Pagliarini, E.; Sinesio, F.; Gasperi, F.; Torri, L.; Aprea, E.; et al. Exploring influences on food choice in a large population sample: The Italian Taste project. Food Qual. Prefer. 2017, 59, 123–140. [Google Scholar] [CrossRef]
  41. Shen, Y.; Kennedy, O.B.; Methven, L. Exploring the effects of genotypical and phenotypical variations in bitter taste sensitivity on perception, liking and intake of brassica vegetables in the UK. Food Qual. Prefer. 2016, 50, 71–81. [Google Scholar] [CrossRef]
  42. Yang, Q.; Williamson, A.-M.; Hasted, A.; Hort, J. Exploring the relationships between taste phenotypes, genotypes, ethnicity, gender and taste perception using Chi-square and regression tree analysis. Food Qual. Prefer. 2020, 83, 103928. [Google Scholar] [CrossRef]
  43. Braun, T.; Doerr, J.M.; Peters, L.; Viard, M.; Reuter, I.; Prosiegel, M.; Weber, S.; Yeniguen, M.; Tschernatsch, M.; Gerriets, T.; et al. Age-related changes in oral sensitivity, taste and smell. Sci. Rep. 2022, 12, 1533. [Google Scholar] [CrossRef]
  44. Deshaware, S.; Singhal, R. Genetic variation in bitter taste receptor gene TAS2R38, PROP taster status and their association with body mass index and food preferences in Indian population. Gene 2017, 627, 363–368. [Google Scholar] [CrossRef]
  45. Macht, M.; Dettmer, D. Everyday mood and emotions after eating a chocolate bar or an apple. Appetite 2006, 46, 332–336. [Google Scholar] [CrossRef]
  46. Augusto, P.P.C.; Bolini, H.M.A. The role of conching in chocolate flavor development: A review. Compr. Rev. Food Sci. Food Saf. 2022, 21, 3274–3296. [Google Scholar] [CrossRef]
  47. De Pelsmaeker, S.; De Clercq, G.; Gellynck, X.; Schouteten, J.J. Development of a sensory wheel and lexicon for chocolate. Food Res. Int. 2019, 116, 1183–1191. [Google Scholar] [CrossRef] [PubMed]
  48. Thaichon, P.; Jebarajakirthy, C.; Tatuu, P.; Gajbhiyeb, R.G. Are you a chocolate lover? An investigation of the repurchase behavior of chocolate consumers. J. Food Prod. Mark. 2018, 24, 163–176. [Google Scholar] [CrossRef]
  49. Del Prete, M.; Samoggia, A. Chocolate Consumption and Purchasing Behaviour Review: Research Issues and Insights for Future Research. Sustainability 2020, 12, 5586. [Google Scholar] [CrossRef]
  50. Sørensen, L.B.; Astrup, A. Eating dark and milk chocolate: A randomized crossover study of effects on appetite and energy intake. Nutr. Diabetes 2011, 1, e21. [Google Scholar] [CrossRef] [PubMed]
  51. Sepúlveda, W.S.; Maza, M.T.; Uldemolins, P.; Cantos-Zambrano, E.G.; Ureta, I. Linking dark chocolate product attributes, consumer preferences, and consumer utility: Impact of quality labels, cocoa content, chocolate origin, and price. J. Int. Food Agribus. Mark. 2021, 34, 518–537. [Google Scholar] [CrossRef]
  52. Thomson, D.M.; Crocker, C.; Marketo, C.G. Linking sensory characteristics to emotions: An example using dark chocolate. Food Qual. Prefer. 2010, 21, 1117–1125. [Google Scholar] [CrossRef]
  53. Nahar, N.; Madzuki, I.N.; Izzah, N.B.; Ab Karim, S.; Ghazali, H.M.; Karim, R. Bakery science of bread and the effect of salt reduction on quality: A review. BJRST 2018, 1, 9–14. [Google Scholar]
  54. Spence, C. Do men and women really live in different taste worlds? Food Qual. Prefer. 2019, 73, 38–45. [Google Scholar] [CrossRef]
  55. Ervina, E.; Berget, I.; Almli, V.L. Investigating the relationships between basic tastes sensitivities, fattiness sensitivity, and food liking in 11-year-old children. Foods 2020, 9, 1315. [Google Scholar] [CrossRef]
  56. Bolhuis, D.P.; Costanzo, A.; Keast, R.S. Preference and perception of fat in salty and sweet foods. Food Qual. Prefer. 2018, 64, 131–137. [Google Scholar] [CrossRef]
  57. Cavallo, C.; Cicia, G.; Del Giudice, T.; Sacchi, R.; Vecchio, R. Consumers’ Perceptions and Preferences for Bitterness in Vegetable Foods: The Case of Extra-Virgin Olive Oil and Brassicaceae—A Narrative Review. Nutrients 2019, 11, 1164. [Google Scholar] [CrossRef]
  58. Puputti, S.; Hoppu, U.; Sandell, M. Taste sensitivity is associated with food consumption behavior but not with recalled pleasantness. Foods 2019, 8, 444–465. [Google Scholar] [CrossRef]
  59. de Wijk, R.A.; Noldus, L.P.J.J. Using implicit rather than explicit measures of emotions. Food Qual. Prefer. 2021, 92, 104125. [Google Scholar] [CrossRef]
Figure 1. Emotion lexicon (%) of milk chocolate (Sample 1) and dark chocolate (Sample 2) for non-tasters.
Applsci 13 12994 g001
Figure 2. Emotion lexicon (%) of milk chocolate (Sample 1) and dark chocolate (Sample 2) for medium tasters.
Applsci 13 12994 g002
Figure 3. Emotion lexicon (%) of milk chocolate (Sample 1) and dark chocolate (Sample 2) for supertasters.
Applsci 13 12994 g003
Figure 4. Consumers’ taster status according to gender and age.
Applsci 13 12994 g004
Table 1. Demographic characteristics (N = 153).
VariablesFrequency (n)Percent (%)
Gender
Male3623.38
Female11775.97
Other10.65
Age in years
18–298454.90
30–393522.88
40–49138.50
50–59127.84
>6095.88
Table 2. General consumption and purchasing behaviour of chocolates.
VariablePercent (%)
Considering factors when purchasing chocolate
Flavour75.3
Brand16.5
Packaging0
Price8.2
Other reason0
Frequency of chocolate consumption
Daily7.0
More than twice a week25.9
Twice a week17.7
Once a week32.9
Once a month or less16.5
Reason for chocolate consumption
For emotional satisfaction (indulgence)58.2
To overcome hunger0
Regard it as healthy0.6
As a habit24.1
Other reason17.1
Table 3. Sugar-free chocolates’ taste, aftertaste, and purchase intention.
MeanStandard Deviation
Milk chocolate
Taste 13.950.80
Aftertaste 13.780.92
Purchase intention 23.851.11
Dark chocolate
Taste 14.090.97
Aftertaste 13.901.102
Purchase intention 23.971.171
Note: 1 Likert scale: 1 = dislike extremely, 2 = dislike very much, 3 = neither like nor dislike, 4 = like very much, 5 = like extremely. 2 Likert scale: 1 = definitely would not buy, 2 = probably would not buy, 3 = might or might not buy, 4 = probably would buy, 5 = definitely would buy.
Table 4. Consumers’ (all taster groups) emotions regarding sugar-free chocolates.
EmotionMilk (%)Dark (%)
Positive
Contented36.135.4
Desire12.724.7
Enthusiastic6.313.9
Glad17.122.8
Good51.953.2
Happy43.739.9
Pleasant56.349.4
Satisfied57.653.8
Negative
Disappointed1210.1
Discontented2.55.1
Disgust3.25.1
Dissatisfied8.910.1
Guilty9.53.2
Nervous02.5
Sad2.51.9
Unpleasant surprise3.88.9
Unclassified
Calm51.943.7
Table 5. Summary of taster status selection of emotional terms.
Non-TastersMedium-TastersSuper-Tasters
Milk chocolate:
Highest selected emotion
Pleasant (+)
Sad (−)
Guilty (−)Happy (+)
Satisfied (+)
Calm
Dark chocolate:
Highest selected emotion
Glad (+)
Good (+)
Dissatisfied (−)
Unpleasant (−) surprise
Desire (+)
Enthusiastic (+)
Disappointed (−)
Discontented (−)
Disgust (−)
Nervous (−)
Milk chocolate:
Lowest selected emotion
Desire (+)
Enthusiastic (+)
Glad (+)
Unpleasant surprise (−)
Discontented (−)
Disgust (−)
Sad (−)
Discontented (−)
Dark chocolate:
Lowest selected emotion
Guilty (−)
Nervous (−)
Sad (−)
Pleasant (+)
Dissatisfied (−)
Happy (+)
Pleasant (+)
Satisfied (+)
Note: (+) = positive emotion; (−) = negative emotion.
Table 6. Associations between taster status and emotional response.
SampleTaster StatusEmotional ResponsePhi-Valuep-Value
Milk chocolateNon-tasters
All tasters
Content (+)
Guilty (−)
Content (+)
0.2216
−0.212
0.220
0.070
0.008 *
0.020 *
Dark chocolateSuper-tastersDiscontented (−)
Disgust (−)
0.230
0.160
0.004 *
0.044 *
Note: (+) = positive emotion; (−) = negative emotion; * = p < 0.05.
Disclaimer/Publisher’s Note: The statements, opinions and data contained in all publications are solely those of the individual author(s) and contributor(s) and not of MDPI and/or the editor(s). MDPI and/or the editor(s) disclaim responsibility for any injury to people or property resulting from any ideas, methods, instructions or products referred to in the content.

