
Crash Severity Analysis of Young Adult Motorcyclists: A Comparison of Urban and Rural Local Roadways

 ,
, 
 and
and 
Abstract
:1. Introduction
2. Literature Review
3. Method
3.1. Data
3.2. Research Procedure
3.3. Parameter Estimation
3.4. Different Road Context Test
4. Results
4.1. Descriptive Statistics
4.2. Parameter Estimation Results
5. Discussion
6. Conclusions and Implementations
Author Contributions
Funding
Institutional Review Board Statement
Informed Consent Statement
Data Availability Statement
Acknowledgments
Conflicts of Interest
References
- UN. Sustainable Development Goals. Available online: https://www.un.org/sustainabledevelopment/cities/ (accessed on 1 October 2021).
- Misachi, J. Countries with the Highest Motorbike Usage. Available online: https://www.worldatlas.com/articles/countries-that-ride-motorbikes.html (accessed on 19 March 2023).
- Isa, M.H.M.; Jawi, Z.M.; Sarani, R.; Wong, S.V. Injury Severity Analysis of Accidents Involving Young Motorcycle Riders in Malaysia. J. East. Asia Soc. Transp. Stud. 2011, 9, 1997–2010. [Google Scholar]
- Li, J.; Fang, S.; Guo, J.; Fu, T.; Qiu, M. A Motorcyclist-Injury Severity Analysis: A Comparison of Single-, Two-, and Multi-Vehicle Crashes Using Latent Class Ordered Probit Model. Acc. Anal. Prev. 2021, 151, 105953. [Google Scholar] [CrossRef] [PubMed]
- Ijaz, M.; Liu, L.; Almarhabi, Y.; Jamal, A.; Usman, S.M.; Zahid, M. Temporal Instability of Factors Affecting Injury Severity in Helmet-Wearing and Non-Helmet-Wearing Motorcycle Crashes: A Random Parameter Approach with Heterogeneity in Means and Variances. Int. J. Environ. Res. Public Health 2022, 19, 526. [Google Scholar] [CrossRef]
- Se, C.; Champahom, T.; Jomnonkwao, S.; Ratanavaraha, V. Motorcyclist injury severity analysis: A comparison of Artificial Neural Networks and random parameter model with heterogeneity in means and variances. Int. J. Inj. Cont. Saf. Promot. 2022, 29, 500–515. [Google Scholar] [CrossRef] [PubMed]
- Champahom, T.; Se, C.; Jomnonkwao, S.; Boonyoo, T.; Leelamanothum, A.; Ratanavaraha, V. Temporal Instability of Motorcycle Crash Fatalities on Local Roadways: A Random Parameters Approach with Heterogeneity in Means and Variances. Int. J. Environ. Res. Public Health 2023, 20, 3845. [Google Scholar] [CrossRef]
- Islam, M. The effect of motorcyclists’ age on injury severities in single-motorcycle crashes with unobserved heterogeneity. J. Saf. Res. 2021, 77, 125–138. [Google Scholar] [CrossRef]
- Khan, U.R.; Razzak, J.A.; Jooma, R.; Warnberg, M.G. Association of age and severe injury in young motorcycle riders: A cross-sectional study from Karachi, Pakistan. Injury 2022, 53, 3019–3024. [Google Scholar] [CrossRef]
- Champahom, T.; Se, C.; Jomnonkwao, S.; Boonyoo, T.; Ratanavaraha, V. A Comparison of Contributing Factors between Young and Old Riders of Motorcycle Crash Severity on Local Roads. Sustainability 2023, 15, 2708. [Google Scholar] [CrossRef]
- Yan, X.; He, J.; Zhang, C.; Liu, Z.; Wang, C.; Qiao, B. Spatiotemporal instability analysis considering unobserved heterogeneity of crash-injury severities in adverse weather. Anal. Meth. Acc. Res. 2021, 32, 100182. [Google Scholar] [CrossRef]
- Halbersberg, D.; Lerner, B. Young driver fatal motorcycle accident analysis by jointly maximizing accuracy and information. Acc. Anal. Prev. 2019, 129, 350–361. [Google Scholar] [CrossRef]
- Hidalgo-Fuentes, S.; Sospedra-Baeza, M.J. Gender and age distribution of motorcycle crashes in Spain. Int. J. Inj. Cont. Saf. Promot. 2019, 26, 108–114. [Google Scholar] [CrossRef] [PubMed]
- Abdul Manan, M.M.; Várhelyi, A.; Çelik, A.K.; Hashim, H.H. Road characteristics and environment factors associated with motorcycle fatal crashes in Malaysia. IATSS Res. 2018, 42, 207–220. [Google Scholar] [CrossRef]
- Lin, H.Y.; Li, J.S.; Pai, C.W.; Chien, W.C.; Huang, W.C.; Hsu, C.W.; Wu, C.C.; Yu, S.H.; Chiu, W.T.; Lam, C. Environmental Factors Associated with Severe Motorcycle Crash Injury in University Neighborhoods: A Multicenter Study in Taiwan. Int. J. Environ. Res. Public Health 2022, 19, 10274. [Google Scholar] [CrossRef] [PubMed]
- Islam, M.; Mannering, F. The role of gender and temporal instability in driver-injury severities in crashes caused by speeds too fast for conditions. Acc. Anal. Prev. 2021, 153, 106039. [Google Scholar] [CrossRef] [PubMed]
- Zamani, A.; Behnood, A.; Davoodi, S.R. Temporal stability of pedestrian injury severity in pedestrian-vehicle crashes: New insights from random parameter logit model with heterogeneity in means and variances. Anal. Meth. Acc. Res. 2021, 32, 100184. [Google Scholar] [CrossRef]
- Zubaidi, H.; Obaid, I.; Alnedawi, A.; Das, S.; Haque, M.M. Temporal instability assessment of injury severities of motor vehicle drivers at give-way controlled unsignalized intersections: A random parameters approach with heterogeneity in means and variances. Acc. Anal. Prev. 2021, 156, 106151. [Google Scholar] [CrossRef]
- Islam, S.; Brown, J. A comparative injury severity analysis of motorcycle at-fault crashes on rural and urban roadways in Alabama. Acc. Anal. Prev. 2017, 108, 163–171. [Google Scholar] [CrossRef]
- Wang, M.H. Investigating the Difference in Factors Contributing to the Likelihood of Motorcyclist Fatalities in Single Motorcycle and Multiple Vehicle Crashes. Int. J. Environ. Res. Public Health 2022, 19, 8411. [Google Scholar] [CrossRef]
- Li, Z.; Huang, Z.; Wang, J. Association of Illegal Motorcyclist Behaviors and Injury Severity in Urban Motorcycle Crashes. Sustainability 2022, 14, 13923. [Google Scholar] [CrossRef]
- Wang, X.; Yuan, J.; Schultz, G.G.; Fang, S. Investigating the safety impact of roadway network features of suburban arterials in Shanghai. Acc. Anal. Prev. 2018, 113, 137–148. [Google Scholar] [CrossRef]
- Abdul Manan, M.M.; Jonsson, T.; Várhelyi, A. Development of a safety performance function for motorcycle accident fatalities on Malaysian primary roads. Saf. Sci. 2013, 60, 13–20. [Google Scholar] [CrossRef]
- Kronprasert, N.; Boontan, K.; Kanha, P. Crash Prediction Models for Horizontal Curve Segments on Two-Lane Rural Roads in Thailand. Sustainability 2021, 13, 9011. [Google Scholar] [CrossRef]
- Islam, M. An analysis of motorcyclists’ injury severities in work-zone crashes with unobserved heterogeneity. IATSS Res. 2022, 46, 281–289. [Google Scholar] [CrossRef]
- Wang, J.; Ma, S.; Jiao, P.; Ji, L.; Sun, X.; Lu, H. Analyzing the Risk Factors of Traffic Accident Severity Using a Combination of Random Forest and Association Rules. Appl. Sci. 2023, 13, 8559. [Google Scholar] [CrossRef]
- Wang, T.; Yu, J.; Chen, Y.; Ma, C.; Ye, X.; Chen, J. Factors Associated With the Severity of Motor Vehicle Crashes Involving Electric Motorcycles and Electric Bicycles: A Random Parameters Logit Approach With Heterogeneity in Means. J. Trans. Res. Board 2023, 2677, 691–704. [Google Scholar] [CrossRef]
- Washington, S.P.; Karlaftis, M.G.; Mannering, F. Statistical and Econometric Methods for Transportation Data Analysis, 2nd ed.; CRC Press: Boca Raton, FL, USA, 2020. [Google Scholar]
- Behnood, A.; Mannering, F. Time-of-day variations and temporal instability of factors affecting injury severities in large-truck crashes. Anal. Meth. Acc. Res. 2019, 23, 100102. [Google Scholar] [CrossRef]
- Al-Bdairi, N.S.S.; Behnood, A. Assessment of temporal stability in risk factors of crashes at horizontal curves on rural two-lane undivided highways. J. Saf. Res. 2021, 76, 205–217. [Google Scholar] [CrossRef]
- Hou, Q.; Huo, X.; Leng, J.; Mannering, F. A note on out-of-sample prediction, marginal effects computations, and temporal testing with random parameters crash-injury severity models. Anal. Meth. Acc. Res. 2022, 33, 100191. [Google Scholar] [CrossRef]
- Li, Y.; Song, L.; Fan, W. Day-of-the-week variations and temporal instability of factors influencing pedestrian injury severity in pedestrian-vehicle crashes: A random parameters logit approach with heterogeneity in means and variances. Anal. Meth. Acc. Res. 2021, 29, 100152. [Google Scholar] [CrossRef]
- Department of Land Transport. The Number of Driving Licences and Transport Personnel Licences Classified by Gender as of 31 May 2020. Available online: https://data.go.th/dataset/drvlic_gender (accessed on 17 October 2023).
- Department of Land Transport. Statistics of Vehicle Registration. Available online: https://web.dlt.go.th/statistics/ (accessed on 17 October 2023).
- Lee, D.; Guldmann, J.M.; von Rabenau, B. Impact of Driver’s Age and Gender, Built Environment, and Road Conditions on Crash Severity: A Logit Modeling Approach. Int. J. Environ. Res. Public Health 2023, 20, 2338. [Google Scholar] [CrossRef]
- Abdi, N.; Robertson, T.; Petrucka, P.; Crizzle, A.M. Do motorcycle helmets reduce road traffic injuries, hospitalizations and mortalities in low and lower-middle income countries in Africa? A systematic review and meta-analysis. BMC Public Health 2022, 22, 824. [Google Scholar] [CrossRef] [PubMed]
- Chang, H.-L.; Yeh, T.-H. Motorcyclist accident involvement by age, gender, and risky behaviors in Taipei, Taiwan. Transp. Res. Part F 2007, 10, 109–122. [Google Scholar] [CrossRef]
- Yan, X.; He, J.; Wu, G.; Zhang, C.; Wang, C.; Ye, Y. Differences of overturned and hit-fixed-object crashes on rural roads accompanied by speeding driving: Accommodating potential temporal shifts. Anal. Meth. Acc. Res. 2022, 35, 100220. [Google Scholar] [CrossRef]
- Se, C.; Champahom, T.; Jomnonkwao, S.; Kronprasert, N.; Ratanavaraha, V. The impact of weekday, weekend, and holiday crashes on motorcyclist injury severities: Accounting for temporal influence with unobserved effect and insights from out-of-sample prediction. Anal. Meth. Acc. Res. 2022, 36, 100240. [Google Scholar] [CrossRef]
- Das, S.; Tamakloe, R.; Zubaidi, H.; Obaid, I.; Ashifur Rahman, M. Bicyclist injury severity classification using a random parameter logit model. Int. J. Transp. Sci. Technol. 2023. [Google Scholar] [CrossRef]
- Faezi, S.F.; Hamid, H.; Davoodi, S.R. The effect of pavement marking on speed reduction in exclusive motorcycle lane in Malaysia. Contermp. Eng. Sci. 2010, 3, 149–155. [Google Scholar]
 Indicates the data filtering.

| Author (Year) | Research Aims | Country | Road Type | Spatial Instability |
|---|---|---|---|---|
| This study | To identify factors influencing injury severity in young adult motorcyclists on local roadways, comparing urban and rural areas. | Thailand (2018–2020) | Local Road | ✓ |
| Champahom et al. [10] | To investigate motorcycle crash severity, comparing young and old riders. | Thailand (2015–2020) | Local Road | - |
| Islam [8] | To analyze the impact of motorcyclists’ age on injury severity, considering three age groups. | Florida (2013–2017) | Not specify | - |
| Khan et al. [9] | To assess the link between age and severe injuries in young motorcycle riders. | Pakistan (2007–2015) | Not specify | - |
| Halbersberg and Lerner [12] | To predict fatal motorcycle crashes and identify key contributing factors. | Israeli (2002–2008) | Not specify | - |
| Hidalgo-Fuentes and Sospedra-Baeza [13] | To analyze motorcycle crashes in Spain based on gender and age. | Spain (2006–2011) | Not specify | - |
| Isa et al. [3] | To warrant a study to understand overall crash characteristics and associated risk factors. | Malaysia (2006–2008) | Not specify | - |
| Variable | Description | Urban Roadways | Rural Roadways | ||
|---|---|---|---|---|---|
| Mean | S.D. | Mean | S.D. | ||
| INJURY | 1 if fatal injury, 0 otherwise | 0.170 | 0.376 | 0.126 | 0.331 |
| GENDER | 1 if male young adult motorcyclist (yam), 0 if female yam | 0.716 | 0.451 | 0.720 | 0.449 |
| FOREIGN | 1 if foreigner, 0 if Thai | 0.027 | 0.162 | 0.025 | 0.155 |
| AT_FAULT | 1 if is at-fault, 0 otherwise | 0.752 | 0.432 | 0.796 | 0.403 |
| LOCAL_ADDRESS | 1 if local address same crash scenes, 0 otherwise | 0.621 | 0.485 | 0.727 | 0.446 |
| HELMET | 1 if wearing helmet, 0 otherwise | 0.502 | 0.500 | 0.412 | 0.492 |
| DRUNK | 1 if under influence of alcohol, 0 otherwise | 0.094 | 0.292 | 0.133 | 0.339 |
| UNLICENSE | 1 if unlicensed rider, 0 license rider | 0.045 | 0.207 | 0.049 | 0.215 |
| EXCESS_SPEED_LIMIT | 1 if exceeding the speed limit, 0 otherwise | 0.266 | 0.442 | 0.242 | 0.428 |
| VIOLATION | 1 if involved traffic sign/signal/wrong direction violation, 0 otherwise | 0.013 | 0.115 | 0.006 | 0.078 |
| ILLEGAL_OVERTAKING | 1 if illegal/improper overtaking, 0 otherwise | 0.009 | 0.094 | 0.006 | 0.078 |
| MOBILE_USE | 1 if using mobile phone, 0 otherwise | 0.003 | 0.050 | 0.006 | 0.077 |
| ASLEEP | 1 if fallen asleep/fatigue, 0 otherwise | 0.002 | 0.048 | 0.003 | 0.059 |
| CUTTING_FRONT | 1 if hitting vehicles cutting in front; 0 otherwise | 0.169 | 0.375 | 0.131 | 0.338 |
| CURVE | 1 if horizontal curve, 0 straight road | 0.089 | 0.285 | 0.163 | 0.370 |
| ROUGH | 1 if rough road surface, 0 good road surface | 0.013 | 0.112 | 0.032 | 0.177 |
| RAINING | 1 if under rainy weather, 0 otherwise | 0.028 | 0.164 | 0.031 | 0.174 |
| SMOKE_DUST_FOG | 1 if under dust/foggy weather, 0 otherwise | 0.018 | 0.135 | 0.034 | 0.182 |
| WET | 1 if wet road surface, 0 otherwise | 0.037 | 0.190 | 0.037 | 0.189 |
| AFTERNOON | 1 if 12:01 a.m.–4:00 p.m., 0 otherwise | 0.223 | 0.416 | 0.254 | 0.435 |
| MORNING | 1 if 8:01 a.m.–12:00 a.m., 0 otherwise | 0.129 | 0.335 | 0.147 | 0.354 |
| NIGHT_LIGHT | 1 if nighttime and lit road, 0 otherwise | 0.313 | 0.464 | 0.174 | 0.379 |
| DARK | 1 if nighttime and unlit road, 0 otherwise | 0.130 | 0.336 | 0.225 | 0.417 |
| LL(B) Rural | LL(B) Urban | LL(B) Total | χ2 | |
|---|---|---|---|---|
| −4006.86425 | −2431.00996 | −6503.81093 | 131.87344 | |
| Degree of Freedom | 19 | 15 | 16 | 18 |
| m1 = Rural | m21 = Urban | χ2 | Df | p-Value | Level of Confident |
|---|---|---|---|---|---|
| −4006.86425 | −4023.35934 | 32.99018 | 15 | 0.00470858 | 99.53% |
| m1 = Urban | m21 = Rural | χ2 | Df | p-Value | Level of Confident |
| −2431.00996 | −2441.8613 | 21.70268 | 19 | 0.29930232 | 70.07% |
| Variable | Urban Roadway | Distribution of Random Parameter | |||
|---|---|---|---|---|---|
| FPL | RPLMV | ||||
| Coefficient | t-Stat | Coefficient | t-Stat | ||
| Constant | −3.523 ** | −11.26 | −2.945 ** | −11.27 | |
| GENDER | 0.603 ** | 6.49 | 0.518 ** | 7.06 | |
| AT_FAULT | −0.302 ** | −3.71 | −0.268 ** | −4.09 | |
| HELMET | −0.138 * | −1.80 | −0.075 | −1.24 | |
| DRUNK | −0.617 ** | −4.57 | −0.578 ** | −5.34 | |
| UNLICENSE | 1.621 ** | 5.69 | 1.554 ** | 6.55 | |
| VIOLATION | 0.410 | 1.43 | 0.378 | 1.61 | |
| ILLEGAL_OVERTAKING | 0.063 | 0.17 | 0.064 | 0.21 | |
| MOBILE_USE | −0.758 | −0.72 | −0.686 | −0.83 | |
| ASLEEP | 0.043 | 0.06 | 0.023 ** | 0.04 | |
| CUTTING_FRONT | −0.787 ** | −6.32 | −0.737 ** | −7.18 | |
| CURVE | 0.157 | 1.28 | 0.128 | 1.29 | |
| ROUGH | −0.309 | −0.75 | −0.325 | −0.94 | |
| SMOKE_DUST_FOG | −1.160 ** | −3.06 | −1.027 ** | −3.51 | |
| AFTERNOON | −0.614 ** | −5.12 | −0.553 ** | −5.77 | |
| MORNING | −0.512 ** | −3.67 | −0.441 ** | −4.05 | |
| NIGHT_LIGHT | 0.179 * | 1.82 | 0.156 ** | 2.00 | |
| DARK | 0.454 ** | 3.83 | 0.393 ** | 4.14 | |
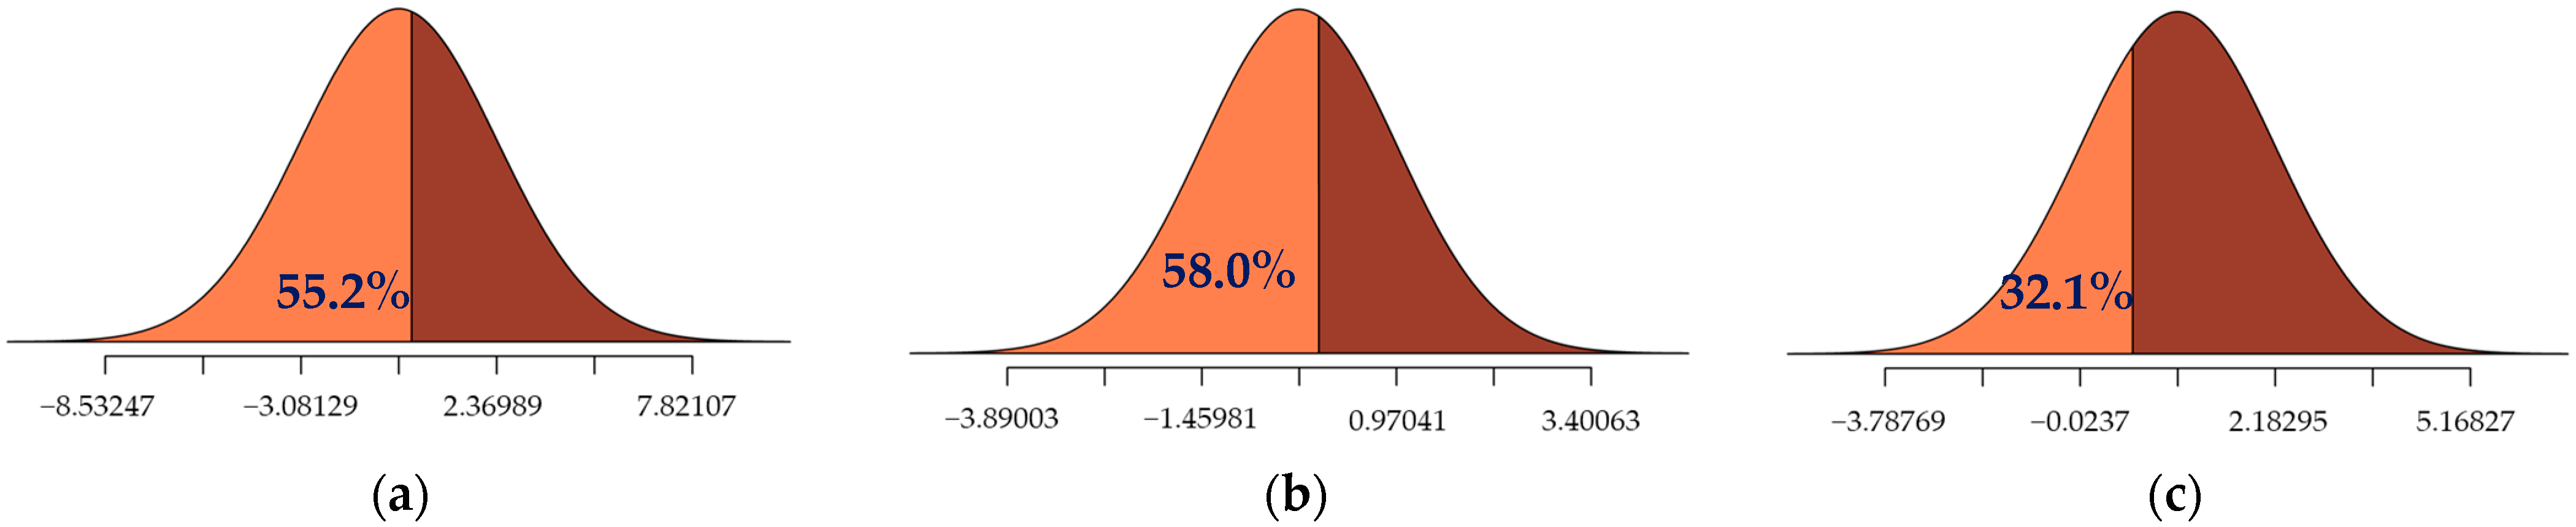
| FOREIGN | 0.421 ** | 2.05 | −0.356 | −1.27 | |
| S.D. of FOREIGN | 2.726 ** | 6.31 | 55.2% Below Zero | ||
| LOCAL_ADDRESS | 0.015 | 0.19 | −0.245 ** | −3.80 | |
| S.D. of LOCAL_ADDRESS | 1.215 ** | 19.42 | 58.0% Below zero | ||
| EXCESS_SPEED_LIMIT | 1.078 ** | 13.94 | 0.690 ** | 10.44 | |
| S.D. of EXCESS_SPEED_LIMIT | 1.493 ** | 16.89 | 32.1% Below zero | ||
| Unobserved Heterogeneity in means | |||||
| FOREIGN: RAINING | 1.672 ** | 1.99 | |||
| EXCESS_SPEED_LIMIT: RAINING | −1.124 * | −1.92 | |||
| Unobserved Heterogeneity in variances | |||||
| LOCAL_ADDRESS: WET | −3.175 ** | −14.32 | |||
| EXCESS_SPEED_LIMIT: WET | −1.925 ** | −4.97 | |||
| Model statics | |||||
| LL(β) | −2439.899 | −2431.010 | |||
| LL(0) | −2714.900 | −2714.900 | |||
| McFadden ρ2 | 0.1013 | 0.1046 | |||
| Model comparison via Likelihood Ratio Test | |||||
| Degree of Freedom | 7 | ||||
| χ2 = −2(LL(β)model A − LL(β)model B) | 17.778 | ||||
| Confidence level | 98.7% | ||||
| Superior model | RPLMV | ||||
| Variable | Urban Roadway | Distribution of Random Parameter | |||
|---|---|---|---|---|---|
| FPL | RPLMV | ||||
| Coefficient | t-Stat | Coefficient | t-Stat | ||
| Constant | −3.173 ** | −15.01 | −2.294 ** | −15.09 | |
| GENDER | 0.592 ** | 7.76 | 0.457 ** | 8.07 | |
| FOREIGN | 0.175 | 0.98 | 0.147 | 1.11 | |
| AT_FAULT | −0.457 ** | −6.76 | −0.361 ** | −7.21 | |
| LOCAL_ADDRESS | −0.263 ** | −4.12 | −0.191 ** | −4.04 | |
| DRUNK | −0.577 ** | −5.81 | −0.413 ** | −5.70 | |
| UNLICENSE | 1.069 ** | 5.81 | 0.788 ** | 5.87 | |
| EXCESS_SPEED_LIMIT | 1.307 ** | 21.91 | 0.985 ** | 22.37 | |
| MOBILE_USE | −1.300 * | −1.80 | −0.935 * | −1.77 | |
| ASLEEP | −0.330 | −0.61 | −0.294 | −0.77 | |
| CUTTING_FRONT | −0.475 ** | −4.60 | −0.381 ** | −4.98 | |
| ROUGH | −0.366 * | −1.88 | −0.278 * | −1.91 | |
| SMOKE_DUST_FOG | −0.430 ** | −2.45 | −0.324 ** | −2.56 | |
| WET | 0.003 | 0.01 | 0.035 | 0.18 | |
| AFTERNOON | −0.384 ** | −4.81 | −0.290 ** | −4.92 | |
| DARK | 0.389 ** | 5.41 | 0.277 ** | 5.19 | |
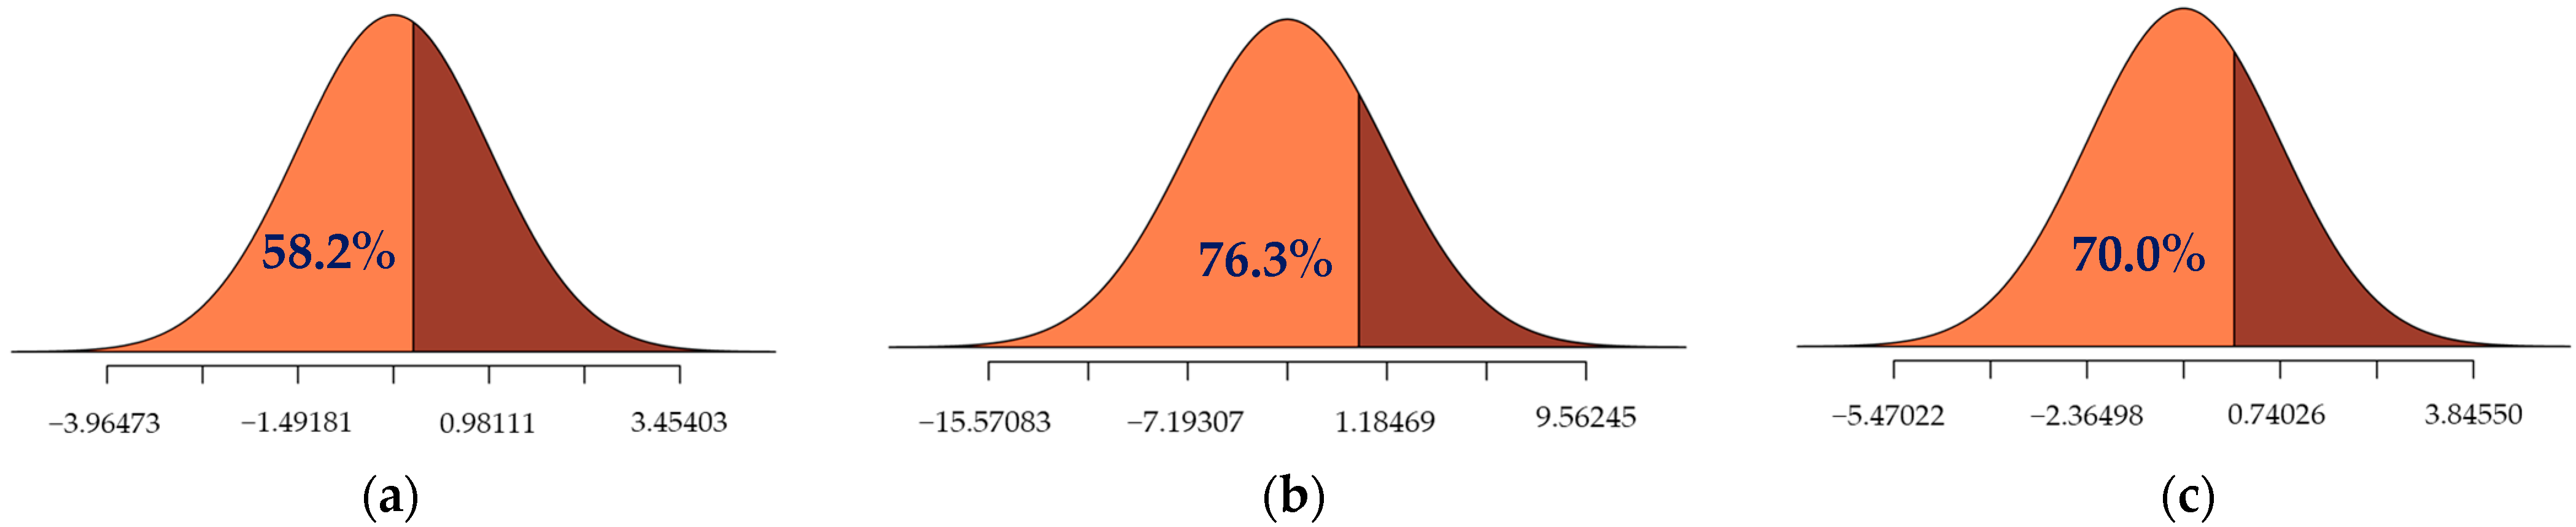
| CURVE | 0.077 | 0.99 | −0.255 ** | −3.00 | |
| S.D. of CURVE | 1.236 ** | 13.90 | 58.2% Below Zero | ||
| RAINING | −0.264 | −0.90 | −3.004 ** | −4.72 | |
| S.D. of RAINING | 4.189 ** | 7.01 | 76.3% Below Zero | ||
| MORNING | −0.349 ** | −3.65 | −0.812 ** | −6.77 | |
| S.D. of MORNING | 1.553 ** | 13.35 | 70.0% Below Zero | ||
| Unobserved heterogeneity in means | |||||
| RAINING: HELMET | 1.105 ** | 2.57 | |||
| RAINING: NIGHT_LIGHT | −1.294 ** | −1.98 | |||
| MORNING: ILLEGAL_OVERTAKING | 1.170 ** | 1.96 | |||
| MORNING: NIGHT_LIGHT | 1.592 ** | 2.31 | |||
| Unobserved heterogeneity in variances | |||||
| CURVE: VIOLATION | 0.914 * | 1.7 | |||
| MORNING: VIOLATION | −35.802 ** | −79.83 | |||
| Model statics | |||||
| LL(β) | −4025.653 | −4006.864 | |||
| LL(0) | −4483.470 | −4483.470 | |||
| McFadden ρ2 | 0.1021 | 0.1063 | |||
| Model comparison via likelihood ratio test | |||||
| Degrees of Freedom | 9 | ||||
| χ2 = −2(LL(β)model A − LL(β)model B) | 37.578 | ||||
| Confidence level | 99.99% | ||||
| Superior model | RPLMV | ||||
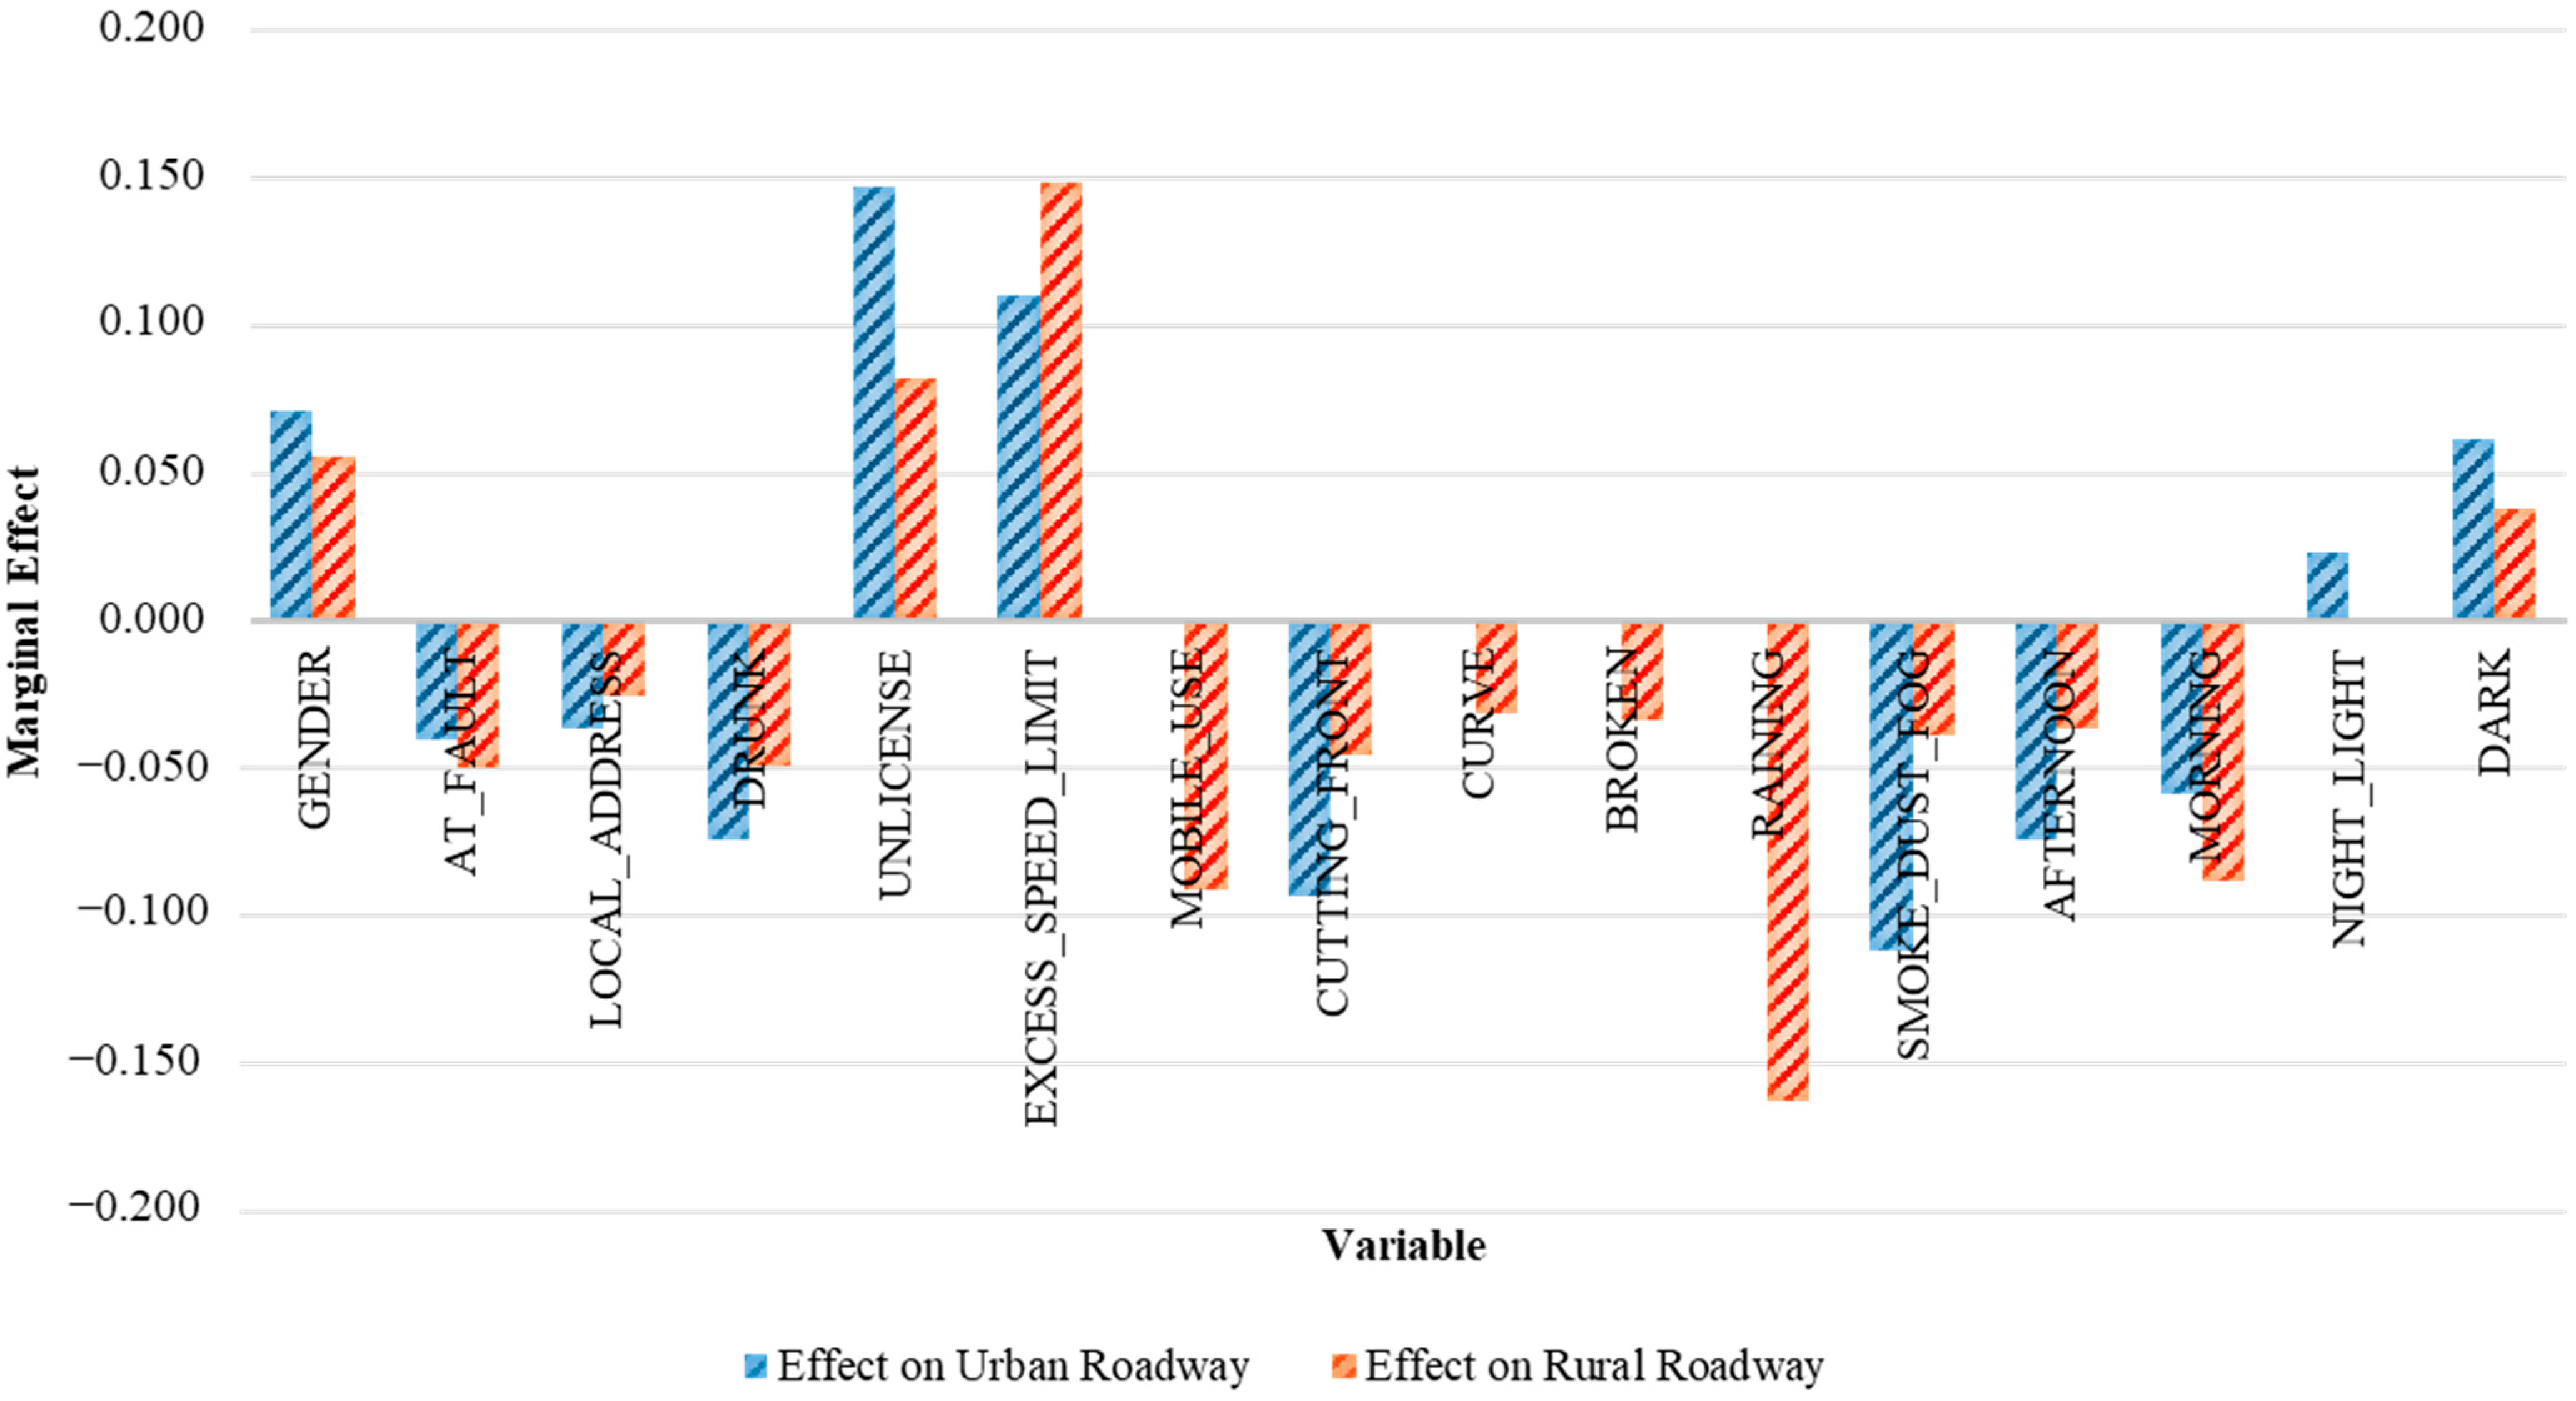
| Urban Roadway | Rural Roadway | |||||||
|---|---|---|---|---|---|---|---|---|
| Variable | Effect | t-Stat | 95% CI | Effect | t-Stat | 95% CI | ||
| GENDER | 0.0708 | 7.66 | 0.0527 | 0.0889 | 0.0558 | 8.74 | 0.0433 | 0.0684 |
| FOREIGN | ||||||||
| AT_FAULT | −0.0405 | 3.98 | −0.0605 | −0.0205 | −0.0499 | 6.86 | −0.0641 | −0.0356 |
| LOCAL_ADDRESS | −0.0362 | 3.78 | −0.0550 | −0.0174 | −0.0254 | 3.94 | −0.0381 | −0.0128 |
| HELMET | ||||||||
| DRUNK | −0.0740 | 6.20 | −0.0974 | −0.0506 | −0.0491 | 6.30 | −0.0644 | −0.0338 |
| UNLICENSE | 0.1475 | 11.8 | 0.1230 | 0.1720 | 0.0823 | 7.56 | 0.0610 | 0.1037 |
| EXCESS_SPEED_LIMIT | 0.1100 | 9.77 | 0.0879 | 0.1321 | 0.1486 | 20.52 | 0.1344 | 0.1627 |
| VIOLATION | ||||||||
| ILLEGAL_OVERTAKING | ||||||||
| MOBILE_USE | −0.0914 | 2.52 | −0.1626 | −0.0202 | ||||
| ASLEEP | ||||||||
| CUTTING_FRONT | −0.0933 | 8.67 | −0.1143 | −0.0722 | −0.0456 | 5.49 | −0.0618 | −0.0293 |
| CURVE | −0.0315 | 3.20 | −0.0508 | −0.0122 | ||||
| ROUGH | −0.0335 | 2.08 | −0.0650 | −0.0019 | ||||
| RAINING | −0.1626 | 20.45 | −0.1782 | −0.1470 | ||||
| SMOKE_DUST_FOG | −0.1120 | 5.05 | −0.1555 | −0.0685 | −0.0385 | 2.82 | −0.0653 | −0.0117 |
| WET | ||||||||
| AFTERNOON | −0.0739 | 6.41 | −0.0965 | −0.0513 | −0.0362 | 5.14 | −0.0500 | −0.0224 |
| MORNING | −0.0587 | 4.49 | −0.0843 | −0.0331 | −0.0883 | 8.67 | −0.1083 | −0.0684 |
| NIGHT_LIGHT | 0.0231 | 1.97 | 0.0001 | 0.0460 | ||||
| DARK | 0.0617 | 3.87 | 0.0305 | 0.0930 | 0.0376 | 5.00 | 0.0229 | 0.0524 |
Disclaimer/Publisher’s Note: The statements, opinions and data contained in all publications are solely those of the individual author(s) and contributor(s) and not of MDPI and/or the editor(s). MDPI and/or the editor(s) disclaim responsibility for any injury to people or property resulting from any ideas, methods, instructions or products referred to in the content. |
© 2023 by the authors. Licensee MDPI, Basel, Switzerland. This article is an open access article distributed under the terms and conditions of the Creative Commons Attribution (CC BY) license (https://creativecommons.org/licenses/by/4.0/).
Share and Cite
Champahom, T.; Se, C.; Aryuyo, F.; Banyong, C.; Jomnonkwao, S.; Ratanavaraha, V. Crash Severity Analysis of Young Adult Motorcyclists: A Comparison of Urban and Rural Local Roadways. Appl. Sci. 2023, 13, 11723. https://doi.org/10.3390/app132111723
Champahom T, Se C, Aryuyo F, Banyong C, Jomnonkwao S, Ratanavaraha V. Crash Severity Analysis of Young Adult Motorcyclists: A Comparison of Urban and Rural Local Roadways. Applied Sciences. 2023; 13(21):11723. https://doi.org/10.3390/app132111723
Chicago/Turabian StyleChampahom, Thanapong, Chamroeun Se, Fareeda Aryuyo, Chinnakrit Banyong, Sajjakaj Jomnonkwao, and Vatanavongs Ratanavaraha. 2023. "Crash Severity Analysis of Young Adult Motorcyclists: A Comparison of Urban and Rural Local Roadways" Applied Sciences 13, no. 21: 11723. https://doi.org/10.3390/app132111723
APA StyleChampahom, T., Se, C., Aryuyo, F., Banyong, C., Jomnonkwao, S., & Ratanavaraha, V. (2023). Crash Severity Analysis of Young Adult Motorcyclists: A Comparison of Urban and Rural Local Roadways. Applied Sciences, 13(21), 11723. https://doi.org/10.3390/app132111723