Article

Impact of Transition Areas on Driving Workload and Driving Behavior in Work Zones: A Naturalistic Driving Study

Faculty of Architecture, Civil and Transportation Engineering, Beijing University of Technology, Beijing 100124, China
*
Author to whom correspondence should be addressed.
Appl. Sci. 2023, 13(21), 11669; https://doi.org/10.3390/app132111669
Submission received: 25 September 2023 / Revised: 24 October 2023 / Accepted: 24 October 2023 / Published: 25 October 2023
(This article belongs to the Special Issue Traffic Safety Measures and Assessment)

Abstract

:
Significant changes in road and traffic conditions in transition areas are key to traffic organization and guaranteeing safety in freeway work zones. Currently, most of the related studies on transition area use theoretical calculations, traffic and driving simulations, and the impact of different transition area conditions on drivers’ psychophysiological indicators and driving behavior are unclear. In this paper, the gap acceptance theory was used to establish a calculation method of the transition area length, and the transition area length was calculated under different closed lane widths, speed limits, and traffic volumes. Based on the results of our theoretical calculations, naturalistic driving experiments were conducted with 48 participants in 12 scenarios involving 3 lane closure forms and 4 transition area lengths, and the relationship of transition area with driving workload and vehicle speed was determined. A transition area that was too short or too long increased traffic safety risks. The overall experimental results were consistent with the theoretical calculation length, and the theoretical calculation model was reliable. Compared to unaffected straight-through vehicles, merging vehicles and vehicles affected by merging have lower speeds, higher driving workloads, and increased traffic safety risks. An increase in the number of lanes in the transition area will result in increased driving workloads and vehicle speeds. Based on the changes in vehicle deceleration points and driving workloads, the affected area of the transition area was measured. When the speed limit was 60 km/h, the upstream affected areas of the transition areas with four, three, and two lanes were 1000 m, 850 m, and 700 m, and the downstream affected areas were 450 m, 400 m, and 350 m. These research results can provide a reference for improving traffic organization and guaranteeing safety in freeway work zones.

1. Introduction

With the continuous growth of economic development and travel demand in recent years, the traffic volume of some freeways tends to be saturated, making it difficult to manage traffic and ensure driver safety. Compared to newly built roads, reconstruction and expansion projects have the advantages of short construction periods, low costs, and less land occupation, and have gradually become a new trend in freeway construction. Work zones for reconstruction and expansion construction often occupy the shoulder or part of the lane, reducing the number of lanes available to drivers and traffic capacity within the area zone, which can cause traffic congestion [1,2]. At the same time, road and traffic conditions and driving behaviors are constantly changing, leading to increased traffic safety risks [3,4]. Compared to 10 years ago, in 2021, fatal crashes, fatalities, and estimated injuries in U.S. work zones increased by 56.9%, 54.4%, and 35.5%, respectively, and the accident rate in work zones is 3.36 times that in non-work zones [5]. Thus, traffic safety problems in work zones urgently need to be solved.
Some scholars have studied traffic safety problems in work zones [6,7], and their results indicate that in addition to driver factors, changes in driving behavior due to changes in construction zone configurations and road traffic conditions are one of the main causes of accidents [8,9]. Most work zones must occupy the shoulder or part of the lane in order to ensure proper construction, resulting in a decrease in the number of lanes available to drivers, and a transition area is set up to allow vehicles to change lanes and merge with adjacent normal traffic lanes to cross through the work zone. If the transition area length is short, the speed of the vehicles is too low, and the speed difference compared to adjacent lane vehicles is large, which can cause rear-end collisions and other accidents when merging [10,11]; moreover, it is difficult for vehicles to complete lane changing and merging within a transition area of limited length, which can lead to traffic congestion [12]. If the transition area length is too long and the speed of vehicles is too fast, drivers will find it difficult to react in a timely manner when road and traffic conditions change, which will likewise increase the road safety risk [13], work zone length, and construction costs. Garber et al. analyzed the characteristics of accidents in work zones in Virginia, and their results indicated that the proportion of vehicles involved in side-collision accidents in the transition area was significantly higher than in other areas of work zones [14]. Bidkar et al. used a machine learning method to analyze traffic conflicts in work zones and non-work zones under different traffic conditions. They found that changes in speed and acceleration were primary reasons for traffic conflict, and conflict probability can be effectively reduced by changing the transition area length and increasing the angle between the vehicles [15]. Therefore, clarifying the impact of transition areas on traffic and driving behavior characteristics in work zones, and determining the optimal length and layout of transition areas, represent the foundations for improving traffic efficiency and ensuring traffic safety. Some scholars have also conducted research on traffic characteristics and transition area length.
In terms of traffic and driving behavior characteristics in transition areas, Wang et al. used vehicle trajectory data to analyze the speed–traffic volume relationships in nine areas, and proposed a speed prediction model for work zones. It was found that the transition area had a significant impact on the speed of vehicles from 200 m upstream of the transition area to the activity area, and the impact on different lanes and vehicle types varied [16]. Zhang et al. studied the impact of traffic volume, traffic composition, and transition area length on the traffic characteristics of work zones through micro-simulation and proposed a method for predicting the traffic safety risk. Their results indicated that vehicle speed and transition area length had a significant impact on traffic safety in work zones [17,18]. Khanfar et al. used driving simulation and unsupervised machine learning clustering to analyze driving behavior in transition areas with different lane closure forms. The numbers of aggressive and conservative drivers in the work area were significantly higher than that of ordinary drivers, and drivers in the left lane were more aggressive than those in the right lane, resulting in vehicle speeds being too high or too low and increasing the dispersion of speed [19]. Wu et al. conducted a questionnaire survey on drivers in work zones based on their stated preferences and found that road conditions, traffic conditions, transition area length, and speed limit were important factors affecting drivers’ choice of merging location and traffic safety in work zones [20]. Duan et al. constructed a multi-stage analytical model for lane-changing behavior in work zones based on a driving simulation, where the lateral and longitudinal acceleration of vehicles undergoing merging increases and the merging distance decreases when the traffic volume is high [21]. Based on video data, Weng et al. proposed an estimation method for the rear-end collision of vehicles in a transition area using the logit model. If vehicles fail to complete merging before reaching the end of the transition area, the collision risk will be increased to about 3.3 times that of vehicles that complete merging in advance, and sufficiently increasing the transition area length will improve safety in work zones [22].
In terms of transition area length, Morgan et al. used a driving simulation to analyze lateral position, collisions, and other driving behaviors of drivers in a transition area of 30~160 m. Their results indicated that smaller transition area lengths would reduce the sight distance and reaction time of drivers and increase the traffic safety risk in work zones [23]. Lee et al. analyzed the impact of a 100~500 m transition area length on traffic efficiency and safety and concluded that the number of lanes is a key factor affecting the transition area length. The transition area length for a three- or four-lane work zone should be 300 m, and the transition area length for a two-lane work zone should be 200 m [24]. Shakouri et al. used micro-simulation, driving simulation, and real vehicle experiments to analyze the difference between a joint merge transition area and a traditional transition area. When the joint merge transition area was 200~250 m, the vehicle running speed was consistent with the traditional transition area, and driving workload was lower, resulting in better traffic safety [25,26,27]. Based on the theory of vehicle collision avoidance, Weng calculated the longitudinal distance for lane changing and emergency stopping in work zones and found that the transition area length should be 75~193 m [28].
At present, most relevant studies on transition areas use theoretical calculations, traffic simulation, and driving simulation, and their results differ and are difficult to verify [29,30]. The impacts of different transitional area conditions on drivers’ psychophysiological indicators are unclear, and there is a lack of research comparing driving behavior characteristics under different lane closure forms. In order to clarify the impact of transition areas on the drivers’ psychophysiological and driving behavior characteristics, in this paper, based on the proposed method of calculating the transition area length, naturalistic driving experiments were conducted with 48 participants in 12 scenarios involving 3 lane closure forms and 4 transition area lengths, and the impacts of different lane closure forms and transition area lengths on vehicle speed and driving workload were investigated. Our research results are of great significance in clarifying the best transition area length, optimizing work zone configurations, and ensuring traffic safety in work zones.

2. Methodology

2.1. Length of the Transition Area

As shown in Figure 1, a transition area should guide vehicles to change lanes and merge at the speed limit, enabling them to safely cross through the work zone. In most previous studies, only the speed limit and width of offset have been considered to calculate the transition area length [31]:
L = W v 2 60 ( v 60 km / h ) L = W v ( v > 60 km / h )
where L is the transition area length, m, W is the width of offset, m, and v is the speed limit, km/h. However, this calculation model does not consider traffic flow and drivers’ psychophysiological and driving behavior characteristics in the work zone.
Vehicles located in the closed lane need to find suitable gaps (same as the time headway, t) to merge into the adjacent lane before reaching the end of the transition area. When the traffic volume is low, drivers can easily choose larger merging gaps. The probability of critical gap appearance decreases when the traffic volume is higher and the transition area length is limited. When approaching the end of the transition area, drivers will choose smaller gaps to complete merging as soon as possible, and at the end of the transition area, drivers must stop and forcibly merge. According to observations, when the vehicle running speed is 40~80 km/h and the lane width is 3.25~3.75 m, the acceptable critical gap for a vehicle in the closed lane is 1.6~4.3 s. The time headway of the adjacent lane follows a continuous distribution: when the time headway is greater than the critical gap, the vehicle merges.
In order to determine the time headway distribution of the adjacent lane, a survey was conducted using an unmanned aerial vehicle in a work zone of a highway in China, as shown in Figure 2. The time headway of the adjacent lane in the closed lane of the transition area under different traffic volumes is shown in Table 1.
The adjacent lane is a single-lane traffic flow that cannot overtake, and the minimum time headway is 0.8 s, which follows to the shifted negative exponential distribution function, as shown in Equation (2):
F ( t ) = 1 e λ ( t τ ) ,   t τ
where λ is parameter and τ is the minimum time headway, s. If it follows to the shifted negative exponential distribution, then the expected time headway: E(t) = 1/λ + τ, and variance: Var(t) = 1/λ2. We used the X2 test to test its distribution: X2 = 16.541~31.684, and when the number of groups was 30 and the significance level was 0.05, the critical value X20.05 = 40.113 > 16.541~31.684. Therefore, we accepted the original assumption and followed to the shifted negative exponential distribution. When the traffic volume was 500 pcu/h, 1000 pcu/h, and 1500 pcu/h, its distribution function was as shown in Equations (3)–(5):
F ( t ) = 1 e 0.181 ( t 0.8 ) ,   t 0.8
F ( t ) = 1 e 0.358 ( t 0.8 ) ,   t 0.8
F ( t ) = 1 e 0.513 ( t 0.8 ) ,   t 0.8
The vehicle recognizes the need for merging in the transition area before the transition area. In the transition area, it needs to travel a certain distance (l1) to wait for the critical gap, and then make decisions and change lanes (l2). Therefore, the length of the transition area is L = l1 + l2. When the time headway of the adjacent lane follows a shifted negative exponential distribution, the average waiting time (tw) for the critical gap of merging waiting time is as shown in Equation (6):
t w = 1 λ [ e λ ( t 0 τ ) λ ( t 0 τ ) 1 ]
where t0 is the critical gap, s. Taking the critical gap of 95% merging vehicles as 4 s, when the traffic volume was 500 pcu/h, 1000 pcu/h, and 1500 pcu/h, the average waiting time calculated was 1.15 s, 2.79 s, and 4.92 s. The merging time of vehicles is related to lateral displacement, and when the closed lane width was 3.25 m, 3.5 m, and 3.75 m, the merging time was taken as 3 s, 4 s, and 5 s, with a reaction and decision time of 1 s.
When the closed lane width is 3.25~3.75 m, the speed limit is 40~80 km/h, and the traffic volume of adjacent lanes is 500~1500 pcu/h, the transition area length can be calculated as shown in Table 2 (rounded to 5 m).
According to our calculation results, the work zone speed limit has the greatest impact on the transition area length, and the closed lane width has the lowest impact. The calculation model can only calculate the transition area length under single-lane closure and cannot reflect the impact of different transition area lengths, lane closure forms, and traffic composition on drivers’ psychophysiological and driving behavior characteristics. Therefore, it is necessary to combine naturalistic driving experiments to study the impact of transition areas on drivers’ psychophysiological and driving behavior characteristics.

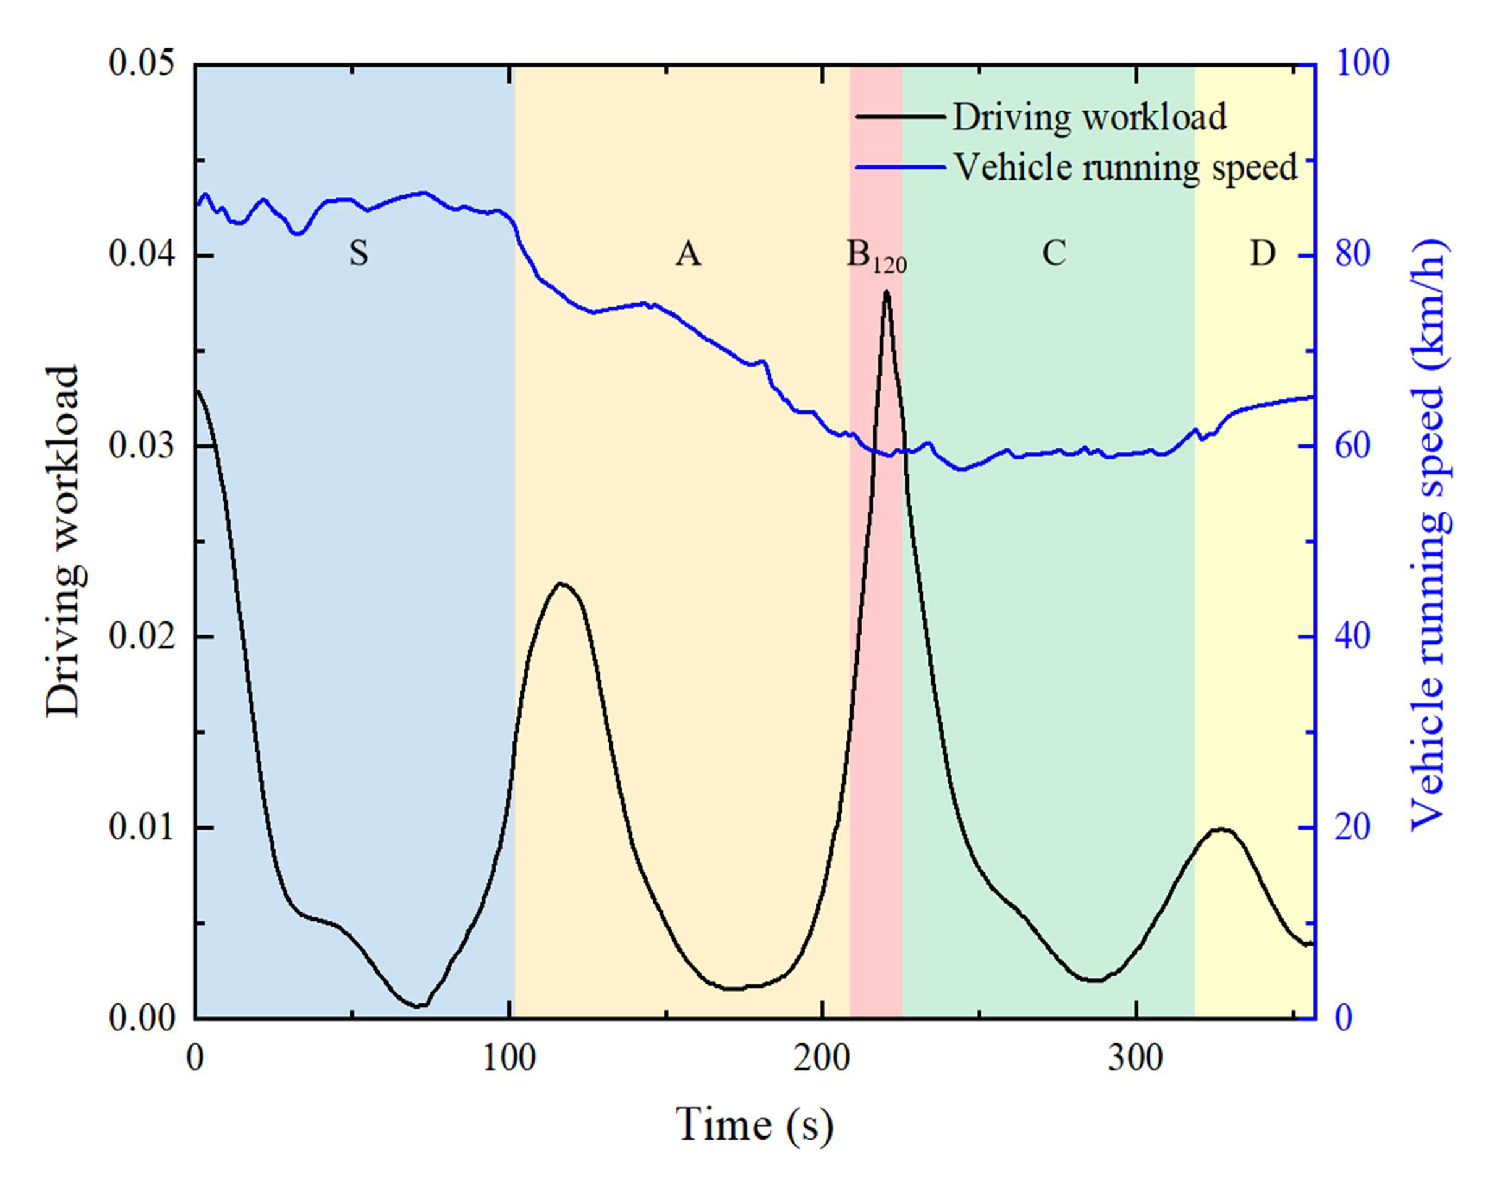
2.2. Driving Workload

When driving a vehicle into the affected area of a work zone, drivers need to observe their surroundings to obtain information on the roads, traffic, and environment, and make judgments based on this information. Furthermore, when operating their vehicles, they must accelerate, decelerate, and follow and change lanes in order to cross through the work zone quickly and safely. The physiological and psychological effects of taking in this information and performing operations during this period are known as the driving workload [32,33]. In the work zone, driver factors, vehicle characteristics, road and traffic conditions, and environmental conditions will lead to varying degrees of driver stimulation, which is reflected in real time as the driving workload. When this stimulation is too high or too low, it can cause tension or fatigue. Therefore, the work zone should provide drivers with safe and comfortable road traffic conditions to ensure that their driving workload is within a reasonable range.
In recent years, research on drivers’ psychophysiological and driving safety has indicated that measuring heart rate variability (HRV) has the advantages of stability and ease of measurement and processing, compared to indicators such as heart rate, blood pressure, brain waves, and skin electricity, which can enable better characterization of the driving workload [34]. The low frequency (LF) and high frequency (HF) of HRV reflect the activity of the driver’s nervous system. If drivers experience more stimulation in the work zone, their LF will increase, HF will decrease, and driving workload will increase; conversely, if drivers experience less stimulation, their driving workload will decrease. The driving workload can be calculated using Equation (7):
K i = [ ( L F H F ) i A ] / V i
where Ki is the driving workload at site i, (LF/HF)i is the HRV at site i, A is the HRV when the driver is calm, and V is the vehicle running speed at site i, km/h.
The different levels of driving workload risks and thresholds are shown in Table 3 [32].

3. Experiment

3.1. Participants and Vehicles

To avoid the influence of driver factors on the experimental results, 48 non-professional drivers were randomly recruited for this experiment, including 32 males and 16 females, which is in line with the proportion of male and female drivers in China. Participants were 23~55 years old (mean = 36.6, SD = 9.6), with driving experience of 3~28 years (mean = 10.2, SD = 8.3) and average annual driving mileage > 2000 km. The participants were physically healthy, had normal vision, had experience driving on freeways, were unfamiliar with the experimental road, had no major accident records, had adequate rest before the experiment, did not consume alcohol or smoke, did not take medication, and did not have any other conditions.
The experimental vehicle was a passenger car common on Chinese freeways.

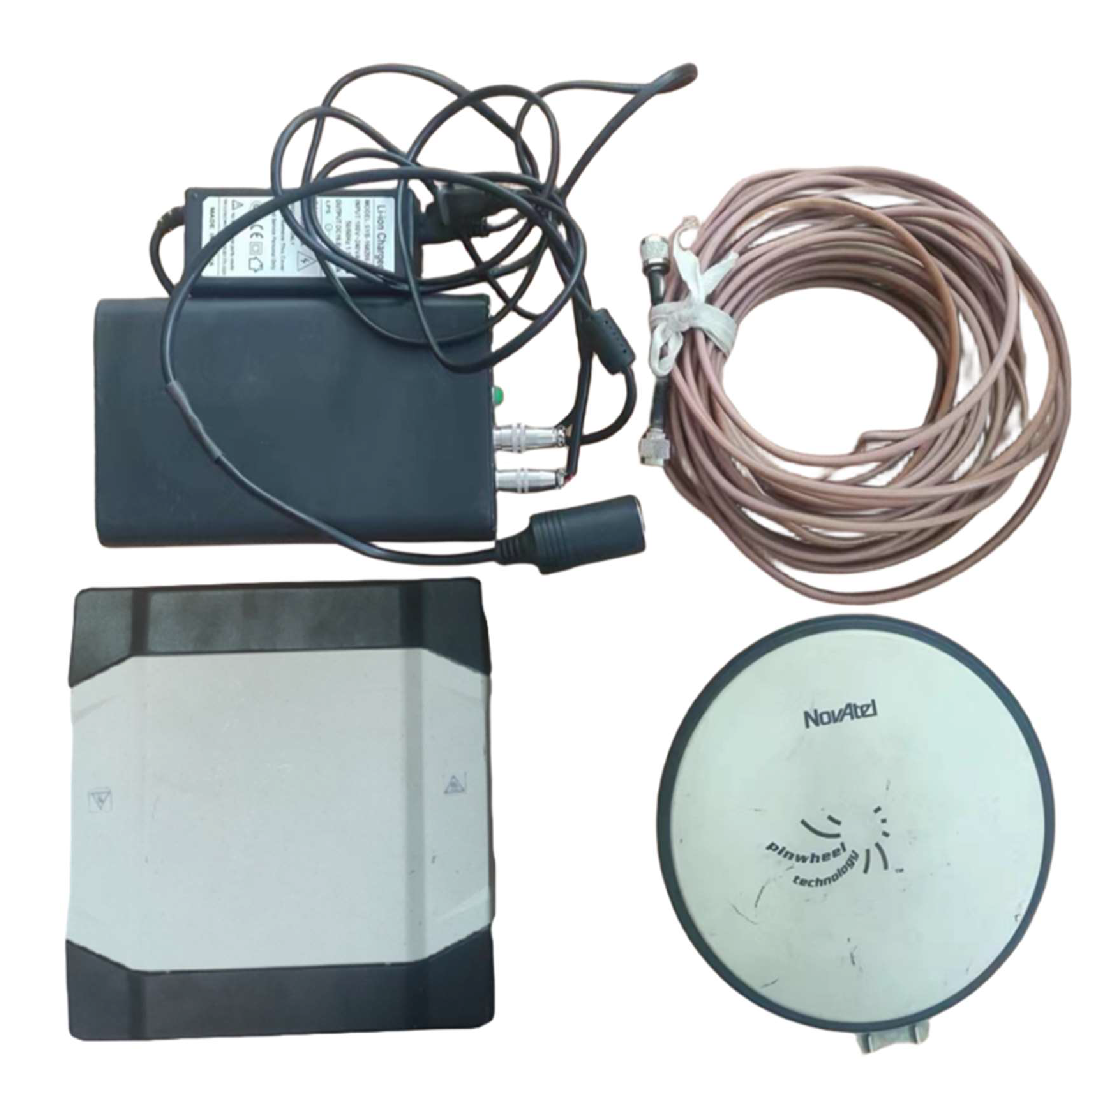
3.2. Instruments and Equipment

In order to collect the participants’ HRV and other psychological indicators during the experiment, a dynamic physiological detector was used. The sampling frequency could be set flexibly from 1 to 250 Hz, the data error was <0.02%, the use time was >4 h, and wearing the detector would not affect the driving of participants. Dedicated data analysis software was used to process the frame-by-frame HRV data of the participants during the driving process, as shown in Figure 3.
In order to collect data such as the real-time position and speed of the experiment vehicle, dynamic GPS was used. The sampling frequency could be set flexibly from 1 to 10 Hz, and the data error was <0.35 m. The vehicle position could be marked in real time using the equipped dotting device, as shown in Figure 4.

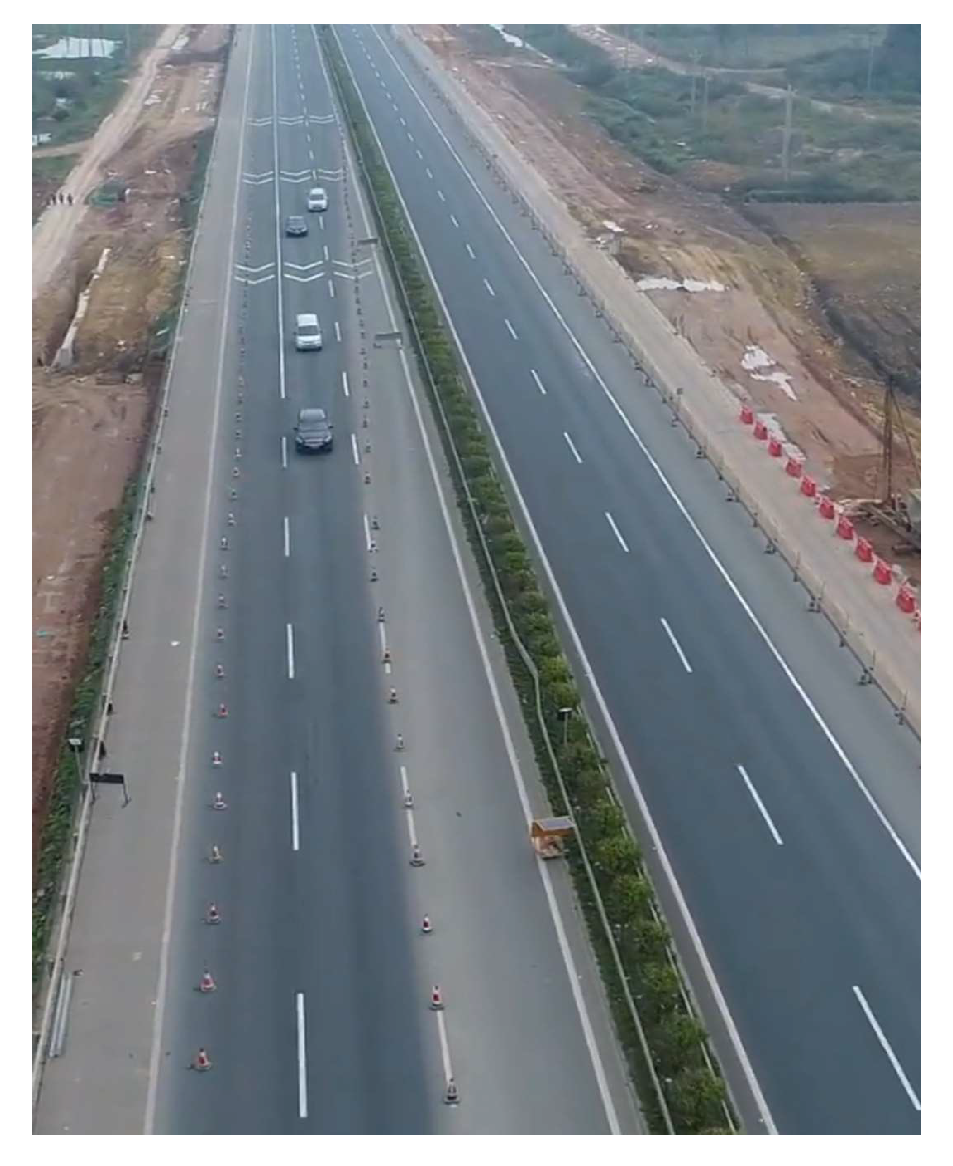
3.3. Experimental Roads

Three freeways undergoing reconstruction and expansion construction in the same region of China were selected as the experimental roads. The roads had 4 lanes, 3 lanes, and 2 lanes, with a lane width of 3.75 m. The rightmost lane was closed during the construction period, so temporarily, 3 lanes, 2 lanes, and 1 lane were available for driving (i.e., 4 → 3, 3 → 2, and 2 → 1). The experimental roads had an asphalt concrete pavement, the speed limit for the standard freeway section was 80 km/h, and the speed limit for the work zone was 60 km/h during the construction period. The linear conditions were good, the traffic volume was low (q < 500 pcu/h·ln), and the road design indicators and facility layout complied with the current Chinese regulations. The experimental roads included the following main areas, as shown in Figure 5.
Standard freeway section (S): 2000 m; 4, 3, and 2 lanes; speed limit of 80 km/h.
Advance warning area (A): 1600 m; 4, 3, and 2 lanes; speed limit of 60 km/h.
Transition area (B80/B120/B160/B200): From Table 1, the calculated length of the transition area on the experimental road was 120 m. Therefore, lengths of 80 m, 120 m, 160 m, and 200 m were selected to study the impact of the transition area length on drivers’ psychophysiological and driving behavior characteristics, and the number of lanes in the transition area was reduced from 4, 3, and 2 lanes to 3, 2, and 1 lanes, with a speed limit of 60 km/h.
Buffer area + activity area (C): 200 m + 2000 m; 3, 2, and 1 lanes; speed limit of 60 km/h.
Downstream transition area + termination area (D): 100 m + 40 m; from 3, 2, and 1 lanes to 4, 3, and 2 lanes; speed limit of 60 km/h.

3.4. Experimental Procedures

In order to ensure the authenticity and effectiveness of the experimental data, and to minimize experimental interference and data fluctuations, the experiment was conducted during good weather, every day from 9:00~12:00 and 14:00~17:00, for a total of 26 days. Talking was prohibited during the experiment to avoid interfering with the participants, who were not informed of the specifics of the experimental road before the experiment. In order to avoid driving fatigue, there was an interval of >1 h between the two tests, and each participant completed 3 experimental roads with 4 different transition area lengths, completing 12 scenarios for a total of 576 tests. One recorder was provided to record the participants’ individual driving behaviors and other experimental conditions. All legal, moral, and ethical requirements were complied with, and an honorarium was paid to the participants upon completion of the experiment. The specific steps were as follows:
Individual participants completed an information sheet indicating their gender, age, physical condition, average annual mileage, and accident history.
Participants were informed of the experimental precautions and trained for the test, and the participants were free to drive for 20 min to familiarize with the experiment vehicle.
Wear (install) and commission instruments and equipment.
HRV data were collected for 5 min when the participants were calm after sitting still in the vehicle for 5 min.
Participants were free to choose their lanes on the experimental road by driving their vehicles normally under free-flow conditions (q < 500 pcu/h·ln).
Driving situations were recorded and the data were saved.

3.5. Data Analysis

In order to avoid affecting the accuracy of the experimental data, the sampling frequency of the experimental instruments and equipment was set to 2 Hz. Based on the experimental information recorded by the recorder, a total of 616,841 HRV and 603,343 GPS data points were obtained from 8 areas (S, A, B80, B120, B160, B200, C, and D) on 3 experimental roads after eliminating abnormal data.

4. Results and Analysis

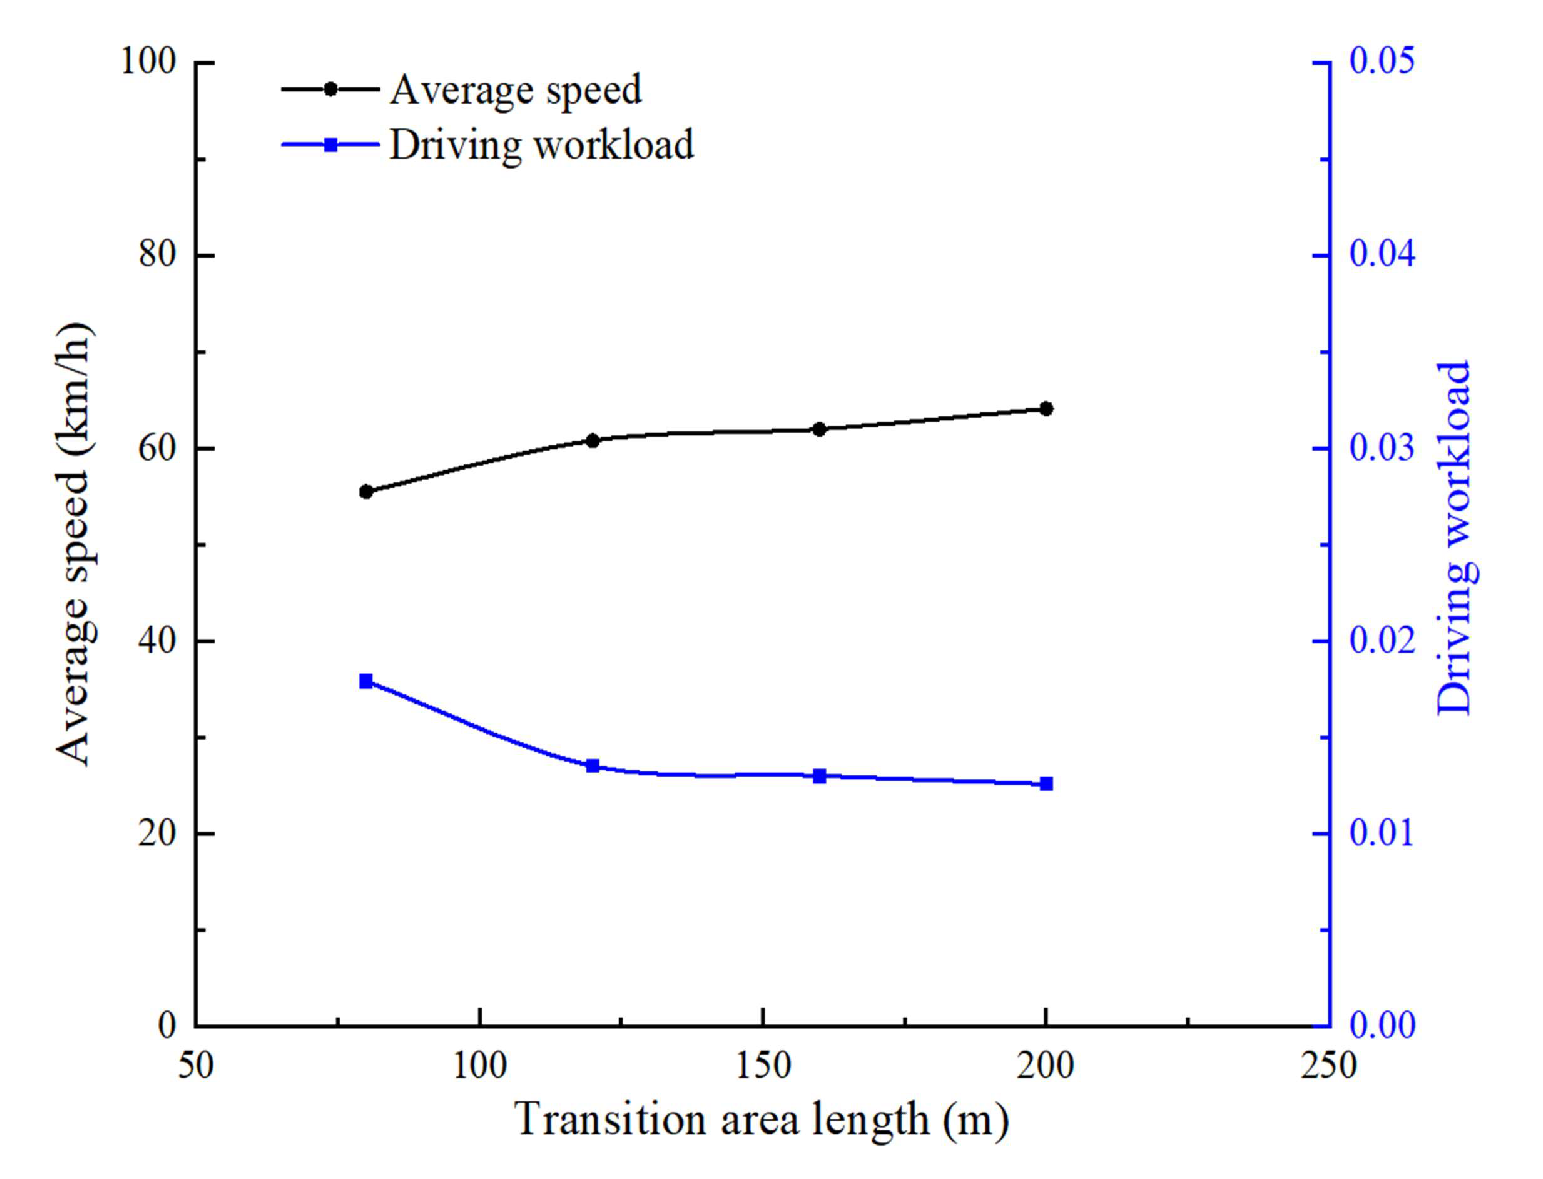
4.1. Length of the Transition Area

Statistically obtained vehicle speeds and driving workloads of the three work zones with different areas are shown in Table 4 and Table 5. The trends of their changes are shown in Figure 6 (taking the 2 → 1 work zone transition area length of 120 m as an example), and their distributions are shown in Figure 7. It is shown that the vehicle speeds in the different areas had a normal distribution (S–W normality test), and the driving workloads had a log-normal distribution (K–S test).
At the beginning of the experiment, the participants were more excited and their initial driving workloads were higher. After driving onto the experimental road, on which the road conditions of the standard freeway section (S) were good and the speed limit was lower (80 km/h), participants generally maintained a speed slightly higher than the speed limit, and their driving workloads gradually stabilized. After approaching the work zone, the participants noticed the sign for the advance warning area (A), and their driving workloads increased, while the road conditions remained unchanged, speed limit further decreased, and the overall vehicle speed only slightly decreased. The speed dispersion increased (11.80), and the speed limit compliance rate further decreased (8.52%) due to differences in the participants’ personalities and driving styles. Until they arrived at the middle of the advance warning zone (A), participants were affected by the changing road and traffic conditions in the transition area (B); once again, they reduced their speed to match the speed limit (60 km/h), and their driving workloads began to significantly increase. Subsequently, when participants drove into the activity area (C), the number of lanes decreased, participant stimulation due to the road and traffic conditions decreased, their driving workloads rapidly decreased, they generally kept their speed consistent with the speed limit (60 km/h) when crossing through the activity area (C), and their speed dispersion was low (9.22). At the end of the activity area (C), the change in the number of lanes gave a small amount of stimulation to the participants, who developed an escape mentality and wanted to escape the work zone as soon as possible, leading to a small increase in both vehicle speed and driving workload. Speeding was observed in different areas, and participants’ speed limit compliance rates were generally low (8.52~59.84%).
On the experimental road, the transition area had the greatest impact on vehicle speed and driving workload, and the impact was different between transition area lengths. In order to analyze the impact of the transition area length, the differences in vehicle speed and driving workload for different transition area lengths and their adjacent areas are shown in Table 6 and Table 7.
Vehicle speed increased as the transition zone length increased, and the opposite was true for driving workloads. The lengths of the transition areas set up on the experimental road increased in steps of 40 m, but their impacts on vehicle speed and driving workload were non-linear.
When the transition area length was 80 m, the length was lower than the theoretically calculated value. Vehicle speeds were lower than the speed limit, the speed dispersion was large, and the overspeed rate was low. There were significant differences compared to the adjacent areas and other transition area lengths, and the vehicle speed difference compared to the advance warning zone (A) was too large (>15 km/h). The driving workload was relatively high, and showed significant differences compared to the adjacent areas and other transition area lengths. Its mean, SD, higher-risk ratio, and high-risk ratio were 1.32, 1.47, 1.50, and 4.19 times higher than those of the other transition area lengths. The overall traffic safety risk was high, and the length was relatively low.
When the transition area lengths were 120 m and 160 m, the length matched the theoretically calculated value. Vehicle speed was consistent with the speed limit, the speed dispersion was low, and the overspeed rate was slightly higher than when the transition area length was 80 m. There were significant differences compared to the advance warning area (A) and other transition area lengths, with a difference of <15 km/h, and the vehicle speed was consistent with that in the activity area (C). The driving workload was relatively low, and showed significant differences compared to the adjacent areas, and when the transition area length was 80 m, it was consistent with the transition area length of 200 m. The overall traffic safety risk was relatively low, and the length was reasonable.
When the transition area length was 200 m, the length was greater than the theoretically calculated value. Vehicle speed was higher than the speed limit, and the speed dispersion and the overspeed rate were high. There were significant differences compared to the advance warning zone (A) and other transition area lengths, with a difference of <15 km/h. The driving workload was relatively low and showed significant differences compared to the adjacent areas, and when the transition area length was 80 m, it was consistent with the transition area lengths of 120 m and 160 m. The overall traffic safety risk was higher than when the transition area length was 120 m and 160 m, and the length was relatively large.
To better characterize the non-linear effects of different transition area lengths on vehicle speed and driving workload, a cubic function was used for fitting, as shown in Figure 8. The fitting results were good (R2 > 0.999), and the fitting formulas are shown in Equations (8) and (9):
v 0 = 0.8383 L 3 7.08 L 2 + 20.662 L + 41.1 80 L 200
where v0 is the average vehicle speed in the transition area, km/h, and L is the transition area length, m.
K 0 = 0.0006 L 3 + 0.0057 L 2 0.0171 L + 0.03 80 L 200
where K0 is the average driving workload in the transition area.

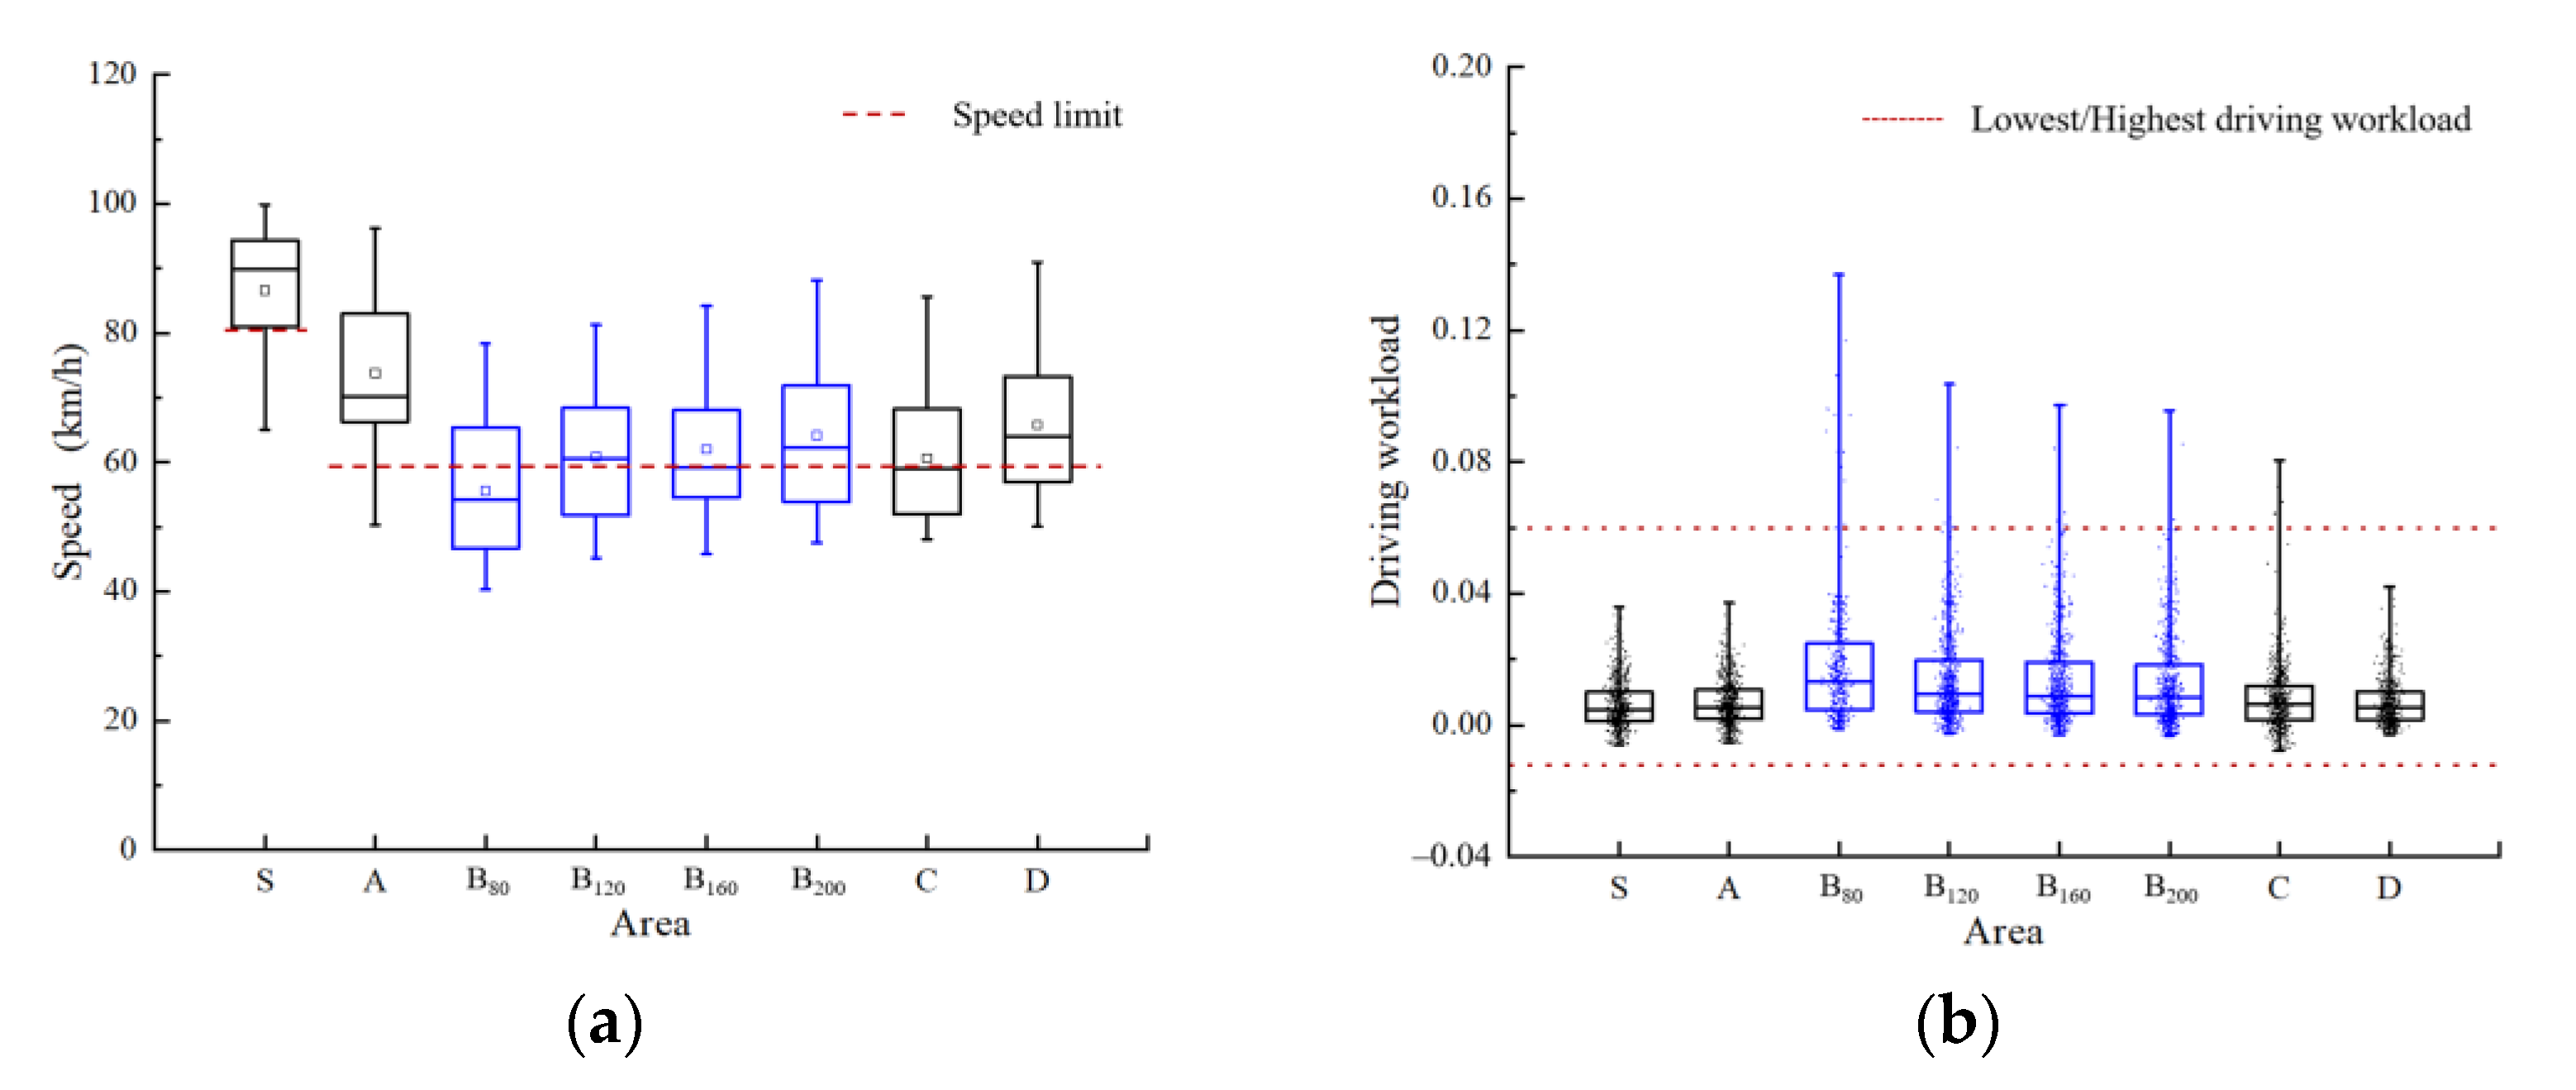
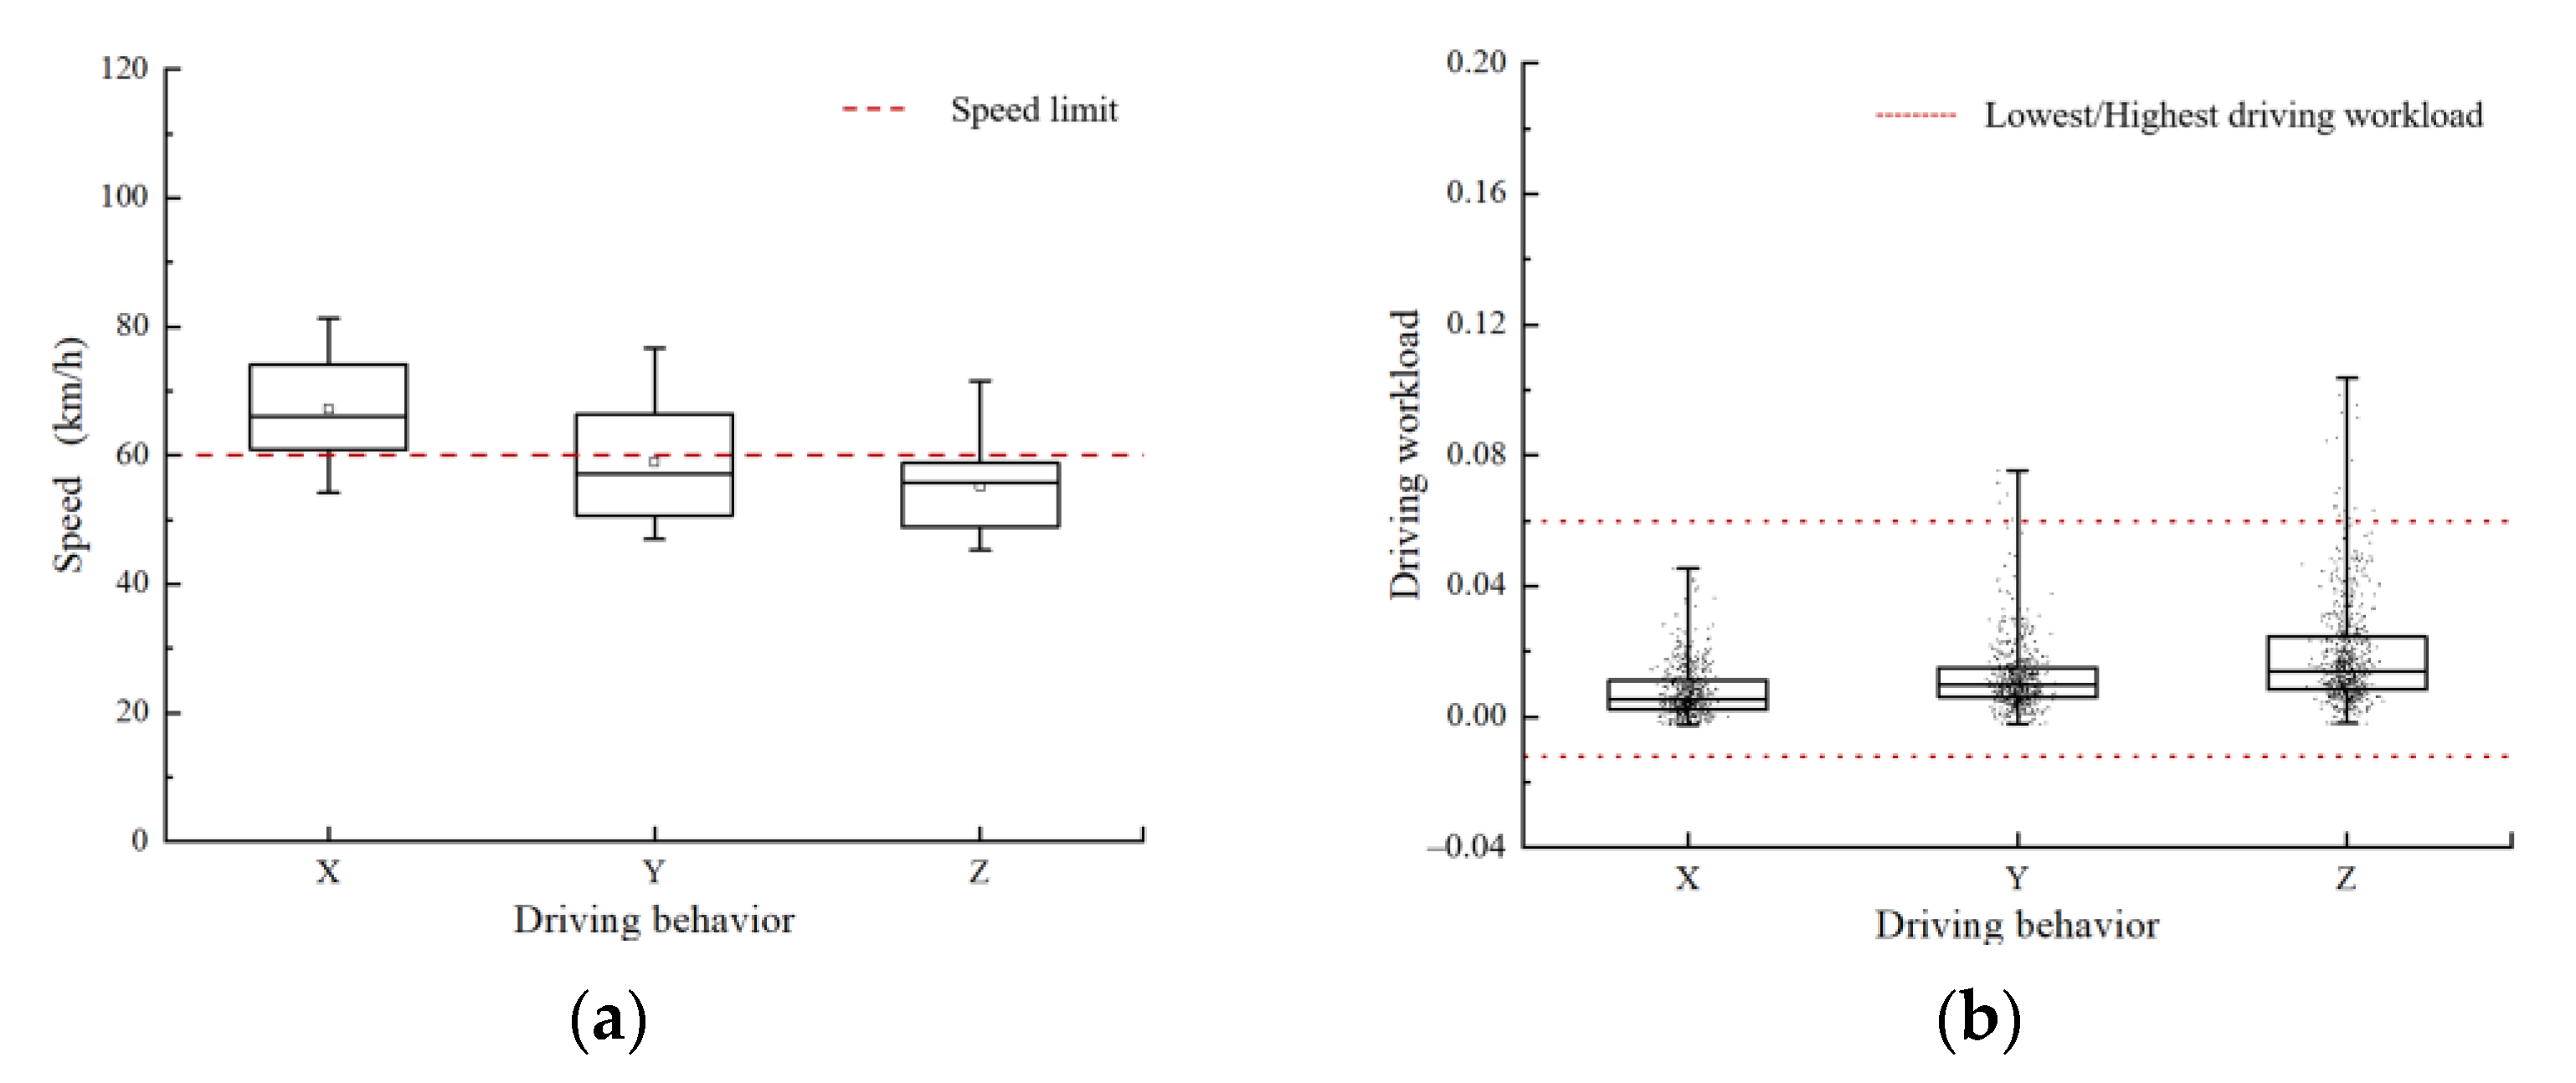
4.2. Driving Behavior

Based on the different lanes where participants were located, there were three main driving behaviors in the transition area, namely, straight-through vehicles not affected by merging in the left lane (X), straight vehicles affected by merging vehicles in the adjacent lane to the left of the closed lane (Y), and merging vehicles merging into the adjacent lane to the left of the closed lane (Z).
Our experiment allowed participants to freely choose lanes, with the fewest participants choosing to merge (Z) and most going straight (X), with an overall ratio of 42% (X):33% (Y):25% (Z); the greater the number of lanes, the fewer participants chose to merge (Z), with a ratio of 10% (4 lanes):26% (3 lanes):39% (2 lanes). When the transition area length was 200 m, the distributions of vehicle speed and driving workload for different driving behaviors were as shown in Figure 9.
The straight-through vehicles (X) had completed lane changing in the advance warning area (A), and they were able to travel normally within the transition area. Their average vehicle speed (67.17 km/h) was significantly higher than that of other vehicles and the speed limit, with a low speed limit compliance rate and low speed dispersion. As participants were not affected by other factors, the overall driving workload remained stable, and majority of drivers stayed within the standard driving workload range, with only a few higher-risk sections (2.14%).
The straight-through vehicles in the adjacent lane (Y) on the left side of the closed lane were affected by merging vehicles from the right lane when crossing through the transition area. Speed needs to be reduced according to the situation of merging vehicles to ensure smooth merging; therefore, the average vehicle speed (58.97 km/h) was lower, and the speed dispersion was higher due to different deceleration conditions. The driving workload was higher, and the proportion of higher-risk sections (9.62%) and high-risk sections (0.86%) increased.
The merging vehicles (Z) were required to slow down in the transition area to complete merging through lane changing, so the vehicle speed was low (55.24 km/h) and the overspeed rate and the speed dispersion were low. When merging, participants had to constantly observe the traffic conditions in the adjacent lanes through their rearview mirrors and look for suitable gaps to change lanes and merge; therefore, the impact of adjacent lanes was significant, and the driving workload was significantly higher than other driving behaviors. The proportion of higher-risk sections (17.82%) and high-risk sections (4.32%) was high, which increased the possibility of traffic conflicts and posed a greater risk to traffic safety in the transition area.

4.3. Lane Closure Form

To analyze the effect of different lane closure forms on participants in the transition area, statistics were obtained when the transition area length was 120 m. The vehicle speed and driving workload distribution under different lane closure forms in the transition area are shown in Figure 10, and the traffic composition of non-closed lanes is shown in Table 8. The vehicle speed and driving workload were positively correlated with the number of lanes. When there were more lanes, the road conditions were better, and the traffic composition of each lane was clearer. Most small vehicles drove in the left lanes and large vehicles drove in the right lanes. In free-flow conditions, the vehicle speed was higher than when there were fewer lanes, so the vehicle speed in the transition area was also higher. However, as the number of lanes increased, the proportion of large vehicles was higher when the vehicles in the transition area merged into the adjacent left lane, putting greater pressure on the participants and resulting in a higher driving workload. Moreover, as the number of lanes increased, it was difficult for the participants to grasp all the road and traffic information through their rearview mirrors when observing the adjacent left lane, which further increased the driving workload. When there were fewer lanes, the road conditions were worse than those of multi-lane roads, the vehicle speed was lower, and participants faced fewer large vehicles when merging; moreover, they had less road and traffic information to process, which helped them to make judgements and operate their vehicles, resulting in a lower overall driving workload. Therefore, when designing the layout of a transition area, the lane closure form should be taken into account, and the transition area can be appropriately increased to reduce the driving workload.

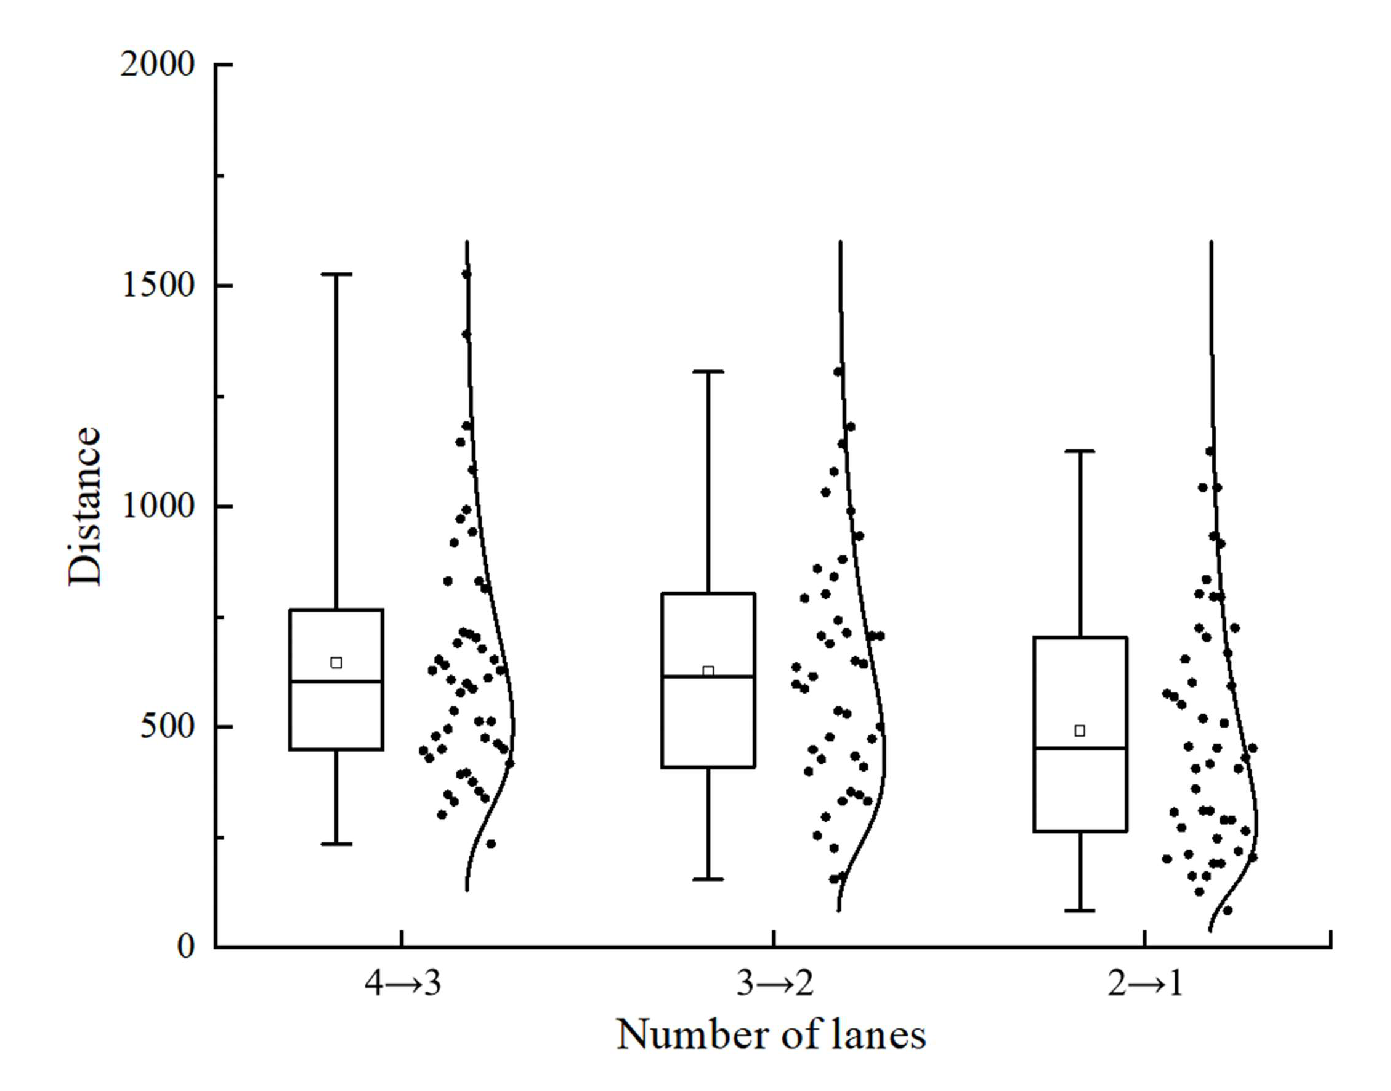
4.4. Affected Area of the Transition Area

The reduction in lanes in the transition area resulted in significant changes in road and traffic conditions compared to the standard freeway section (S) and advance warning areas (A), which increased the driving workload. Most participants slowed down in advance to anticipate the potential traffic safety risks caused by changes in road and traffic conditions. When participants entered the advance warning area (A) from the standard freeway section (S), they noticed the warning signs, speed limit signs, and lane reduction signs and slowed down. As the road and traffic conditions had not changed, the reduction in speed was relatively small, and most participants maintained a higher speed in the first half of the advance warning area (A). As they drove to the middle and rear parts of the advance warning area (A), they began to be affected by the transition area and slowed down again. The distribution of the distance of vehicle deceleration points from the transition area varied depending on the lane closure form, as shown in Figure 11.
Most participants chose to decelerate in the rear section of the advance warning area (A), and only a small number of participants chose to decelerate in the front section (A). Overall, the data had a log-normal distribution (K–S test, R2 > 0.9), and when there were more lanes, participants were more inclined to choose to decelerate earlier. When the experimental road had two lanes, the overall vehicle running speed was lower compared to when roads had three to four lanes; moreover, when the drivers saw the lane reduction sign, they knew that there was a transition area ahead and that the right lane would be closed, reducing the number of lanes from two to one. As the drivers had an accurate expectation of the road conditions ahead, they could relatively calmly respond to the changes in road and traffic conditions, resulting in a later deceleration point. When the experimental road had three to four lanes, participants saw the lane reduction sign but did not know the specific number of lanes that would be closed; additionally, the overall vehicle running speed was higher, so participants were unable to accurately anticipate the changes in road and traffic conditions ahead and were more inclined to slow down early to avoid traffic safety risks. Based on the deceleration points of most participants, the 85th-percentile deceleration point was selected as the upstream affected area of the transition area. The distances of the 85th-percentile deceleration point from the transition area were 966.8 m, 835.2 m, and 683.6 m for four lanes, three lanes, and two lanes; therefore, the upstream affected areas of the transition area were 1000 m, 850 m, and 700 m.
Under different lane closure forms, changes in road and traffic conditions in the transition area resulted in different increases in the driving workload. After the participants entered the activity area (C), the road and traffic conditions no longer changed, and driving workloads decreased and gradually returned to normal levels. The distance distributions required for the driving workload to decrease to normal levels under different lane closure forms are shown in Figure 12. Overall, the data had a log-normal distribution (K–S test, R2 > 0.9). When there were more lanes, the transition area had a greater impact on the driving workload, and the distance that must be traveled to reduce the driving workload to normal levels was larger. Based on the distances traveled by most participants, the 85th-percentile distance was selected as the downstream affected area of the transition area. The 85th-percentile distances traveled by participants for four lanes, three lanes, and two lanes were 433.5 m, 385.7 m, and 354.2 m, and the downstream affected areas of the transition area were 450 m, 400 m, and 350 m.

5. Discussion

In this paper, a calculation method for the transition area length was proposed. Based on the results of our theoretical calculations, naturalistic driving experiments were conducted with 48 participants in 12 scenarios involving 3 lane closure forms and 4 transition area lengths. The speed limit of the experimental road was low, speeding was observed in different areas, the number of aggressive and conservative drivers in the work area was significantly higher than that of ordinary drivers, and drivers in the left lane were more aggressive than those in the right lane. This resulted in vehicle speeds being too high or too low, under the combined impact of factors such as the transition area length, the speed difference, and speed dispersion between adjacent areas were increased. Zhang et al. used sequential g-estimation and other methods to study the relationship between vehicle speed and traffic conflicts in work zones, and the results indicated that when the vehicle running speed was ≥ 90 km/h, the reduction in the speed limit contributed to traffic safety in work zones. When the vehicle running speed was <90 km/h, the reduction in the speed limit did not have a significant impact on traffic safety in work zones. Meanwhile, optimizing work zone configurations to induce driving behaviors was found to effectively reduce traffic safety risks [35]. Therefore, a reasonable variable speed limit strategy should be adopted based on the specific conditions of the work zone [36] to appropriately reduce the overall vehicle running speed in the work zone while optimizing work zone configurations, reducing the speed difference and speed dispersion of adjacent areas, and ensuring traffic safety.
Closed lane widths, work zone speed limits, and traffic volumes in closed lanes and adjacent lanes are the primary factors in determining the transition zone length. Our experimental results indicated that transition zone length, driving behavior, and lane closure form all have an impact on the driving workload and vehicle speed in the work zone. This experiment was conducted under free-flow conditions, and previous studies have indicated that the driving workload while merging is positively correlated with traffic volume [37], and an increase in traffic volume can lead to a decrease in vehicle speed. Part of the work zone can be borrowed from the opposite lane to form a cross-work zone, with short intervals between the transition area and median opening, which can result in a rapid rise in driving workloads within a short period of time, increasing traffic safety risks. Changes in road conditions, reduced numbers of lanes, and reduced speed limits in work zones have resulted in a decrease in capacity [38]. It was found that with a speed limit of 60 km/h, the capacity of 4 → 3, 3 → 2, and 2 → 1 transition areas was 1570, 1550, and 1610 pcu/h·ln, and the maximum capacity of the median opening was 1600 pcu/h·ln. Therefore, when establishing the transition area, it is necessary to fully consider the relationships between different affecting factors and the transition area length, maintain a relatively stable driving workload, and avoid a significant increase in the driving workload in a short period of time. Attention should be paid to differences in the capacity of different areas to avoid the phenomenon of “double bottlenecks”.
When evaluating accident risk in work zones, due to the difficulty in obtaining accident data, the traditional method of predicting accident probability based on traffic accident data cannot effectively observe and measure all accident causes. Dong et al. proposed a dynamic state-space model based on deep learning to analyze accident risk, which can better solve the heterogeneity problem in relevant collision data and was found to be a superior alternative to traffic collision estimation and prediction [39]. Wang et al. proposed a traffic conflict identification method using vehicle trajectory data in a work zone, analyzed the spatial distribution characteristics of traffic conflicts in the transition area, and found that the probability of conflicts in the front and rear of the transition area was greater than in the middle; the faster the vehicle speed, the greater the probability of serious conflicts. The spacing between the transition areas should be appropriately increased to reduce the probability of conflicts [40]. Cheng et al. proposed a conflict prediction method according to artificial neural networks, which can only use work zone configurations and design parameters for conflict prediction [41]. Chang et al. used deep learning models to classify and predict conflicts in work zones based on natural driving datasets, and found that driving behavior, driving tasks, and traffic volume have a significant impact on traffic safety risks in work zones [42]. It is difficult to obtain accident information and matching historical traffic flow data for work zones. Existing research has gradually shifted to analyzing traffic safety levels based on traffic conflict data and dangerous driving behavior data, but the research is mostly based on static traffic flow states. Different driving behaviors can lead to changes in traffic status and driving workload within work zones. In the future, the configuration, driving behavior, environmental factors (lighting and weather, etc.), driver factors (gender, age, driving experience, etc.), and driving workload of work zones can be integrated with deep learning methods to construct an integrated learning model for predicting traffic conflicts. Furthermore, a fusion model for safety assessment in work zones can be constructed to achieve traffic safety analysis.

6. Conclusions

This paper was based on a calculation model for establishing the transition area length. Through naturalistic driving experiments, the impact of the transition area on the driving workload and driving behavior was studied, and the following conclusions were obtained:
(1)
Based on the driving behavior of vehicles merging into the transition area, the relationship between the critical gap and the distance traveled in the transition area was analyzed. The gap acceptance theory was used to establish a calculation method for the transition area length, and the calculated transition area length was obtained under different closed lane widths, speed limits, and traffic volumes.
(2)
Based on the results of our theoretical calculations, naturalistic driving experiments were conducted with 48 participants in 12 scenarios involving 3 lane closure forms and 4 transition area lengths, and the relationship of transition area with driving workload and vehicle speed was determined. A transition area that was too short or too long increased traffic safety risks; overall, the experimental results were consistent with the theoretical calculation length, and the theoretical calculation model was reliable. When the speed limit in the work zone was 60 km/h, a transition zone length of 120~160 m was more reasonable.
(3)
The relationship of lane closure form and driving behavior with the driving workload and vehicle speed in the transition area was analyzed. Compared to unaffected straight-through vehicles, merging vehicles and vehicles affected by merging have lower speeds, higher driving workloads, and increased traffic safety risks. An increase in the number of lanes in the transition area will result in increased driving workloads and vehicle speeds.
(4)
Based on the changes in vehicle deceleration points and driving workloads, the affected area of the transition area was obtained. When the speed limit was 60 km/h, the upstream affected transition areas with four, three, and two lanes were 1000 m, 850 m, and 700 m, and the downstream affected areas were 450 m, 400 m, and 350 m. In practical applications, the length and configuration of the transition area should be comprehensively determined based on the closed lane width, speed limit, traffic volume, number of lanes, driving behavior, and other factors.
This article only conducted a naturalistic driving experiment with a speed limit of 60 km/h. Further research should be carried out on the impact of transition areas under other speed limits and work zone configurations.

Author Contributions

Conceptualization, J.H.; methodology, S.M.; writing, S.M. and R.W.; visualization, S.M.; supervision, J.H. All authors have read and agreed to the published version of the manuscript.

Funding

This research was funded by the key field research and development plan projects of the Department of Science and Technology of Guangdong Province (No. 2022B0101070001).

Institutional Review Board Statement

Not applicable.

Informed Consent Statement

Not applicable.

Data Availability Statement

The data generated in this study are available upon request.

Acknowledgments

The authors would like to thank all the participants in the experiments. The authors also gratefully acknowledge the support provided by Ershun Ma and Weicong Li.

Conflicts of Interest

The authors declare no conflict of interest.

References

  1. Weng, J.; Qiang, M. Estimating capacity and traffic delay in work zones: An overview. Transp. Res. Part C Emerg. Technol. 2013, 35, 34–45. [Google Scholar] [CrossRef]
  2. Thapa, R.; Codjoe, J.; Osafo, A. Survey of work zone practices and validation of highway capacity manual work zone capacity model. Transp. Res. Rec. 2021, 2675, 1083–1091. [Google Scholar] [CrossRef]
  3. Cheng, Y.; Parker, S.T.; Ran, B.; Noyce, D.A. Enhanced analysis of work zone safety through integration of statewide crash and lane closure system data. Transp. Res. Rec. 2012, 2291, 17–25. [Google Scholar] [CrossRef]
  4. Khattak, A.J.; Khattak, A.J.; Council, F.M. Effects of work zone presence on injury and non-injury crashes. Accid. Anal. Prev. 2002, 34, 19–29. [Google Scholar] [CrossRef] [PubMed]
  5. Work Zone Facts and Statistics Retrieved. Available online: https://workzonesafety.org/work-zone-data (accessed on 1 September 2023).
  6. Chen, E.; Tarko, A.P. Modeling safety of highway work zones with random parameters and random effects models. Anal. Methods Accid. R. 2014, 1, 86–95. [Google Scholar] [CrossRef]
  7. Zhang, K.; Hassan, M.; Yahaya, M.; Yang, S. Analysis of work-zone crashes using the ordered probit model with factor analysis in Egypt. J. Adv. Transp. 2018, 2018, 1784. [Google Scholar] [CrossRef]
  8. Kummetha, V.C.; Kondyli, A.; Chrysikou, E.G.; Schrock, S.D. Safety analysis of work zone complexity with respect to driver characteristics—A simulator study employing performance and gaze measures. Accid. Anal. Prev. 2020, 142, 105566. [Google Scholar] [CrossRef] [PubMed]
  9. Nasrollahzadeh, A.A.; Sof, A.R.; Ravani, B. Identifying factors associated with roadside work zone collisions using machine learning techniques. Accid. Anal. Prev. 2021, 158, 106203. [Google Scholar] [CrossRef] [PubMed]
  10. Osman, M.; Paleti, R.; Mishra, S. Analysis of passenger-car crash injury severity in different work zone configurations. Accid. Anal. Prev. 2018, 111, 161–172. [Google Scholar] [CrossRef]
  11. Hou, G.; Chen, S. An improved cellular automaton model for work zone traffic simulation considering realistic driving behavior. J. Phys. Soc. Jpn. 2019, 88, 084001. [Google Scholar] [CrossRef]
  12. Lu, C.; Dong, J.; Sharma, A.; Huang, T.; Knickerbocker, S. Predicting freeway work zone capacity distribution based on logistic speed-density models. J. Adv. Transp. 2018, 1442, 9614501. [Google Scholar] [CrossRef]
  13. Jing, D.; Song, C.; Guo, Z.; Li, R. Influence of the median opening length on driving behaviors in the crossover work zone-A driving simulation study. Transp. Res. Part F Traffic Psychol. Behav. 2021, 82, 333–347. [Google Scholar] [CrossRef]
  14. Garber, N.J.; Zhao, M. Distribution and characteristics of crashes at different work zone locations in Virginia. Transp. Res. Rec. 2002, 1794, 19–25. [Google Scholar] [CrossRef]
  15. Bidkar, O.; Arkatkar, S.; Joshi, G.; Easa, S.M.M. Effect of construction work zone on rear-end conflicts by vehicle type under heterogeneous traffic conditions. J. Transp. Eng. A Syst. 2023, 149, 05023001. [Google Scholar] [CrossRef]
  16. Wang, Z.; He, W.; Zhang, X.; Wang, Y.; Wu, B.; Wang, Y. Lane-based vehicular speed characteristics analysis for freeway work zones using aerial videos. Can. J. Civil Eng. 2021, 48, 274–283. [Google Scholar] [CrossRef]
  17. Zhang, C.; Wang, B.; Yang, S.; Zhang, M.; Gong, Q.; Zhang, H. The driving risk analysis and evaluation in rightward zone of expressway reconstruction and extension engineering. J. Adv. Transp. 2020, 2020, 8943463. [Google Scholar] [CrossRef]
  18. Wang, Z.; Lee, J. Enhancing construction truck safety at work zones: A microscopic traffic simulation study. IEEE Access 2021, 9, 49750–49759. [Google Scholar] [CrossRef]
  19. Khanfar, N.O.; Ashqar, H.I.; Elhenawy, M.; Hussain, Q.; Hasasneh, A.; Alhajyaseen, W.K.M. Application of unsupervised machine learning classification for the analysis of driver behavior in work zones in the state of Qatar. Sustainability 2022, 14, 15184. [Google Scholar] [CrossRef]
  20. Wu, B.; Zou, C.; Li, Y.; Fan, D.; Zhu, S. Impact of road environment on drivers’ preference to merging location selection in freeway work zone merging areas. J. Adv. Transp. 2022, 2022, 2996081. [Google Scholar] [CrossRef]
  21. Duan, K.; Yan, X.; Ma, L.; Hang, J.; Li, X. A multistage analytic model of the longitudinal and lateral acceleration during lane changing in work zone areas with the aid of a driving simulator experiment. Transp. Lett. 2020, 14, 28–38. [Google Scholar] [CrossRef]
  22. Weng, J.; Meng, Q. Rear-end crash potential estimation in the work zone merging areas. J. Adv. Transp. 2014, 48, 238–249. [Google Scholar] [CrossRef]
  23. Morgan, J.F.; Duley, A.R.; Hancock, P.A. Driver responses to differing urban work zone configurations. Accid. Anal. Prev. 2010, 42, 978–985. [Google Scholar] [CrossRef] [PubMed]
  24. Lee, C.; Kim, D. The proper length of transition area for work zones on urban freeways. Korean Soc. Transp. 2013, 31, 58–66. [Google Scholar] [CrossRef]
  25. Shakouri, M.; Ikuma, L.H.; Aghazadeh, F.; Punniaraj, K.; Ishak, S. Effects of work zone configurations and traffic density on performance variables and subjective workload. Accid. Anal. Prev. 2014, 71, 166–176. [Google Scholar] [CrossRef] [PubMed]
  26. Ishak, S.; Qi, Y.; Rayaprolu, P. Safety evaluation of joint and conventional lane merge configurations for freeway work zones. Traffic Inj. Prev. 2012, 13, 199–208. [Google Scholar] [CrossRef] [PubMed]
  27. Idewu, W.I.A.; Wolshon, B. Joint merge and its impact on merging speeds in lane reduction areas of construction zone. Transp. Res. Rec. 2010, 2169, 31–39. [Google Scholar] [CrossRef]
  28. Weng, J. Collision avoidance analysis for transition taper length. Transp. Plan. Technol. 2011, 34, 811–822. [Google Scholar] [CrossRef]
  29. Pawar, N.M.; Velaga, N.R.; Sharmila, R.B. Exploring behavioral validity of driving simulator under time pressure driving conditions of professional drivers. Transp. Res. Part F Traffic Psychol. Behav. 2022, 89, 67–78. [Google Scholar] [CrossRef]
  30. Karimi, A.; Bassani, M.; Boroujerdian, A.M.; Catani, L. Investigation into passing behavior at passing zones to validate and extend the use of driving simulators in two-lane roads safety analysis. Accid. Anal. Prev. 2020, 139, 105487. [Google Scholar] [CrossRef]
  31. FHWA|U.S. Department of Transportation. Manual on Uniform Traffic Control Devices; FHWA: Washington, DC, USA, 2009; pp. 547–559. [Google Scholar]
  32. Ma, S.; Hu, J.; Wang, R.; Qu, S. Study on the median opening length of a freeway work zone based on a naturalistic driving experiment. Appl. Sci. 2023, 13, 851. [Google Scholar] [CrossRef]
  33. Ma, S.; Hu, J.; Ma, E.; Li, W.; Wang, R. Cluster analysis of freeway tunnel length based on naturalistic driving safety and comfort. Sustainability 2023, 15, 11914. [Google Scholar] [CrossRef]
  34. Wei, W.; Fu, X.; Zhong, S.; Ge, H. Driver’s mental workload classification using physiological, traffic flow and environmental factors. Transp. Res. Part F Traffic Psychol. Behav. 2023, 94, 151–169. [Google Scholar] [CrossRef]
  35. Zhang, Z.; Akinci, B.; Qian, S. How effective is reducing traffic speed for safer work zones? Methodology and a case study in Pennsylvania. Accid. Anal. Prev. 2023, 183, 106966. [Google Scholar] [CrossRef] [PubMed]
  36. Du, S.; Razavi, S. Variable speed limit for freeway work zone with capacity drop using discrete-time sliding mode control. J. Comput. Civil Eng. 2019, 33, 04019001. [Google Scholar] [CrossRef]
  37. Hu, J.; He, L.; Wang, R. Safety evaluation of freeway interchange merging areas based on driver workload theory. Sci. Prog. 2020, 103, 1–16. [Google Scholar] [CrossRef] [PubMed]
  38. Kianfar, J.; Abdoli, S. Deterministic and stochastic capacity in work zones: Findings from a long-term work zone. J. Transp. Eng. A Syst. 2021, 147, 04020141. [Google Scholar] [CrossRef]
  39. Dong, C.; Shao, C.; Clarke, D.B.; Nambisan, N.N. An innovative approach for traffic crash estimation and prediction on accommodating unobserved heterogeneities. Transp. Res. B Methodol. 2018, 118, 407–428. [Google Scholar] [CrossRef]
  40. Wang, P.; Zhu, S.; Zhao, X. Identification and factor analysis of traffic conflicts in the merge area of freeway work zone. Sustainability 2023, 15, 11314. [Google Scholar] [CrossRef]
  41. Cheng, Y.; Wu, K.; Li, H.; Parker, S.; Ran, B.; Noyce, D. Work zone crash occurrence prediction based on planning stage work zone configurations using an artificial neural network. Transp. Res. Rec. 2022, 2676, 377–384. [Google Scholar] [CrossRef]
  42. Chang, Y.; Bharadwaj, N.; Edara, P.; Sun, C. Exploring contributing factors of hazardous events in construction zones using naturalistic driving study data. IEEE Trans. Intell. Veh. 2020, 5, 519–527. [Google Scholar] [CrossRef]
Figure 1. Schematic diagram for calculating the length of the transition area.
Applsci 13 11669 g001
Figure 2. Survey of time headway in the work zone.
Applsci 13 11669 g002
Figure 3. Dynamic physiological detector.
Applsci 13 11669 g003
Figure 4. Dynamic GPS.
Applsci 13 11669 g004
Figure 5. Schematic diagram of the experimental roads (taking the 2 → 1 experimental road as an example).
Applsci 13 11669 g005
Figure 6. Changes in vehicle speed and driving workload in the work zone (taking the 2 → 1 work zone transition area length of 120 m as an example).
Applsci 13 11669 g006
Figure 7. Distribution of vehicle speed and driving workload in different areas of the work zone. (a) Vehicle speed and (b) driving workload.
Applsci 13 11669 g007
Figure 8. Fitting curve of the transition area length with vehicle speed and driving workload.
Applsci 13 11669 g008
Figure 9. Distributions of vehicle speed and driving workload for different driving behaviors in the transition area. (a) Vehicle speed and (b) driving workload.
Applsci 13 11669 g009
Figure 10. Distribution of vehicle speed and driving workload in transition areas with different lane closure forms. (a) Vehicle speed and (b) driving workload.
Applsci 13 11669 g010
Figure 11. Distribution of vehicle deceleration points under different lane closure forms.
Applsci 13 11669 g011
Figure 12. Distribution of distance traveled by reducing the driving workload to normal levels under different lane closure forms.
Applsci 13 11669 g012
Table 1. The time headway of the adjacent lane in the closed lane of the transition area under different traffic volumes.
Survey TimeTraffic Volume (pcu/h)Maximum Time Headway (s)Minimum Time Headway (s)Mean Time Headway (s)SD
A53720.610.836.325.53
B101115.370.793.592.80
C146811.880.762.751.95
Table 2. Calculated value of transition area length (m).
Closed Lane Width (m)3.253.53.75
Traffic Volume (pcu/h)500100015005001000150050010001500
Speed Limit (km/h)405575100708511080100120
50709512585110135100120150
6085115150100130165120145180
70100130175120150190140170210
80115150200135175220160195240
Table 3. Driving workload risks and thresholds.
Driving Workload DegreeSafety LevelDriving Workload
HighestHighly risky (nervous)Ki > 0.060
HigherRelatively risky (relatively nervous)0.030 < Ki ≤ 0.060
NormalSafe−0.001 < Ki ≤ 0.030
LowerRelatively risky (relatively fatigued)−0.012 < Ki ≤ −0.001
LowestHighly risky (fatigue)Ki ≤ −0.012
Table 4. Vehicle speed statistics for different areas in the work zone.
AreaMaximum Speed
(km/h)
Minimum Speed
(km/h)
Mean Speed
(km/h)
SDSpeed Limit
Compliance Rate
S99.8465.0686.569.9620.85%
A96.2150.2873.7711.808.52%
B8078.3040.2655.5211.8359.84%
B12081.2845.2160.819.7550.15%
B16086.1445.8162.0010.3748.16%
B20090.1347.5264.1211.6333.61%
C85.6348.0660.609.2259.63%
D90.9650.0665.7710.1836.44%
Table 5. Driving workload statistics for different areas in the work zone.
AreaMaximumMinimumMeanSDHigher-Risk RatioHigh-Risk Ratio
S0.03584−0.005880.006140.007095.68%0.00%
A0.03715−0.005410.006610.007203.87%0.00%
B800.15684−0.001050.017930.0198717.15%3.69%
B1200.10358−0.002450.013540.0135011.44%0.88%
B1600.09735−0.003040.013020.0134211.20%0.73%
B2000.09555−0.003200.012590.0134011.16%0.70%
C0.08032−0.007800.007940.010345.51%0.51%
D0.04206−0.002950.006970.007423.62%0.00%
Table 6. Vehicle speed consistency for different transition area lengths.
AreaAB80B120 #B160 #B200C #
A-18.2512.9611.779.65-
B80−18.25-−5.29−6.48−8.60–5.08
B120 # −12.965.29-−1.19 *−3.310.21 *
B160 # −11.776.481.19 *-−2.121.40 *
B200−9.658.603.312.12-3.52
C # -5.08−0.21 *−1.40 *−3.52-
# Means the vehicle speed is consistent with the speed limit (U-test, 95% confidence level). * Means no significant difference in vehicle speeds (Sidak correction, 95% confidence level).
Table 7. Driving workload consistency for different transition area lengths.
AreaAB80B120B160B200C
A-−0.01132−0.00693−0.00641−0.00598-
B800.01132-0.004390.004910.005340.00999
B1200.00693−0.00439-0.00052 *0.00095 *0.00560
B1600.00641−0.00491−0.00052 *-0.00043 *0.00508
B2000.00598−0.00534−0.00095 *−0.00043 *-0.00465
C-−0.00999−0.00560−0.00508−0.00465-
* Means no significant difference in driving workload (Sidak correction, 95% confidence level).
Table 8. Composition of non-closed lane traffic with different lane closure forms.
LaneLarge VehicleMedium VehicleSmall Vehicle
2 → 1 lanes123%23%54%
3 → 2 lanes124%13%63%
235%28%37%
4 → 3 lanes15%4%91%
234%14%52%
359%10%31%
Disclaimer/Publisher’s Note: The statements, opinions and data contained in all publications are solely those of the individual author(s) and contributor(s) and not of MDPI and/or the editor(s). MDPI and/or the editor(s) disclaim responsibility for any injury to people or property resulting from any ideas, methods, instructions or products referred to in the content.

