

Evaluating the Relationship between Surrogate Safety Measures and Traffic Event Severity in Terms of Human Perception of Danger: A Perspective under Indian Traffic Conditions


Abstract
:1. Introduction
2. Literature Review
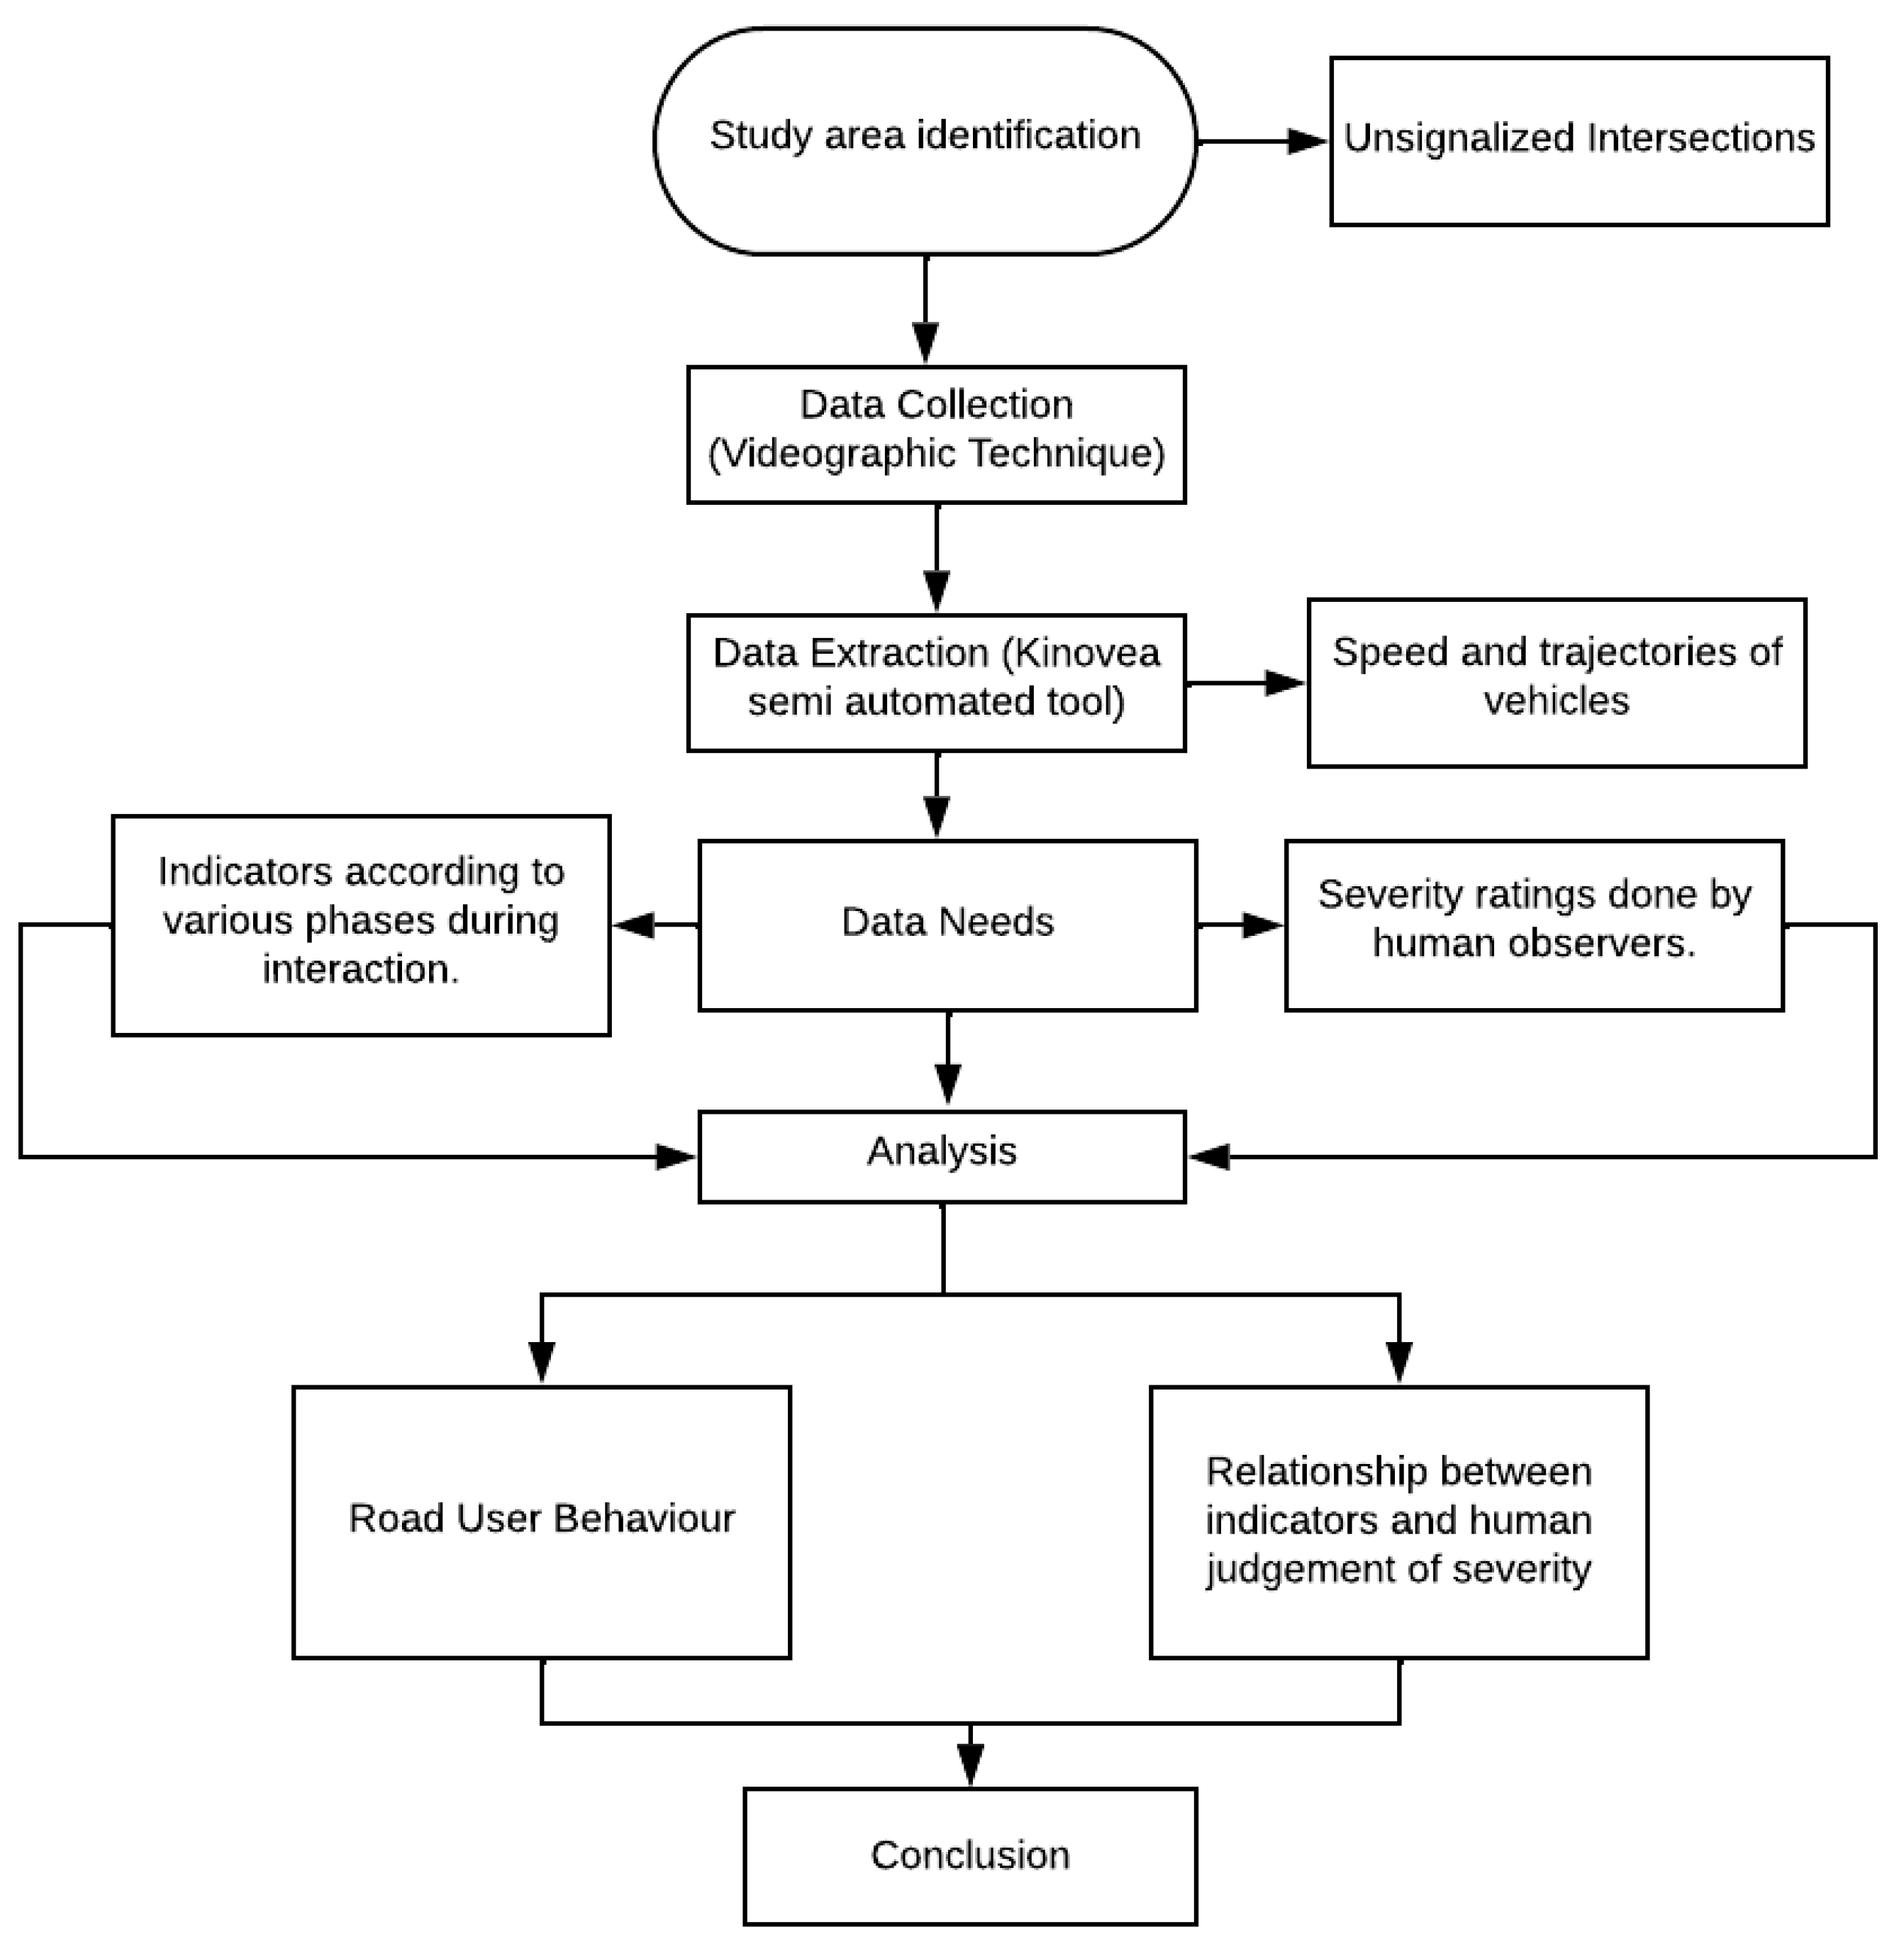
3. Data Collection
- (a)
- Uncontrolled four arm intersection;
- (b)
- No horizontal curvature or vertical gradient;
- (c)
- Substantial volume of crossing vehicle traffic from all directions at the intersection;
- (d)
- Presence of an elevated point to obtain a clear view of the intersection and approaching arms for videographic data;
- (e)
- No obstructions or electric wires in the vicinity of the intersection that could hinder the trajectory extraction process following data collection.
4. Data Extraction and Indicator Estimation

| Indicator | Definition |
|---|---|
| Evasive action (EA) | Evasive action is a categorical variable (If EA is present = 1, if not EA = 0) that indicates whether any of the road users have taken any evasive action or not. |
| Time until collision (T2) | The amount of time remaining until the latest road user reaches the potential collision point [30]. When on a collision course, this is equal to the TTC. |
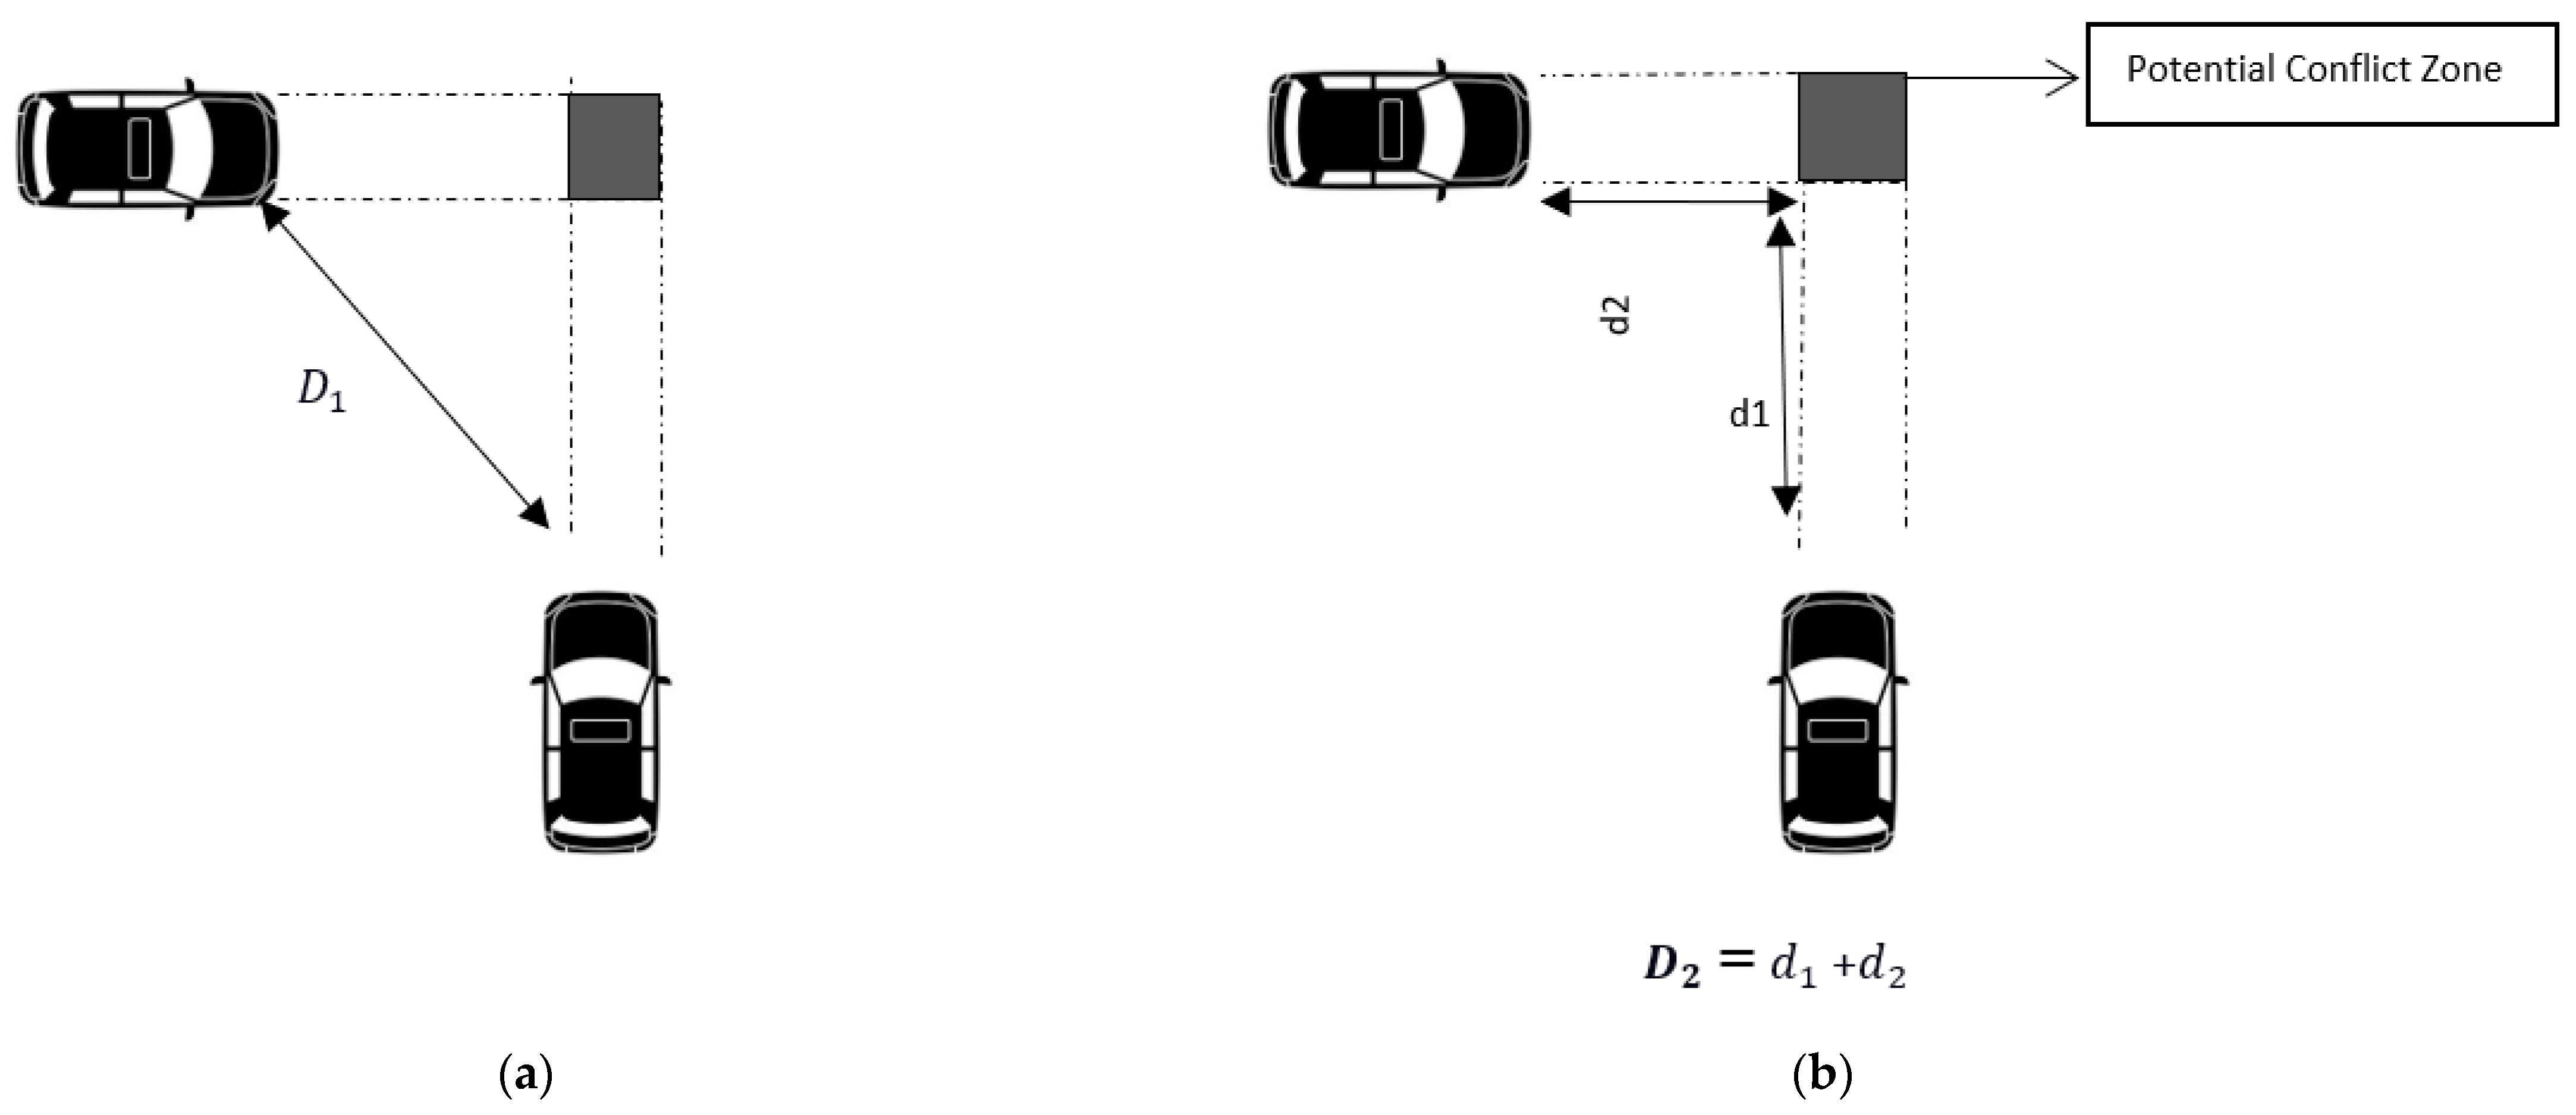
| Shortest distance (D1) | Euclidean distance (Shortest distance). |
| Sum of distance (D2) | The sum of distance travelled by the road users to reach the potential conflict area. |
| Post Encroachment time (PET) | The time interval between the first road user’s departure from the potential conflict area (who arrived there first) and the entry of the second road user [19]. |
| Deceleration rate (DR) | Deceleration rate of the road user. In cases of acceleration or no deceleration, DR is taken to be zero [40]. |
| Speed (V) | Speed of the vehicles involved in an interaction. |
| Gap Time (GT) | The time interval between the second vehicle arriving in the potential conflict area after the first vehicle leaving the conflict zone when both proceed at the same speed and trajectory [39]. |
5. Behavioral Analysis
Example
- (1)
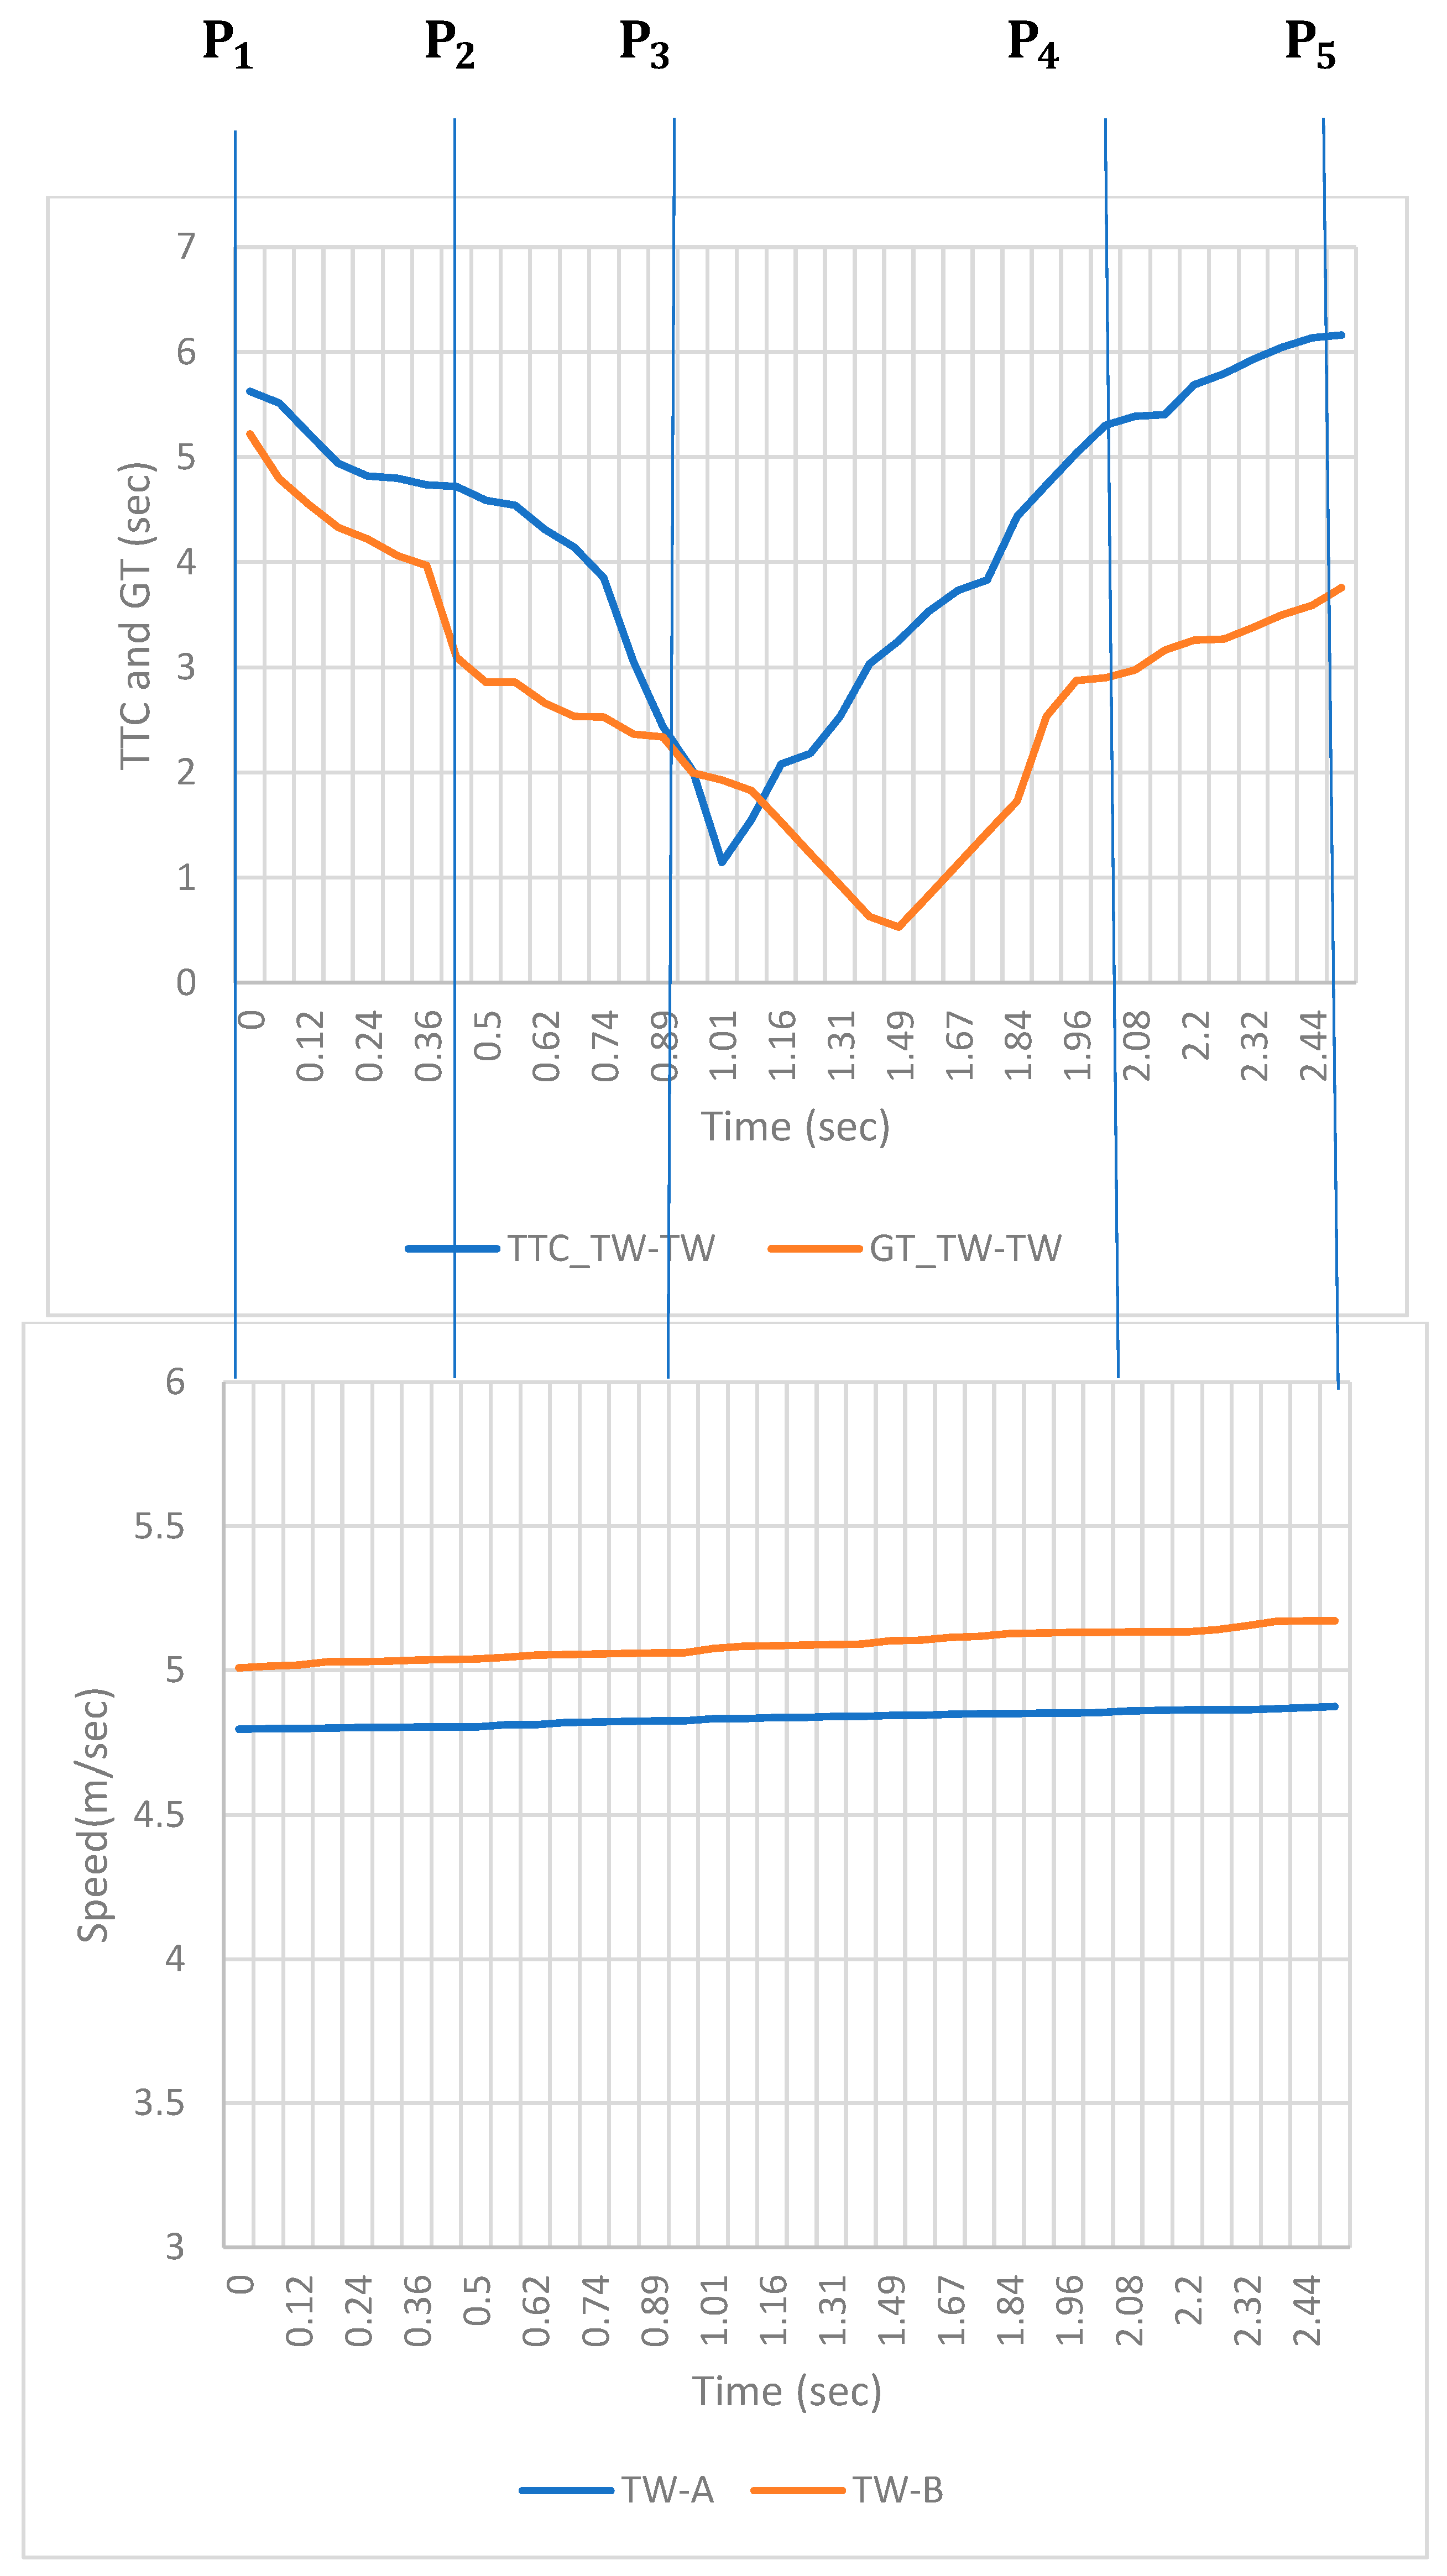
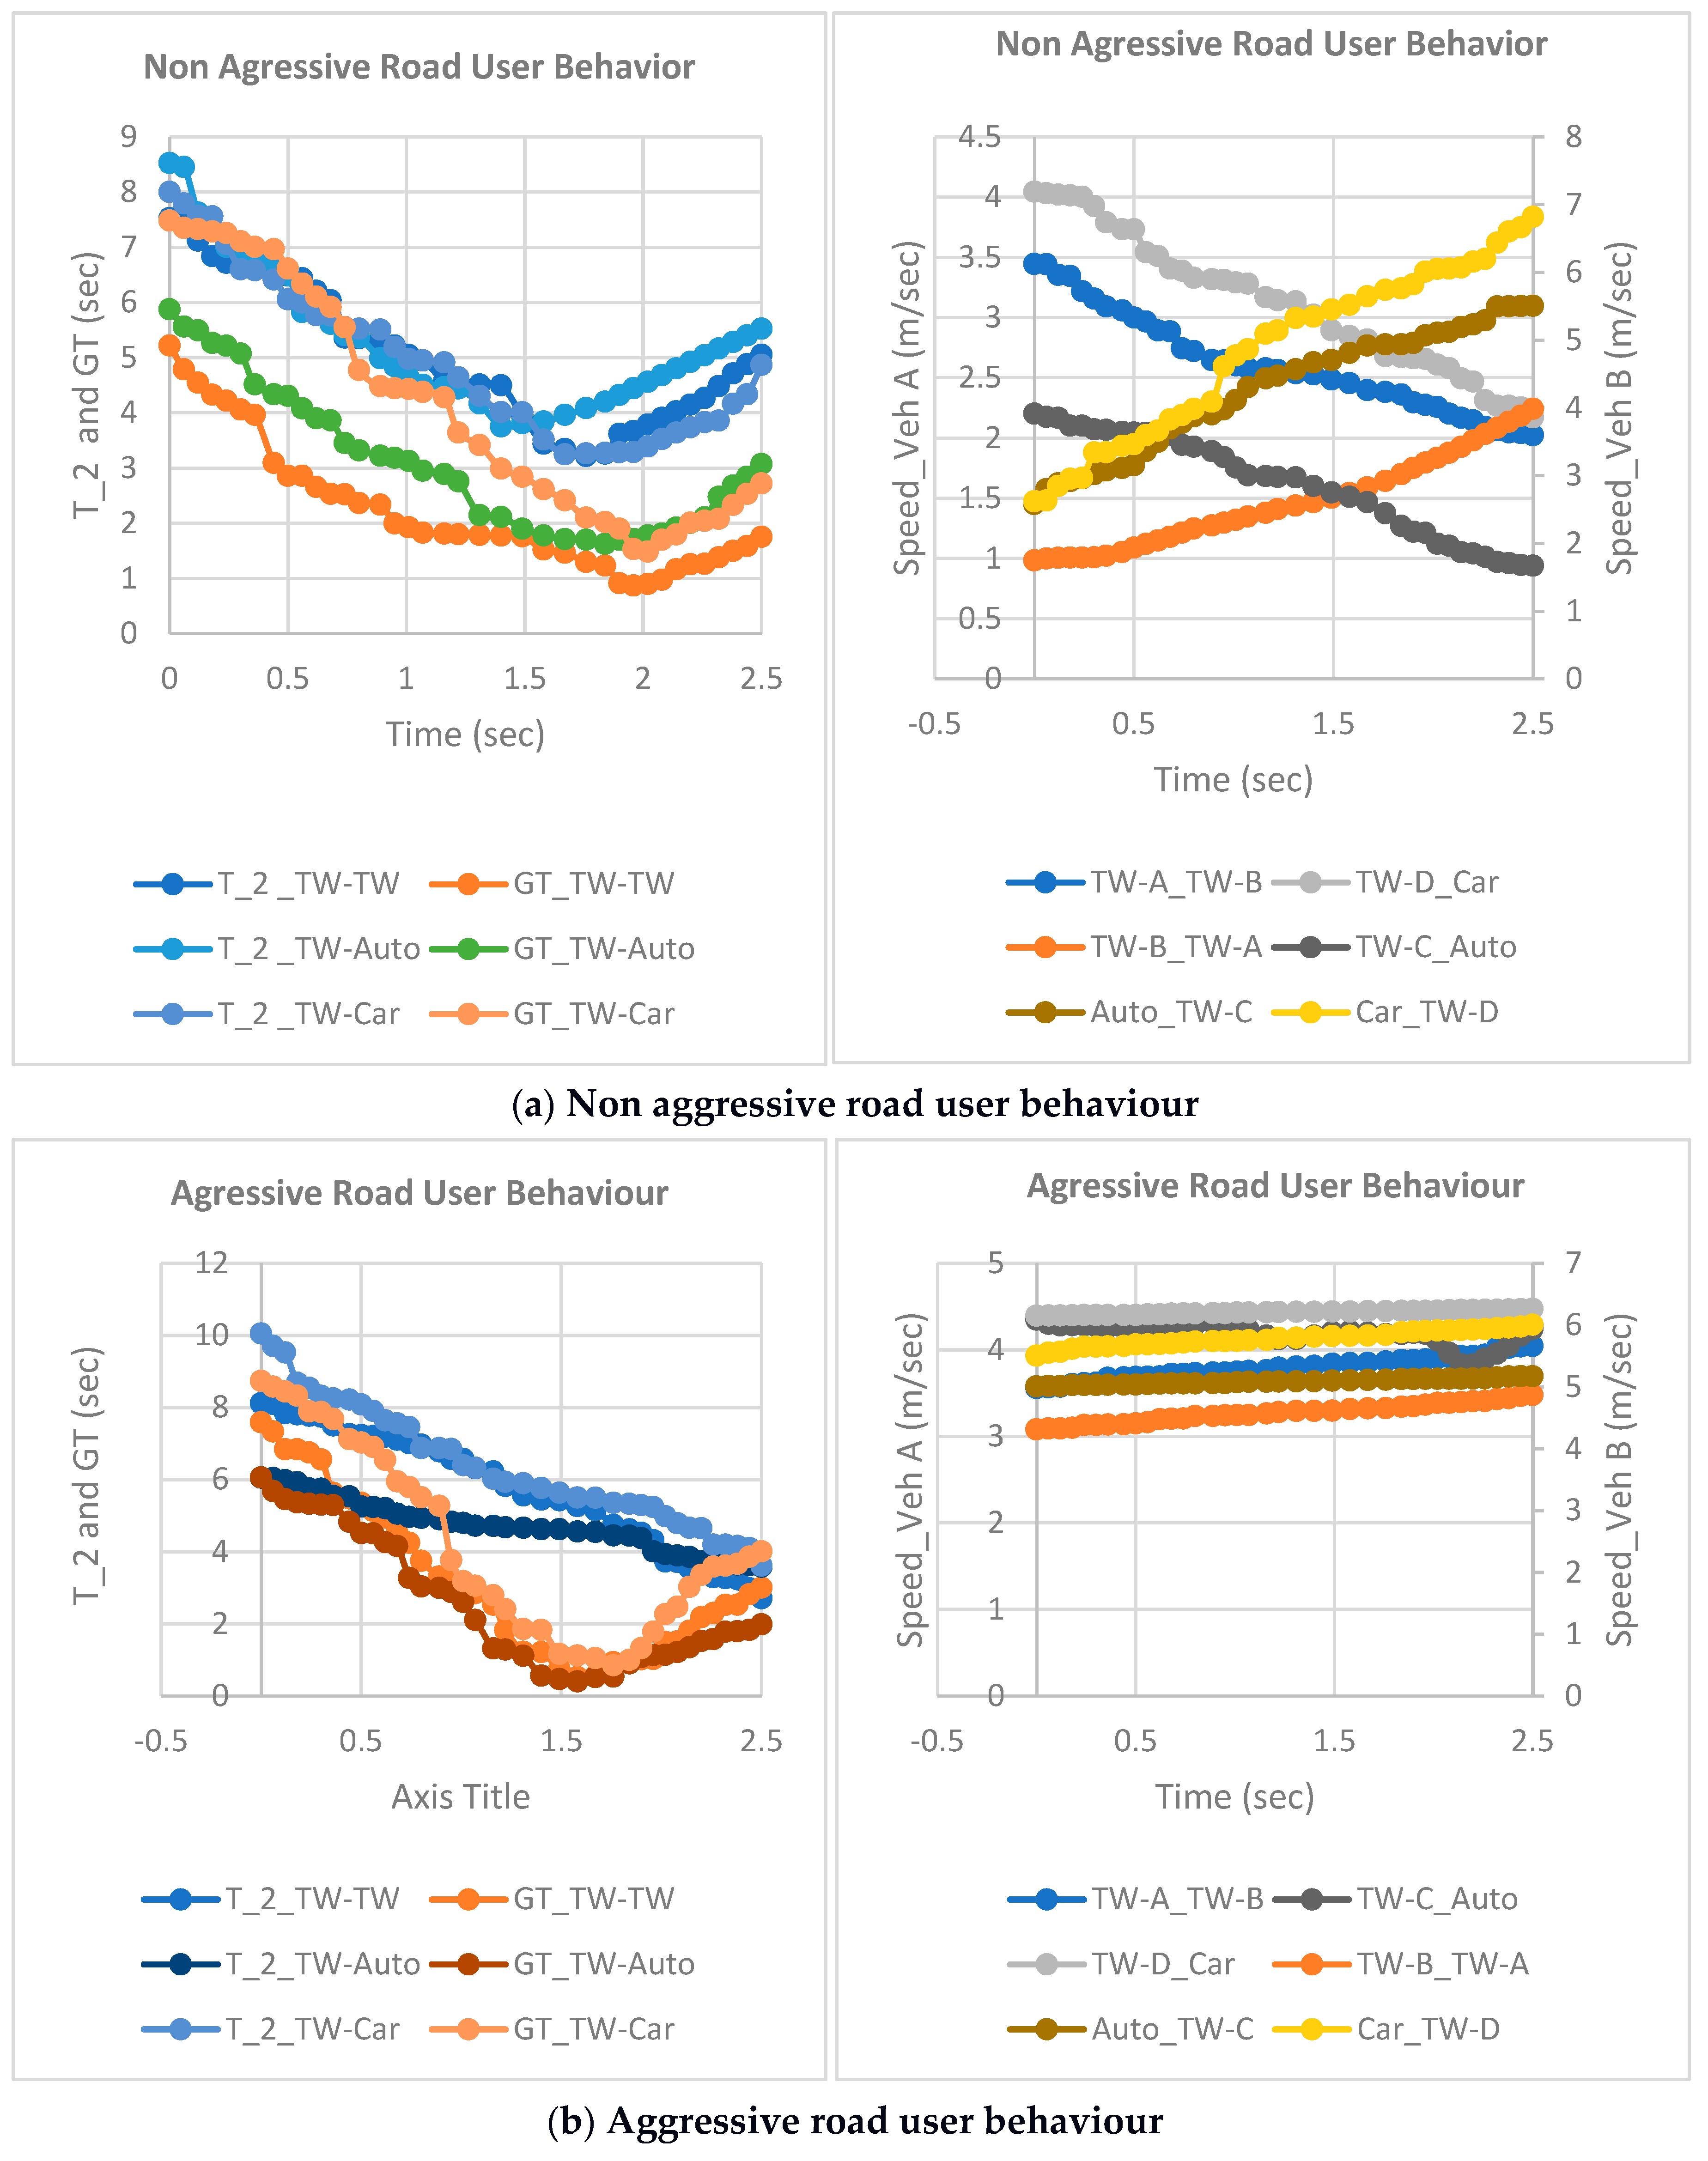
- Non-Aggressive interaction: When one or both vehicles take any evasive action, it can be categorized into receptive road user behavior (non-aggressive behavior). Upon analyzing the and GT profiles in Figure 5a, it is apparent that the vehicle interaction with various other vehicle categories generates a similar profile shape. The minimum values for both and GT occur towards the middle or end of the interactive process.The GT value starts to drop as two vehicles get closer to a potential conflict point until it hits its lowest value, which is close to zero, signalling that the two are most likely to arrive at the conflict point simultaneously. However, because of evasive action taken by the road user, the gap time started to increase again. The lowest value of GT can therefore be described as a risky point.In Figure 5a, when the speed profiles of different interactions were analyzed, it was observed that the speed profiles decreased over time. And, once it reached the minimum value, it started to increase again, indicating that one or both road users had taken significant measures to avoid a potential collision.Therefore, this behavior can be classified as a non-aggressive interaction as it involves an evasive action.
- (2)
- Aggressive interaction: In this type of interaction, it was observed that despite having low values for and GT, neither of the road users took any evasive action. As can be seen in the speed graphs in Figure 5b, the speed profiles are nearly horizontal with respect to time.As the vehicles approach the potential conflict point, the distance between them starts to decrease until one of the vehicles crosses the conflict point. Therefore, the riskiest point occurs near the end of the interaction. Hence, this behavior can be classified as an aggressive interaction that involved no evasive action, despite having a risk of collision. Also, when observing the trends of different vehicles, the and GT profiles are different.
6. Human Perception of Severity and Objective Measures
- (a)
- The First vehicle accelerates and/or alters trajectory to cross a conflict point before the second vehicle arrives;
- (b)
- The Second vehicle slows down, stops or changes trajectory to avoid a collision;
- (c)
- Both vehicles take evasive action, and one of the vehicles takes the lead and crosses a possible conflict zone before the second vehicle;
- (d)
- None of the vehicles take any evasive action.
- y = response variable;
- , ,… = explanatory variables;
- c = number of categories for response variable;
- cumulative probabilities for category.
- P (y > j) = probability that y is greater than j;
- = intercepts parameter;
- = parameters related to explanatory variable.
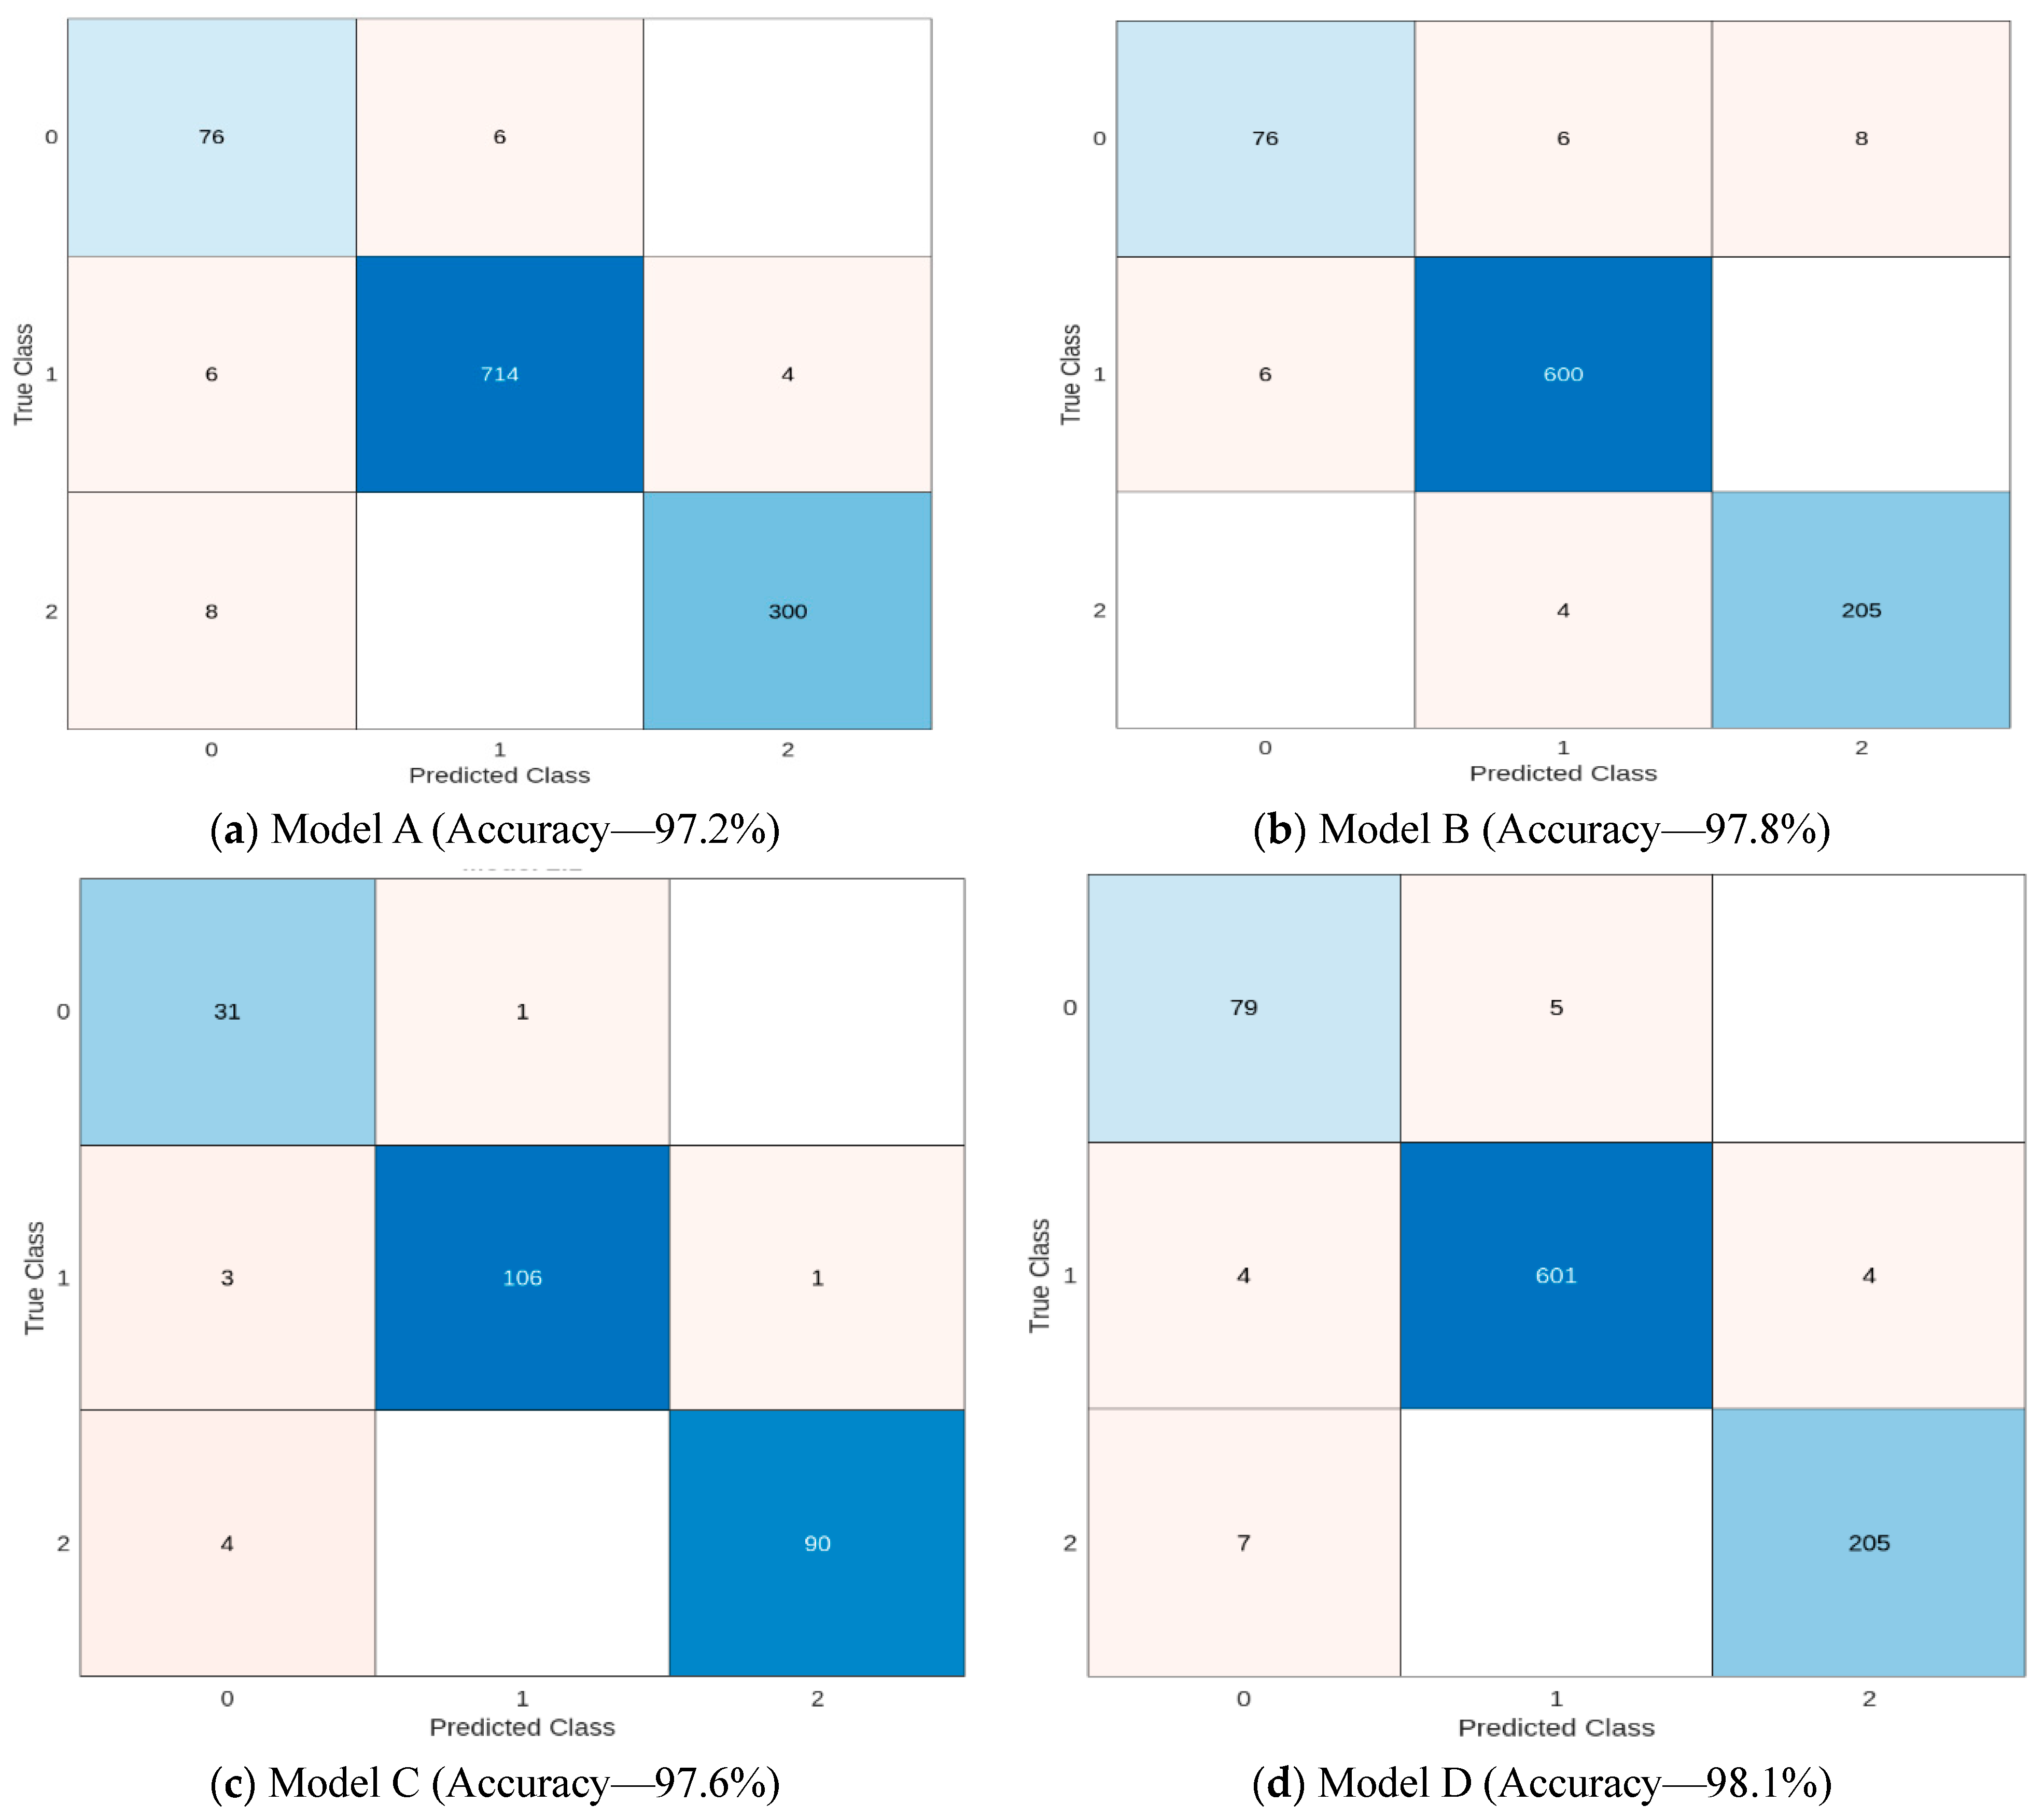
- At first, a logistic regression model (model A) was developed using the entire dataset (N = 1141), taking the human judgement of severity as a dependent variable and objective measures that could be estimated for every interaction in the dataset (excluding the indicators estimated at the moment of evasive action) as an independent variable. The aim was to determine if the presence of evasive actions held statistical significance in the model. The model can be represented as below:
- 2.
- The dataset was then divided into two subgroups: the first subset is where evasive action was observed in one or both road users during an interaction, and the second subset is where no evasive action was observed by either of the road users. Using these subsets of data, two more models (models B and C) were then developed using the same set of explanatory variables. The aim was to examine whether the same indicators were statistically associated with the human judgement of severity in both subsets. The models can be represented as below:
AIC = 2 × K − 2 × ln(l).
- K = number of parameters;
- N = number of observations;
- ln(l) = maximized value.
7. Discussion
8. Conclusions
- The first contribution of this research is informing researchers about the importance of evasive action involved in an interaction. It has been established that interactions involving evasive action are always risky; therefore, these interactions should always be studied to calculate the road safety of an uncontrolled intersection.
- Through an examination of road user behavior at uncontrolled intersections involving different types of vehicles, the study revealed that two-wheeler users tend to exhibit a higher degree of risk-taking behavior. Consequently, when developing and designing road infrastructure, it is essential to pay special attention to this group. Furthermore, specific training programs should be implemented to make them aware of the risks associated with such aggressive behaviors.
- As, at present in India, it is still not clear which surrogate indicators should be used for particular conflict types and which phase of the interaction is the most important for analyzing road safety, this study will be considered as a step to guide researchers about the surrogate indicators that are significant and which phase is the most crucial while calculating safety at an uncontrolled intersection. This will save the time-consuming process of indicator selection, data extraction and the modelling process for the researchers working in this field.
- Also, this study suggests that no individual indicator could adequately explain the perceived level of risk in an interaction. The results presented in this research indicate that the variables related to both proximity (time, distance) and the severity of the consequences (speed, deceleration rate) should be used while calculating the risk associated with uncontrolled intersections.
- The model developed in this study can be applied to cities with similar socio-economic and demographic characteristics. However, for cities with distinct profiles, it is crucial to validate this model, as indicated in the limitations section.
- Researchers are not required to compute surrogate indicators for every phase (i.e., preliminary, peak and end phases). As the primary phase contains the most critical information about the impending interaction, calculating surrogate measures during the initial phase will yield accurate safety results.
- Moreover, it may be prudent, during the modeling process, to confine the scope of the surrogate analysis to events that clearly involve evasive actions, excluding interactions without such actions. This approach can significantly reduce the time-consuming data extraction and modeling efforts for researchers.
Author Contributions
Funding
Informed Consent Statement
Data Availability Statement
Conflicts of Interest
Limitations and Future Scope
References
- Global Status Report on Road Safety 2018 Summary. Available online: https://apps.who.int/iris/bitstream/handle/10665/276462/9789241565684-eng.pdf (accessed on 15 June 2023).
- Ministry of Roads Transport and Highways. Available online: https://morth.nic.in/sites/default/files/Ministry%20Annual%20Report_2019-20.pdf (accessed on 20 July 2023).
- Alhajyaseen, W.K. The integration of conflict probability and severity for the safety assessment of intersections. Arab. J. Sci. Eng. 2015, 40, 421–430. [Google Scholar] [CrossRef]
- Shekhar Babu, S.; Vedagiri, P. Proactive safety evaluation of a multilane unsignalized intersection using surrogate measures. Transp. Lett. 2018, 10, 104–112. [Google Scholar] [CrossRef]
- Arun, A.; Haque, M.M.; Washington, S.; Sayed, T.; Mannering, F. A systematic review of traffic conflict-based safety measures with a focus on application context. Anal. Methods Accid. Res. 2021, 32, 100185. [Google Scholar] [CrossRef]
- Tarko, A.; Davis, G.; Saunier, N.; Sayed, T.; Washington, S. Surrogate measures of safety. In White Paper; Transportation Research Board: Washington, DC, USA, 2009. [Google Scholar]
- Pawar, D.S.; Patil, G.R. Minor-street vehicle dilemma while maneuvering at unsignalized intersections. J. Transp. Eng. Part A Syst. 2017, 143, 04017039. [Google Scholar] [CrossRef]
- Johnsson, C.; Laureshyn, A.; De Ceunynck, T. In search of surrogate safety indicators for vulnerable road users: A review of surrogate safety indicators. Transp. Rev. 2018, 38, 765–785. [Google Scholar] [CrossRef]
- J3016-2018; Taxonomy and Definitions for Terms Related to Driving Automation Systems for On-Road Motor Vehicles. Society of Automobile Engineers: Warrendale, PA, USA, 2018.
- Johansson, R. Vision Zero–Implementing a policy for traffic safety. Saf. Sci. 2009, 47, 826–831. [Google Scholar] [CrossRef]
- Yastremska-Kravchenko, O.; Laureshyn, A.; D’Agostino, C.; Varhelyi, A. What constitutes traffic event severity in terms of human danger perception? Transp. Res. Part F Traffic Psychol. Behav. 2022, 90, 22–34. [Google Scholar] [CrossRef]
- Velaga, N.R.; Kumar, A. Techno-economic evaluation of the feasibility of a smart street light system: A case study of rural India. Procedia-Soc. Behav. Sci. 2012, 62, 1220–1224. [Google Scholar] [CrossRef]
- Sumantri, V.N.; Rifai, A.I.; Ferial, F. Impact of inter-urban street lighting on users perception of road safety behavior: A Case of Jalan Majalengka-Rajagaluh. Citiz. J. Ilm. Multidisiplin. Indones. 2022, 2, 703–711. [Google Scholar]
- Galatanu, C.D.; Canale, L.; Zissis, G.; Gherasim, I. (Eds.) Measuring the driver exposure to the light pollution. In Light Pollution: Theory, Modelling, and Measurements; HAL: Lyon, France, 2017. [Google Scholar]
- Tarko, A.P. Surrogate measures of safety. In Safe Mobility: Challenges, Methodology and Solutions; Emerald Publishing Limited: Bradford, UK, 2018; Volume 11, pp. 383–405. [Google Scholar]
- Åberg, L. Trafiksäkerhet, en Kunskapsöversikt; Studentlitteratur: Lund, Sweden, 1998; pp. 44–91. [Google Scholar]
- Svensson, Å.; Hydén, C. Estimating the severity of safety related behaviour. Accid. Anal. Prev. 2006, 38, 379–385. [Google Scholar] [CrossRef]
- Hayward, J. Near Misses as a Measure of Safety at Urban Intersections; Pennsylvania Transportation and Traffic Safety Center: Warrendale, PA, USA, 1971.
- Allen, B.L.; Shin, B.T.; Cooper, P.J. Analysis of Traffic Conflicts and Collisions; National Academy of Sciences: Washington, DC, USA, 1978; ISBN 0361-1981. [Google Scholar]
- Laureshyn, A.; Johnsson, C.; De Ceunynck, T.; Svensson, Å.; de Goede, M.; Saunier, N.; Włodarek, P.; van der Horst, R.; Daniels, S. Review of Current Study Methods for VRU Safety. Appendix 6—Scoping Review: Surrogate Measures of Safety in Site-Based Road Traffic Observations: Deliverable 2.1—Part 4; InDeV, Horizon 2020 Project: Brussels, Belgium, 2016. [Google Scholar]
- Laureshyn, A.; Várhelyi, A. The Swedish Traffic Conflict Technique-Observer’s Manual; Lund University: Lund, Sweden, 2018. [Google Scholar]
- Hydén, C. The Development of a Method for Traffic Safety Evaluation: The Swedish Traffic Conflicts Technique; Bulletin Lund Institute of Technology, Department of Traffic Planning and Engineering: Lund, Sweden, 1987. [Google Scholar]
- Kraay, J.; Van Der Horst, A.; Oppe, S. Manual Conflict Observation Technique DOCTOR (Dutch Objective Conflict Technique for Operation and Research); Foundation Road Safety for All: Voorburg, The Netherlands, 2013. [Google Scholar]
- Kraay, J.; Van der Horst, A. A Diagnosis of Road Safety Using the Dutch Conflict Observation Technique DOCTOR; Institute for Road Safety Research SWOV: Leidschendam, The Netherlands, 1985. [Google Scholar]
- Lightburn, A.; Howarth, C. A study of observer variability and reliability in the detection and grading of traffic conflicts. In Proceedings of the Second International Traffic Conflicts Technique Workshop, Paris, France, 10–12 May 1979; pp. 10–12. [Google Scholar]
- Van der Horst, A. The ICTCT Calibration Study at Malmoe: A Quantitative Analysis of Video Recording; National Academy of Sciences: Washington, DC, USA, 1984. [Google Scholar]
- Saul, H.; Junghans, M.; Dotzauer, M.; Gimm, K. Online risk estimation of critical and non-critical interactions between right-turning motorists and crossing cyclists by a decision tree. Accid. Anal. Prev. 2021, 163, 106449. [Google Scholar] [CrossRef] [PubMed]
- Ismail, K.; Sayed, T.; Saunier, N. Methodologies for aggregating indicators of traffic conflict. Transp. Res. Rec. 2011, 2237, 10–19. [Google Scholar] [CrossRef]
- Kaparias, I.; Bell, M.G.; Greensted, J.; Cheng, S.; Miri, A.; Taylor, C.; Mount, B. Development and implementation of a vehicle–pedestrian conflict analysis method: Adaptation of a vehicle–vehicle technique. Transp. Res. Rec. 2010, 2198, 75–82. [Google Scholar] [CrossRef]
- Laureshyn, A.; Svensson, Å.; Hydén, C. Evaluation of traffic safety, based on micro-level behavioural data: Theoretical framework and first implementation. Accid. Anal. Prev. 2010, 42, 1637–1646. [Google Scholar] [CrossRef] [PubMed]
- Salamati, K.; Schroeder, B.; Rouphail, N.M.; Cunningham, C.; Long, R.; Barlow, J. Development and implementation of conflict-based assessment of pedestrian safety to evaluate accessibility of complex intersections. Transp. Res. Rec. 2011, 2264, 148–155. [Google Scholar] [CrossRef] [PubMed]
- Ni, Y.; Wang, M.; Sun, J.; Li, K. Evaluation of pedestrian safety at intersections: A theoretical framework based on pedestrian-vehicle interaction patterns. Accid. Anal. Prev. 2016, 96, 118–129. [Google Scholar] [CrossRef]
- Kathuria, A.; Vedagiri, P. Evaluating pedestrian vehicle interaction dynamics at un-signalized intersections: A proactive approach for safety analysis. Accid. Anal. Prev. 2020, 134, 105316. [Google Scholar] [CrossRef]
- Ismail, K.; Sayed, T.; Saunier, N. Automated analysis of pedestrian–vehicle conflicts: Context for before-and-after studies. Transp. Res. Rec. 2010, 2198, 52–64. [Google Scholar] [CrossRef]
- Landis, J.R.; Koch, G.G. The measurement of observer agreement for categorical data. Biometrics 1977, 33, 159–174. [Google Scholar] [CrossRef]
- Puig-Diví, A.; Padullés-Riu, J.M.; Busquets-Faciaben, A.; Padullés-Chando, X.; Escalona-Marfil, C.; Marcos-Ruiz, D. Validity and reliability of the kinovea program in obtaining angular and distance dimensions. Preprints 2017, 2017100042. [Google Scholar] [CrossRef]
- Puig-Diví, A.; Escalona-Marfil, C.; Padullés-Riu, J.M.; Busquets, A.; Padulles-Chando, X.; Marcos-Ruiz, D. Validity and reliability of the Kinovea program in obtaining angles and distances using coordinates in 4 perspectives. PLoS ONE 2019, 14, e0216448. [Google Scholar] [CrossRef] [PubMed]
- Patterson, F.L.-H. The Adverse Effects of Paradigm and Pragmatism on Road Safety with Case Studies in Traffic Conflicts Technique and Cyclist Safety at Roundabouts. Ph.D. Thesis, University of Adelaide, Adelaide, Australia, 2021. [Google Scholar]
- Vogel, K. What characterizes a “free vehicle” in an urban area? Transp. Res. Part F Traffic Psychol. Behav. 2002, 5, 15–29. [Google Scholar] [CrossRef]
- Gettman, D.; Pu, L.; Sayed, T.; Shelby, S.G.; Energy, S. Surrogate Safety Assessment Model and Validation; Turner-Fairbank Highway Research Center: McLean, VA, USA, 2008.
- Cronbach, L.J. Coefficient alpha and the internal structure of tests. Psychometrika 1951, 16, 297–334. [Google Scholar] [CrossRef]
- Tavakol, M.; Dennick, R. Making sense of Cronbach’s alpha. Int. J. Med. Educ. 2011, 2, 53. [Google Scholar] [CrossRef]
- Cho, E. A comprehensive review of so-called Cronbach’s alpha. J. Prod. Res. 2020, 38, 9–20. [Google Scholar]
- Basu, S.; Vasudevan, V. Effect of bicycle friendly roadway infrastructure on bicycling activities in urban India. Procedia-Soc. Behav. Sci. 2013, 104, 1139–1148. [Google Scholar] [CrossRef]
- Cavanaugh, J.E.; Neath, A.A. The Akaike information criterion: Background, derivation, properties, application, interpretation, and refinements. Wiley Interdiscip. Rev. Comput. Stat. 2019, 11, e1460. [Google Scholar] [CrossRef]
- Kruysse, H.W. The subjective evaluation of traffic conflicts based on an internal concept of dangerousness. Accid. Anal. Prev. 1991, 23, 53–65. [Google Scholar] [CrossRef]

| Name of Site and Location ID | Image | City | Traffic Volume (Vehicles in Two Hour) |
|---|---|---|---|
| Nandanvan Square | 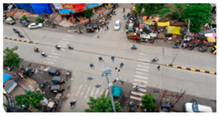 | Nagpur | 5358 |
| Coffee House Square | 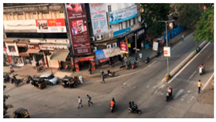 | Nagpur | 4567 |
| Bhim Square | 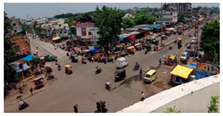 | Nagpur | 6129 |
| Ambedkar Square | 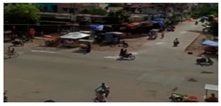 | Nagpur | 4782 |
| MVP Square | 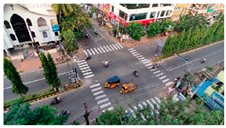 | Visakhapatnam | 4843 |
| Kailash Nagar Square | 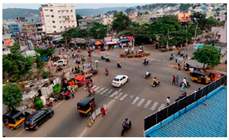 | Visakhapatnam | 5631 |
| Vehicle Involved | Non-Aggressive Road User Behavior | Aggressive Road User Behavior |
|---|---|---|
| Two-wheeler–Two-wheeler | 324 | 156 |
| Two-wheeler–car | 465 | 54 |
| Two-wheeler–Auto | 116 | 26 |
| Total | 905 | 236 |
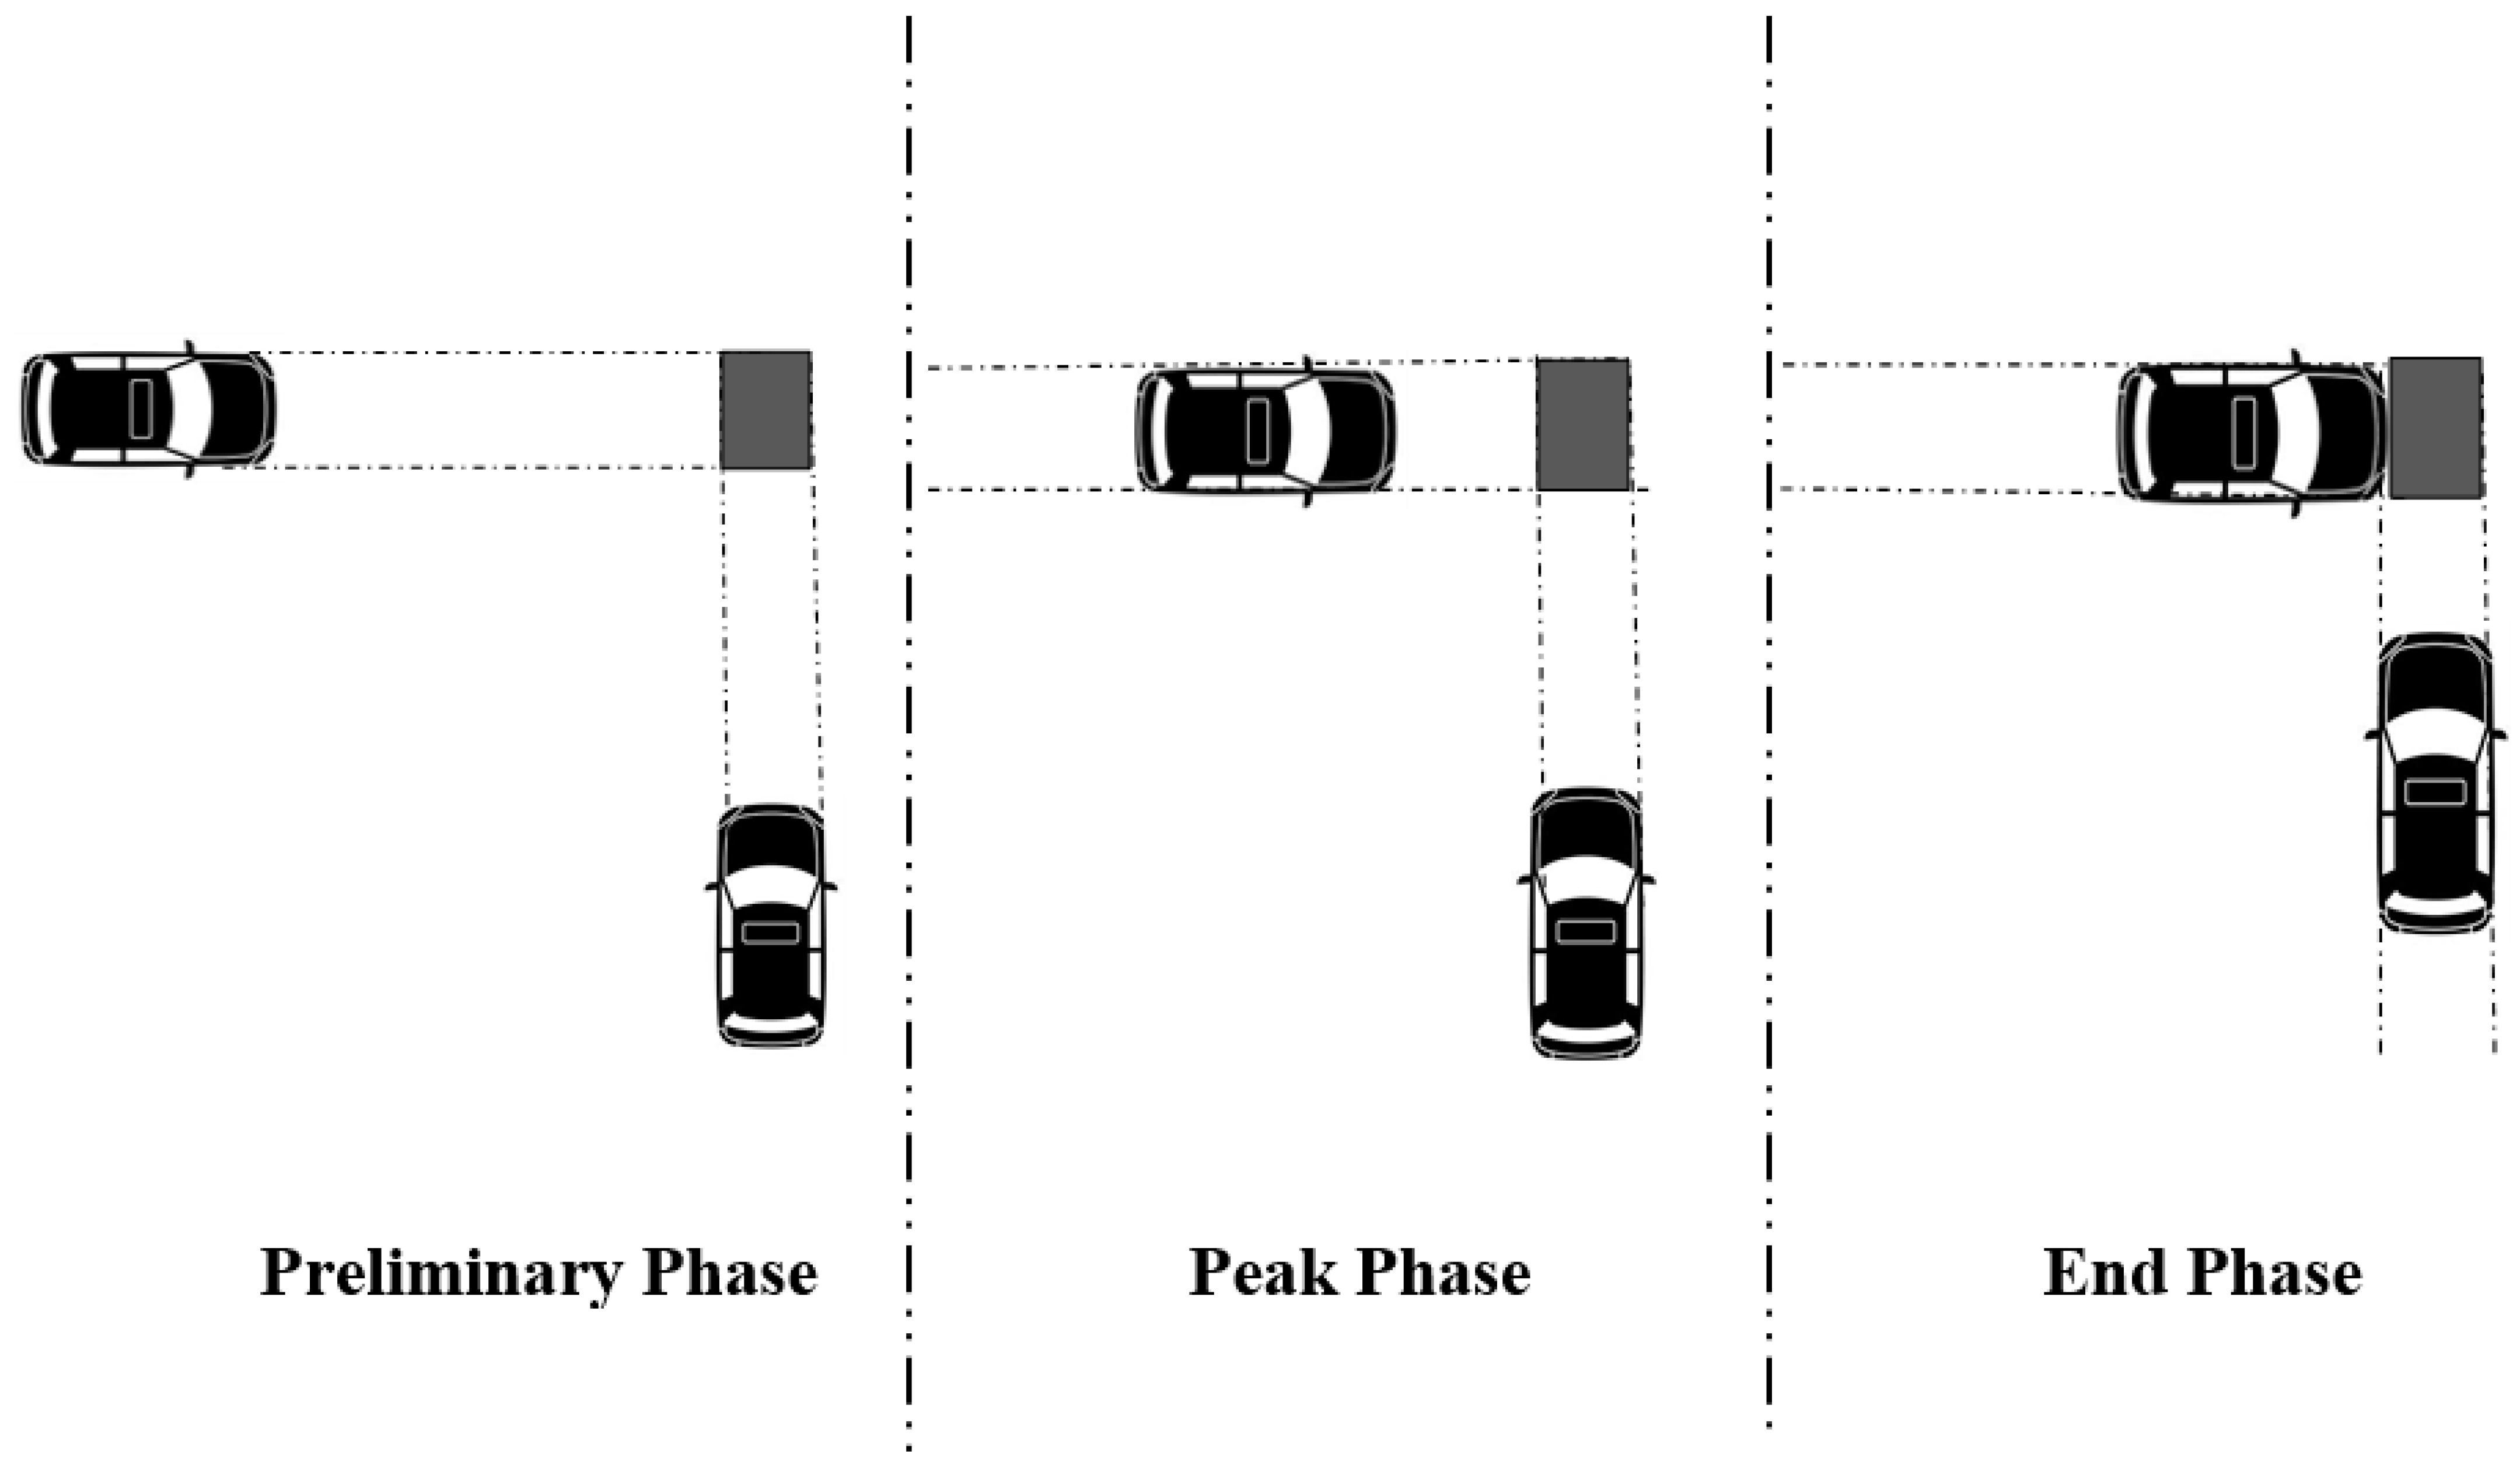
| Phase | Definition | Time Instance Notation | Indicators | Included in the Model |
|---|---|---|---|---|
| Preliminary Stage | The moment when first evasive action was taken. | EA | EA, , , V | D |
| Peak Stage | The point in time when T2 reaches its lowest value in the event. | , , V, , | A, B, C, D | |
| When the travel-to-collision-point distance of each road user reaches its minimum value during the interaction. | , , V, , | A, B, C, D | ||
| End stage | The point in time when the first road user arrives at the potential conflict zone. | , , V, , | A, B, C, D | |
| The point in time when the second road user reaches the potential collision zone. | PET | A, B, C, D |
| Parameter | B | Std. Error | Hypothesis Test | Elasticity (Individual Percentage Contribution) | |||
|---|---|---|---|---|---|---|---|
| Wald Chi-Square | df | Sig. | |||||
| Threshold | [Severity = 2.00] | −10.200 | 1.0010 | 103.833 | 1 | 0.000 | |
| [Severity = 1.00] | −0.294 | 0.9813 | 0.090 | 1 | 0.764 | ||
| () | −0.570 | 0.1037 | 30.256 | 1 | 0.000 | −0.205 | |
| () | −0.473 | 0.1184 | 15.953 | 1 | 0.000 | −0.1822 | |
| () | −2.888 | 0.4982 | 33.602 | 1 | 0.000 | −0.3514 | |
| () | −0.408 | 0.0932 | 19.186 | 1 | 0.000 | −0.1982 | |
| V () | 0.334 | 0.0890 | 14.090 | 1 | 0.000 | 0.213 | |
| () | −0.333 | 0.0946 | 12.391 | 1 | 0.000 | −0.111 | |
| PET () | −0.877 | 0.3843 | 5.212 | 1 | 0.002 | −0.197 | |
| EA | 1.143 | 0.2880 | 15.747 | 1 | 0.000 | 0.2429 | |
| AIC = 624 BIC = 792 | |||||||
| Parameter | B | Std. Error | Hypothesis Test | Elasticity (Individual Percentage Contribution) | |||
|---|---|---|---|---|---|---|---|
| Wald Chi-Square | df | Sig. | |||||
| Threshold | [Severity = 2.00] | −22.792 | 0.8587 | 704.498 | 1 | 0.000 | |
| [Severity = 1.00] | −9.885 | 0.4568 | 468.193 | 1 | 0.000 | ||
| () | −0.789 | 0.1154 | 46.717 | 1 | 0.000 | −0.169 | |
| () | −0.263 | 0.0981 | 7.215 | 1 | 0.004 | −0.098 | |
| () | −8.486 | 0.7121 | 141.991 | 1 | 0.000 | −0.328 | |
| PET () | −1.591 | 0.2867 | 30.785 | 1 | 0.000 | −0.182 | |
| AIC = 396 BIC = 512 | |||||||
| Parameter | B | Std. Error | Hypothesis Test | Elasticity | |||
|---|---|---|---|---|---|---|---|
| Wald Chi-Square | df | Sig. | |||||
| Threshold | [Severity = 2.00] | −23.233 | 3.7402 | 38.585 | 1 | 0.000 | |
| [Severity = 1.00] | −13.391 | 2.7741 | 23.300 | 1 | 0.000 | ||
| () | −1.394 | 0.3234 | 18.569 | 1 | 0.000 | −0.149 | |
| () | −8.183 | 1.6187 | 25.555 | 1 | 0.000 | −0.374 | |
| () | −2.949 | 0.5994 | 24.214 | 1 | 0.000 | −0.114 | |
| PET () | −4.059 | 1.4477 | 7.860 | 1 | 0.000 | −0.208 | |
| AIC = 116 BIC = 160 | |||||||
| Parameter | B | Std. Error | Hypothesis Test | Elasticity | |||
|---|---|---|---|---|---|---|---|
| Wald Chi-Square | df | Sig. | |||||
| Threshold | [Severity = 2.00] | −93.998 | 5.7783 | 264.627 | 1 | 0.000 | |
| [Severity = 1.00] | −48.870 | 3.1290 | 243.936 | 1 | 0.000 | ||
| () | −2.129 | 0.2511 | 71.917 | 1 | 0.000 | −0.138 | |
| PET () | −0.410 | 0.0508 | 65.161 | 1 | 0.000 | −0.210 | |
| (EA) | −15.616 | 1.6684 | 87.601 | 1 | 0.000 | −0.397 | |
| (EA) | −2.071 | 0.2397 | 74.689 | 1 | 0.000 | −0.134 | |
| (EA) | −2.171 | 0.3411 | 40.504 | 1 | 0.000 | −0.037 | |
| AIC = 213 BIC = 356 | |||||||
Disclaimer/Publisher’s Note: The statements, opinions and data contained in all publications are solely those of the individual author(s) and contributor(s) and not of MDPI and/or the editor(s). MDPI and/or the editor(s) disclaim responsibility for any injury to people or property resulting from any ideas, methods, instructions or products referred to in the content. |
© 2023 by the authors. Licensee MDPI, Basel, Switzerland. This article is an open access article distributed under the terms and conditions of the Creative Commons Attribution (CC BY) license (https://creativecommons.org/licenses/by/4.0/).
Share and Cite
Diwakar, P.; Landge, V.S.; Jain, U. Evaluating the Relationship between Surrogate Safety Measures and Traffic Event Severity in Terms of Human Perception of Danger: A Perspective under Indian Traffic Conditions. Appl. Sci. 2023, 13, 12100. https://doi.org/10.3390/app132212100
Diwakar P, Landge VS, Jain U. Evaluating the Relationship between Surrogate Safety Measures and Traffic Event Severity in Terms of Human Perception of Danger: A Perspective under Indian Traffic Conditions. Applied Sciences. 2023; 13(22):12100. https://doi.org/10.3390/app132212100
Chicago/Turabian StyleDiwakar, Priyanka, Vishrut S. Landge, and Udit Jain. 2023. "Evaluating the Relationship between Surrogate Safety Measures and Traffic Event Severity in Terms of Human Perception of Danger: A Perspective under Indian Traffic Conditions" Applied Sciences 13, no. 22: 12100. https://doi.org/10.3390/app132212100
APA StyleDiwakar, P., Landge, V. S., & Jain, U. (2023). Evaluating the Relationship between Surrogate Safety Measures and Traffic Event Severity in Terms of Human Perception of Danger: A Perspective under Indian Traffic Conditions. Applied Sciences, 13(22), 12100. https://doi.org/10.3390/app132212100