Abstract
This study investigates the natural passivation process of two types of stainless steels (AISI 316 and AISI 304) and a nickel-based alloy (Inconel 600) as a function of immersion time in an alkaline medium. As shown by Atomic Force Microscopy (AFM), the oxide film growth on each substrate is only influenced by trenches formed during the polishing step and does not depend on the chemical composition. The evolution of EIS measurements is explained by this growth mode. After 3 days of immersion, the formed film constitutes a protective barrier against alloy dissolution, as shown by Scanning Kelvin Probe Microscopy (SKPFM).
1. Introduction
The discovery of reinforced concrete at the end of the 19th century allowed the civil engineering field to make remarkable advances. Indeed, it made it possible to achieve more complex structures and increase their lifetime, thanks to the fact that the steel embedded in concrete is surfaced with a passive film, which will protect it against corrosive agents. The passive film is the result of the interactions between the steel and its direct environment. For example, the exposure of iron and steel to an alkaline environment promotes the formation of a protective passive film [1,2,3,4,5,6,7]. However, several factors such as humidity, temperature [3,8], pH and halogens like chloride ions lead to the destruction of the passive films, reducing the lifetime of reinforced concrete structures. Since the physical and electrochemical properties of a passive film depend mainly on both the environment (temperature, pressure, and pH) and the chemical composition of the steel [9,10], the replacement of standard steel by more resistant alloys became crucial during the 20th century. Among these alloys, types of stainless steel invented by Monnartz [11] have the ability to form passive films that will occur by very complex training processes not fully understood and are subject to many controversies. Nevertheless, stainless steel remains a good solution for engineering purposes instead of traditional carbon steel [10] and continues to be a subject of research. Recently, it has been shown that the industrial water pollutant named Red Mud (RM) had positive effects on the corrosion resistance of steel in concrete, which was more pronounced in the presence of chlorides, offering a promising new way for the cement industry to reduce their environmental impact [12]. Moreover, other alloys, such as nickel-based alloys [13], have been developed for various application fields. Nickel-based alloys are used for equipping chemical and nuclear power plants, especially steam generators in pressurized water reactors (PWR). However, the literature is less abundant on nickel-based alloys exposed to very alkaline media at room temperature, which is why we studied it specifically in a previous paper [14]. In this paper, we compare the behavior of Inconel 600 with that of stainless steel.
In an alkaline medium, films formed on pure iron show the presence of magnetite Fe3O4, which oxidizes into hematite Fe2O3 [15,16]. Other investigations have also been conducted on Fe-Cr alloys and revealed the presence of Cr (III) oxy-hydroxide in the inner layer of the passive film [17,18]. In the case of stainless steel, it has been demonstrated that the protective oxide film has a bilayer structure: an outer layer very enriched in iron oxide and hydroxide in contact with the electrolyte and an internal layer enriched with chromium oxide in contact with the alloy [19,20]. Both layers forming the electrical equivalent of an n–p junction behaved like a diode, stopping the future diffusion of corrosive chemical species and thus forming an effective protection layer against corrosion [21]. Given these properties, stainless steel is more reliable for the construction of complex structures in hostile environments.
In recent decades, electrochemical impedance spectroscopy (EIS) has been one of the most widely used techniques to identify the different processes occurring during the growth of passive films [10,22,23,24,25,26]. This non-destructive technique makes it possible to simulate the behavior of a given system (metal, film, and solution) by an equivalent electrical circuit (EEC) without altering the composition and structure of the studied films. The components of the EEC (resistances, capacitors, etc.) correspond to the different processes (double electric layer, adsorption, oxidation–reduction reactions, etc.) taking place at the electrode–electrolyte interface. According to Macdonald [27], the obtained circuit is not a model but an analogy because the same experimental data can be expressed in different equivalent circuits and, therefore, need to be adjusted carefully to correspond to a physical reality.
Local near-field imaging techniques like Atomic Force Microscopy (AFM) and Scanning Kelvin Probe Force Microscopy (SKPFM) allow for the observation of surface inhomogeneities at a nanometric scale. For example, it can reveal the localization of porosity areas on the film or local passivity breaks, which make the material subject to corrosion. L. Veleva et al. [28] studied passive films formed by cyclic voltammetry on AISI 316 in solutions of Ca(OH)2 and cement extract by AFM. They observed by AFM a morphology difference between the films obtained: the film formed in saturated Ca(OH)2 was rough, crystalline and non-homogeneous, whereas the passive layer formed in the cement extract solution was homogeneous and completely covered the metal surface. More recently, in 2017, Y. Li et al. [29] studied the growth of passive films on carbon steel by EIS and confirmed these results with AFM measurements. Therefore, we also decided to correlate the resistance of passive films formed on Ni-based alloys (Inconel) and stainless steel with its surface topography to better understand the passivation process.
In the present study, we started by investigating films formed by cyclic voltammetry (CV) on AISI 304 and AISI 316 types of stainless steel and Inconel 600, a nickel-based alloy. In the first part of this work, we use EIS to determine how to obtain the most protective films in an alkaline solution at pH = 13. The selected solution and pH simulate the environment of reinforced concrete, as demonstrated in reference [9]. In the second part of this work, we study the evolution of spontaneously formed films on two stainless steels (AISI 304 and AISI 316) and a nickel-based alloy (Inconel 600) as a function of immersion time. We use AFM microscopy to provide additional information on the growth of passive films and to understand the EIS results. We only focused on the spontaneous formation of films in order to better simulate the actual conditions of use of these materials since CV modifies the chemical composition of the outer layer and its thickness. We notice that all the materials could be simulated by the same equivalent electric circuit, indicating that the passivation process is approximately the same whatever the substrate is as shown also by AFM.
2. Materials and Methods
2.1. Materials
In this work, two types of stainless steel and nickel-based alloy were provided by Goodfellow; their chemical composition is given in Table 1.

Table 1.
Chemical composition of two types of stainless steel (AISI 304 and AISI 316) and Inconel 600.
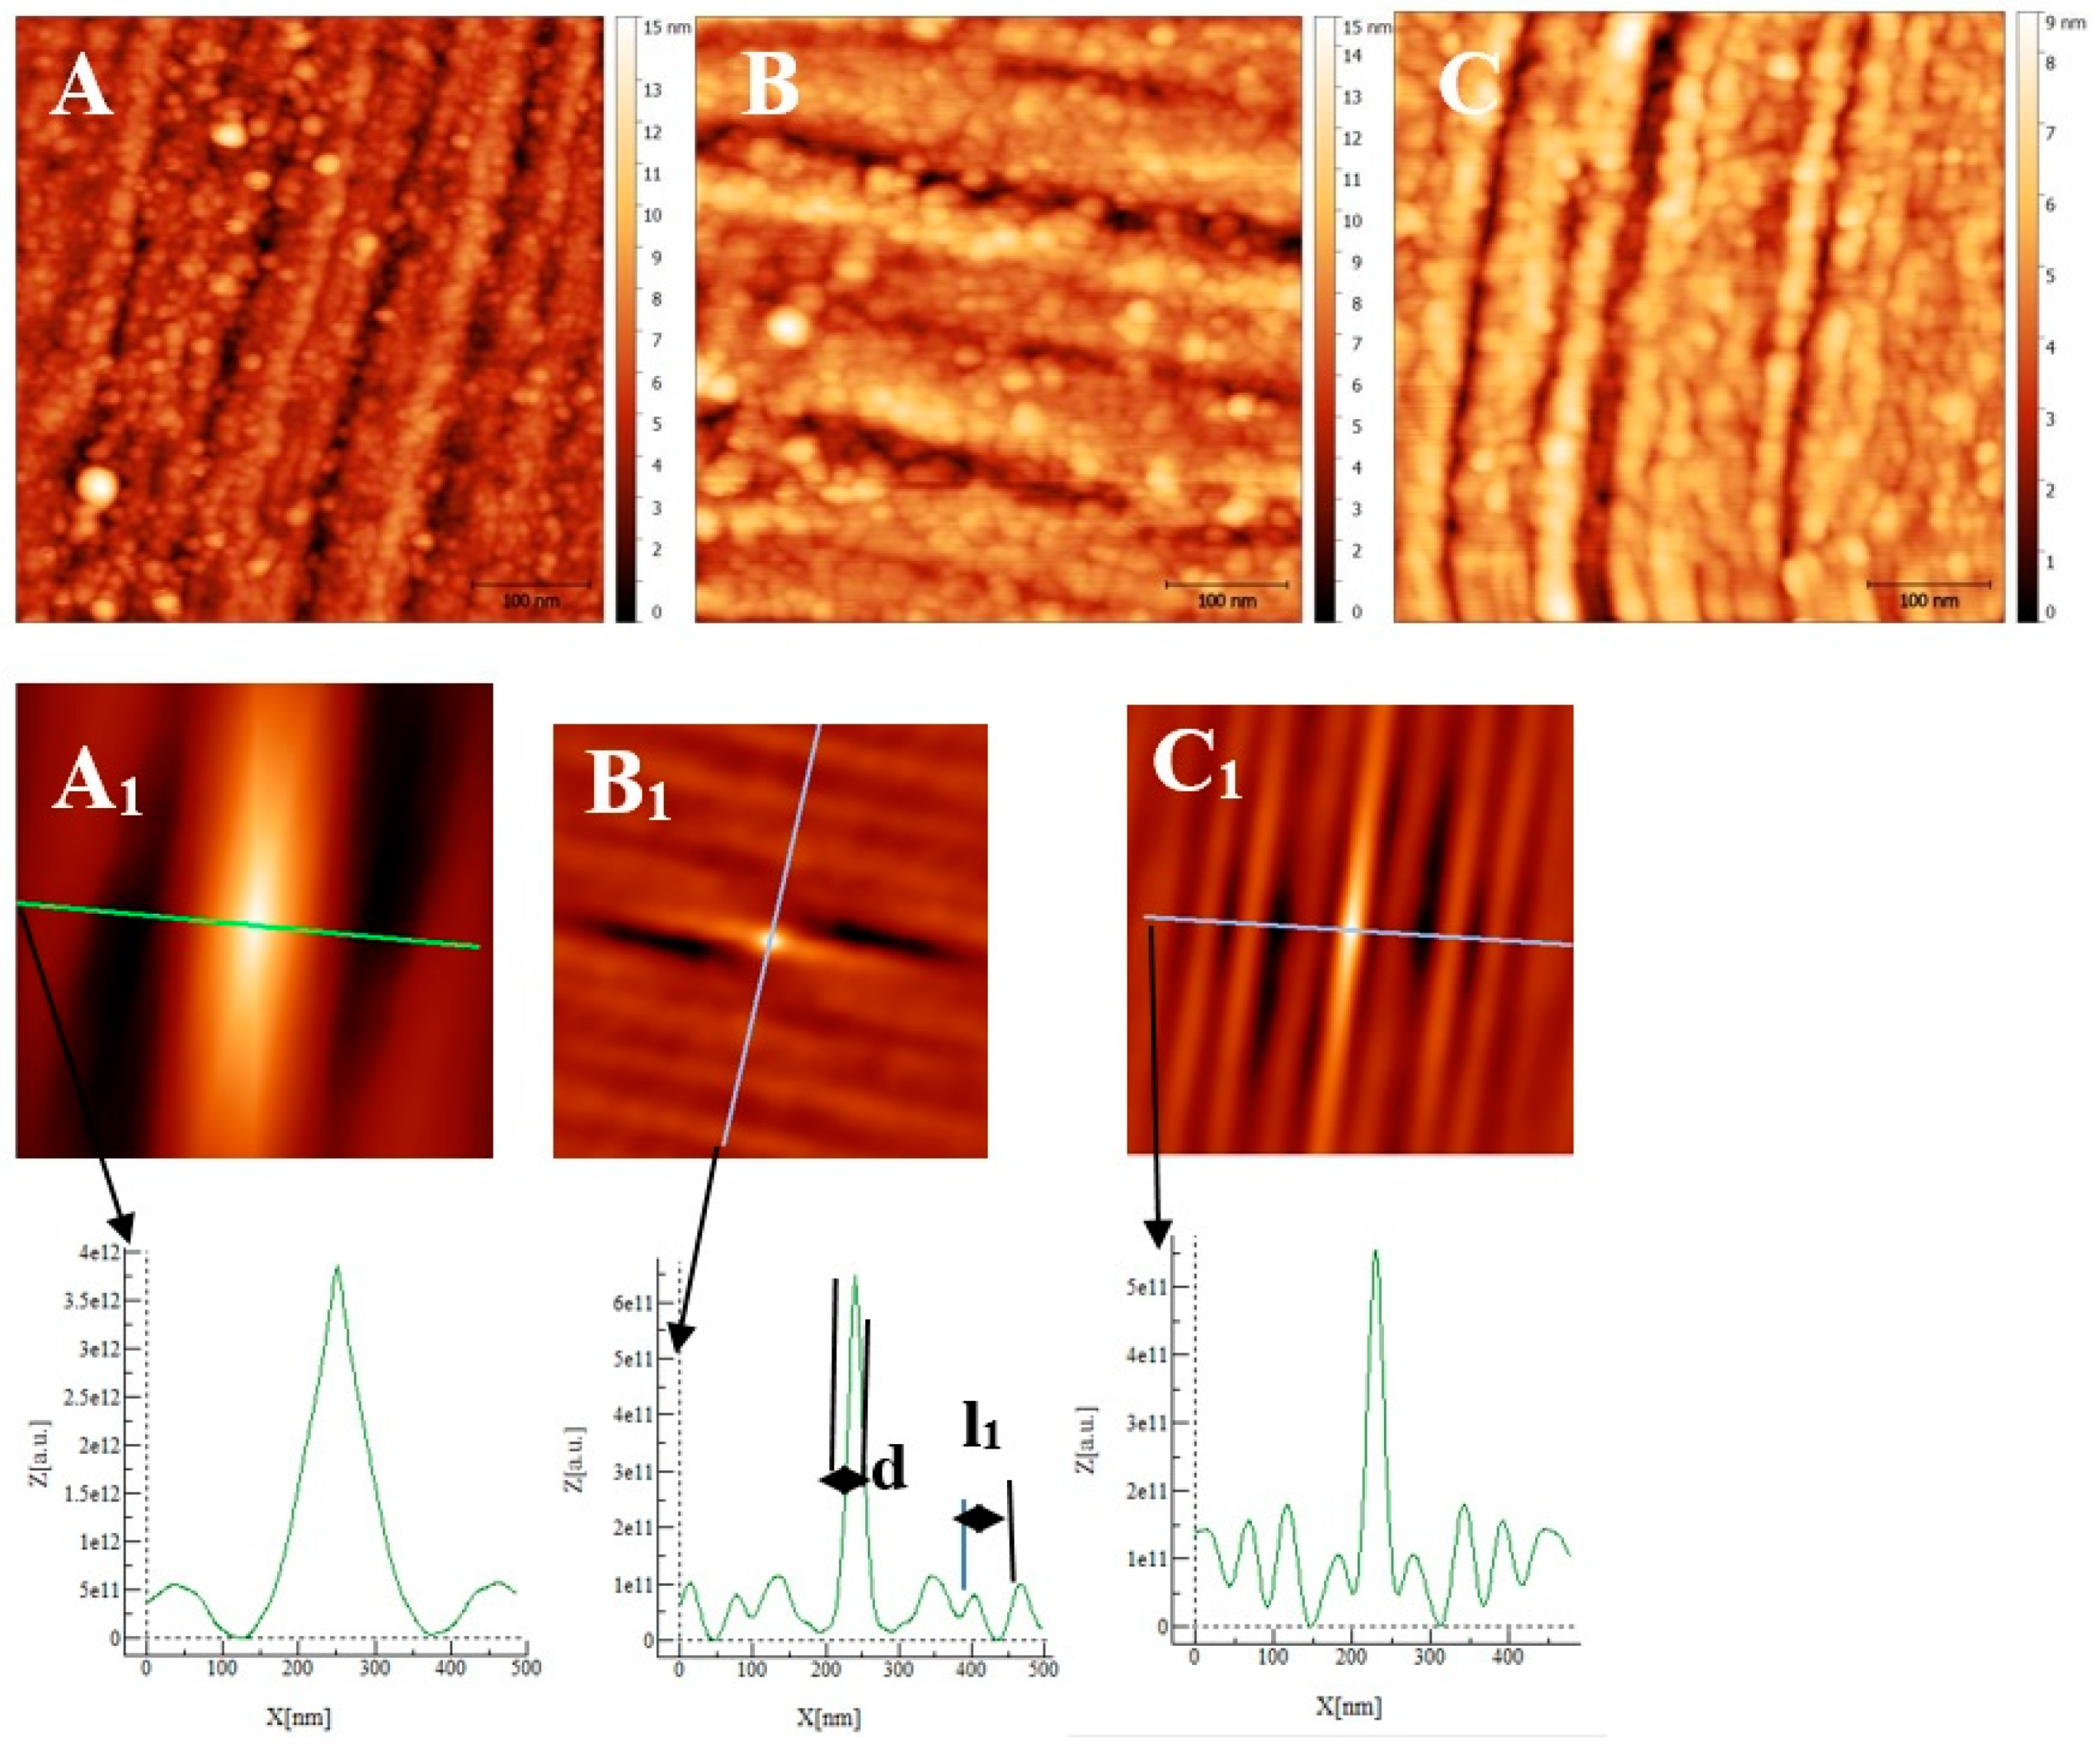
The samples (size: 1 × 1 cm2) were embedded in an epoxy resin, then abraded with wet SiC paper of decreasing grit size (1000, 2400 and 4000) and polished with a diamond paste (particle size: 3 and 1 µm). The polisher is marketed by PERSI company, allowing for the control of the rotation speed (ω in rad/s), the time (t in s) and the force (F in N) applied on the sample. The different polishing steps were quickly controlled by an optical microscope and then by AFM. After polishing, the sample was extracted from the epoxy resin and then rinsed in ultrasound baths with acetone, ethanol, and deionized water, then air-dried. The final substrate surface was checked for the three alloys by AFM, as shown in Figure 1. Low roughness surfaces (RMS: AISI 304 = 3.0 ± 0.1 nm, AISI316 = 2.70 ± 0.1 nm, Inconel 600 = 2.8 ± 0.2 nm) were obtained. Since the roughness values are very close together, we could not distinguish and characterize the surface topography from one sample compared to another by using only this parameter. As can be seen in Figure 1, proper polishing grooves appear parallel at this micrometer scale. To obtain a physical parameter other than the RMS roughness to characterize each substrate, we calculate the self-correlation function G defined as:
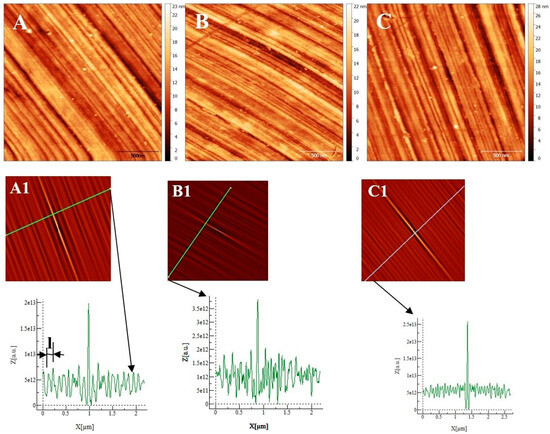
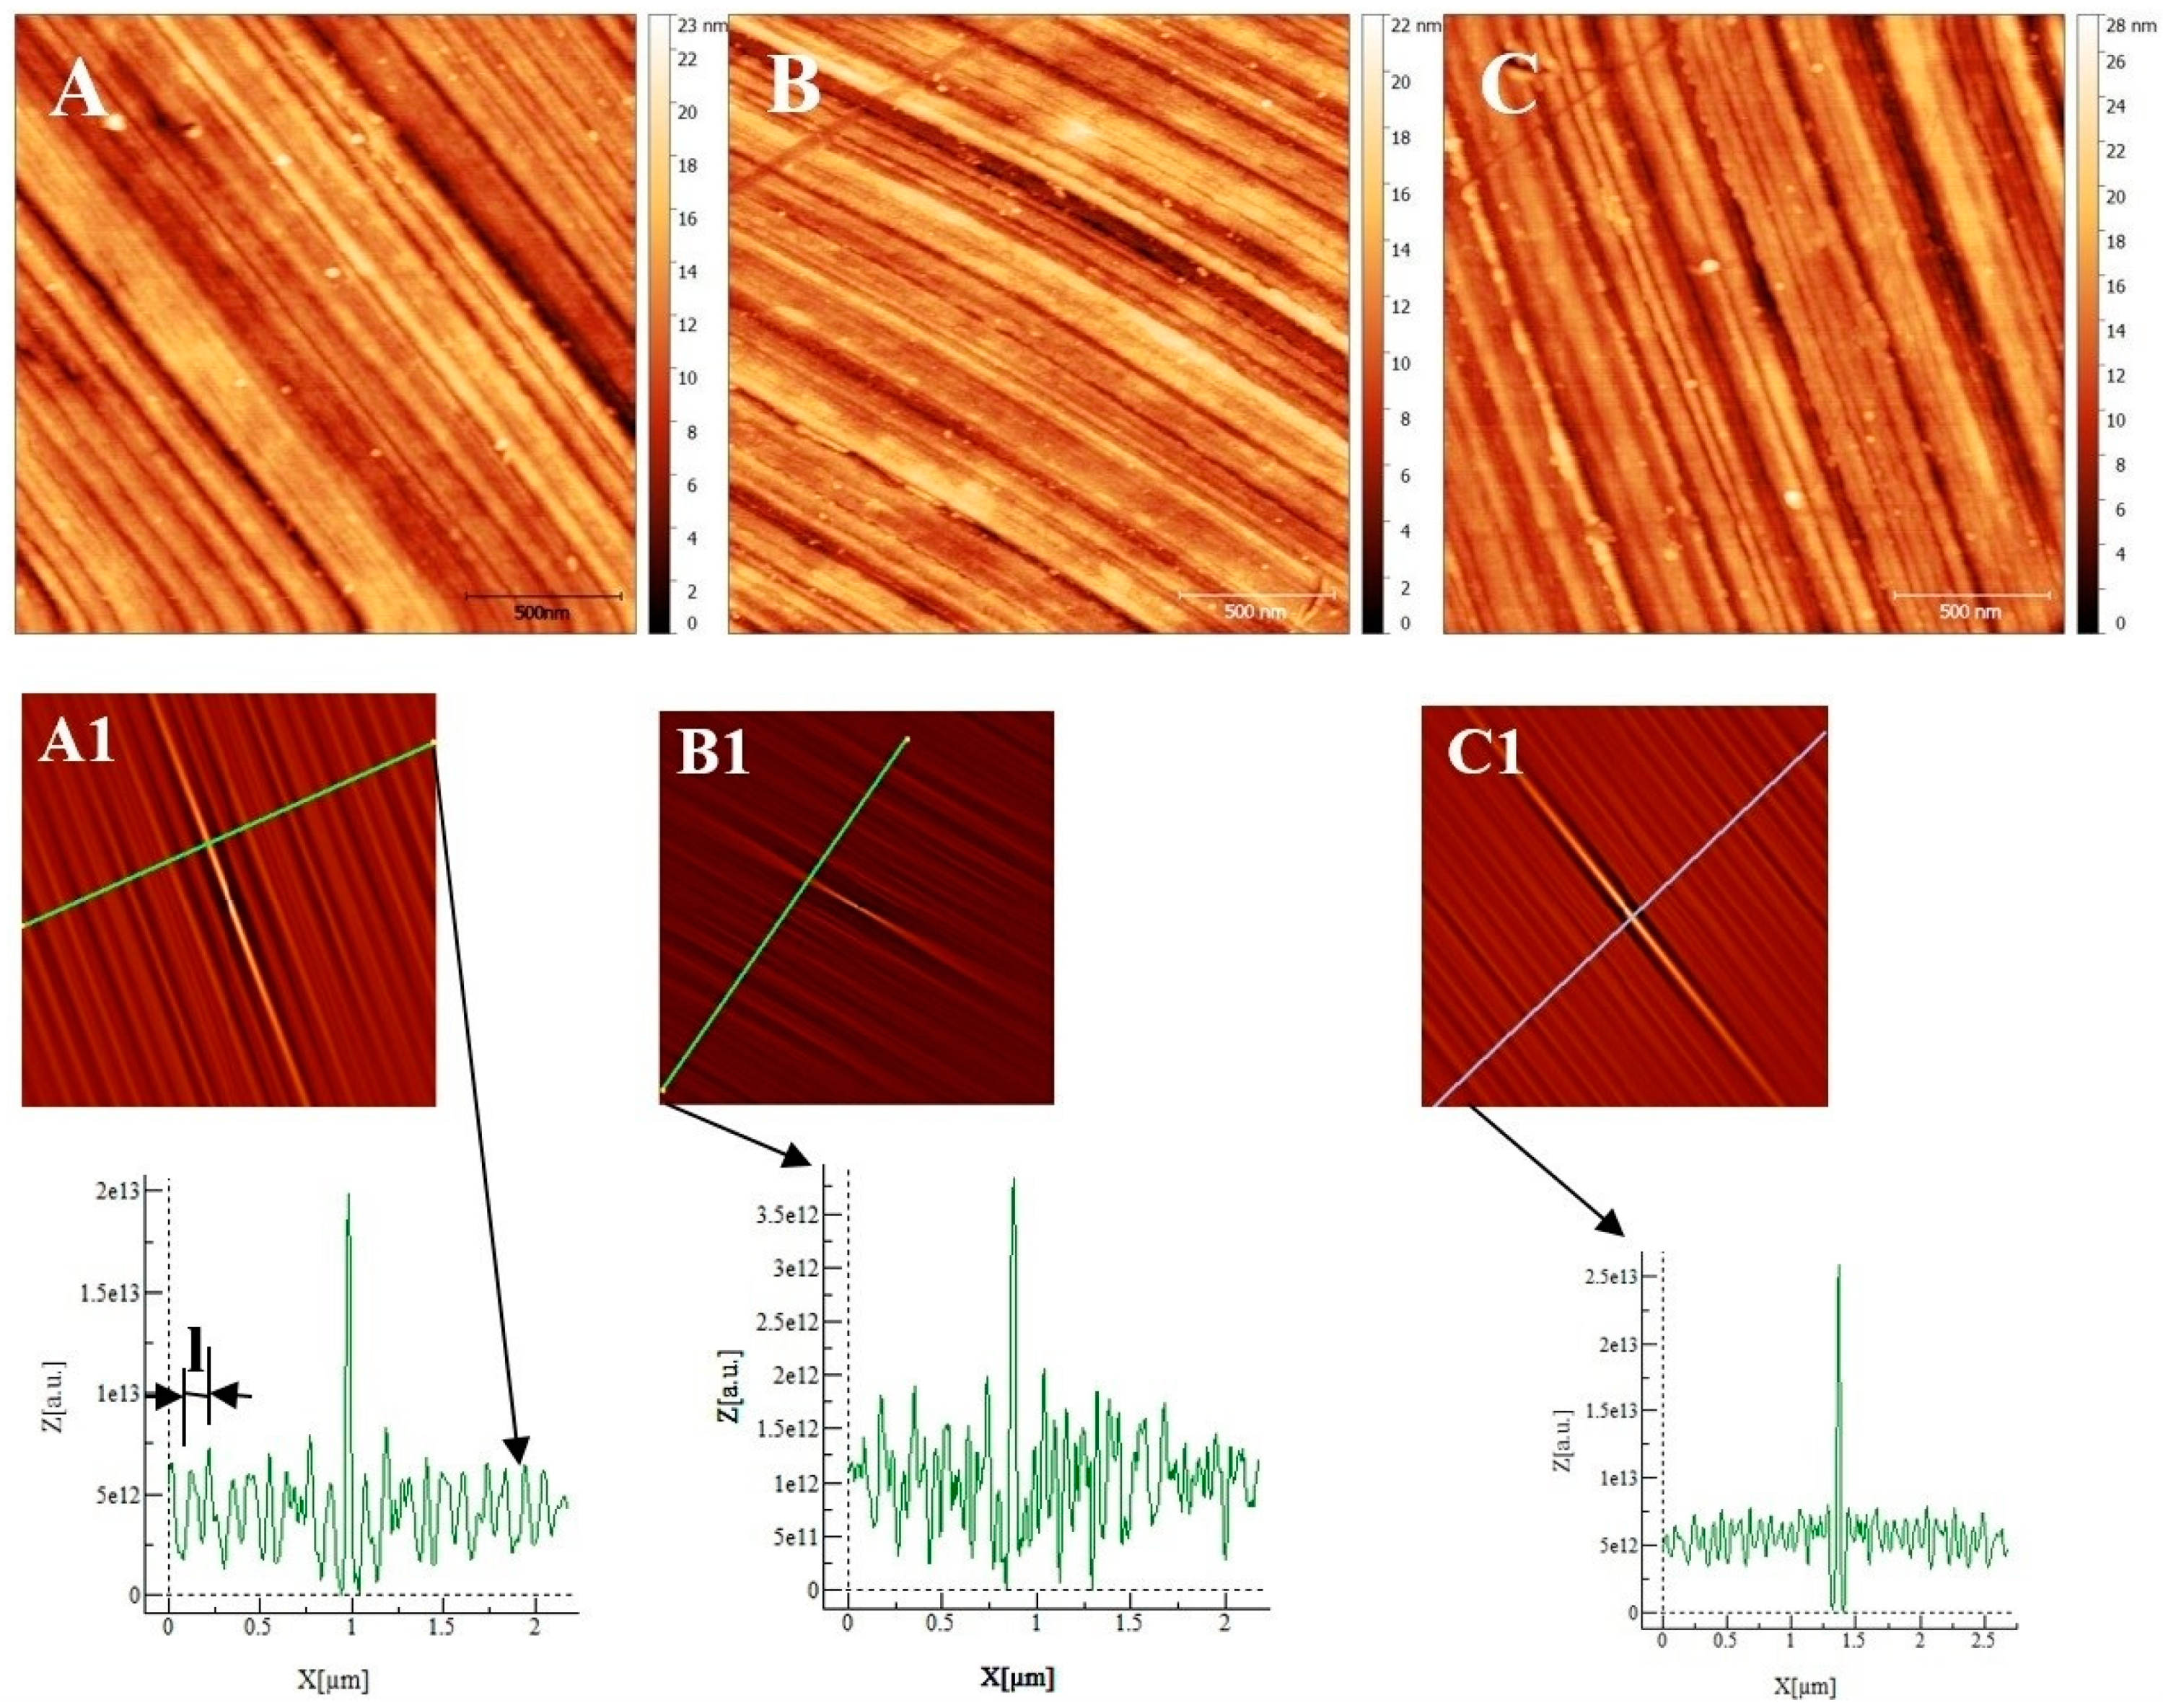
Figure 1.
Atomic Force Microscopy image (2 µm × 2 µm) of the substrate after polishing: (A) AISI 304. (B) AISI 316. (C) Inconel 600. (A1), (B1), and (C1) are self-correlation images calculated using, respectively, images (A), (B) and (C) as input with typical cross-sections allowing to determine the average distance named l between two trenches resulting from the polishing steps.
From the geometric point of view, this function probes the correlation between the original image and an image shifted by a distance k1 (k2) in the x (y) direction with respect to the center of the original image. This function always reaches its maximum at the center of its image, and the shape of the central peak gives access to the grains’ mean geometrical shape [14]. If there is a periodicity in the image, it will also appear in the self-correlation image. In our case, trenches due to polishing are parallel and separated by a mean distance l that is determined using the sections associated with each self-correlation image. The sections show maximums corresponding to the periodicity due to parallel trenches. By measuring the distance between two maxima, we obtain the characteristic parameter l corresponding to the mean distance separating two trenches (for example, see the section of image A1 in Figure 1). To obtain a more precise value of l, we measured the distance between 10 maximums and divided the measured value by 10 to obtain l for each substrate. We obtain l = 110 ± 10 nm for the Inconel 600 substrate, l = 193 ± 20 nm for AISI304, and l = 83 ± 15 nm for AISI316 substrates. To conclude, the several lengths l obtained are different for each substrate, and l is a parameter that allows for the characterization of the differences between the surface topographies due to our polishing technique before the passivation process starts.
2.2. Electrochemical Measurements
All measurements were conducted in a 0.1 M NaOH solution at pH = 13 to simulate the interstitial electrolyte of concrete pores. The electrochemical experiments were performed at room temperature in a classical electrochemical cell with three electrodes. We used as a reference a saturated calomel electrode (SCE, E0 = +0.24 V versus the Saturated Hydrogen Electrode (SHE)) and, as a counter electrode, a platinum electrode. The working electrodes consisted of the studied materials, i.e., AISI 304, AISI 316 and Inconel 600. All the electrochemical measurements were carried out using a potentiostat from Princeton Applied Research (versaStat 4).
Cyclic Voltammetry (CV) has been used to determine the redox processes on the passive films generated by the application of a potential sweep. The range of potential selected extends from the evolution of hydrogen (−1.4 V vs. SCE) to the evolution of oxygen (+0.6 V vs. SCE). In order to obtain passive films that are thick enough to be protective, we performed 12 cycles with a scanning rate of 25 mV/s. These experimental conditions allowed the identification of the redox processes that tended to decrease and those that tended to increase with the numbers of the scanning cycles in potential [30].
Passive films formed by CV and spontaneously formed films were studied and compared using electrochemical impedance spectroscopy (EIS). These measurements were performed after the OCP (Open Circuit potential) was stable. The amplitude of the tension applied was 10 mV, and the scanning frequency ranged between 100 kHz and 5 mHz. The working electrodes were not cathodically polarized to remove the native oxides (formed in the air) in order to maintain conditions close to those where the alloys evolve in reinforced concrete.
2.3. Atomic Force Microscopy (AFM)
The AFM images were realized with an AFM provided by Brucker (multimode design, Nanoscope V electronic). The AFM in tapping mode was used to monitor the evolution of the topography during the different immersion times. The principle and the different modes of acquisition of the AFM images are widely explained and detailed in the literature [31,32,33]. For SKFM images, we use the PtIr-coated tapping mode Si tips provided by Brucker with a resonant frequency of around 75 kHz and a stiffness constant of around 3 Nm−1. Our experimental procedure to obtain a SKPFM image has been described in a previous paper [21].
3. Results and Discussion
3.1. Films Formed by Cyclic Voltammetry
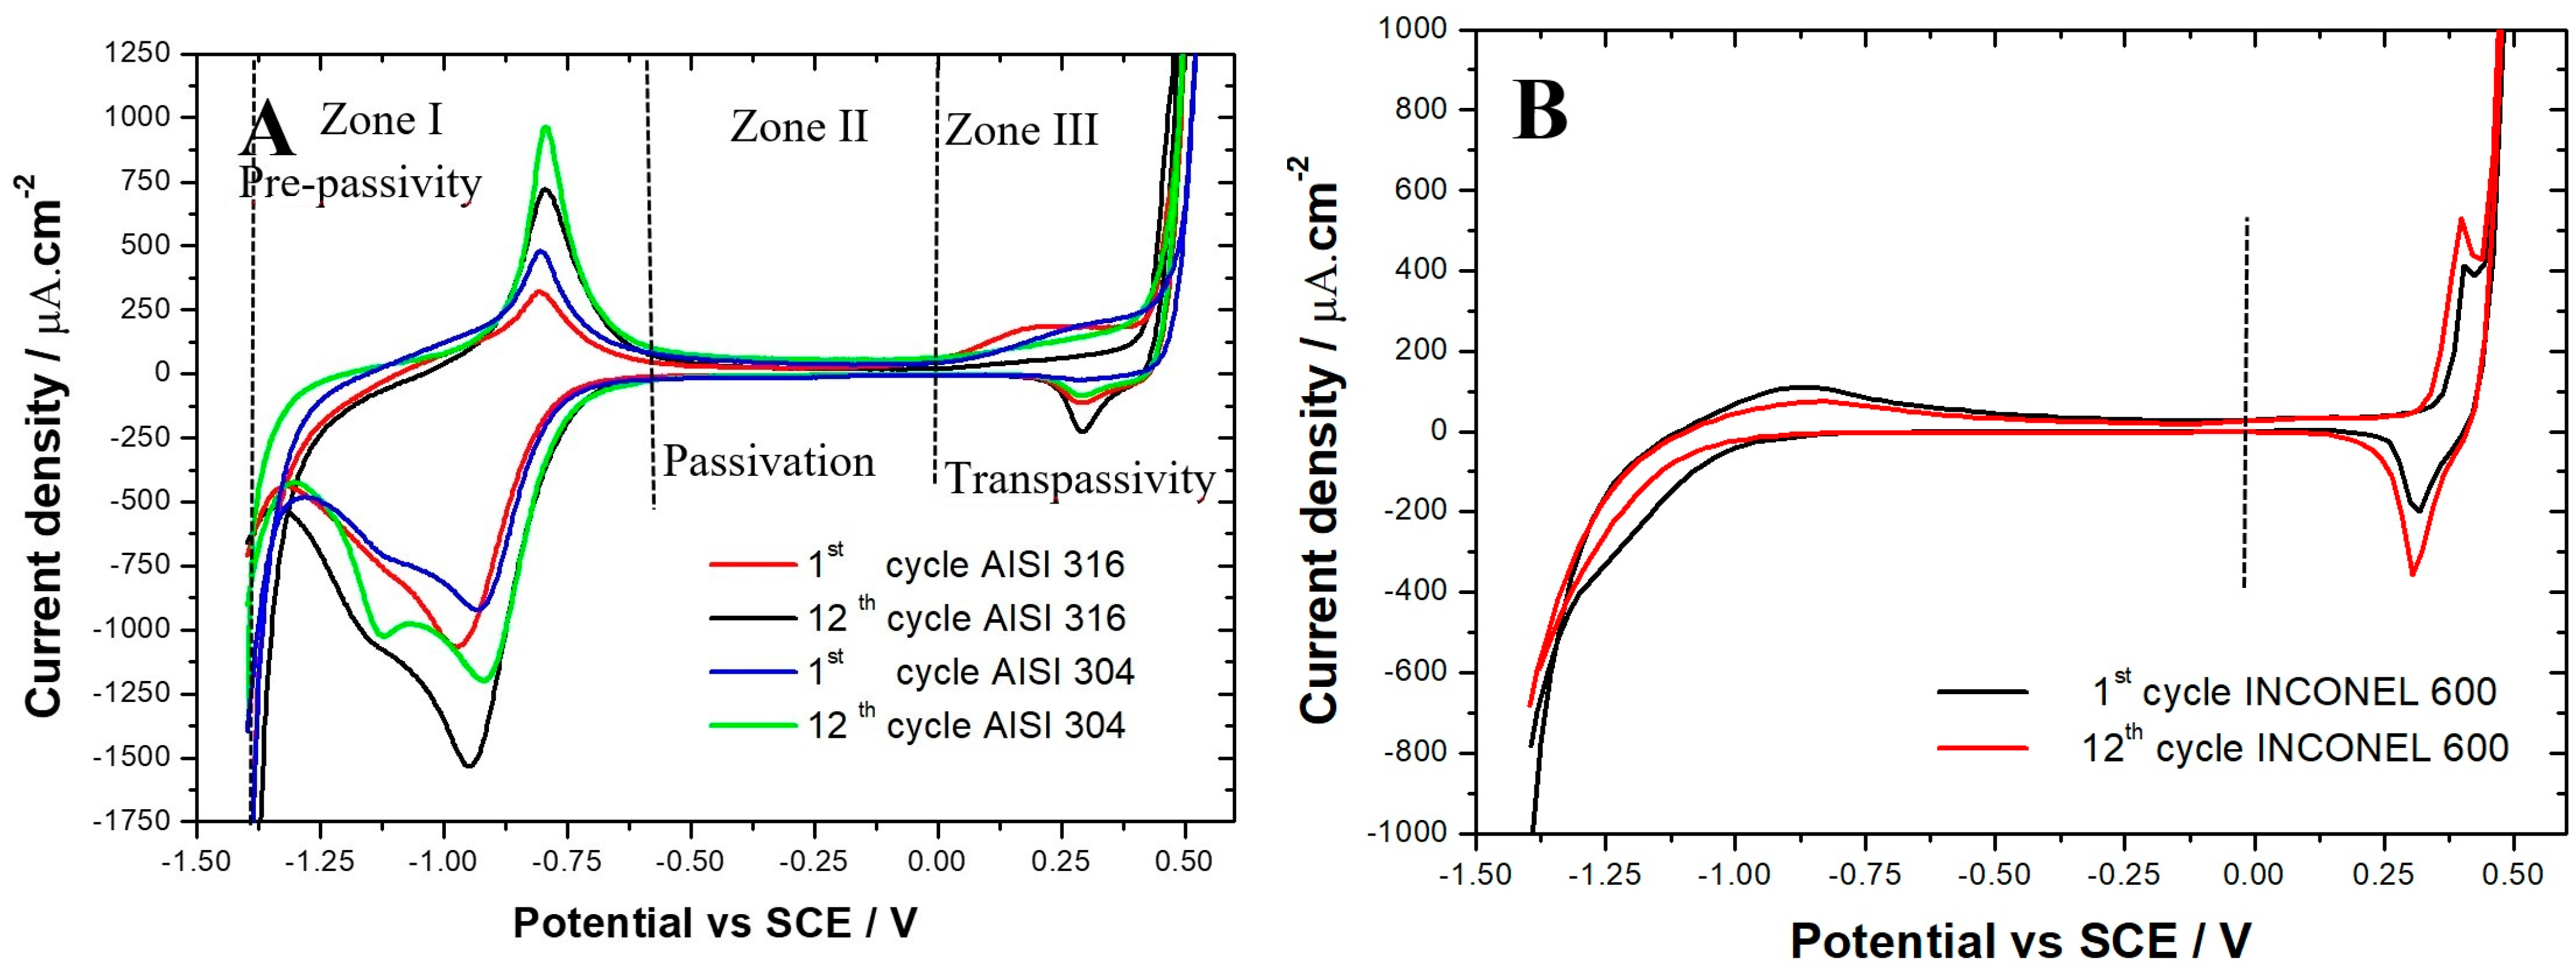
The voltammograms obtained (Figure 2A) for AISI 304 and AISI 316 are comparable and are in agreement with the literature results [28,34,35,36,37]. For the two materials, there are clearly three zones:
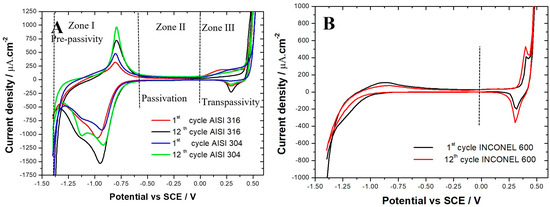
Figure 2.
Cyclic voltammograms (1st and 12th cycles) obtained in 0.1 M NaOH solution. Potential range: −1.4 to 0.5 V vs. SCE. Scanning rate: dE/dt = 25 mV/s. (A) AISI 316 and AISI 304 samples. (B) Inconel 600.
- (a)
- Zone I: extended from −1.4 to −0.56 V vs. SCE, called the pre-passivity zone, is the typical region of iron activity;
- (b)
- Zone II: extended from −0.56 to 0 V vs. SCE is the region where a stable passive film covering the surface of the alloys is formed (passivation);
- (c)
- Zone III: extended from 0 to 0.6 V vs. SCE, called the zone of transpassivity, is the region where the oxidation–reduction processes of alloying elements occur (Cr, Ni, etc.). In this zone, water molecules also decompose, causing an strong increase in the anodic current density on the voltammograms, due to oxygen evolution.
In Zone I, an oxidation peak is observed at about −0.8 V vs. SCE due to the formation of the magnetite Fe3O4 [34,37,38,39], as shown in the following equations:
Magnetite is a mixed oxide mainly resulting from the oxidation of Fe2+ to Fe3O4 composed of Fe2+ and Fe3+ ions [36,37]. As can be seen in Figure 2A, for both steels, the peak intensity increases with the increase in the number of cycles. In addition, the density of the anode current is greater for AISI 304 than for AISI 316 (975 μA/cm2; 713μA/cm2, respectively). The presence of a less intense oxidation peak for AISI 316 is due to the presence of molybdenum in the chemical composition of the AISI 316 alloy. Mo promotes the inner layer enrichment by Cr of the chromium oxide film Cr2O3 layer [37,39,40], which has an insulating behavior that blocks the movement of iron ions through the film. As indicated in their work, C. M. Abreu et al. [37] showed that a higher intensity of the oxidation peak also led to a thicker film.
Therefore, the films formed on AISI 304 are thicker than those formed on AISI 316. Beyond the peak of magnetite formation, there is a sudden drop in anodic current density, which is characteristic of a transition from an active state of stainless steel dissolution to a state of passivation. The intensity of the reduction peaks at −0.97 and −1.12 V vs. SCE increases with the increase of the number of cycles. The processes that occur at these peaks are not well understood. Thus, some authors [19,20] agree that these peaks correspond to the reduction of Fe3+ to Fe2+. Other authors [22] indicate that this would be the reduction of Ni3O4 to NiO and NiO to Ni metal. In their studies on the two types of stainless steel (AISI 304 and AISI 316), L. Freire et al. [34] suggested that there is an overlap between the reduction of nickel oxides (Ni3O4 to NiO and NiO to Ni metal) and the reduction of iron oxides (Fe3O4 to Fe2+).
In Zone II, the current density is very small. This fact promotes the idea that in an alkaline medium, the films on the surface of the alloys act as a barrier separating the stainless steel from the electrolyte [38]. In Figure 2A, an oxidation peak is observed in the region of chromium activity at about 0.23 V vs. SCE that corresponds to the chromium oxidation process from Cr3+ to Cr6+ [34,35,36,38,41]. It should also be noted that the intensity of the chromium oxidation peak with the increasing number of cycles suggests the progressive formation of an isolating oxide layer like Cr2O3, which decreases the reactivity of the passive layer. At more positive potentials, we observe an intense increase in the current density due to the well-known water decomposition process generating an evolution of oxygen [38]. The reduction peak at 0.29 V vs. SCE, whose intensity increases with the number of cycles, corresponds to the reduction process of Ni2+ to Ni3+ [35,36].
The voltammograms (Figure 2B) obtained on Inconel 600 are also similar to those found in the literature [39,40,41,42,43] but are different from those obtained on AISI 304 and AISI 316 (Figure 2A). In Figure 2B, an intensity increase in the oxidation peak at 0.39 V vs. SCE and in the reduction peak at 0.30 V vs. SCE with the increasing number of cycles is observed. These two peaks are attributed to the transition process from Ni(OH)2 to NiO(OH) and conversely [42,43]. The intensity of the oxidation peak of Fe2+ to Fe3O4 at −0.86 V vs. SCE tends to decrease [37]. In our voltammograms, we do not find any chromium oxidation peak. Nevertheless, XPS measurements performed by C.M. Abreu et al. [37] on films formed by cyclic voltammetry on the surface of nickel-based alloys in an alkaline medium revealed the presence of chromium Cr3+ in the film. The voltammograms in Zone 1 indicate that the films formed on AISI 304 are thicker than those formed on AISI 316. However, the fact that they are thicker does not necessarily mean that they are more protective. The values of the average residual current measured for AISI 316 and AISI 304 stainless steel are reported in Table 2. In the first cycle, it can be seen that the average residual current for AISI 316 (11.57 μA/cm2) is lower than that of AISI 304 (14.55 μA/cm2), suggesting that the passive film formed on AISI 316 is more protective than the one formed on AISI 304. This trend is confirmed during the following cycles. For example, in the twelfth cycle, there is a decrease in the average residual current for the two alloys (3.95 μA/cm2 for AISI 316 and 6.88 μA/cm2 for AISI 304). The barrier properties of the films are improved with the increase in the number of cycles, as shown in the literature [38]. The mean residual current measured for the Inconel 600 after twelve cycles (4.86 μA/cm2) was found between the one measured on AISI 304 and on AISI 316. This suggests that the film formed on Inconel 600 in a simulated concrete environment at ambient temperature is more resistant than those formed on AISI 304 but less resistant than those formed on AISI 316.
Table 2.
The residual current of the passivity domain of both types of stainless steel (AISI 304 and AISI 316) and Inconel 600 was determined from the cyclic voltammograms.
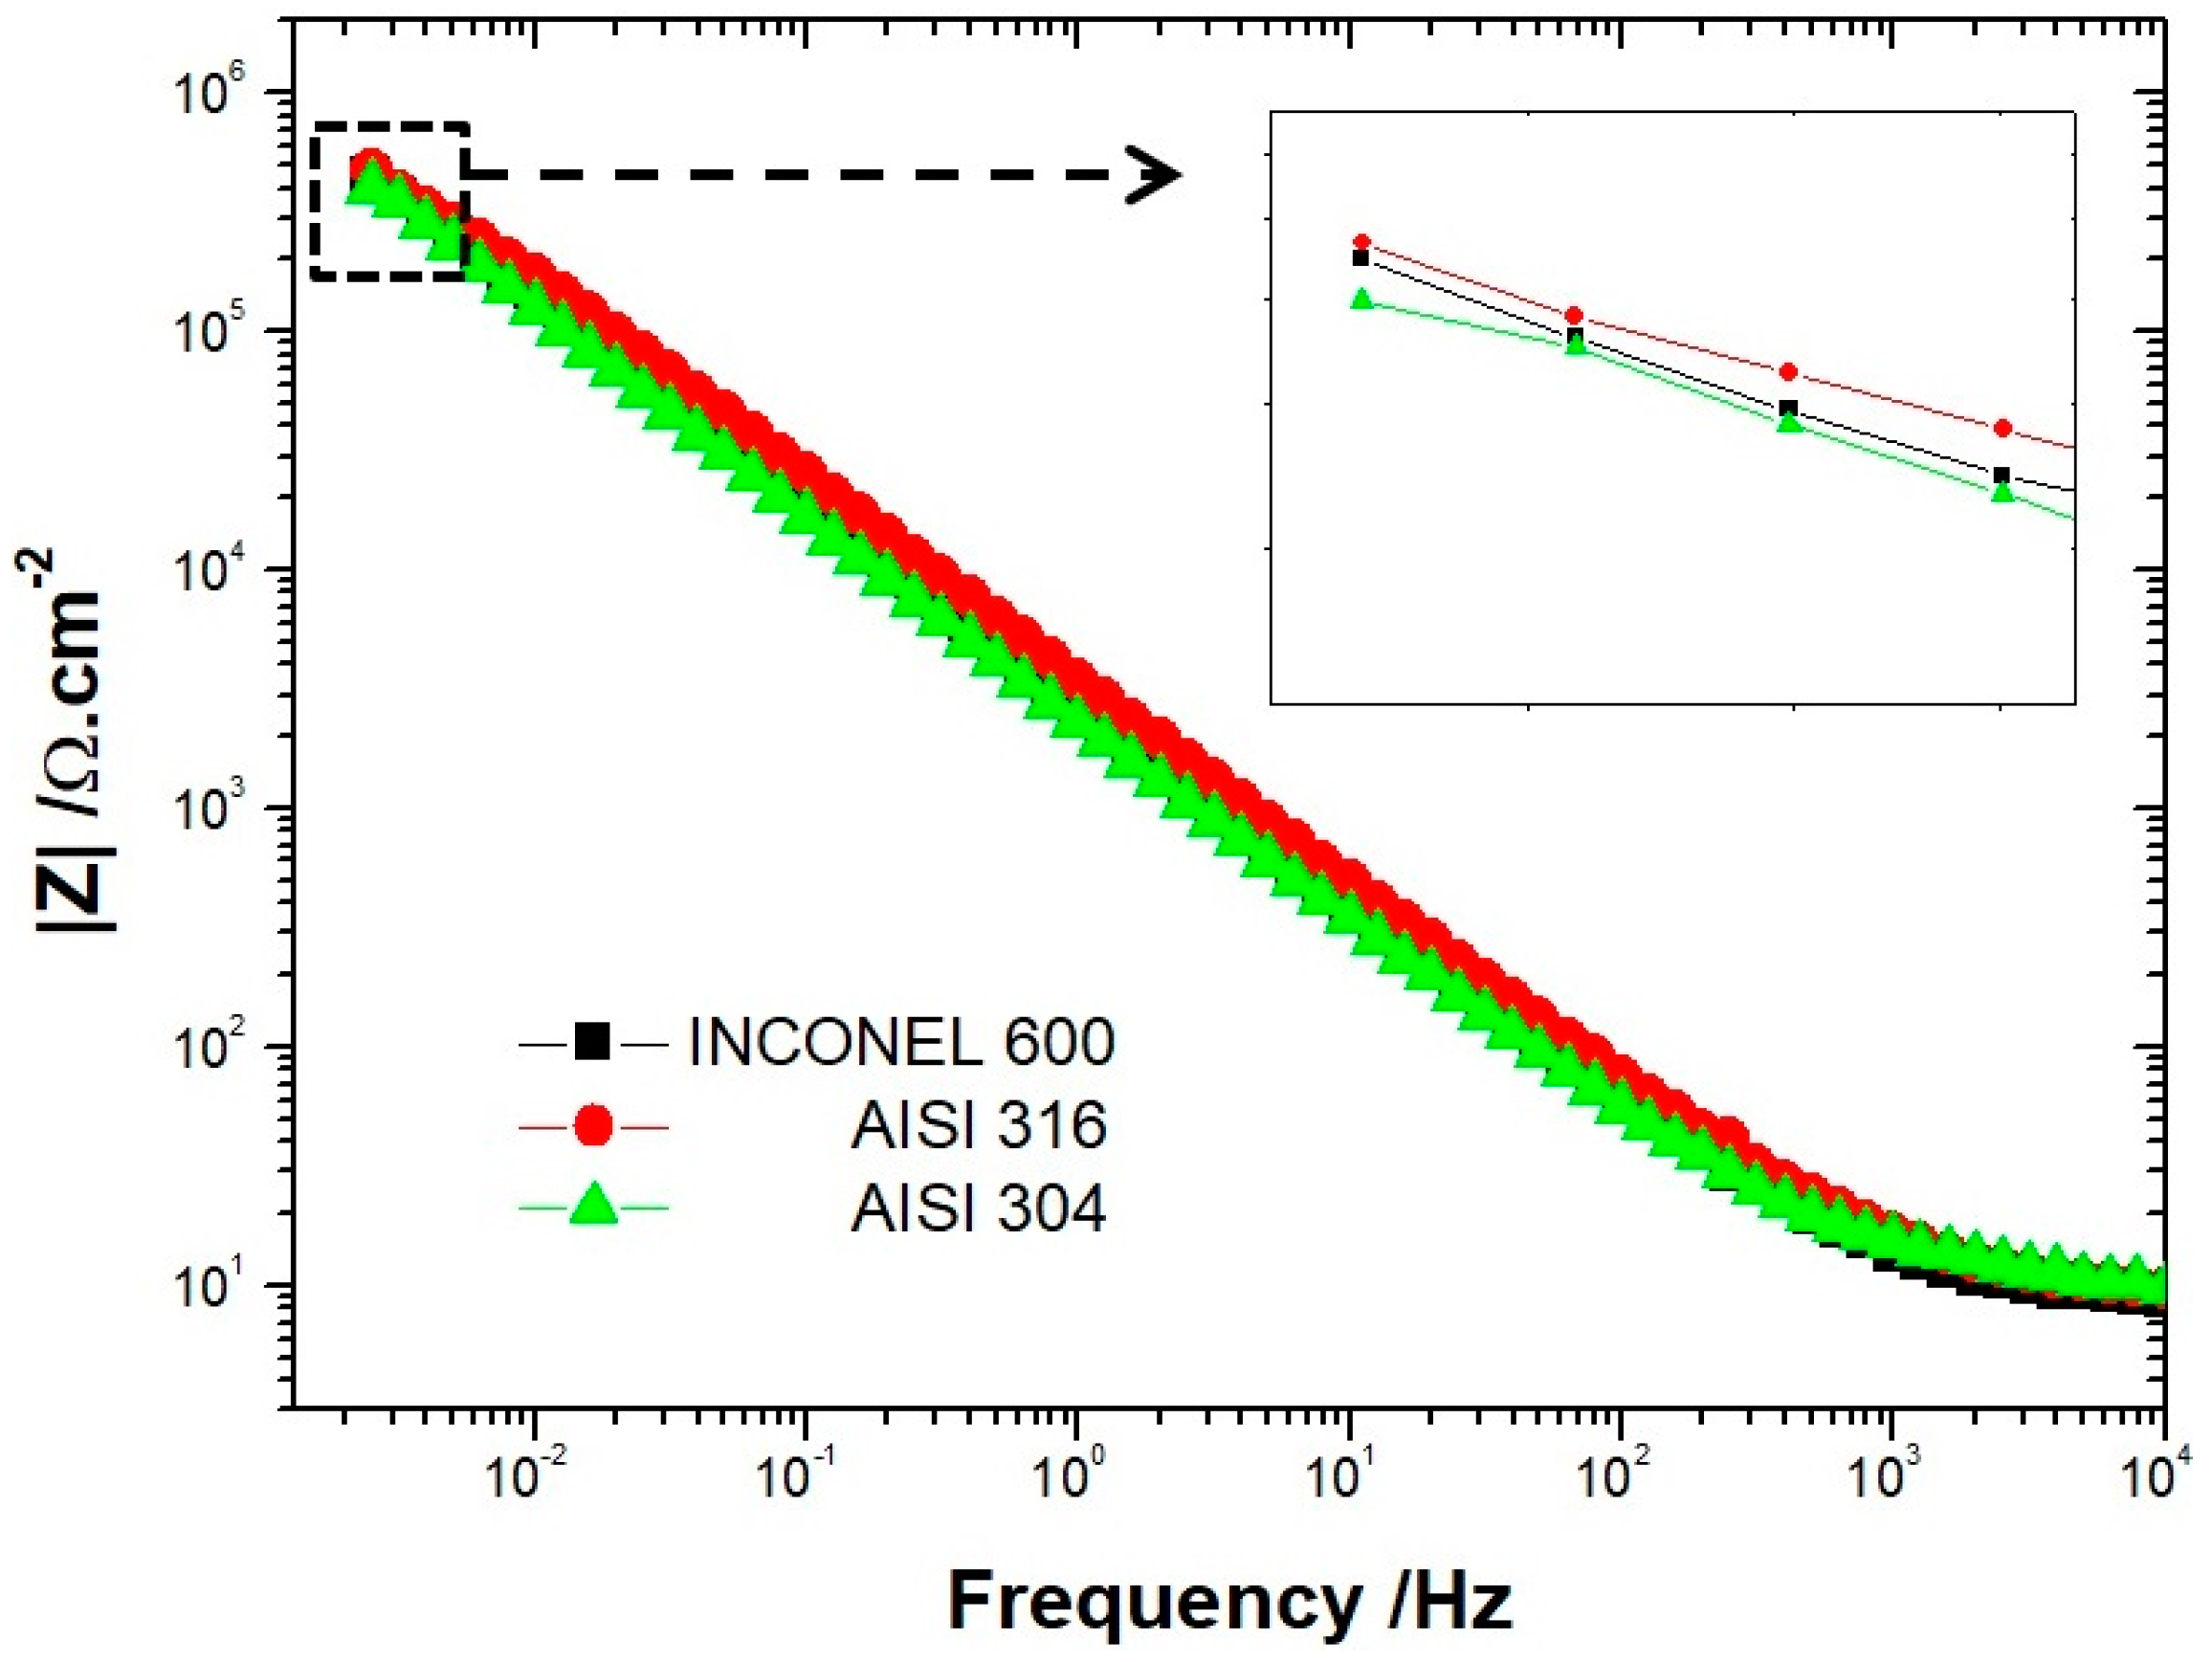
To confirm these results, we used electrochemical impedance measurements to determine the overall system impedance for the three alloys after CV in an alkaline solution of NaOH at pH = 13. The measurements were made from 100 KHz to 5 MHz. In Figure 3, the Bode diagrams show the same trend for the three alloys. At low frequencies, the impedance measured for AISI 316 was higher than the one measured on Inconel 600, which displayed a higher impedance than AISI 304. These data confirm the previous results obtained with the average residual current measurements. Taken together, these elements seem to suggest that the Inconel 600, which is an alloy generally used in critical environments, is less efficient than AISI 316 at room temperature in an environment simulating reinforced concrete.

Figure 3.
Bode plots (log|Z|) of AISI 304, AISI 316 and Inconel 600 in NaOH solution after twelve cyclic voltammograms.
3.2. Spontaneous Growth of Passive Films on Stainless Steels and Inconel 600
3.2.1. Electrochemical Impedance Spectroscopy
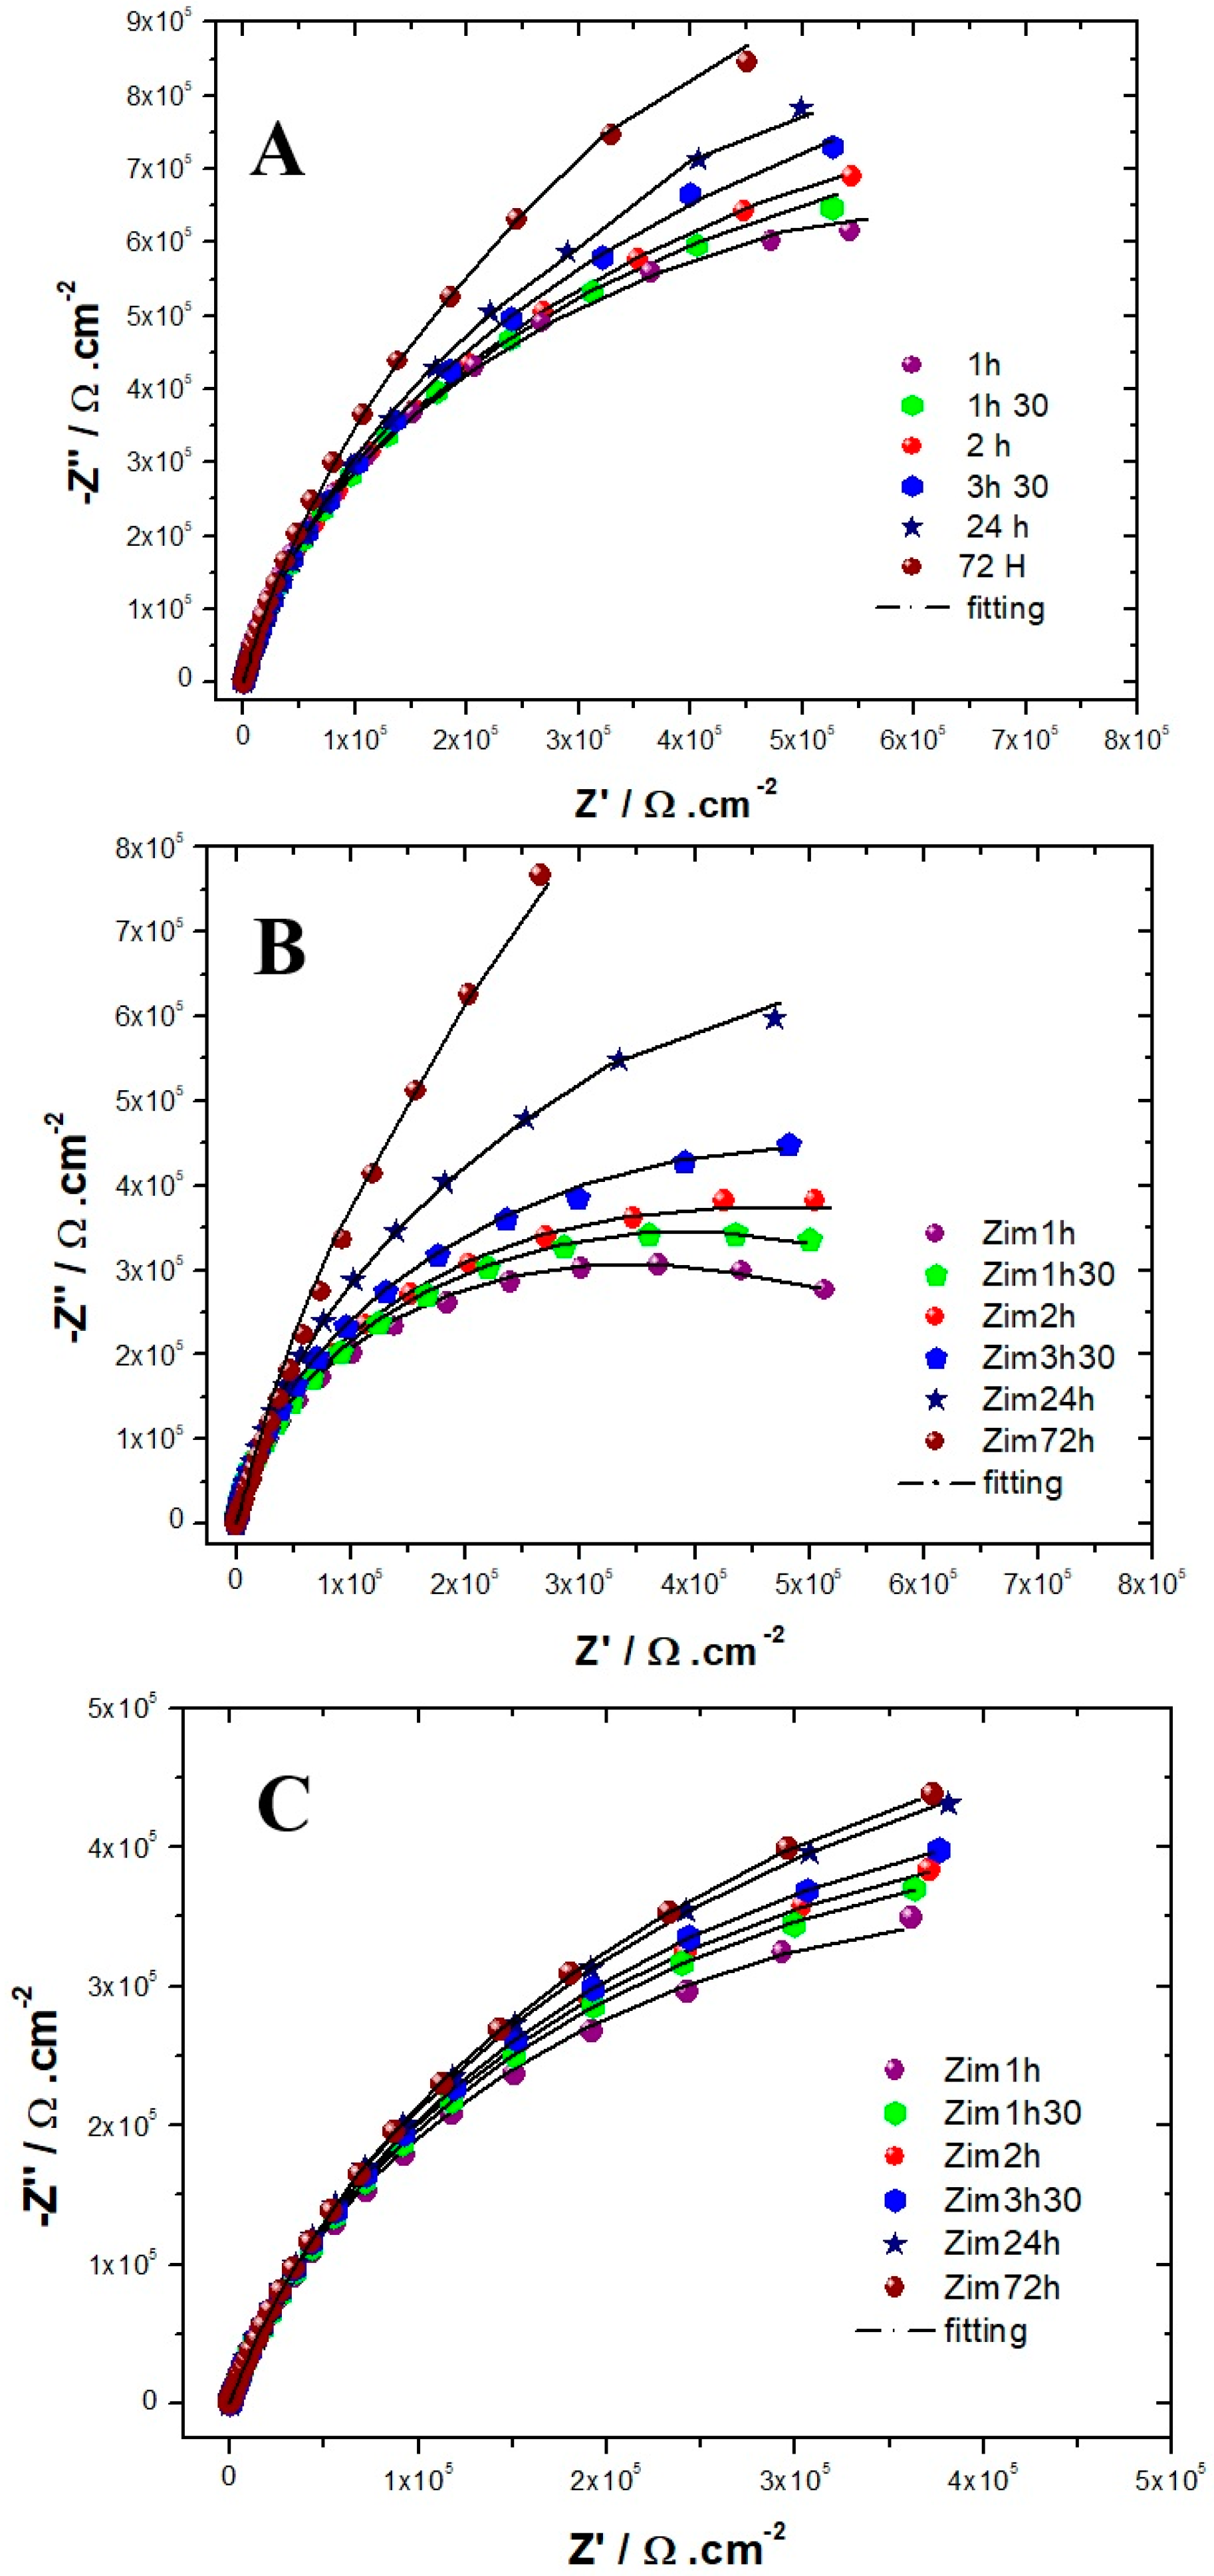
The evolution of the Nyquist diagrams as a function of the immersion time in the solution simulating reinforced concrete for the three alloys is shown in Figure 4. For the three alloys, the capacitive loop has a diameter that increases with the exposure time, meaning that the resistance of the passive films increases with the immersion time, which is in agreement with the literature [9,26,44]. All authors [9,26,44] suggest that the steady state of the steels exposed to alkaline media is well established after 3 days of immersion. Therefore, we chose to collect EIS data only during this time-lapse [9,26]. For both AISI 304 and AISI 316, the impedance measurements were performed to show that the capacitive loop has a linear behavior at low-frequency ranges after 72 h of immersion. Suggesting that the film formed is stable and protective. This tendency is less clear for Inconel 600, meaning that the amplitude of the capacitive loops is less than that for the AISI 304 and AISI 316 stainless steel. This result indicates that the films formed on Inconel 600 are less effective than those formed on stainless steel.
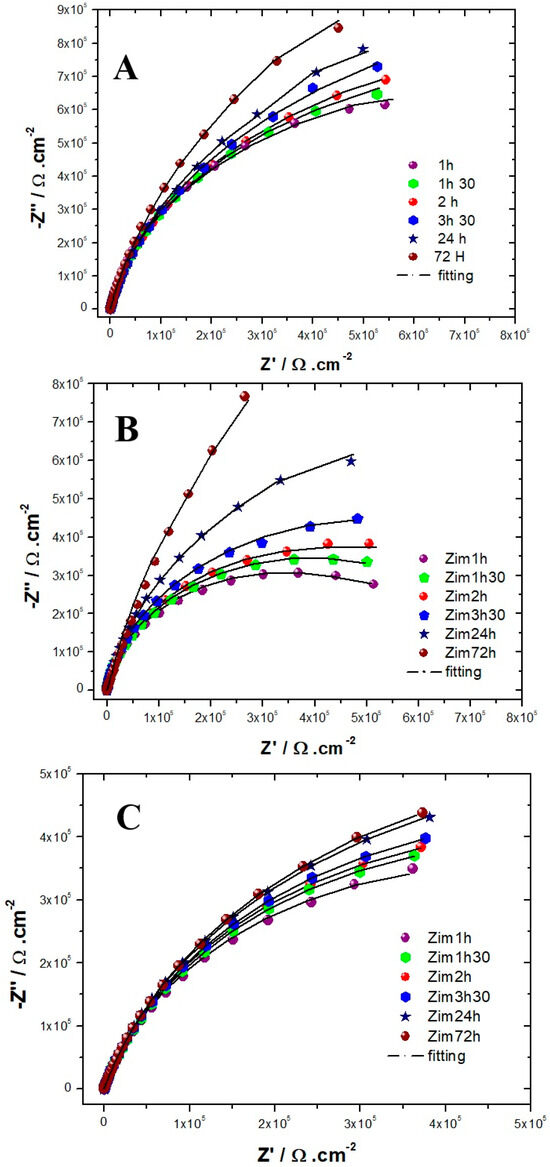
Figure 4.
Experimental and simulated Nyquist plots as a function of immersion time obtained for (A) AISI 316. (B) AISI 304. (C) Inconel 600 in a NaOH (pH = 13) solution at OCP (from 100 kHz down to 5 mHz).
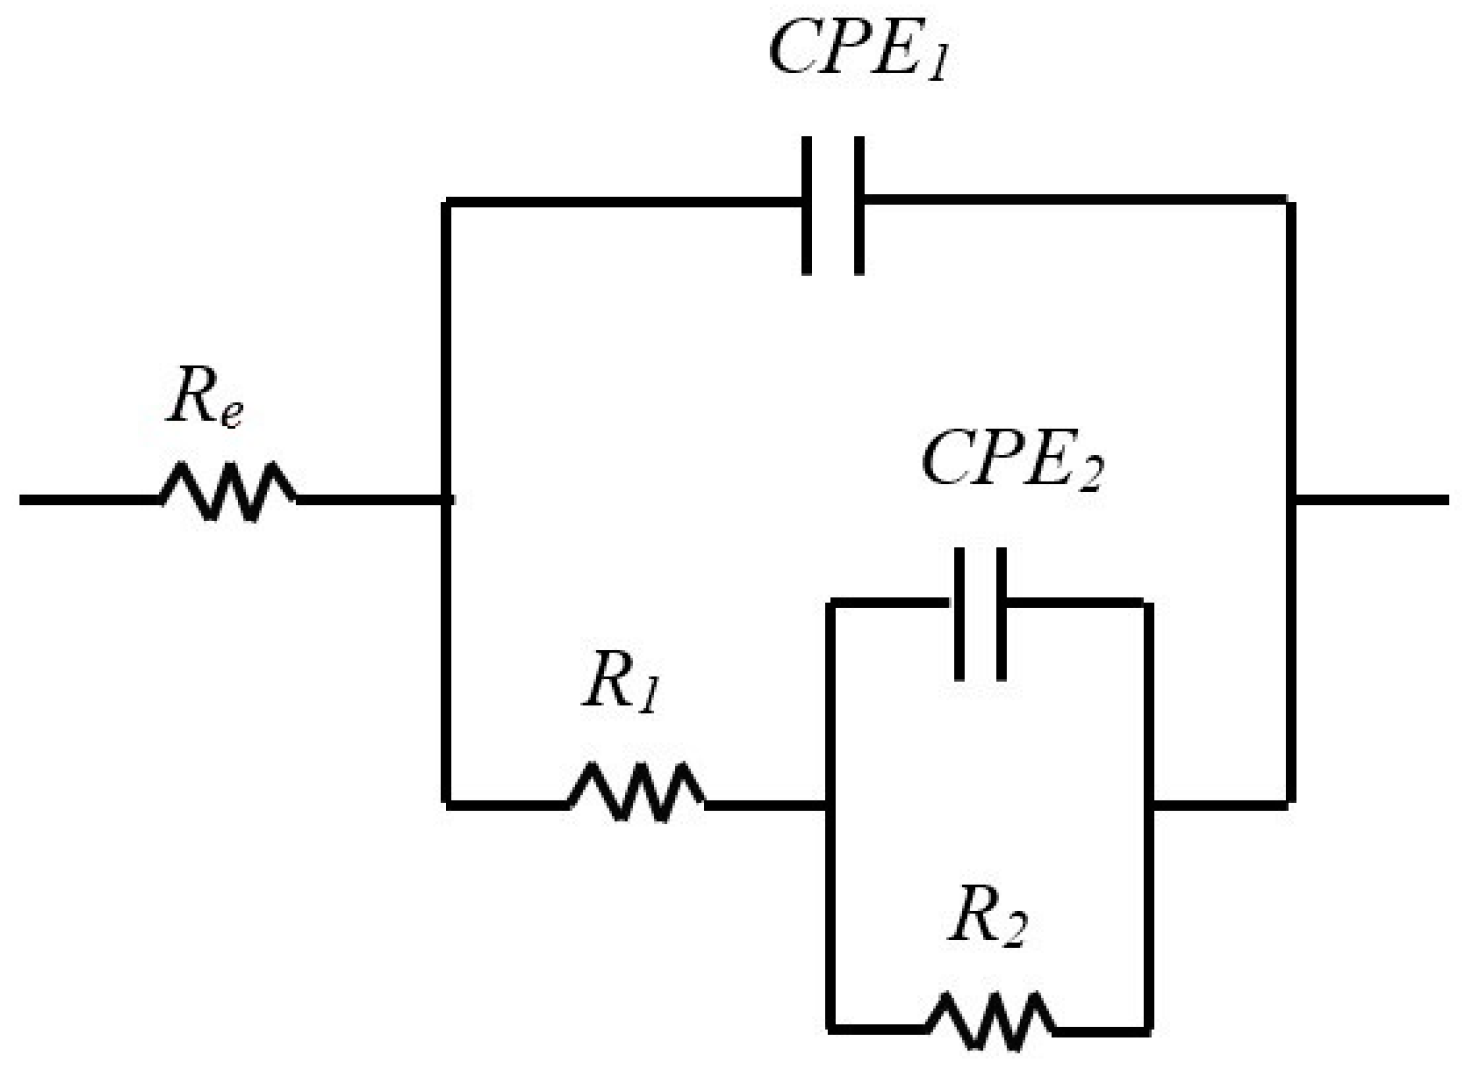
The results of EIS measurements were exploited using an equivalent electrical circuit (EEC). Several equivalent circuits have been tested, and the circuit depicted in Figure 5 with two times constant was selected to fit the experimental data because it gave more reliable results and allowed the simulation of EIS data with the same circuit for all three samples, which allows for easy comparison. This circuit was applied in other studies to describe passivation for AISI304 [44], AISI316 [26] and Inconel [45], which is why it seems we adapted it to our electrochemical system. The EEC fitting parameters are described in Table 3, Table 4 and Table 5. The use of EEC suggests that the passive film contains porosities in which the electrolyte penetrates [39,46]. The expression of the total impedance of the EEC is given by Equation (4). The half circles observed on the Nyquist diagrams are more or less flattened, which is explained by the non-ideality (roughness) of the electrode surface. So, it would be better, as shown in Equation (5), to replace the pure capacities of the circuit with constant phase elements CPE: CPE1 with a capacitance C1 and an exponent α1 and CPE2 with a capacitance C2 and an exponent α2. The properties of the CPE depend on the values of α. When α is equal to 1, the CPE behaves as a pure capacity and when α is equal to 0.5, the CPE behaves like an impedance of Warburg (diffusional control during the film formation).

Figure 5.
Equivalent circuits with two characteristic times constants used to represent the impedance behavior of the film–electrolyte interface as a function of immersion time.
Table 3.
Best fit parameters for the impedance spectra obtained on AISI 316 in NaOH solutions after OCP stabilization.
Table 4.
Best fit parameters for the impedance spectra obtained on AISI 304 in NaOH solutions after OCP stabilization.
Table 5.
Best fit parameters for the impedance spectra obtained on Inconel 600 in NaOH solutions after OCP stabilization.
In our case, the literature [1,26] suggests that the first time constant is associated with the charge transfer process where R1 is the charge transfer resistance, and CPE1 is the capacitance of the double layer at high frequencies. At low frequencies, the second time constant is associated with the oxidation–reduction process, which takes place in the passive film. C2 is associated with the capacitive behavior of the film, and R2 is linked to the resistance of the oxidation–reduction process [1,26].
Table 3 and Table 4 group together the values of the equivalent circuit parameters in the case of stainless steel. For AISI 316, the values of α1 vary between 0.94 and 0.92, while those of α2 vary between 0.84 and 0.82. For AISI 304, α1 varies between 0.95 and 0.94 and α2 between 0.87 and 0.86. The values obtained for α are very close to 1 for both types of stainless steel, in agreement with the literature [22]; therefore, in our case, CPE can be assimilated into pure capacitors (CPE ≈ C). Like stainless steel, in the case of Inconel 600, CPE can also be assimilated to pure capacitors (α1 and α2 are close to 1, as shown in Table 5).
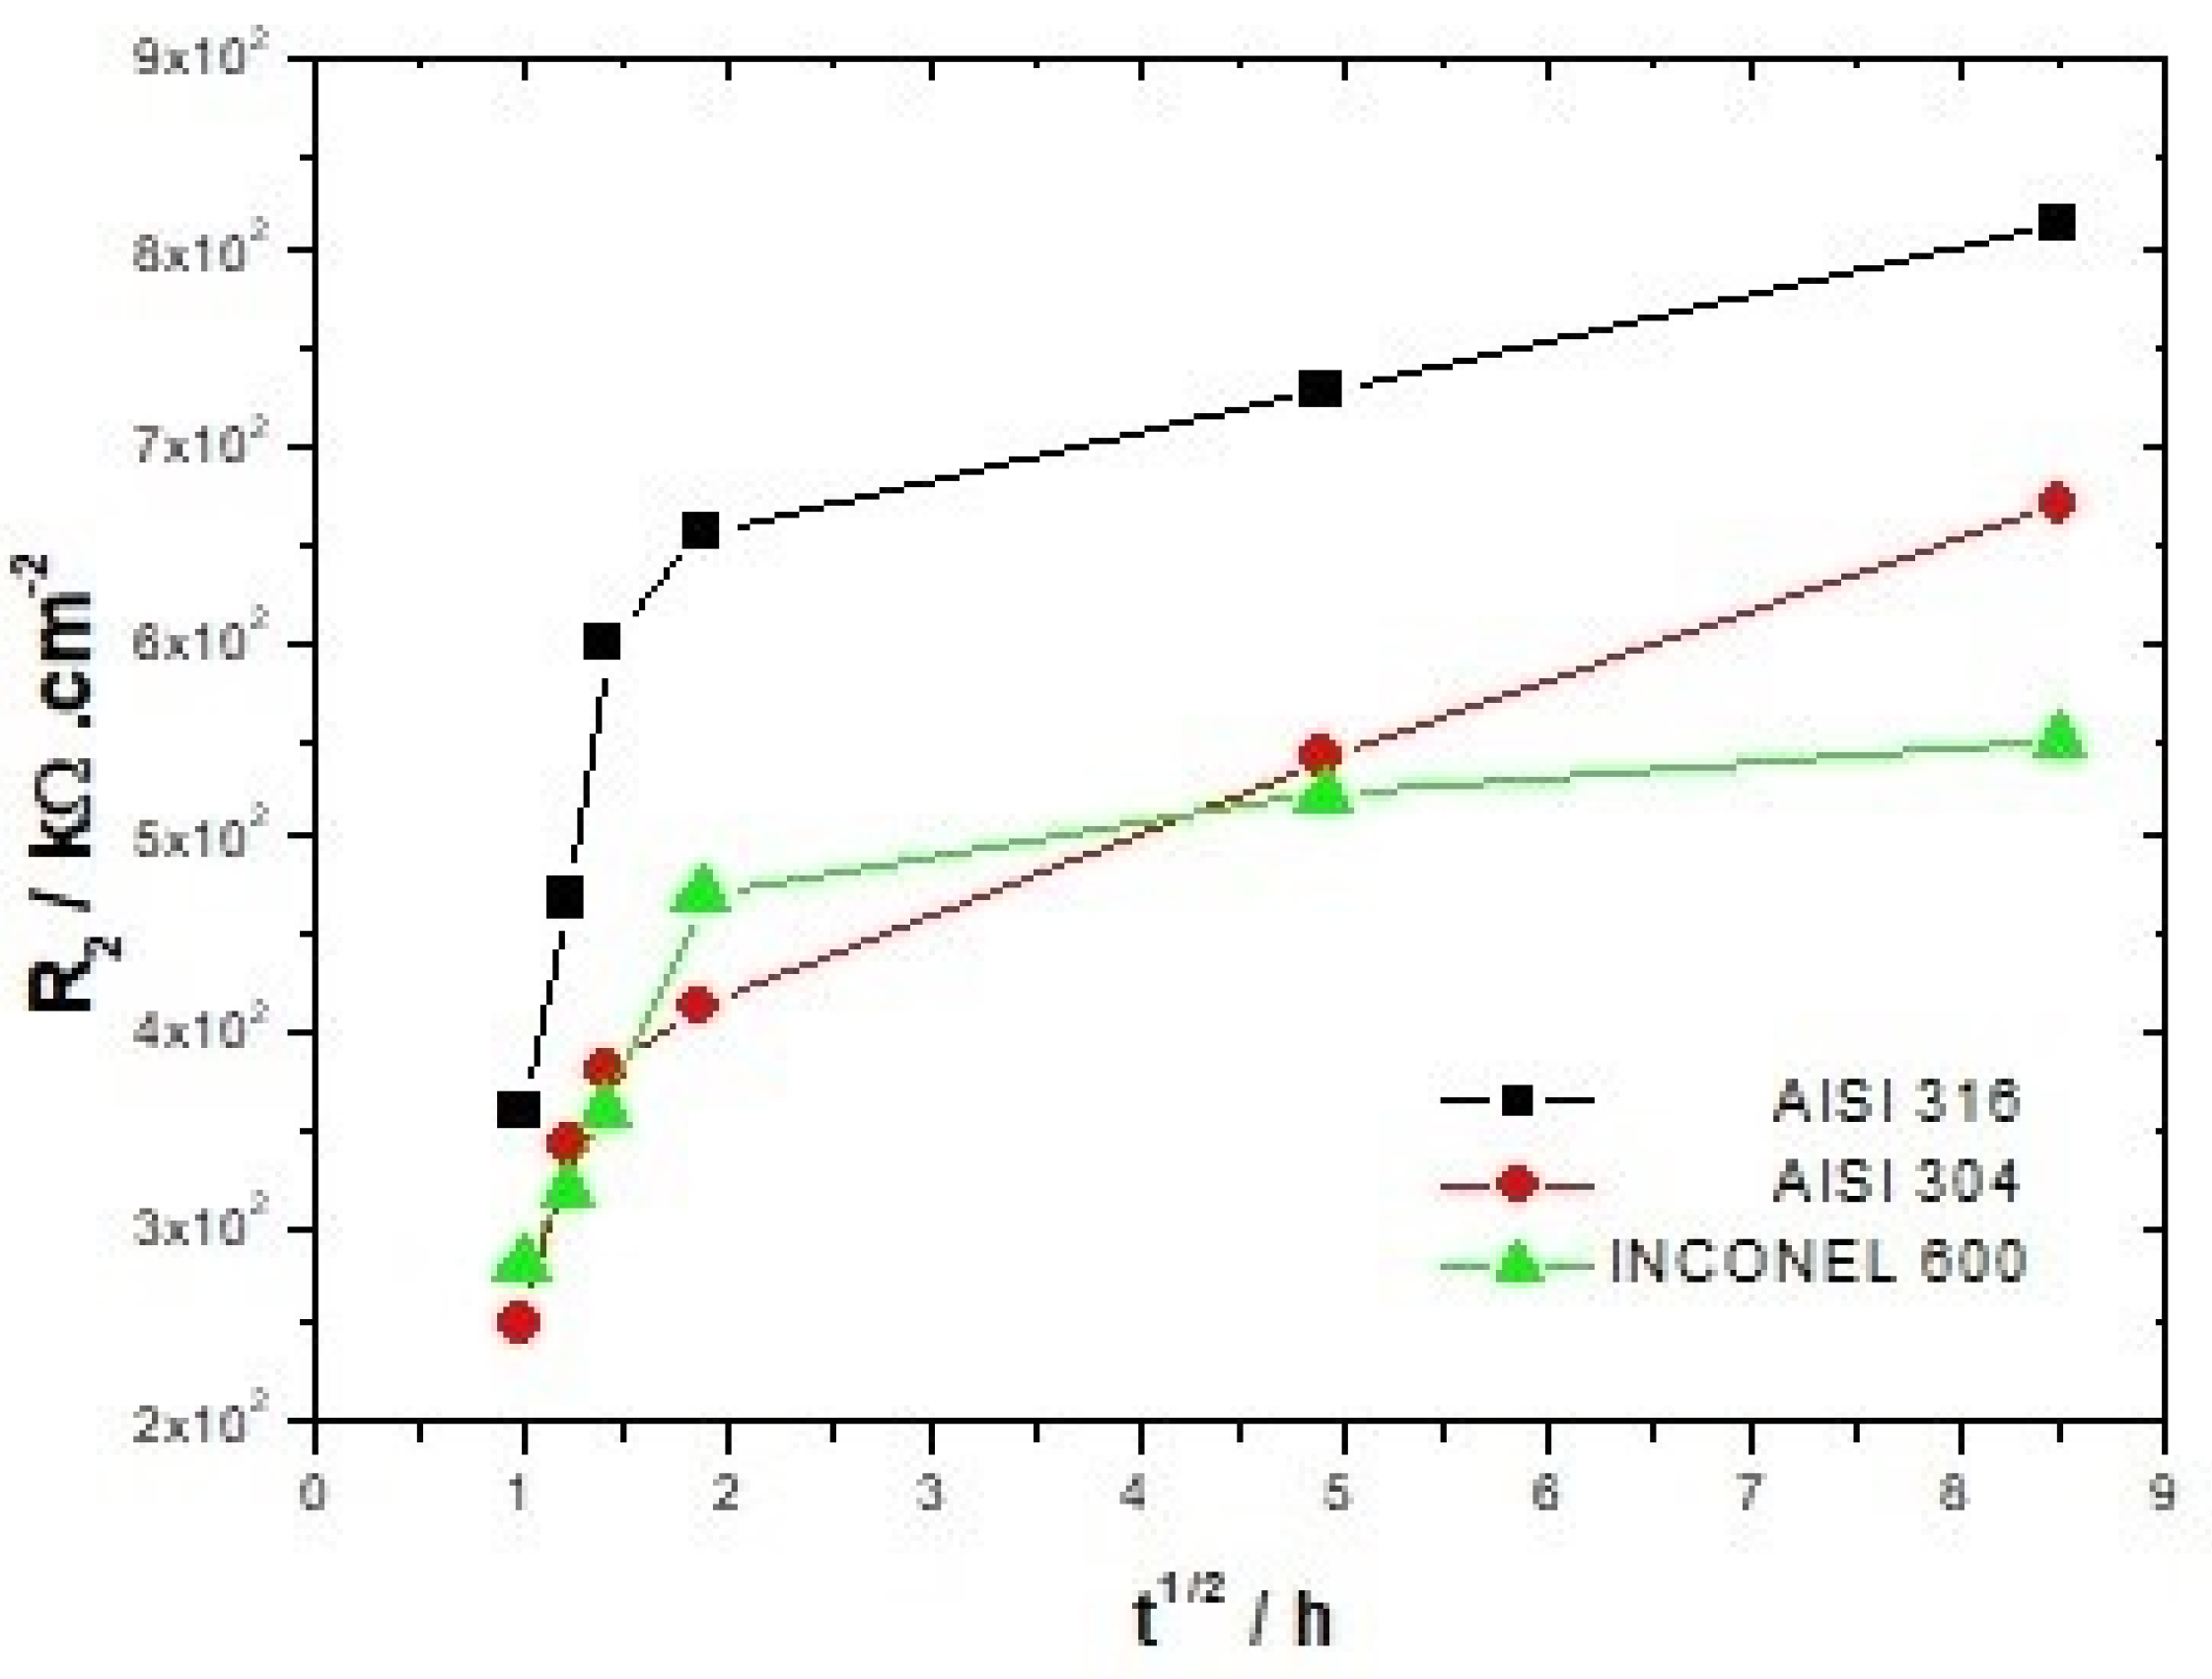
For all three alloys, the values obtained by fitting CPE1 (between 34.0 and 7.9 × 10⁻⁶ Ω−1cm−2 s−n) indicate that it can be assimilated to the capacity of the double layer. The increase for both types of stainless steel of the charge transfer resistance R1 from 20.4 to 69.7 kΩ/cm2 for AISI 316 and from 28.6 to 81.1 kΩ/cm2 for AISI 304 with the increase of the immersion time, shows the increasing difficulty that the charge transfer process can encounter to be achieved. Thus, this hypothesis seems to be relatively in line with the increase in resistance R2 from 459.1 to 993.9 kΩ/cm2 for AISI 316 and from 251.2 to 749.9 kΩ/cm2 for AISI 304 (Figure 6). The CPE2 and R2 parameters associated with the redox process that can take place within the film are affected by the immersion time. One of the possible reactions that contributes to this process is represented by the following equation [26]:
Fe3O4 + OH− + H2O ↔ 3FeOOH + e−
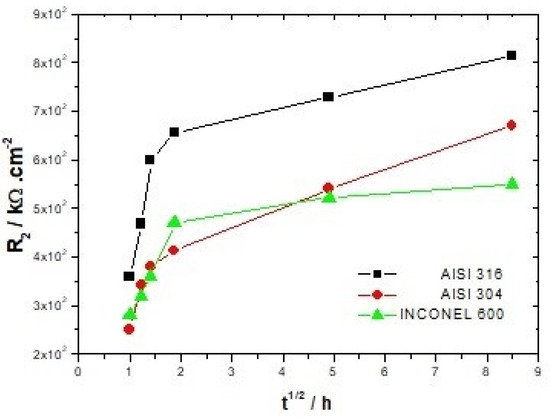
Figure 6.
Evolution of the resistance of the film R2 as a function of immersion time.
As expected, the barrier properties of passive films increase with immersion time [9,26]. For stainless steel, it is recognized in the literature that the increase in film resistance is due to the enrichment of chromium oxide. The inner layer of the film adhering to the substrate is composed of Cr2O3 oxide, which has the properties of an insulator. The outer layer is essentially composed of iron oxide. As shown by Addari et al. [9], the aging of the films in alkaline environments gives rise to a predominance of the oxide Fe2O3.
Compared to AISI 304, for example, Inconel 600 does not show much difference between the spectra acquired at t = 1 h and t = 72 h. The linear character of the capacitive loop at low frequencies at t = 24 h and t = 72 h is less clear than for the other two alloys, suggesting that the films formed naturally on Inconel 600 in alkaline media would be less effective. This is because the value of the polarization resistance Rp (which is obtained by extrapolation of the Nyquist curve) at t = 72 h for Inconel 600 is lower than for stainless steel. As for the stainless steel, the film formed on the Inconel 600 also has a bilayer structure with the Cr2O3 [14] enriched inner layer and the outer layer formed essentially by Fe2O3 oxide and NiO [37]. Other studies suggest that nickel oxide would be present in that structure as Ni(OH)2 [37,47]. With the increase of the immersion time, the diameter of the capacitive arc of the Nyquist diagrams (Figure 4A,B) is increased for both types of stainless steel. However, the values of the resistors R2 greater for AISI 316 represented in Table 3 and Table 4 show that the films formed on AISI 316 are more protective than those formed on AISI 304 in alkaline media. This difference between the two types of stainless steel is due to the presence of molybdenum in the chemical composition of AISI 316 stainless steel, which promotes a more stable and protective chromium oxide enrichment [38].
It can be seen in Figure 6 that the resistance R2 attributed to the film increases continuously up to 72 h of immersion for both types of stainless steel. The Inconel 600 displays a strong increase in R2 during the first hours of immersion, and beyond 3 h 30, this increase becomes smoother. Therefore, it appears that the formation of a stable passive film is faster on Inconel 600 than on stainless steel. This may be due to the fact that the films formed on the nickel-based alloys are thinner than those formed on the stainless steel [37,48]. However, the values of R2 (Table 3, Table 4 and Table 5) and the Nyquist figures indicate that the films formed on Inconel 600 in alkaline environments and at ambient temperatures do not appear to be more protective than those formed on stainless steel. On the contrary, it seems that the films formed on AISI 316 are more protective in this alkaline environment.
3.2.2. Atomic Force Microscopy
Some AFM images (500 nm × 500 nm) of the passive films formed on the polished substrates (see Figure 1 for the memory of the bare substrate) as a function of the immersion time in an alkaline solution simulating reinforced concrete (NaOH at pH = 13) are given in Figure 7, Figure 8 and Figure 9 for the two types of stainless steel, AISI 304 and AISI 316, and Inconel 600 samples respectively. In Figure 7A and Figure 8D, representing the surfaces of the stainless steel after 30 min immersion, polishing grooves can be observed and the first stage of passivation, which consists of the formation of small circular oxide grains distributed over the entire active surface and growing along trenches due to the polishing steps. The size of these grains increases with the immersion time until coalescence at t = 3 h1/2, which can be seen on the AFM images (see Figure 7B and Figure 8E). Coalescence generates the covering of the whole surface, and the growth becomes less and less visible. On the surface of Inconel 600, we do not observe the same behavior as for stainless steel. Indeed, in Figure 9A, which represents the surface Inconel 600 after t = 1/2 h immersion, the polishing grooves are less visible than for stainless steel because the oxide film may be thicker. We noticed that the small oxide structures do not have a well-defined shape on the entire surface. As for AISI 304 and 316 at an immersion time of t = 3 h1/2, Inconel 600 shows the formation of oxide grains that cover its entire surface (Figure 9B). To quantify these observations, we determine the Root Mean Square (RMS) surface roughness parameter for the different immersion times using the following expression (The used formula is one of the mathematical definitions of RMS surface roughness).
where is the mean height of the height distribution hij. In Figure 10, we show the variation of the RMS roughness as a function of the square root of the immersion time. The square root of time was used only out of better data presentation matter. For all three alloys, the RMS value increases at t = 1/2 h, consistent with the value of the bare substrate and decreases until reaching a minimum at t = 1 h for the AISI 316 and Inconel 600 and at t = 3 h1/2 for the AISI 304. At longer immersion times, the roughness increases again for the three alloys; for the AISI 316, a maximum is reached at t = 24 h, then will decrease until t = 72 h. The decrease of the RMS for Inconel 600 is between t = 3 h1/2 and t = 24 h after, the RMS seems to be constant. For the three alloys, when the immersion time is low, it is reasonable to say that the RMS may be controlled by the surface roughness of the bare substrate. On the surface of the stainless steel (Figure 7A and Figure 8A), we observed the formation of small oxide grains isolated on the entire surface that will promote the increase of RMS at t = 1/2 h. We noticed that the size of these grains is much smaller than the ones observed in Y. Li et al.’s work [26] on carbon steel. With the expansion of immersion time in the alkaline solution, the grain size will tend to increase until coalescence (Figure 7B and Figure 8E); this will cause the RMS to decline. This decrease results from the fact that the size of the grains increases progressively with the time of immersion, causing a covering of the trenches. Therefore, the oxide film has thickened. The influence of the substrate is then lost, and the RMS parameter is essentially controlled by the future growth of the passive film.
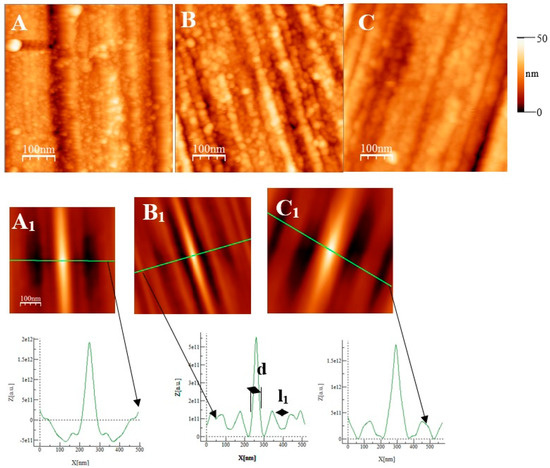
Figure 7.
AFM images (500 nm × 500 nm) of passive films grown on AISI 304 substrates after polishing as a function of immersion time(t). (A) ½ h, (B) 3 h ½, and (C) 72 h. (A1), (B1), and (C1) are self-correlation images calculated using images (A), (B), and (C), respectively, as input with typical cross-sections allowing to determine a periodicity named l1 and the mean oxide grain diameter d.
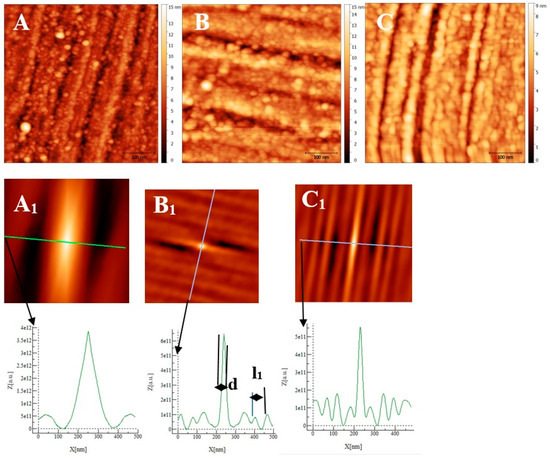
Figure 8.
AFM images (500 nm × 500 nm) of passive films grown on AISI 316 substrates after polishing as a function of immersion time. (A) ½ h, (B) 3 h ½, and (C) 72 h. (A1), (B1), and (C1) are self-correlation images calculated using images (A), (B), and (C), respectively, as input with typical cross-sections allowing to determine a periodicity named l1 and the mean oxide grain diameter d.
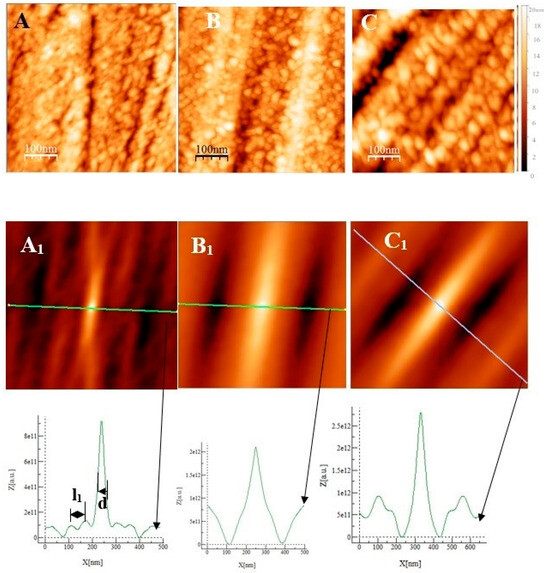
Figure 9.
AFM images (0.5 µm × 0.5 µm) of the passive film grown on Inconel 600 substrates after polishing (Figure 1C) as a function of immersion time: (A) ½ h, (B) 3 h ½, and (C) 72 h. (A1), (B1), and (C1) are self-correlation images calculated using respectively images (A), (B), and (C) as input with typical cross-sections allowing to determine a periodicity named l1 and the mean oxide grain diameter d.
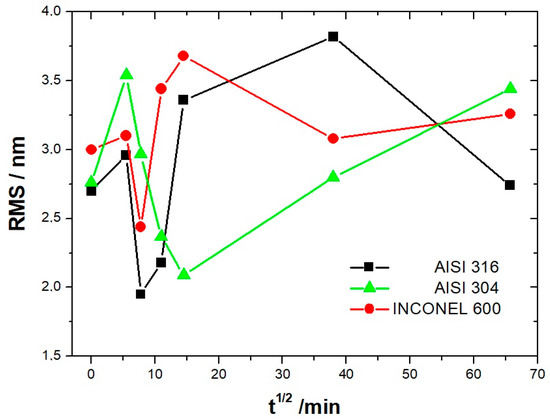
Figure 10.
Evolution of the RMS roughness as a function of immersion time for the AISI304, AISI316, and Inconel 600 samples.
Unlike stainless steel, the Inconel 600 at t = 1/2 h (Figure 9A) shows a porous film that covers entirely the substrate. This film is constituted of oxide grains of a larger size and round or elongated shapes. When the immersion time reaches t = 3 h 1/2, the same characteristics are found as for the stainless steel, the presence of round oxide grains that develop until they reach coalescence. The obtained film covers the polishing grooves, and the effect of the substrate on the RMS becomes less important. At immersion times of t = 24 h and t = 72 h, the RMS is almost identical, and polishing scratches are less and less visible (Figure 9C). According to the literature [9], this can be due to the thickening of the oxide film with increasing immersion time.
From Figure 10 and the above discussion, we can determine the coalescence time of the oxide grains, noting tcoal corresponding to the immersion time where the RMS reaches a minimum before increasing again and corresponds to a substrate completely covered by an oxide layer that can act as an efficient barrier against corrosion. This affirmation will be confirmed by the SKPFM measurements (Section 3.2.3). For Inconel 600 and AISI316 substrates, we obtain the same value of tcoal = 60 min. For AISI304, tcoal = 210 min is slightly longer than for the two other substrates. Moreover, the roughness of the oxide formed on Inconel 600 evolves slowly after 24 h of immersion. The results of the AFM measurements seem to confirm those obtained by EIS and the analysis of Figure 3C, which shows that the Nyquist diagrams obtained at t = 24 h and t = 72 h are almost identical. The value of the resistance R2 of the film was found to be almost identical to the one measured at t = 24 h and t = 72 h. Therefore, there is a correlation between electrochemical impedance measurements and the morphology modification of the oxide surface. To obtain a better inside into the growth mode of the oxide islands on the trenches of the several substrates, we again calculated the self-correlation function images of each topographic image in Figure 7, Figure 8 and Figure 9. From these images, we can extract two characteristic lengths. Since we observe a periodicity in the cross-sections (see Figure 7A1,B1,C1, Figure 8A1,B1,C1 and Figure 9A1,B1,C1), we determine a periodicity l1. The width of the central peak at half-maximum taken in the direction of the periodicity gives us access to the mean diameter d of the oxide grains. In fact, since clearly the islands grow and coalesce first in the direction perpendicular to the periodicity that corresponds to parallel trenches due to the polishing steps, we can determine only a mean diameter in the direction of the periodicity. In the perpendicular direction, the oxide islands are contiguous since the density of nucleation centers for oxide islands is so important for the trenches. Therefore, for an immersion time shorter or equal to 30 min (see Figure 7A), the diameter of an island is great enough to allow the overlapping of neighborings islands along each trench. The results for l1 and d as a function of immersion time for the three substrates using self-correlation images, such as Figure 7 and Figure 8 (not all images showed), are given in Table 6.
Table 6.
Periodicity l1 and mean oxide grain diameter d as a function of immersion time for the three substrates, as deduced from self-correlation function image calculations (for examples, see Figure 7, Figure 8 and Figure 9 and related cross-sections). The time t = 0 corresponds to the bare substrate after the polishing steps and l to the mean distance between two trenches, as determined in Figure 1.
As can be deduced from the evolution of d and l1 with the immersion time, the growth mechanism is always the same, whatever the substrate. The first oxide islands grow on the trenches, acting as a source for the nucleation centers. In this case, the mean diameter d is smaller than the average distance l between the trenches, and thus, we observe a periodicity l1 that corresponds to l. Therefore, the bare substrate remains visible in the topography image.
At immersion times less than 30 min, the oxide islands are separated, and coalescence along the trenches occurs at t = 30 min (for example, see image A in Figure 7 and Figure 9). At this time, the mean diameter d is large enough and the density of nucleation great enough to allow the neighboring islands to touch each other, conducting to lines of islands separated by a periodicity l1 equal to l. Afterward, the mean diameter d increases and remains lower than l/2. At an immersion time corresponding to tcoal, as determined previously, the oxide islands coalescence also in the direction of the periodicity because d became near to l/2. At this time, we notice, experimentally, that l1 became 2 × l, showing that the growth remains under the influence of the substrate polishing steps. It is only after an immersion time longer and equal to 3 h that the periodicity l1 disappears. After this time, the growth is not more under the control of the trenches, i.e., under the control of the bare substrate topography. Afterwards, d increases slowly. The only difference between the samples is that the coalescence in the direction perpendicular to the trenches occurs at a longer immersion time for AISI316 than for the AIS304 and Inconel 600 samples, as observed on the RMS roughness variations as a function of immersion time, as shown in Figure 10.
3.2.3. SKPFM Measurements
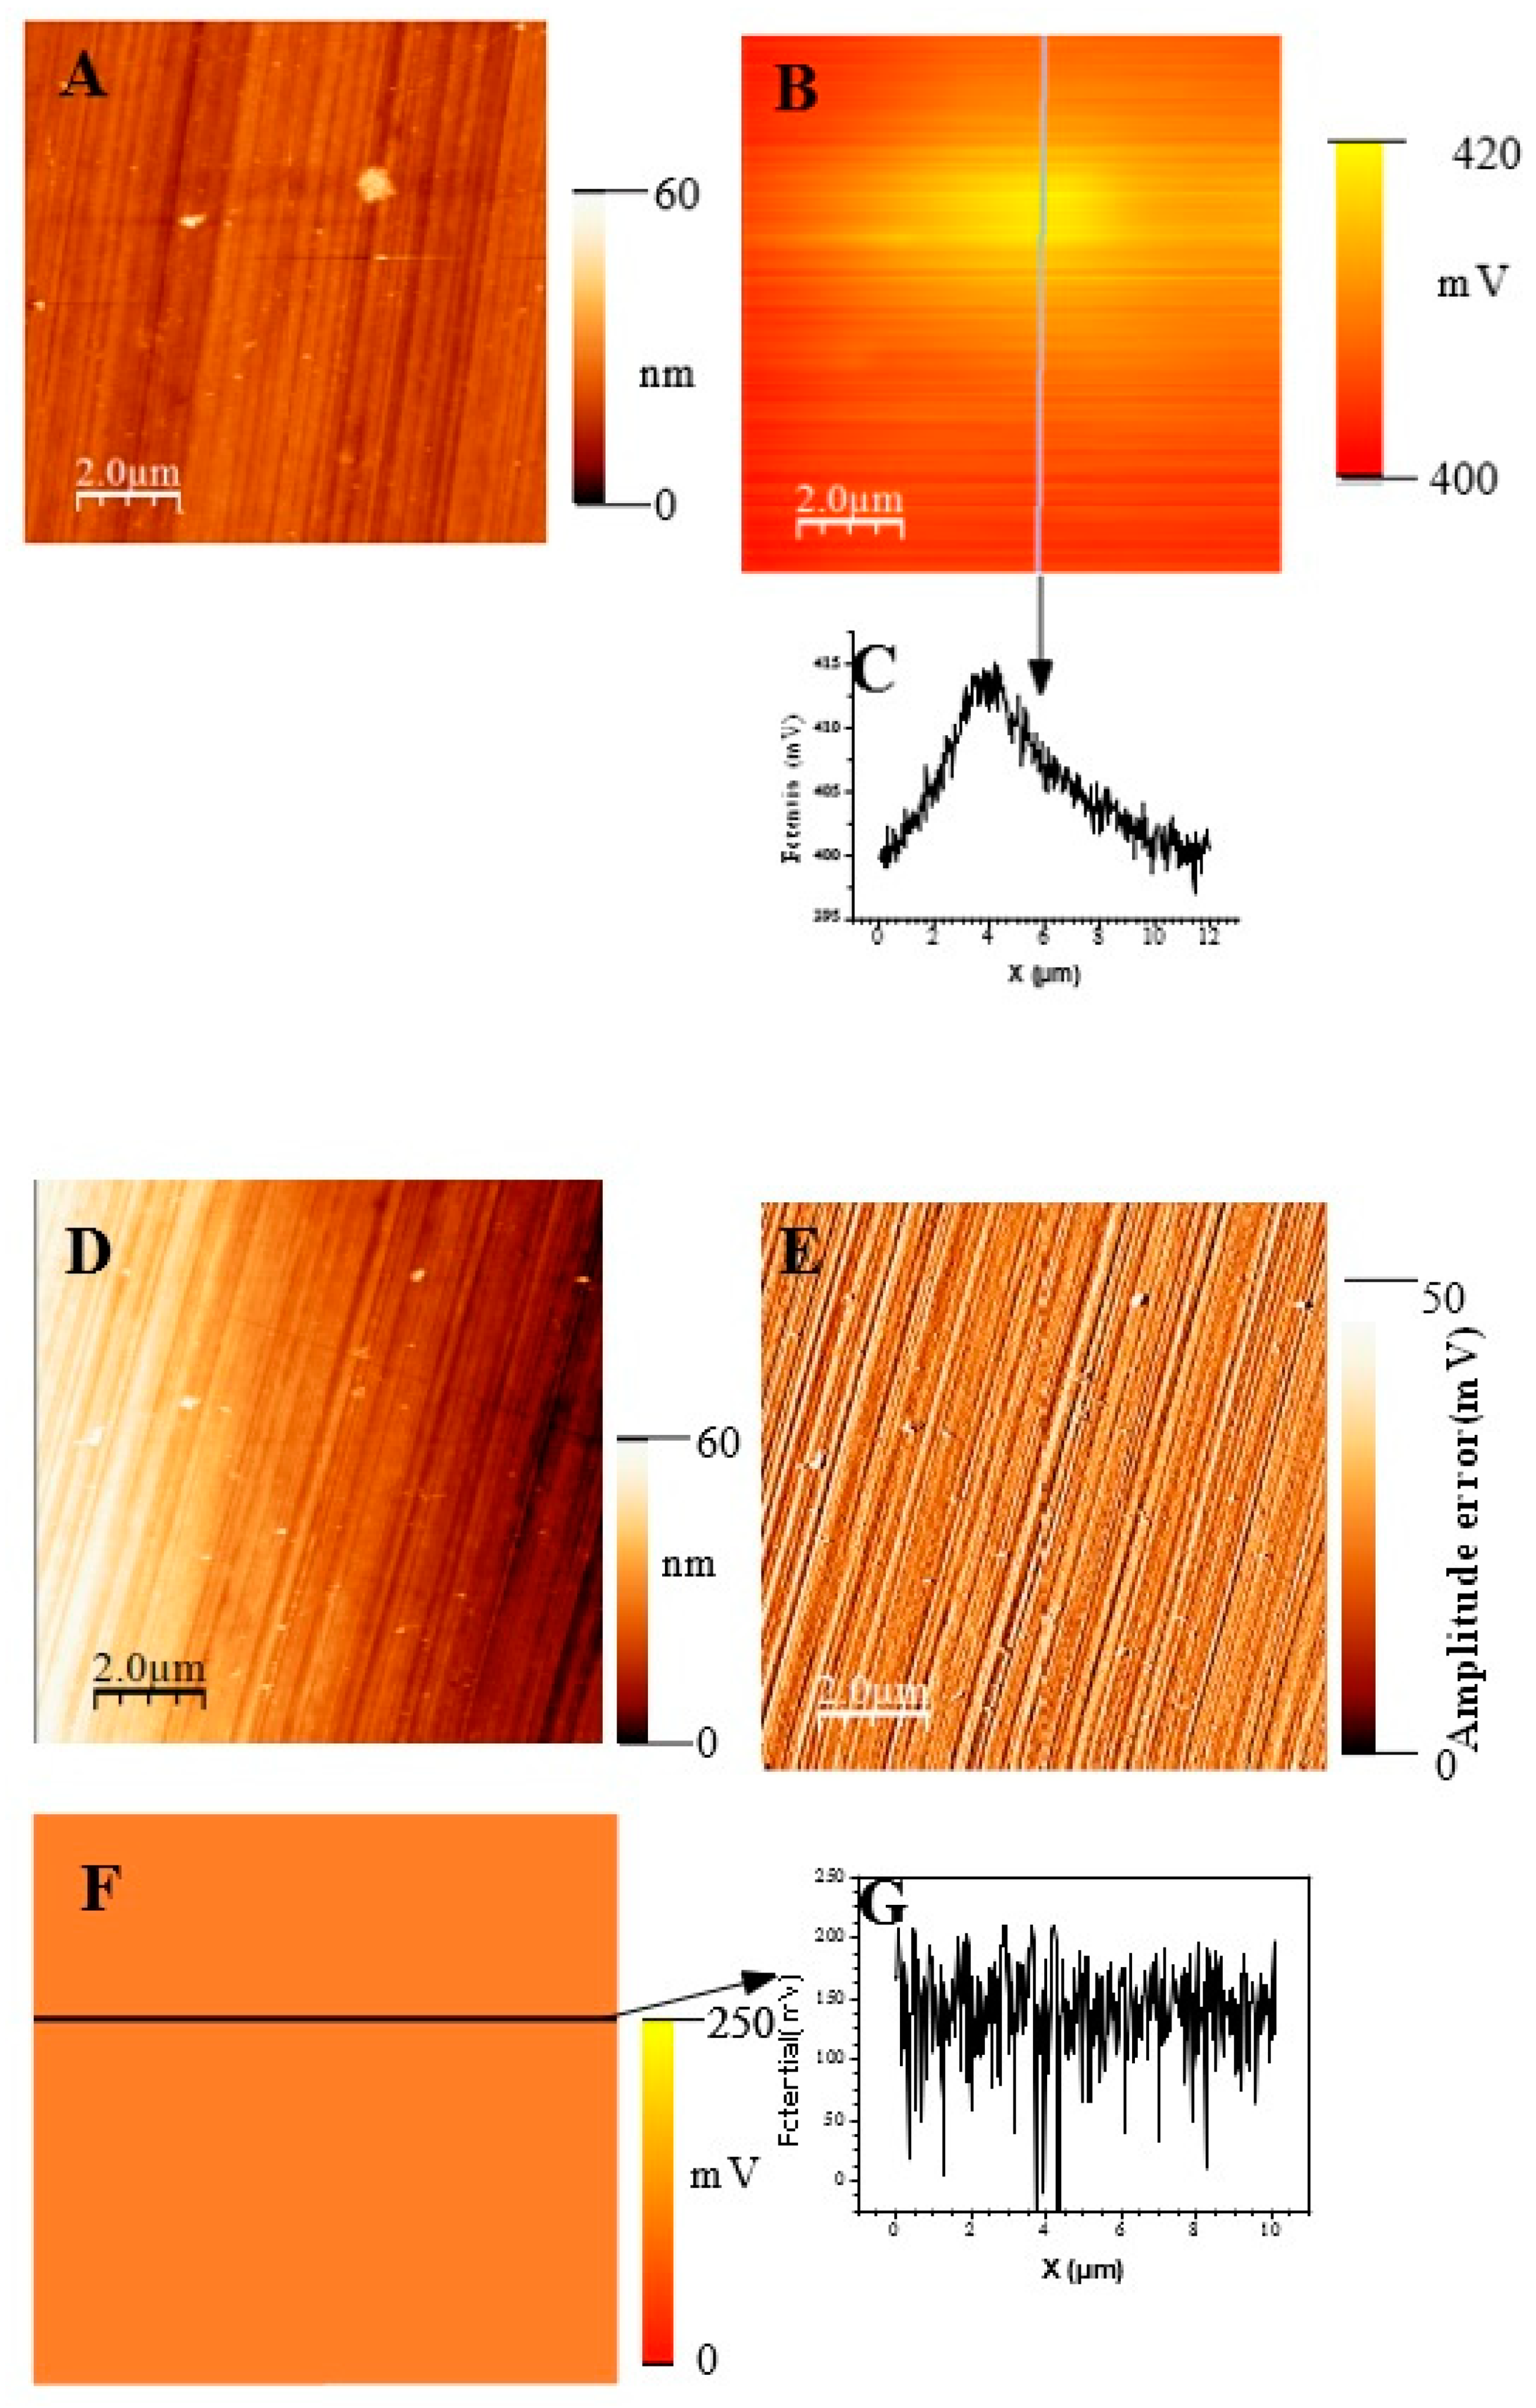
In Figure 11, we show topographic AFM and SKPFM potential images of native films grown on AISI316 at three selected immersion times: at t = ½ h (before coalescence), at t = 3½ h (oxide islands coalescence) at t = 72 h (the native film is complete). Notice that AFM and SKPFM images are taken simultaneously at the same place. As can be seen on the potential images (F, J) and contrarily to thermally grown oxide layers [21], we observe that the surface potential is very homogeneous over the entire analyzed surface (size: 10 µm × 10 µm) since only a very weak spatial variation around a mean value of the surface potential (less than 10 mV) was observed for the native films grown on AISI316 and for all immersion times. This result is clearly highlighted by the different sections (see Figure 11G and Figure 11K, respectively) along the lines of potential images Figure 11F and Figure 11J, respectively. The same results (a very weak spatial variation around a mean value of the surface potential) are obtained for Inconel 600 as for AISI 404 304 samples. Therefore, we can plot the mean value of the surface potential as a function of immersion time, as shown in Figure 12D,E,F for the three substrates.

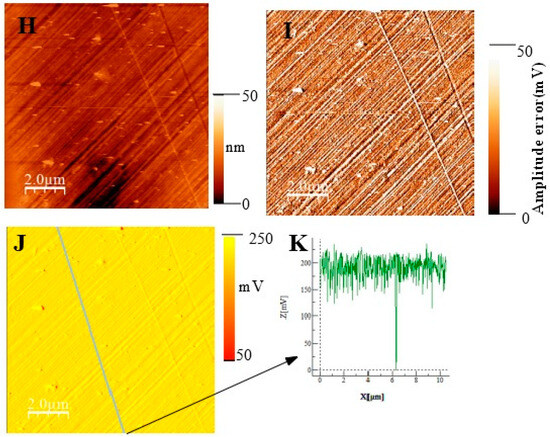
Figure 11.
(Large scale (10 µm × 10 µm) topographic AFM and corresponding SKPFM images for three different immersion times measured for the AISI316 sample. t = 30 min (A) Surface topography; (B) potential image (SKPFM) associated to image (A); (C) cross-section along the line showed on image (B) showing the potential variation across the potential image t = 1 h 30; (D) surface topography; (E) AFM error image associated to image (D); (F) potential image (SKPFM) associated to image (D); (G) Cross-section along the line showed on image (F) showing the potential variation across a mean value for the potential image. T = 72 h (H) surface topography; (I) AFM error image associated with image (H); (J) potential image (SKPFM) associated with image (H); (K) Cross-section along the line showed in image (J) showing the potential variation across a mean value for the potential image.
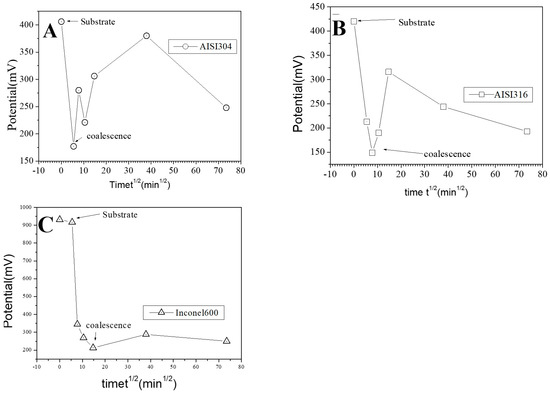
Figure 12.
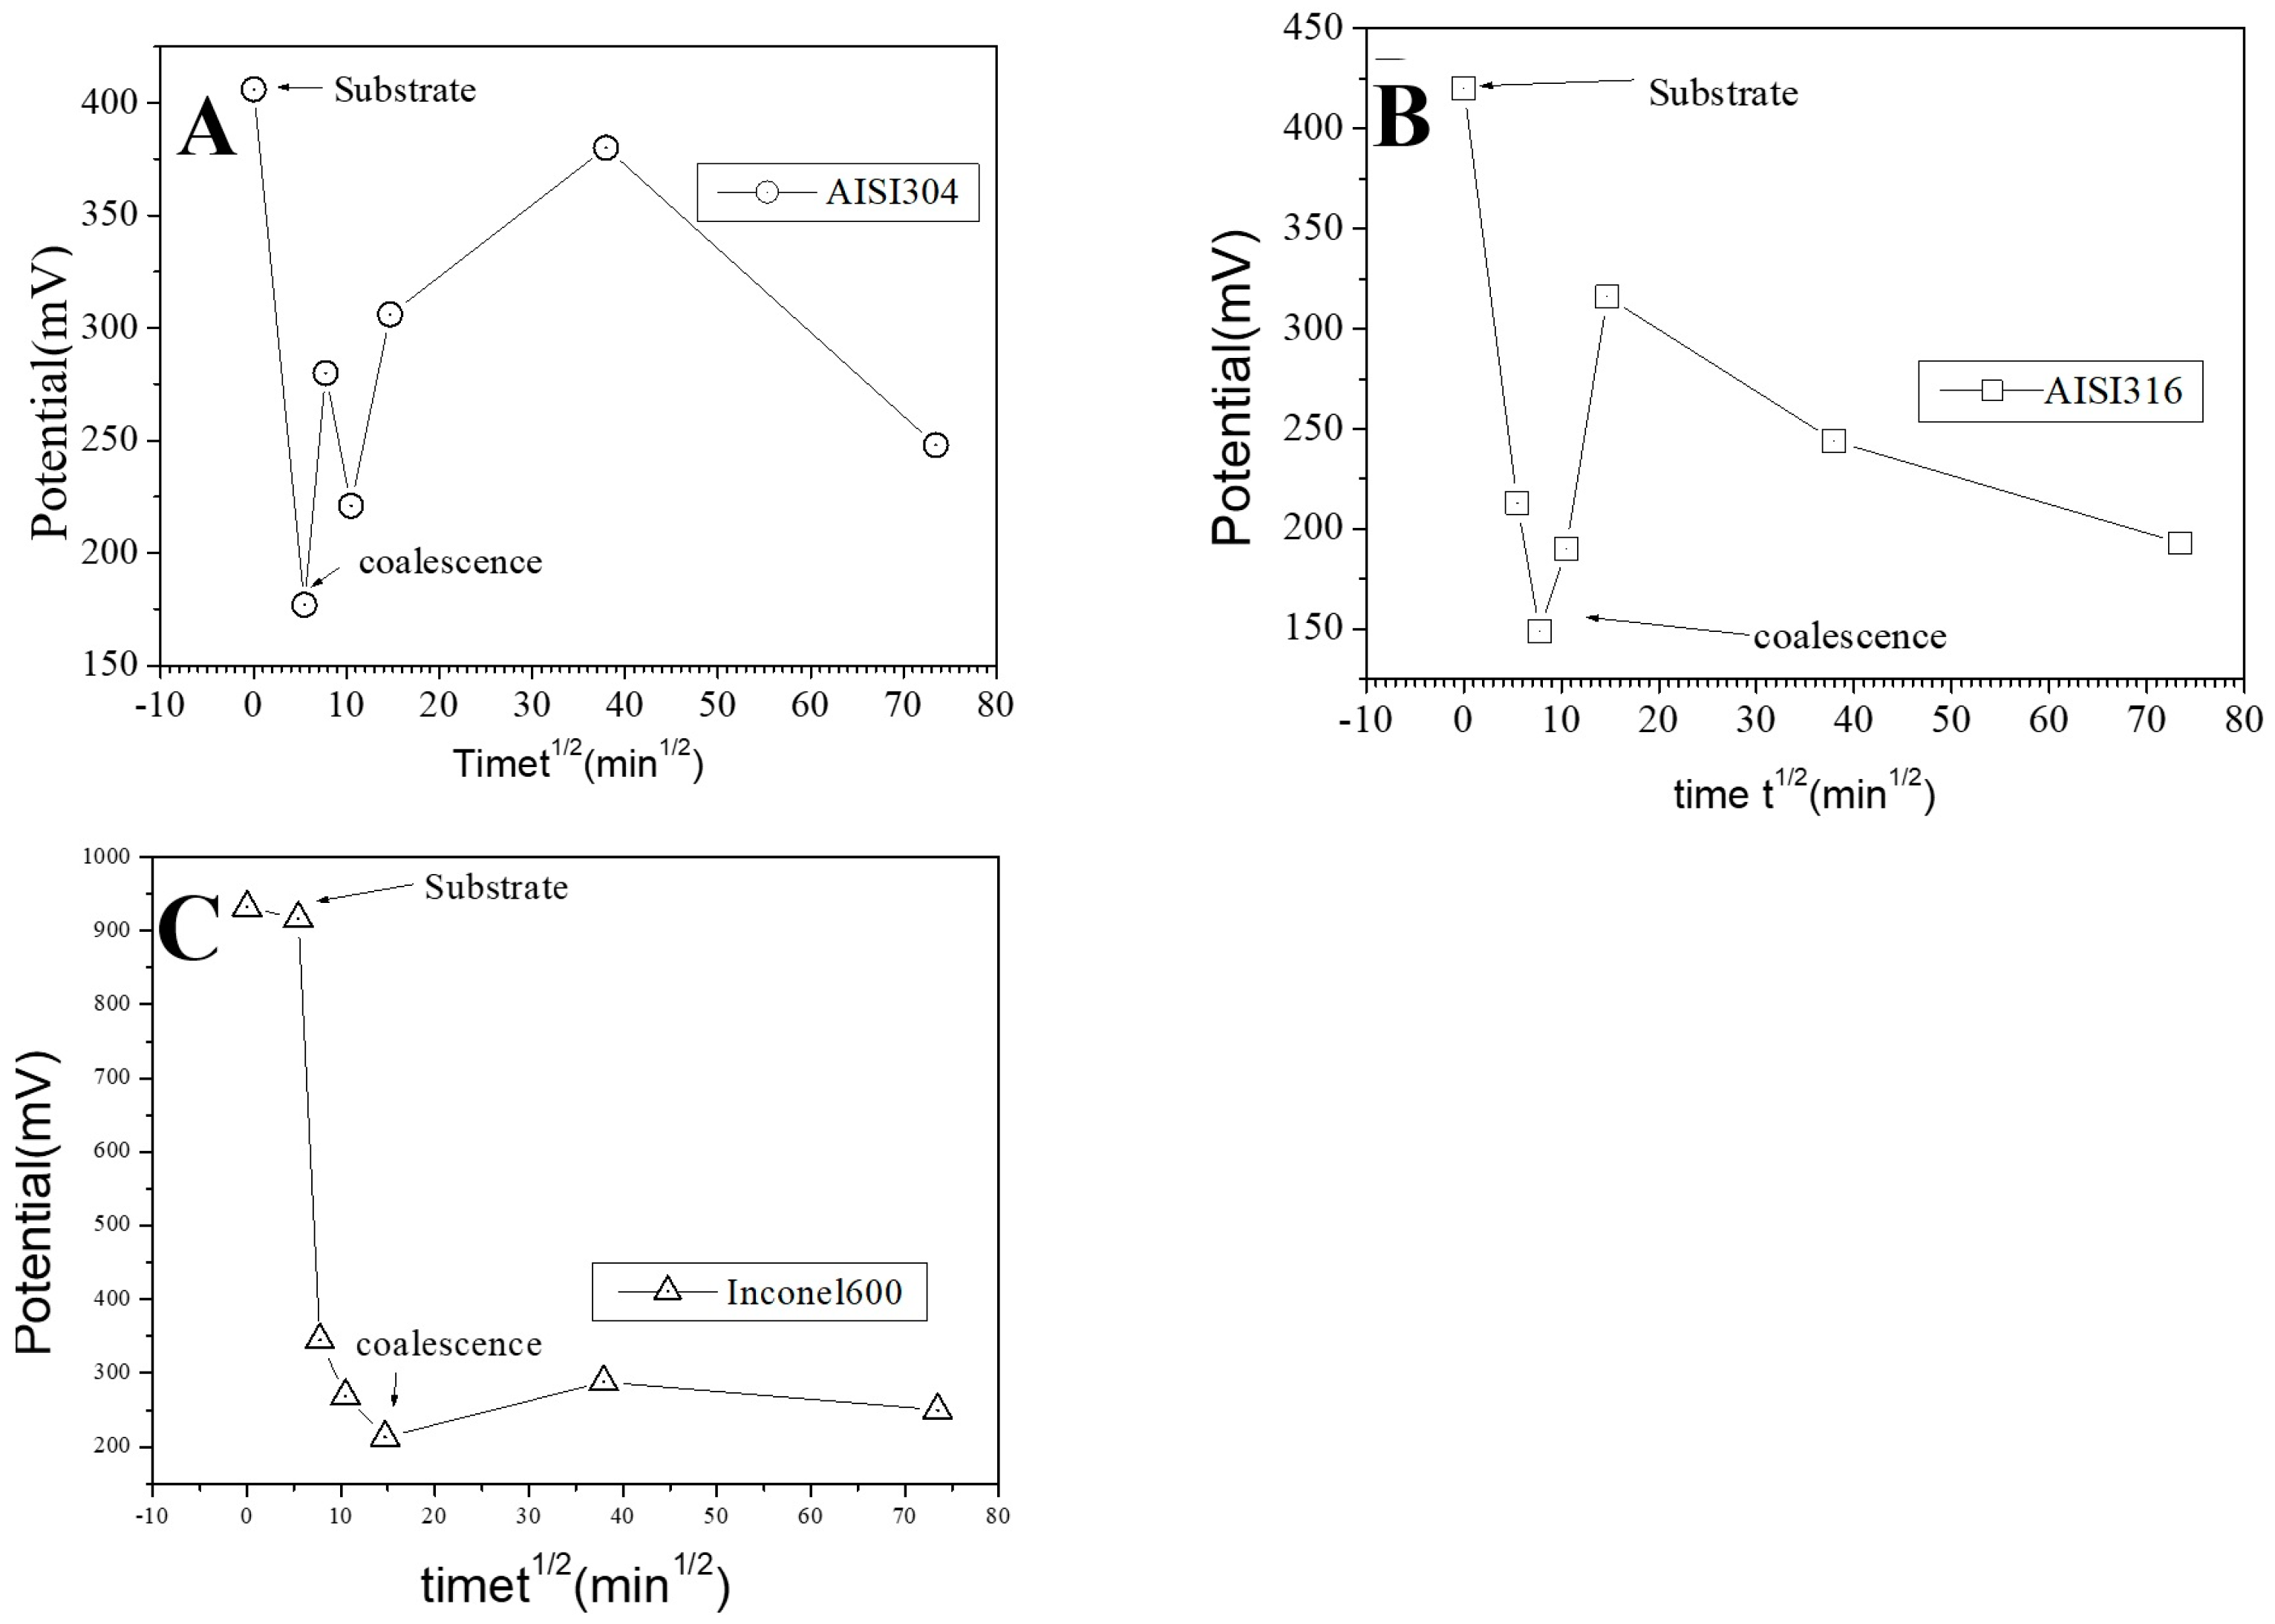
Evolution of the mean surface potential as a function of the square of immersion time (t½) for the AISI304 (A), AISI316 (B), and Inconel 600 (C) samples.
As explained in the literature, the SKPFM techniques give direct access to the work function difference between the sample surface and the tip. By taking some care, this technique allows for a chemical analysis of the surface composition at the micrometric scale. The results of surface potential measurements as a function of the square of immersion time (t½) are shown in Figure 12 for all substrates. Clearly, in every case, the bare substrate has much higher potential (410 mV for AISI304 and AISI316, 920 mV for Inconel 600). It seems clear that the formation of the first small oxide grains at t = ½ h conduct to a significant decrease of the potential value until coalescence is reached. Afterward, the potential increases again, reaching a maximum of 360 mV (320 mV for AISI316) at t = 24 h and decreases slowly to 250 mV at t = 72 h for AISI304. For AISI316, the maximum is reached later at t = 4 h, and the potential decreases at around 200 mV, then stabilizes. The potential evolution is different for Inconel 600 since, after coalescence, the potential stabilizes faster than for AISI304 and AISI316 to a mean value of around 250 mV.
Our interpretation of the SKPFM measurements is based on the literature [49,50]. Thus, at t = ½ h (early stages of passivation), the significant decrease in Volta potential seen in Figure 12 was caused by the growth of small grains of iron oxide. The high value of the potential observed in our images is due to the presence of a chromium-enriched phase on the surface of the alloys. However, it is important to remember that the SKPFM technique only probes the first nanometer of the surface. This is why we attribute the cause of the decrease in the value of the surface potential—after longer immersion times (t ˃ 24 h for AISI304 and Inconel 600 and t ˃ 3 h ½ for AISI 316) to the obtaining of a compact homogeneous film in which the iron oxide layer progressively covers the chromium oxide. This explanation is consistent with the literature description of passive film growth mechanisms [19,20]. The films formed have a bilayer structure: the inner layer, which is in direct contact with the alloy, is highly enriched in chromium oxide and the outer layer, which is in contact with the electrolyte, is essentially composed of iron oxide.
The SKPFM images and potential measurements show that the p–n heterojunction [21,51] consisting of the outer layer of n-type iron oxide and the inner layer of p-type chromium oxide is formed at t = 72 h. Consequently, although the passive layer is very thin (of the order of a few nanometers), it is sufficiently compact (not very porous) to form an effective barrier against corrosive agents. The fact that the surface potential is very homogeneous shows that the chemical composition of the passive layer is very homogeneous, unlike oxide layers formed thermally. In fact, the presence of chromium oxide localized in a certain area of the outer layer forms a corrosion center. Localized degradation of the p–n junction will therefore encourage the phenomena of corrosion, which is not the case for our films formed after 72 h of immersion.
4. Conclusions
This work focused on the passivation of stainless steel (AISI 304 and AISI 316) and Inconel 600 in an alkaline solution that simulates reinforced concrete at room temperature. The films are formed by cyclic voltammetry and under natural conditions (OCP). The results obtained show:
- (1)
- The films formed by CV are thicker for AISI 304 than for AISI 316 and Inconel 600. The determination of the residual current density in the passivation zone showed that the films formed on the three alloys are protective. However, the presence of molybdenum in the chemical composition of AISI 316 enables the formation of a film that is more stable and more resistant to ion transport. Impedance measurements confirm these results.
- (2)
- EIS measurements have shown that the resistance of spontaneously formed films increases with immersion time for all three alloys. As with CV-formed films, AISI 316 also seems to be the alloy that forms the most resistant film. The film formed on Inconel 600 becomes stable faster than those formed on stainless steel. However, the electrochemical measurements did not show better protection for the film formed on Inconel 600 under these experimental conditions.
- (3)
- The AFM measurements show that the growth of the oxide film is under the control of the bare substrate topography and roughness until an immersion time is reached where coalescence occurs. The coalescence time depends on the substrates. After coalescence, the small oxide grains develop on the entire surface until they cover it and, therefore, form a stable homogeneous film that becomes more and more protective with increasing immersion time. This layer is also very chemically homogeneous, as shown by SKPFM images. The passive layer is, therefore an efficient barrier against corrosion. We have clearly highlighted the correlation between EIS measurements and topographic modifications.
Author Contributions
Conceptualization, N.M., N.E.H. and J.L.B.; Methodology, N.E.B., N.M., N.E.H. and J.L.B.; Validation, N.E.B. and J.L.B.; Formal analysis, N.E.B., K.D.K. and J.L.B.; Investigation, N.E.B., H.R., E.D., A.F., K.D.K., M.M.H. and J.L.B.; Resources, E.D., A.F. and K.D.K.; Data curation, H.R. and M.M.H.; Writing—original draft, N.E.B. and J.L.B.; Writing—review and editing, N.E.B. and J.L.B.; Supervision, N.M. and J.L.B.; Project administration, N.M. and J.L.B.; Funding acquisition, N.E.H. and M.M.H. All authors have read and agreed to the published version of the manuscript.
Funding
This research was funded by the French–Algerian exchange and research program Tassili (Project code CMEP no. 10MDU801).
Institutional Review Board Statement
Not applicable.
Informed Consent Statement
Not applicable.
Data Availability Statement
Data is contained within the article.
Acknowledgments
The authors are grateful to both universities they belong for the financial support (researcher grants), of this work.
Conflicts of Interest
The authors declare no conflict of interest.
References
- Joiret, S.; Keddam, M.; Novoa, X.R.; Pérez, M.C.; Rangel, C.; Takenouti, H. Use of EIS, ring-disk electrode, EQCM and Raman spectroscopy to study the film of oxides formed on iron in 1 M NaOH. Cem. Concr. Compos. 2002, 24, 7–15. [Google Scholar] [CrossRef]
- Sahoo, G.; Balasubramaniam, R. On the corrosion behaviour of phosphoric irons in simulated concrete pore solution. Corrosion Science 2008, 50, 131–143. [Google Scholar] [CrossRef]
- Wu, T.; Lu, X.; Chen, Z.; Feng, X.; Zhang, Y.; Chen, X.; Zhuang, N. Effect of alternating temperature on passivation characteristics of carbon steel in chloride-free saturated Ca(OH)2 solution. Corros. Sci. 2022, 198, 110102. [Google Scholar] [CrossRef]
- Duarte, R.G.; Castela, A.S.; Neves, R.; Freire, L.; Montemor, M.F. Corrosion behavior of stainless steel rebars embedded in concrete: An electrochemical impedance spectroscopy study. Electrochim. Acta 2014, 124, 218–224. [Google Scholar] [CrossRef]
- Andrade, C.; Keddam, M.; Novoa, X.R.; Perez, M.C.; Rangel, C.M.; Takenouti, H. Electrochemical behaviour of steel rebars in concrete: Influence of environmental factors and cement chemistry. Electrochim. Acta 2001, 46, 3905–3912. [Google Scholar] [CrossRef]
- Chakri, S.; Frateur, I.; Orazem, M.E.; Sutter, E.M.M.; Tran, T.T.M.; Tribollet, B.; Vivier, V. Improved EIS analysis of the electrochemical behaviour of carbon steel in alkaline solution. Electrochim. Acta 2017, 20, 924–930. [Google Scholar] [CrossRef]
- Freire, L.; Novoa, X.R.; Montemor, M.F. Study of passive films formed on mild steel in alkaline media by the application of anodic potentials. Mater. Chem. Phys. 2009, 114, 962–972. [Google Scholar] [CrossRef]
- Feng, X.; Wu, T.; Luo, J.-L.; Lu, X. Degradation of passive film on 304 stainless steel in a simulated concrete pore solution under alternating temperature condition. Cem. Concr. Compos. 2020, 112, 103651. [Google Scholar] [CrossRef]
- Addari, D.; Elsner, B.; Rossi, A. Electrochemistry and surface chemistry of stainless steels in alkaline media simulating concrete pore solutions. Electrochim. Acta 2008, 53, 8078–8086. [Google Scholar] [CrossRef]
- Yuan, X.; Wang, X.; Yang, H. Natural passivation behavior and its influence on chloride-induced corrosion resistance of stainless steel in simulated concrete pore solution. J. Mater. Res. Technol. 2020, 9, 12378–12390. [Google Scholar] [CrossRef]
- Monnartz, P. Iron-chromium alloys with special consideration of resistance to acids. Metallurgie 1911, 8, 161. [Google Scholar]
- Shi, J.; Li, M.; Wu, M.; Ming, J. Role of red mud in natural passivation and chloride-induced depassivation of reinforcing steels in alkaline concrete pore solutions. Corros. Sci. 2021, 190, 109669. [Google Scholar] [CrossRef]
- Zhang, Y.; Zhang, X.; Chen, S.; Liu, J.; Wang, L.; Wu, K. Corrosion behavior and passive film properties of nickel-based alloy in phosphoric acid. Corros. Commun. 2023, 9, 77–88. [Google Scholar] [CrossRef]
- Mechehoud, F.; Benaioun, N.E.; Hakiki, N.E.; Khelil, A.; Simon, L.; Bubendorff, J.L. Thermally oxidized Inconel 600 and 690 nickel-based alloys characterizations by combination of global photoelectrochemistry and local near-field microscopy techniques (STM, STS, AFM, SKPFM). Appl. Surf. Sci. 2018, 433, 66–75. [Google Scholar] [CrossRef]
- Haupt, S.; Strehblow, H.H. Corrosion, layer formation, and oxide reduction of passive iron in alkaline solution: A combined electrochemical and surface analytical study. Langmuir 1987, 3, 873–885. [Google Scholar] [CrossRef]
- Sosa, E.; Cabrera-Sierra, R.; Oropeza, M.T.; Hernández, F.; Casillas, N.; Tremont, R.; González, I. Electrochemically grown passive films on carbon steel (SAE 1018) in alkaline sour medium. Electrochim. Acta 2003, 47, 1665–1674. [Google Scholar] [CrossRef]
- Haupt, S.; Strehblow, H.H. Combined electrochemical and surface analytical investigations of the formation of passive layers. Corros. Sci. 1989, 29, 163–182. [Google Scholar] [CrossRef]
- Schmutz, P.; Landolt, D. In-situ microgravimetric studies of passive alloys: Potential sweep and potential step experiments with Fe–25Cr and Fe–17Cr–33Mo in acid and alkaline solution. Corros. Sci. 1999, 41, 2143–2163. [Google Scholar] [CrossRef]
- Hakiki, N.E.; Da Cunha Belo, M. Electronic structure of passive films formed on molybdenum-containing ferritic stainless steels. J. Electrochem. Soc. 1996, 143, 3088–3094. [Google Scholar] [CrossRef]
- Hakiki, N.E.; Boudin, S.; Rondot, B. The electronic structure of passive films formed on stainless steels. Corros. Sci. 1995, 37, 1809–1822. [Google Scholar] [CrossRef]
- Maachi, B.; Pirri, C.; Mehdaoui, A.; Hakiki, N.E.; Bubendorff, J.L. Atomic Force Microscopy, Scanning Kelvin Probe Force Microscopy and magnetic measurements on thermally oxidized AISI 304 and AISI 316 stainless steels. Corros. Sci. 2011, 53, 984–991. [Google Scholar] [CrossRef]
- Armstrong, R.D.; Edmondson, K. The impedance of metals in the passive and transpassive regions. Electrochim. Acta 1973, 18, 937–943. [Google Scholar] [CrossRef]
- Chao, C.; Lin, L.; Macdonald, D.D. A point defect model for anodic passive films: III. Impedance response. J. Electrochem. Soc. 1982, 129, 1874–1879. [Google Scholar] [CrossRef]
- Hubrecht, J.; Embrechts, M.; Bogaerts, W. The metal/coating/electrolyte interfacial impedance and its global fractal model. Electrochim. Acta 1993, 38, 1867–1875. [Google Scholar] [CrossRef]
- Sánchez-Morenoa, M.; Takenouti, H.; García-Jarenoc, J.J.; Vicente, F.; Alonso, C. A theoretical approach of impedance spectroscopy during the passivation of steel in alkaline media. Electrochim. Acta 2009, 54, 7222–7226. [Google Scholar] [CrossRef]
- Freire, L.; Carmezima, M.J.; Ferreira, M.G.S.; Montemor, M.F. The passive behaviour of AISI 316 in alkaline media and the effect of pH: A combined electrochemical and analytical study. Electrochim. Acta 2010, 55, 6174–6181. [Google Scholar] [CrossRef]
- Macdonald, D.D. Reflections on the history of electrochemical impedance spectroscopy. Electrochim. Acta 2006, 51, 1376–1388. [Google Scholar] [CrossRef]
- Veleva, L.; Alpuche-Aviles, M.A.; Graves-Brook, M.K.; Wipf, D.O. Comparative cyclic voltammetry and surface analysis of passive films grown on stainless steel 316 in concrete pore model solutions. J. Electroanal. Chem. 2002, 537, 85–93. [Google Scholar] [CrossRef]
- Li, Y.; Cheng, Y.F. Passive film growth on carbon steel and its nanoscale features at various passivating potentials. Appl. Surf. Sci. 2017, 396, 144–153. [Google Scholar] [CrossRef]
- Abreu, C.M.; Cristobal, M.J.; Novoa, X.R.; Pena, G.; Perez, M.C. Characterisation of the electrochemical behaviour of cerium implanted stainless steels. Electrochim. Acta 2002, 47, 2215–2222. [Google Scholar] [CrossRef]
- Aigouy, L.; Wilde, Y.D.; Frétigny, C. Les Nouvelles Microscopies. A la Découverte du Nanomonde; Éditions Belin: Paris, France, 2006. [Google Scholar]
- Melitz, W.; Shen, J.; Kummel, A.C.; Lee, S. Kelvin probe force microscopy and its application. Surf. Sci. Rep. 2011, 66, 1–27. [Google Scholar] [CrossRef]
- Binning, G.; Quate, C.F.; Gerber, C.H. Atomic force microscope. Phys. Rev. Lett. 1986, 56, 930. [Google Scholar] [CrossRef] [PubMed]
- Freire, L.; Catarino, M.A.; Godinho, M.I.; Ferreira, M.J.; Ferreira, M.G.S.; Simões, A.M.P.; Montemor, M.F. Electrochemical and analytical investigation of passive films formed on stainless steels in alkaline media. Cem. Concr. Compos. 2012, 34, 1075–1081. [Google Scholar] [CrossRef]
- Abreu, C.M.; Cristobal, M.J.; Losada, R.; Novoa, X.R.; Pena, G.; Perez, M.C. High frequency impedance spectroscopy study of passive films formed on AISI 316 stainless steel in alkaline medium. J. Electroanal. Chem. 2004, 572, 335–345. [Google Scholar] [CrossRef]
- Abreu, C.M.; Cristobal, M.J.; Losada, R.; Nóvoa, X.R.; Pena, G.; Pérez, M.C. Comparative study of passive films of different stainless steels developed on alkaline medium. Electrochim. Acta 2004, 49, 3049–3056. [Google Scholar] [CrossRef]
- Abreu, C.M.; Cristobal, M.J.; Losada, R.; Nóvoa, X.R.; Pena, G.; Pérez, M.C. The effect of Ni in the electrochemical properties of oxide layers grown on stainless steels. Electrochim. Acta 2006, 51, 2991–3000. [Google Scholar] [CrossRef]
- Zhang, Y.; Qu, N.; Tang, X. Electrochemical analysis of passivation film formation on steel rebar in concrete. Int. J. Electrochem. Sci. 2016, 11, 5870–5876. [Google Scholar]
- Sánchez, M.; Mahmoud, H.; Alonso, M.C. Electrochemical response of natural and induced passivation of high strength duplex stainless steels in alkaline media. J. Solid State Electrochem. 2012, 16, 1193–1202. [Google Scholar] [CrossRef]
- Luo, H.; Su, H.; Dong, C.; Li, X. Passivation and electrochemical behavior of 316L stainless steel in chlorinated simulated concrete pore solution. Appl. Surf. Sci. 2017, 400, 38–48. [Google Scholar] [CrossRef]
- Pardo, A.; Merino, M.C.; Coy, A.E.; Viejo, F.; Arrabal, R.; Matykina, E. Pitting corrosion behaviour of austenitic stainless steels–combining effects of Mn and Mo additions. Corros. Sci. 2008, 50, 1796–1806. [Google Scholar] [CrossRef]
- Marijan, D.; Vukovic, M. The relationship between the growth of hydrous oxide films and stability on a differently modified inconel-600 electrode. In Materials Science Forum; Trans Tech Publications Ltd.: Baech, Switzerland, 1998; Volume 289, pp. 1091–1102. [Google Scholar]
- Lyons, M.E.G.; Brandon, M.P. The oxygen evolution reaction on passive oxide covered transition metal electrodes in aqueous alkaline solution. Part 1-Nickel. Int. J. Electrochem. Sci. 2008, 3, 1386–1424. [Google Scholar] [CrossRef]
- Kubisztal, J.; Budniok, A. Study of the oxygen evolution reaction on nickel-based composite coatings in alkaline media. Int. J. Hydrog. Energy 2008, 33, 4488–4494. [Google Scholar] [CrossRef]
- Freire, L.; Carmezima, M.J.; Ferreiraa, M.G.S.; Montemor, M.F. The electrochemical behaviour of stainless steel AISI 304 in alkaline solutions with different pH in the presence of chlorides. Electrochim. Acta 2011, 56, 5280–5289. [Google Scholar] [CrossRef]
- Trinstancho-Reyes, J.L.; Sanchez-Carrillo, M.; Sandoval-Jabalera, R.; Carmona, V.M.O.; Almeraya-Calderón, F.; Chacón-Nava, J.G.; Gonzalez-Rodriguez, J.G.; Martínez-Villafañe, A. Electrochemical impedance spectroscopy investigation of alloy inconel 718 in molten salts at high temperature. Int. J. Electrochem. Sci. 2011, 6, 419–431. [Google Scholar] [CrossRef]
- Lavigne, O.; Shoji, T.; Takeda, Y. EIS pitting temperature determination of A182 nickel based alloy in simulated BWR environment containing dilute seawater. Nucl. Eng. Des. 2014, 273, 435–439. [Google Scholar] [CrossRef]
- Ries, L.A.S.; Belo, M.D.C.; Ferreira, M.G.S.; Muller, I.L. WITHDRAWN: Chemical composition and electronic structure of passive films formed on Alloy 600 in acidic solution. Corros. Sci. 2008, 50, 968–977. [Google Scholar] [CrossRef]
- Benaioun, N.E.; Maafa, I.; Florentin, A.; Denys, E.; Hakiki, N.E.; Moulayat, N.; Bubendorff, J.L. Time dependence of the natural passivation process on AISI 304 in an alkaline medium: Atomic force microscopy and scanning Kelvin probe force microscopy as additional tools to electrochemical impedance spectroscopy. Appl. Surf. Sci. 2018, 436, 646–652. [Google Scholar] [CrossRef]
- Sathirachinda, N.; Pettersson, R.; Pan, J. Depletion effects at phase boundaries in 2205 duplex stainless steel characterized with SKPFM and TEM/EDS. Corros. Sci. 2009, 51, 1850–1860. [Google Scholar] [CrossRef]
- Hakiki, N.E.; Da Cunha Belo, M.; Simoes, A.M.P.; Ferreira, M.G.S. Semiconducting properties of passive films formed on stainless steels: Influence of the alloying elements. J. Electrochem. Soc. 1998, 145, 3821–3829. [Google Scholar] [CrossRef]


Disclaimer/Publisher’s Note: The statements, opinions and data contained in all publications are solely those of the individual author(s) and contributor(s) and not of MDPI and/or the editor(s). MDPI and/or the editor(s) disclaim responsibility for any injury to people or property resulting from any ideas, methods, instructions or products referred to in the content. |
© 2023 by the authors. Licensee MDPI, Basel, Switzerland. This article is an open access article distributed under the terms and conditions of the Creative Commons Attribution (CC BY) license (https://creativecommons.org/licenses/by/4.0/).