


Study on the Influence of Rock Shape on Rolling Distance


Abstract
:1. Introduction
2. Model Test
2.1. Determining the Influence of Rockfall Shape on Its Rolling Characteristics
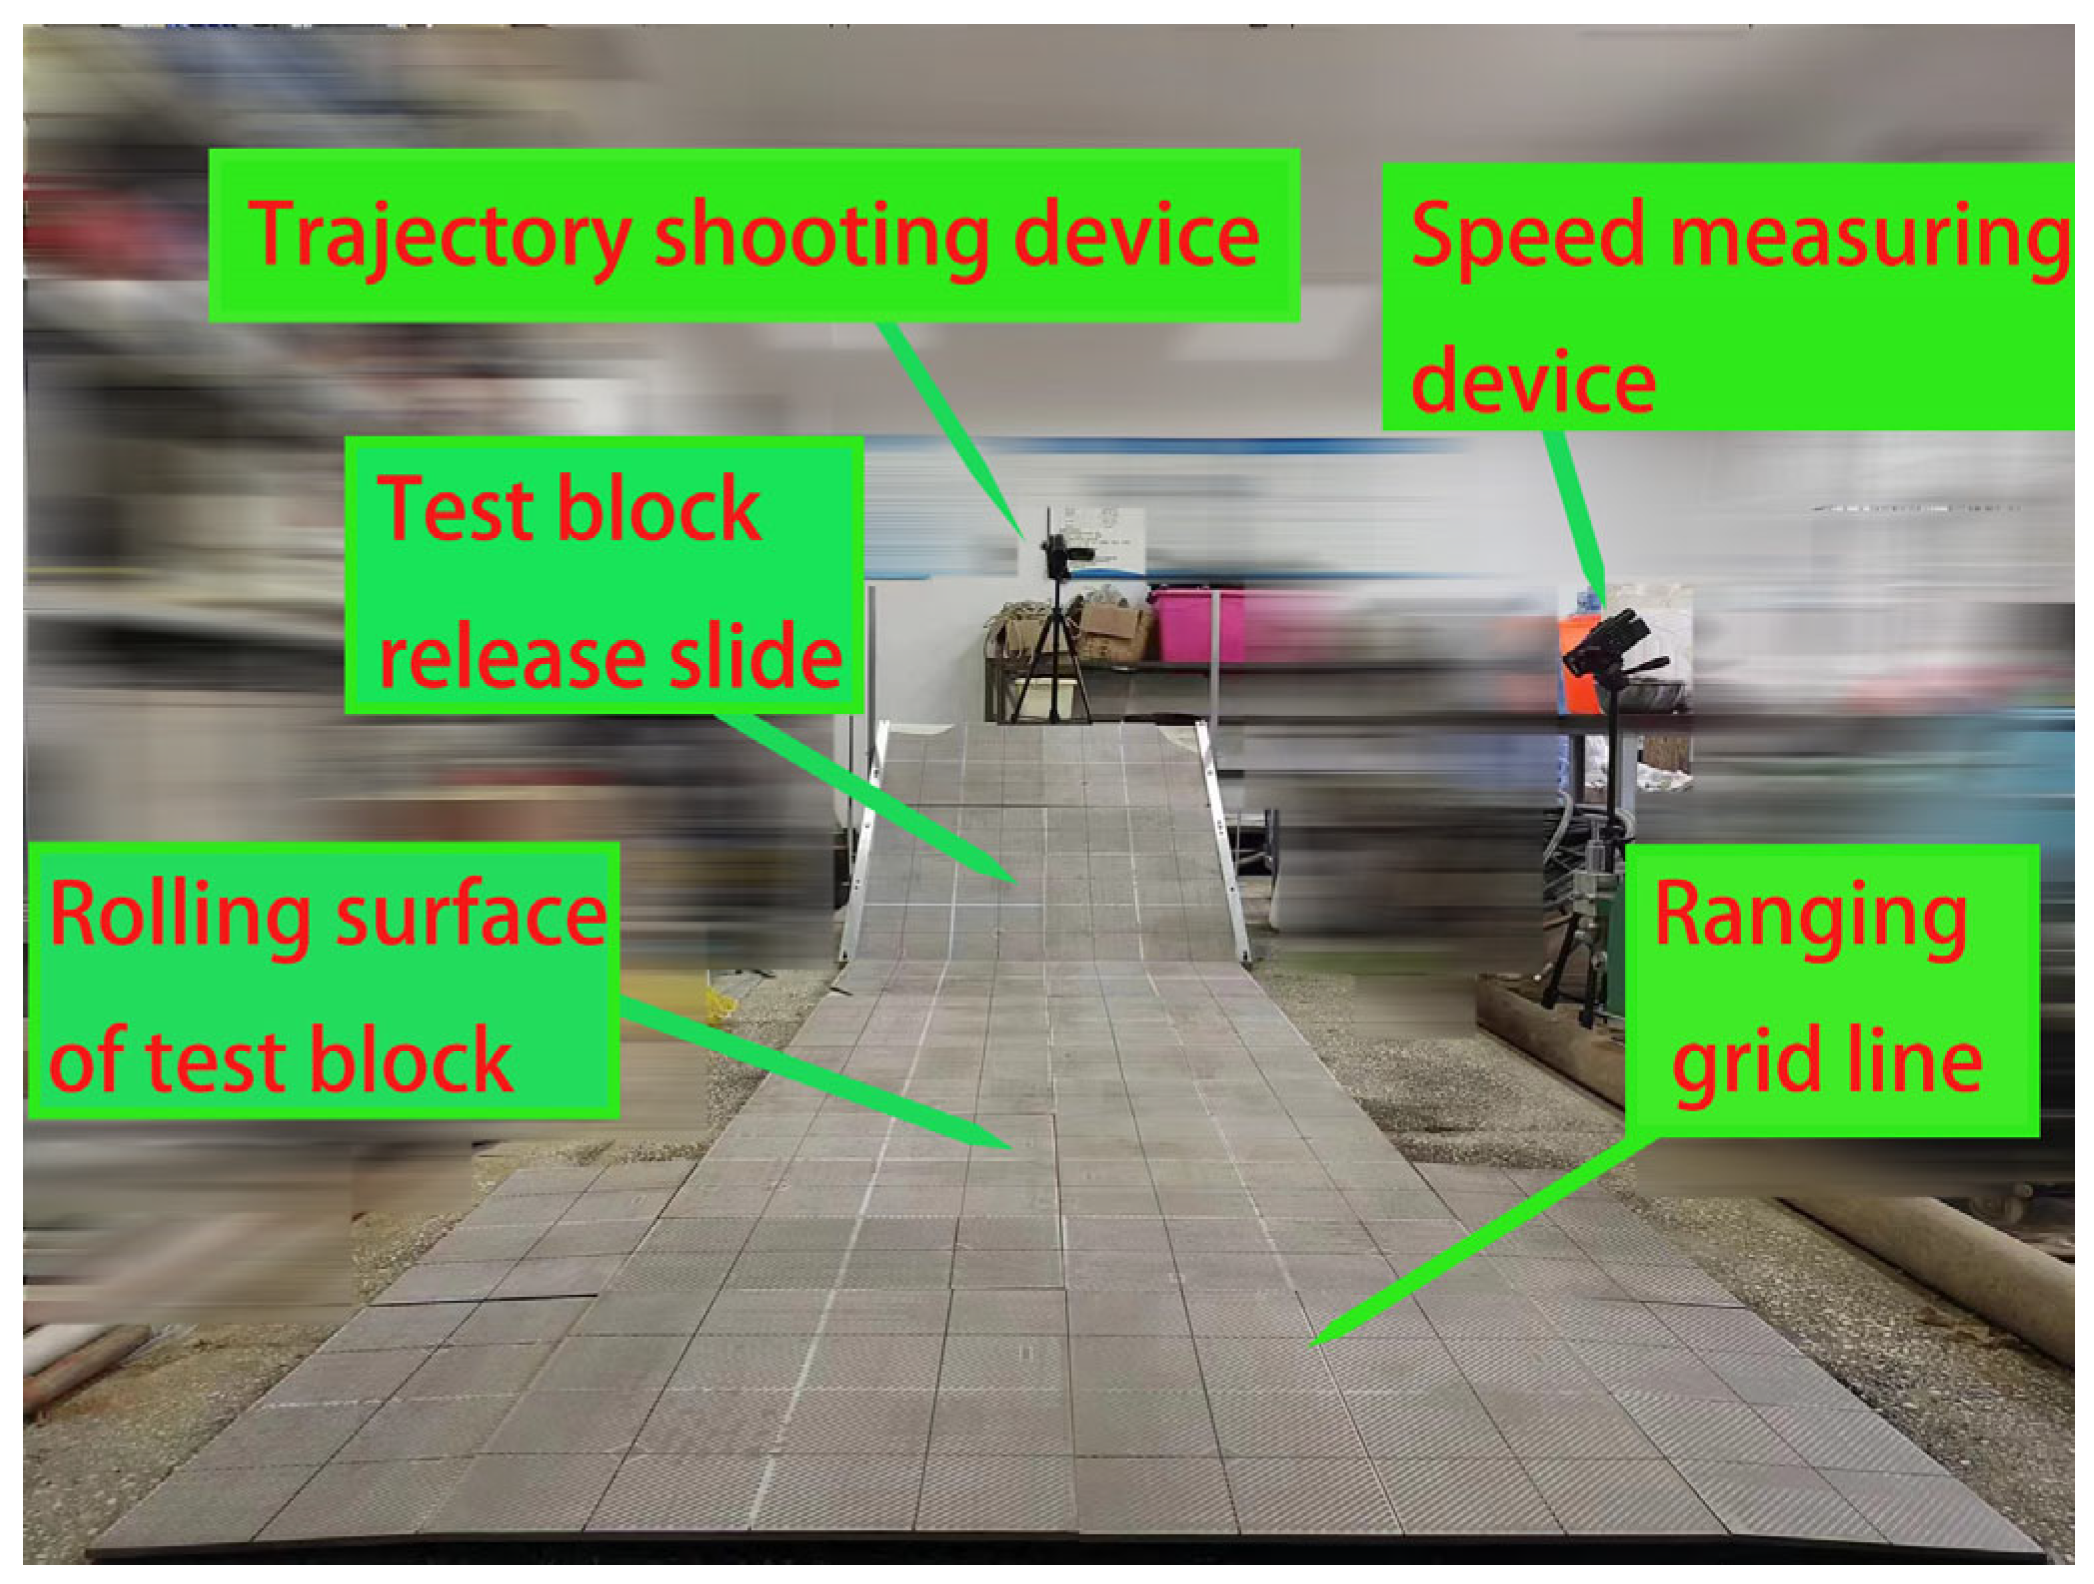
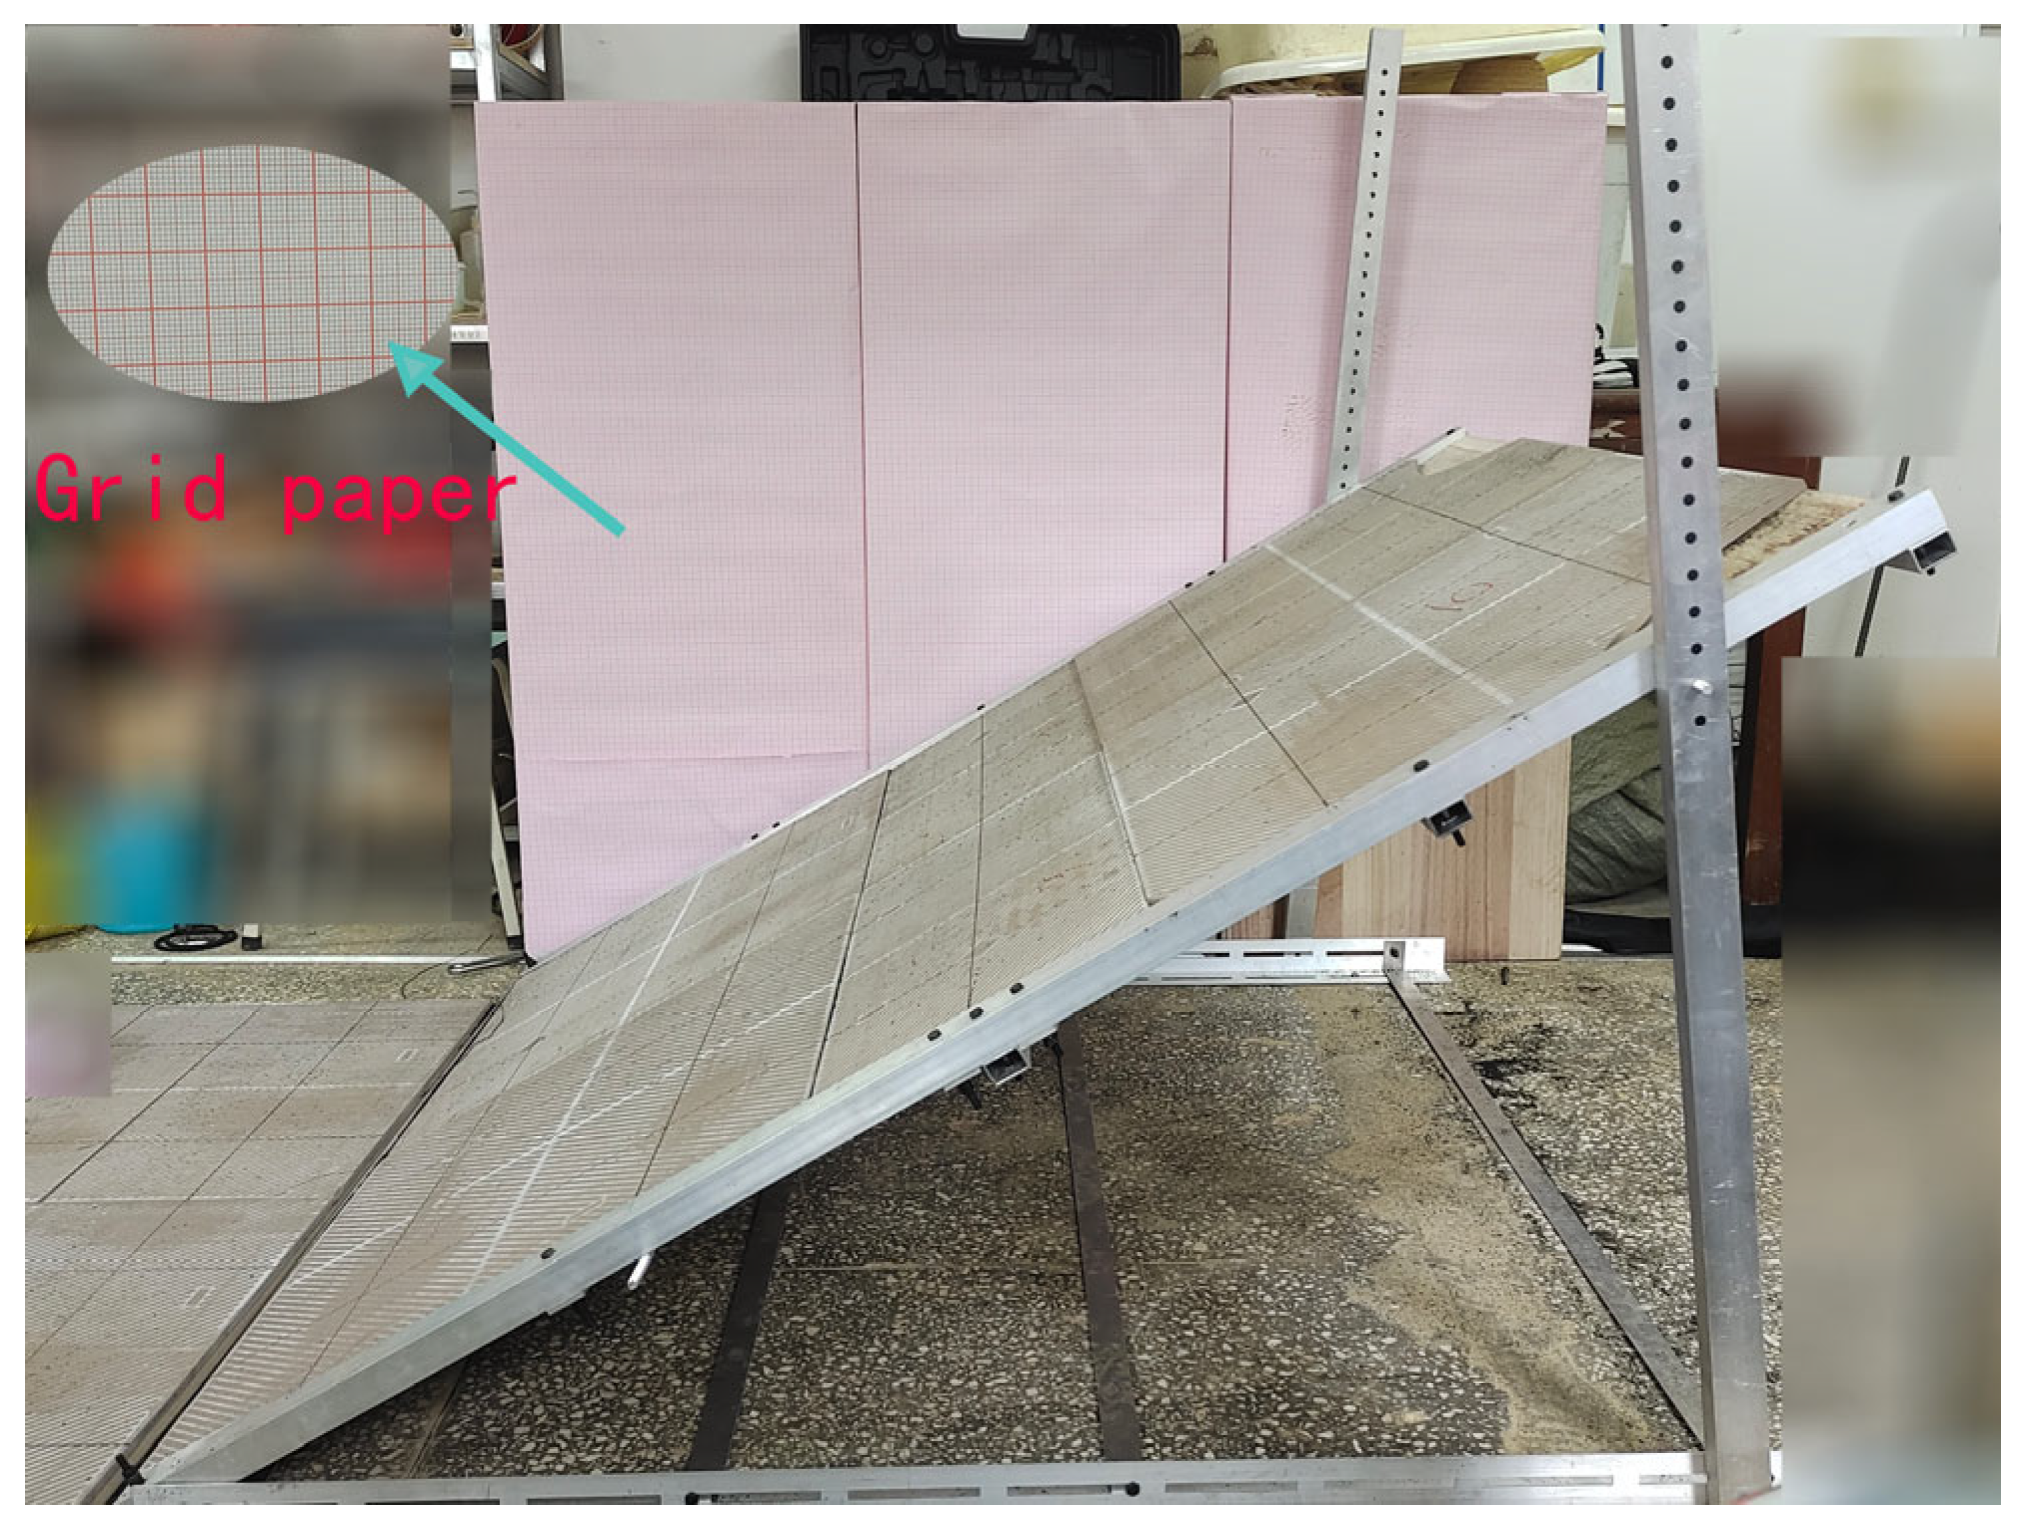
2.1.1. Test Device
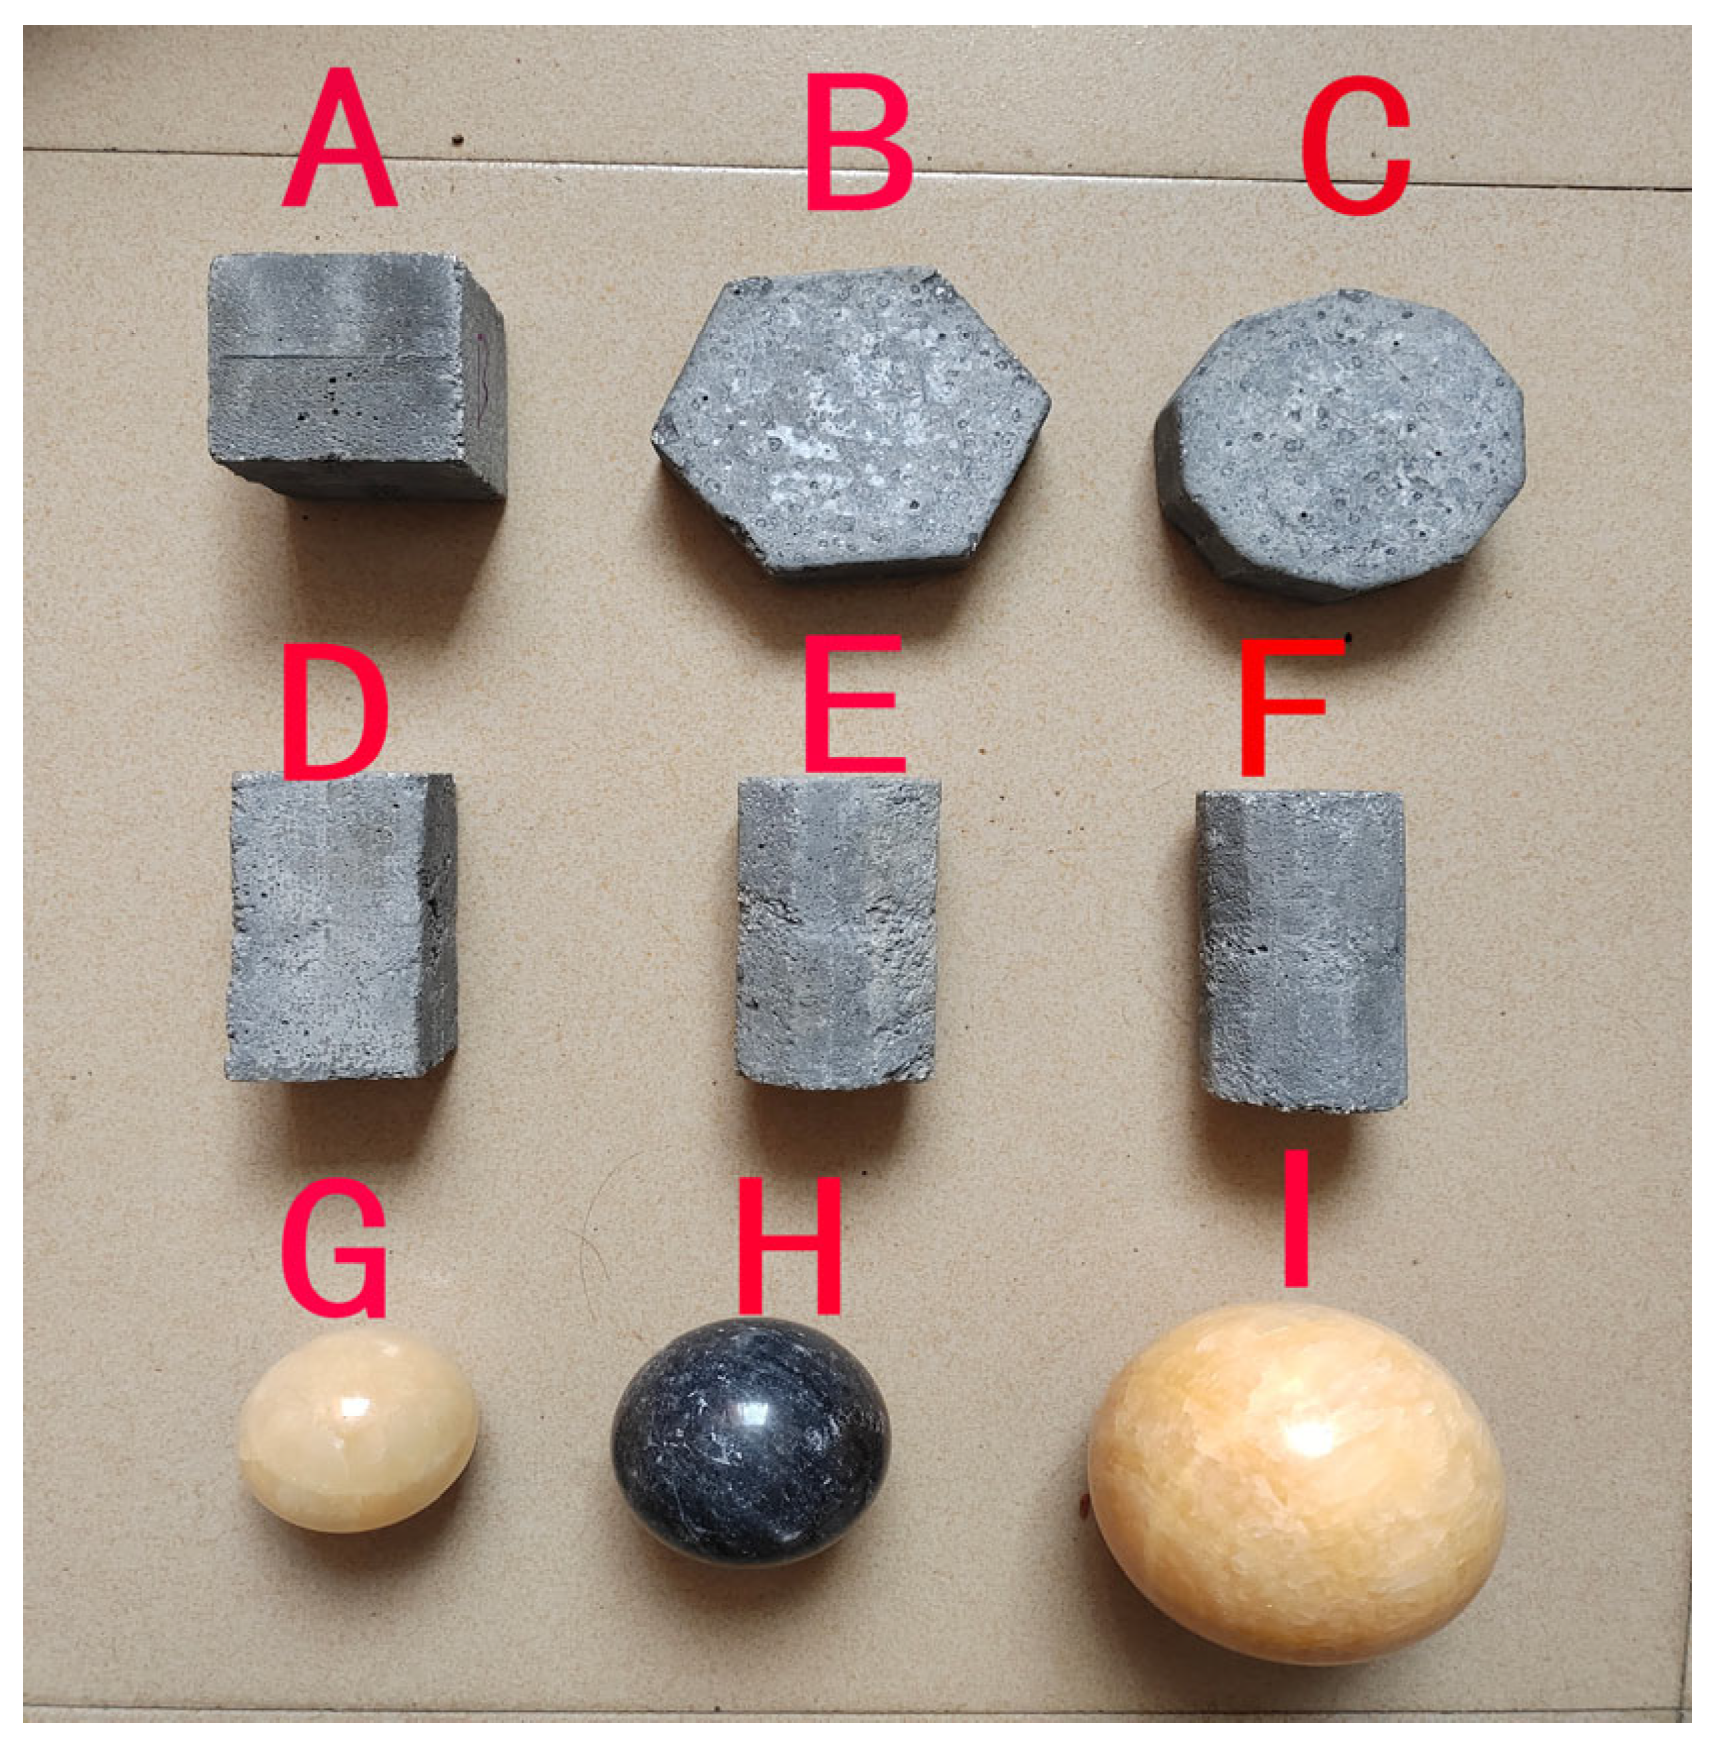
2.1.2. Test Blocks
2.2. Determination of Rolling Friction Coefficients for Different Rolling Surface Materials
2.2.1. Experimental Setup
2.2.2. Experimental Procedure
3. Analysis of Experimental Results
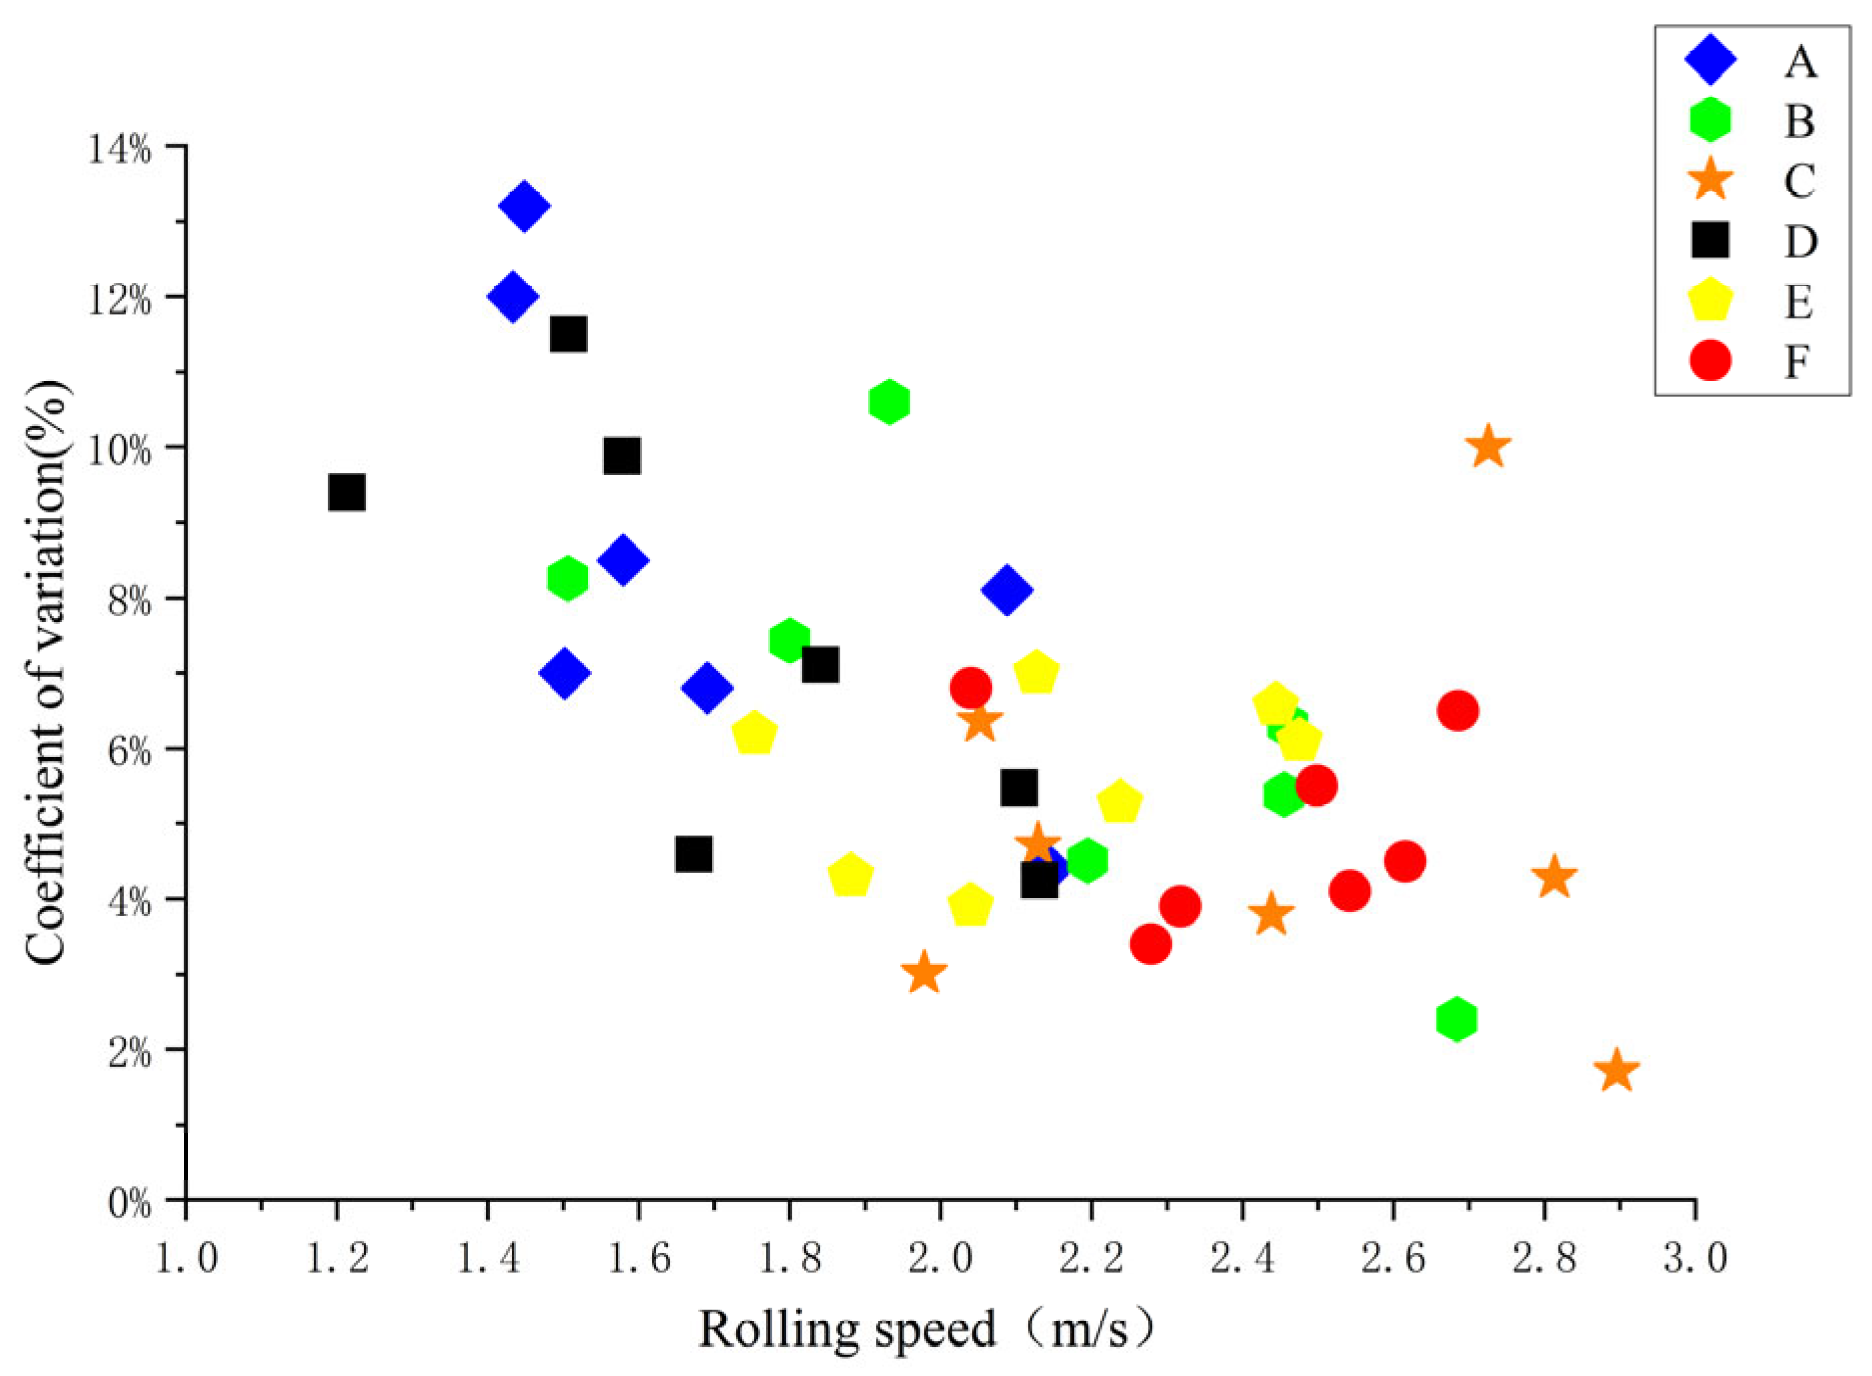
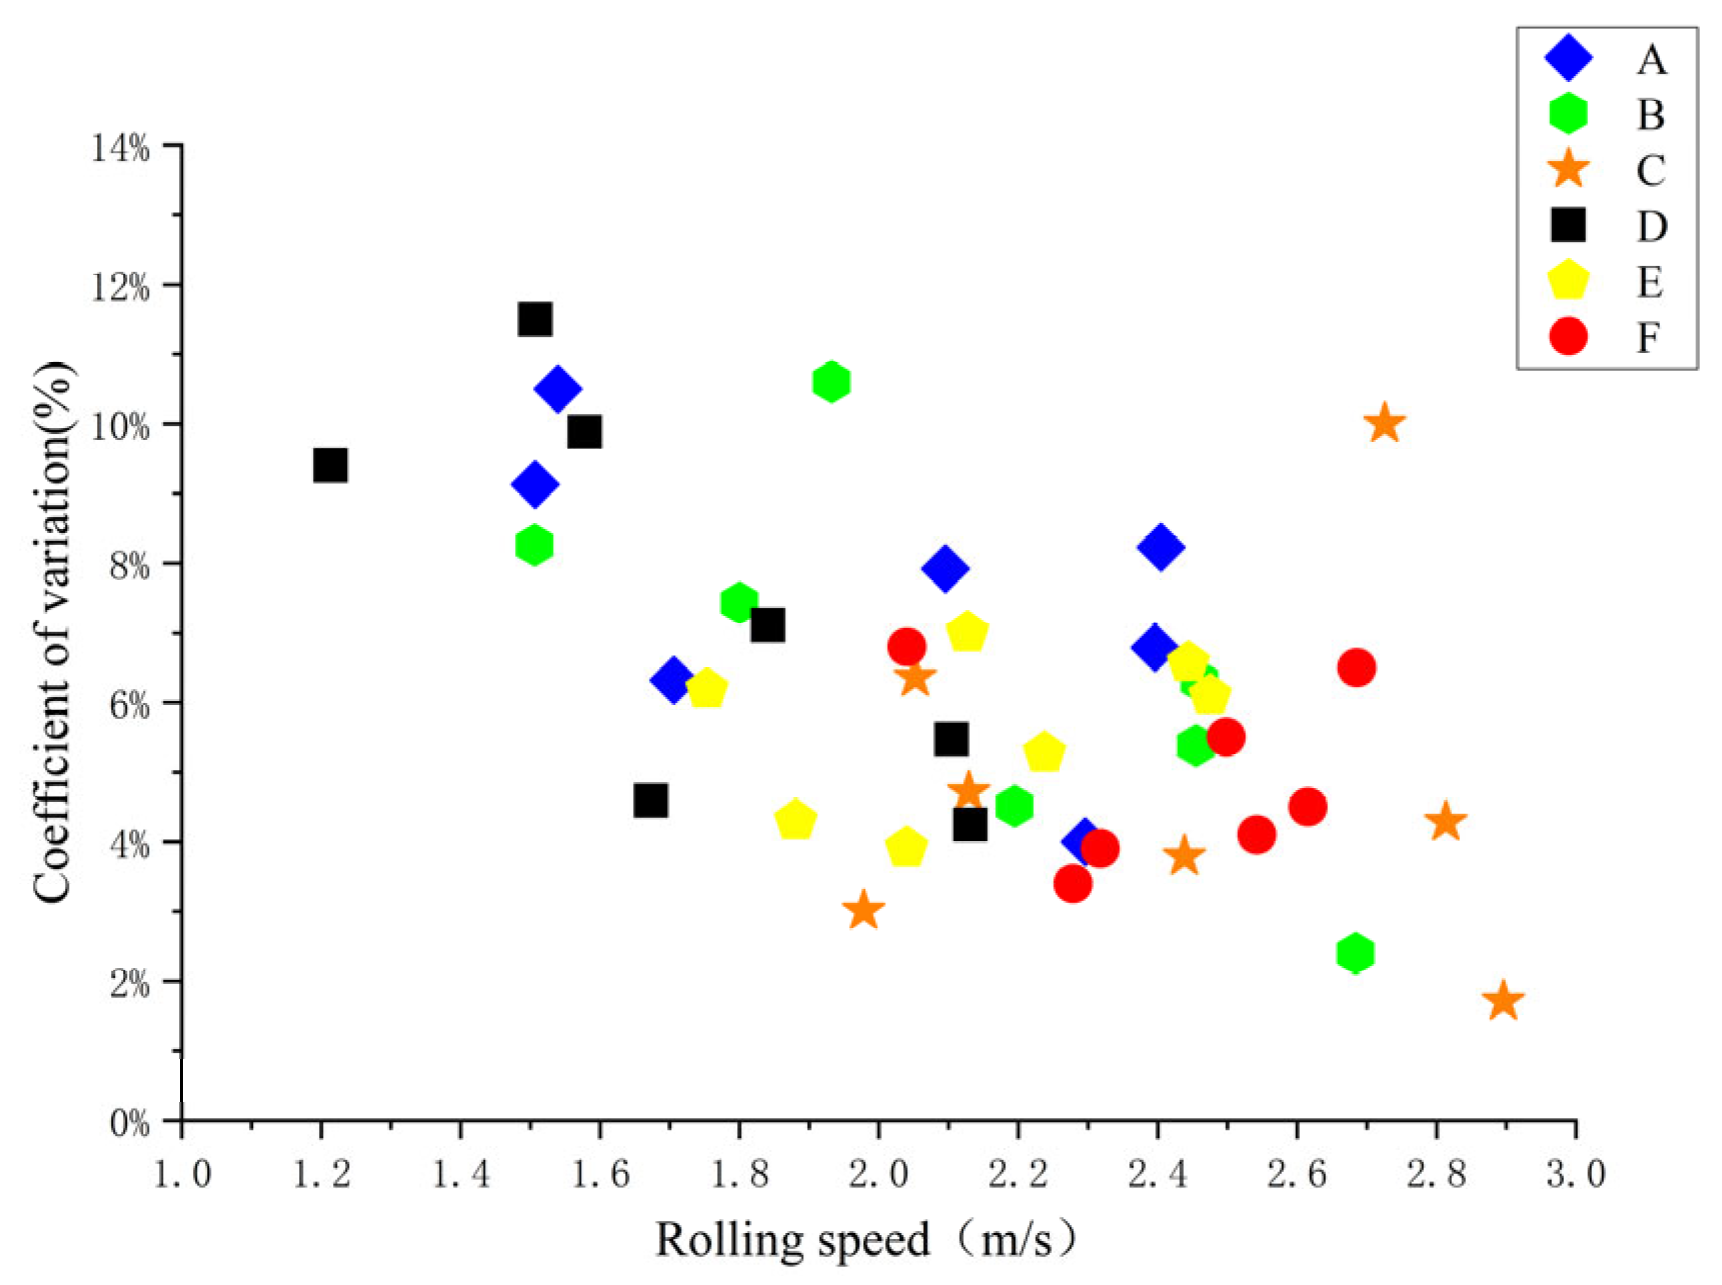
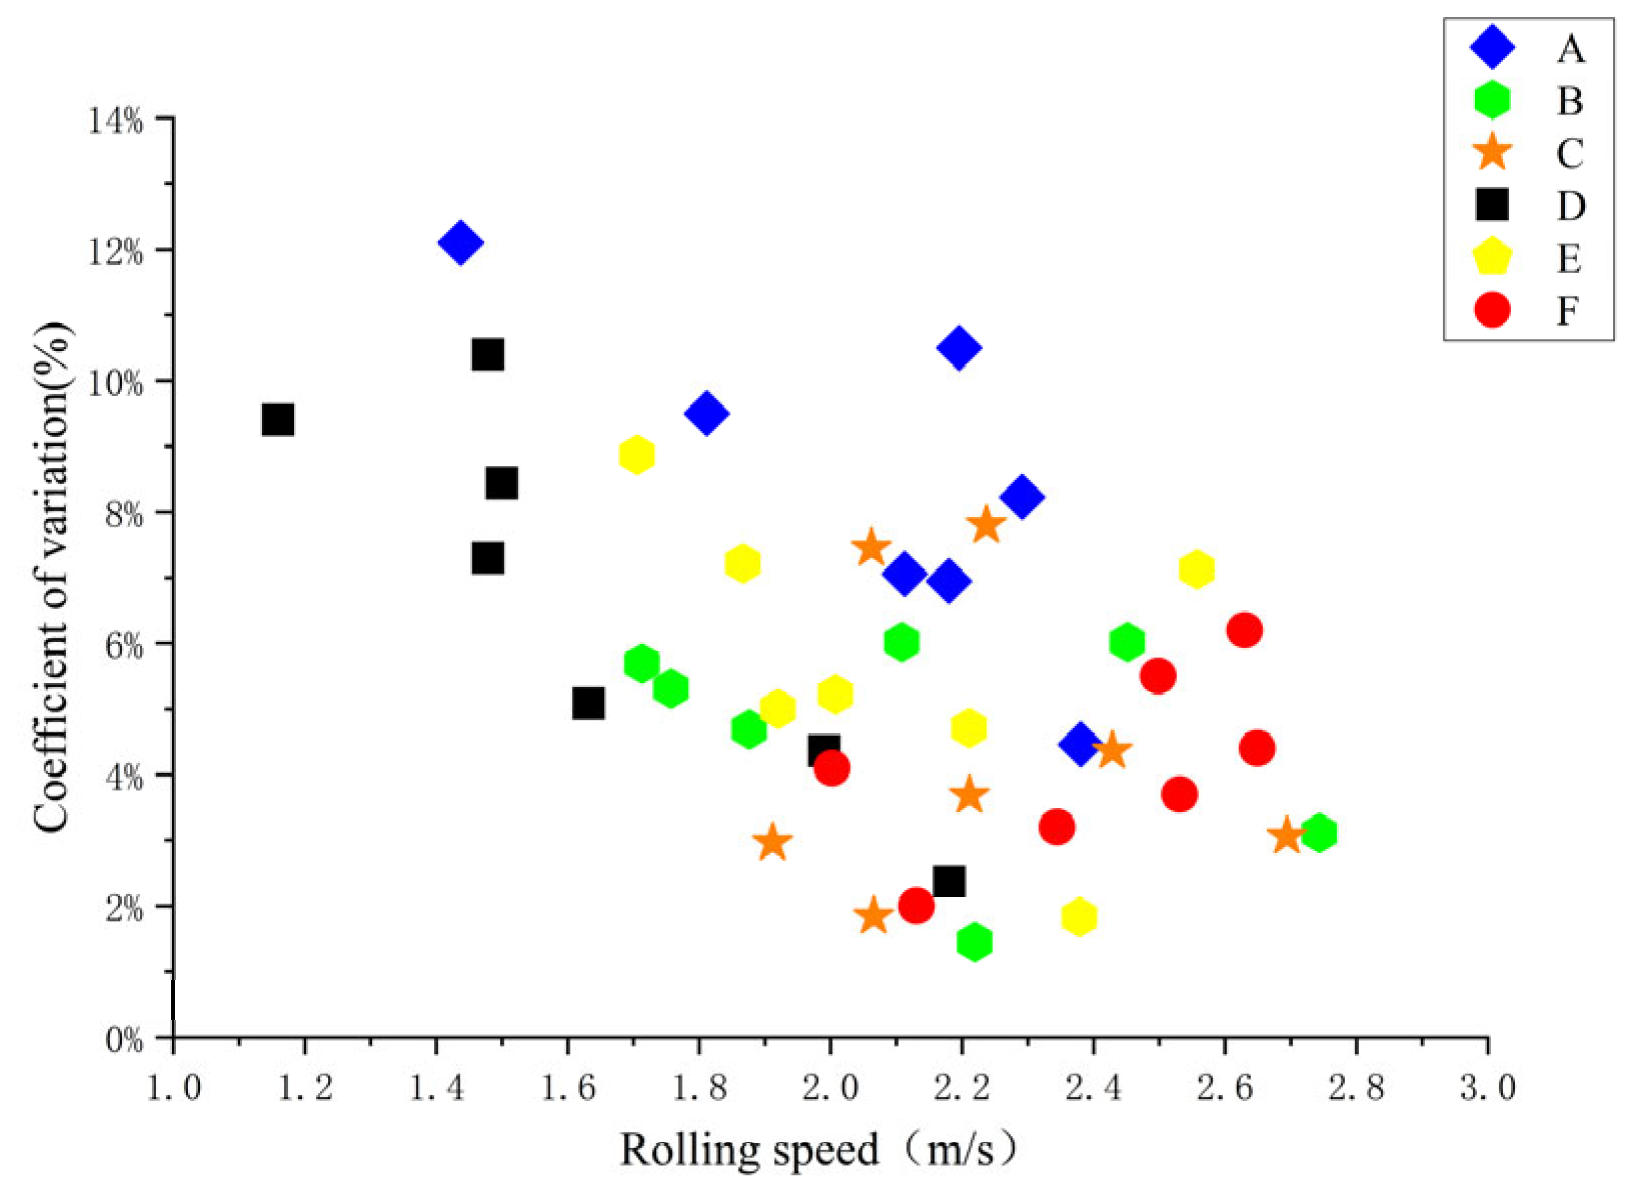
3.1. Dispersion Analysis of Test Data
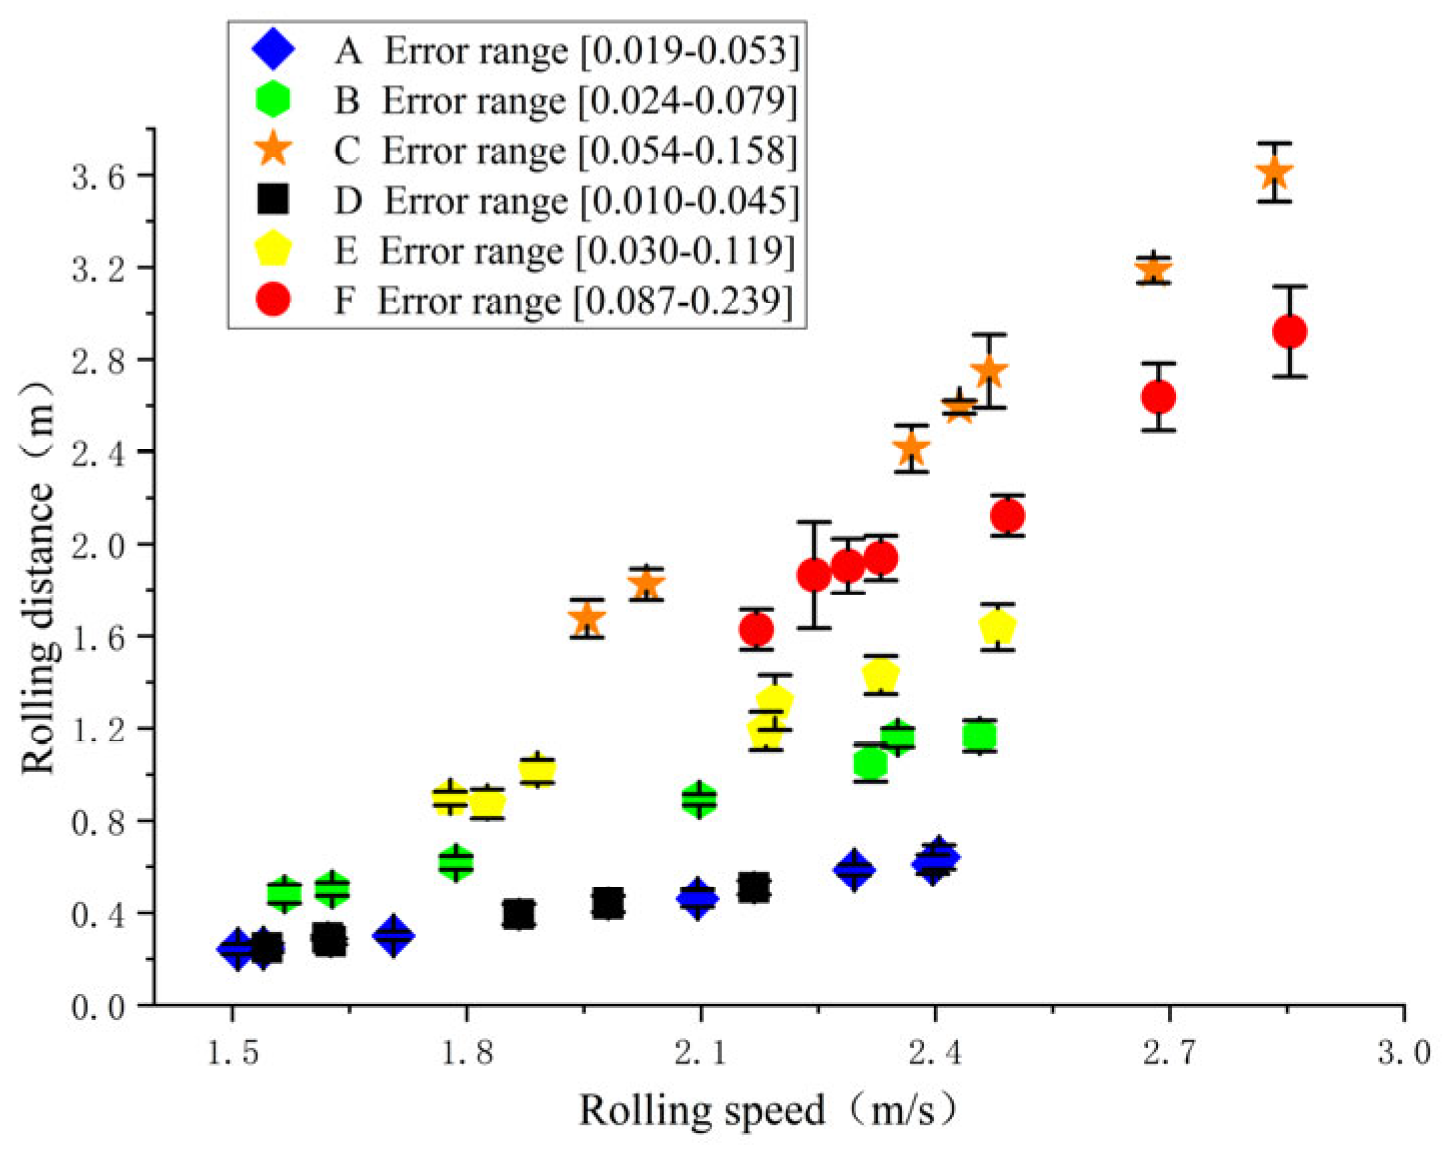
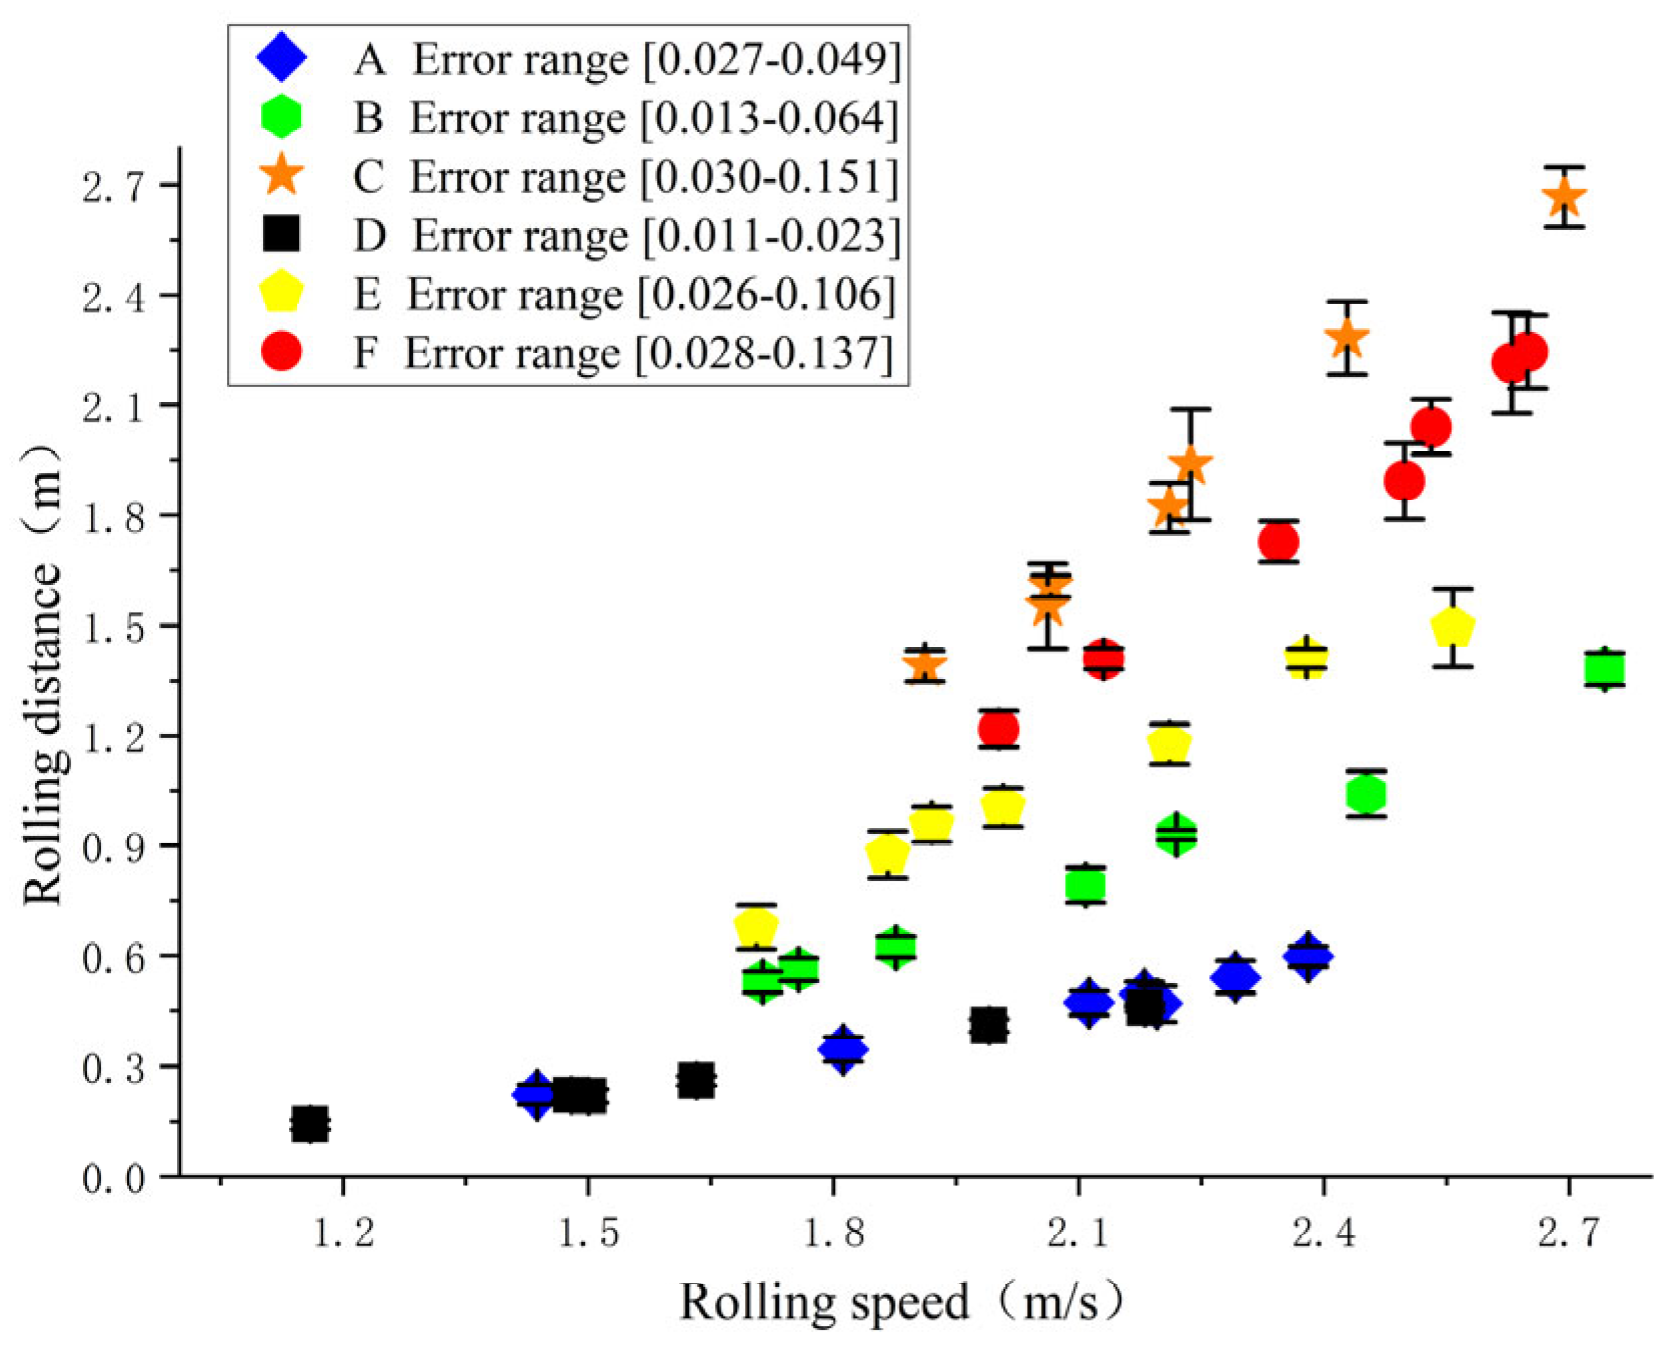
3.2. Relationship between Rock Shape and Rolling Distance
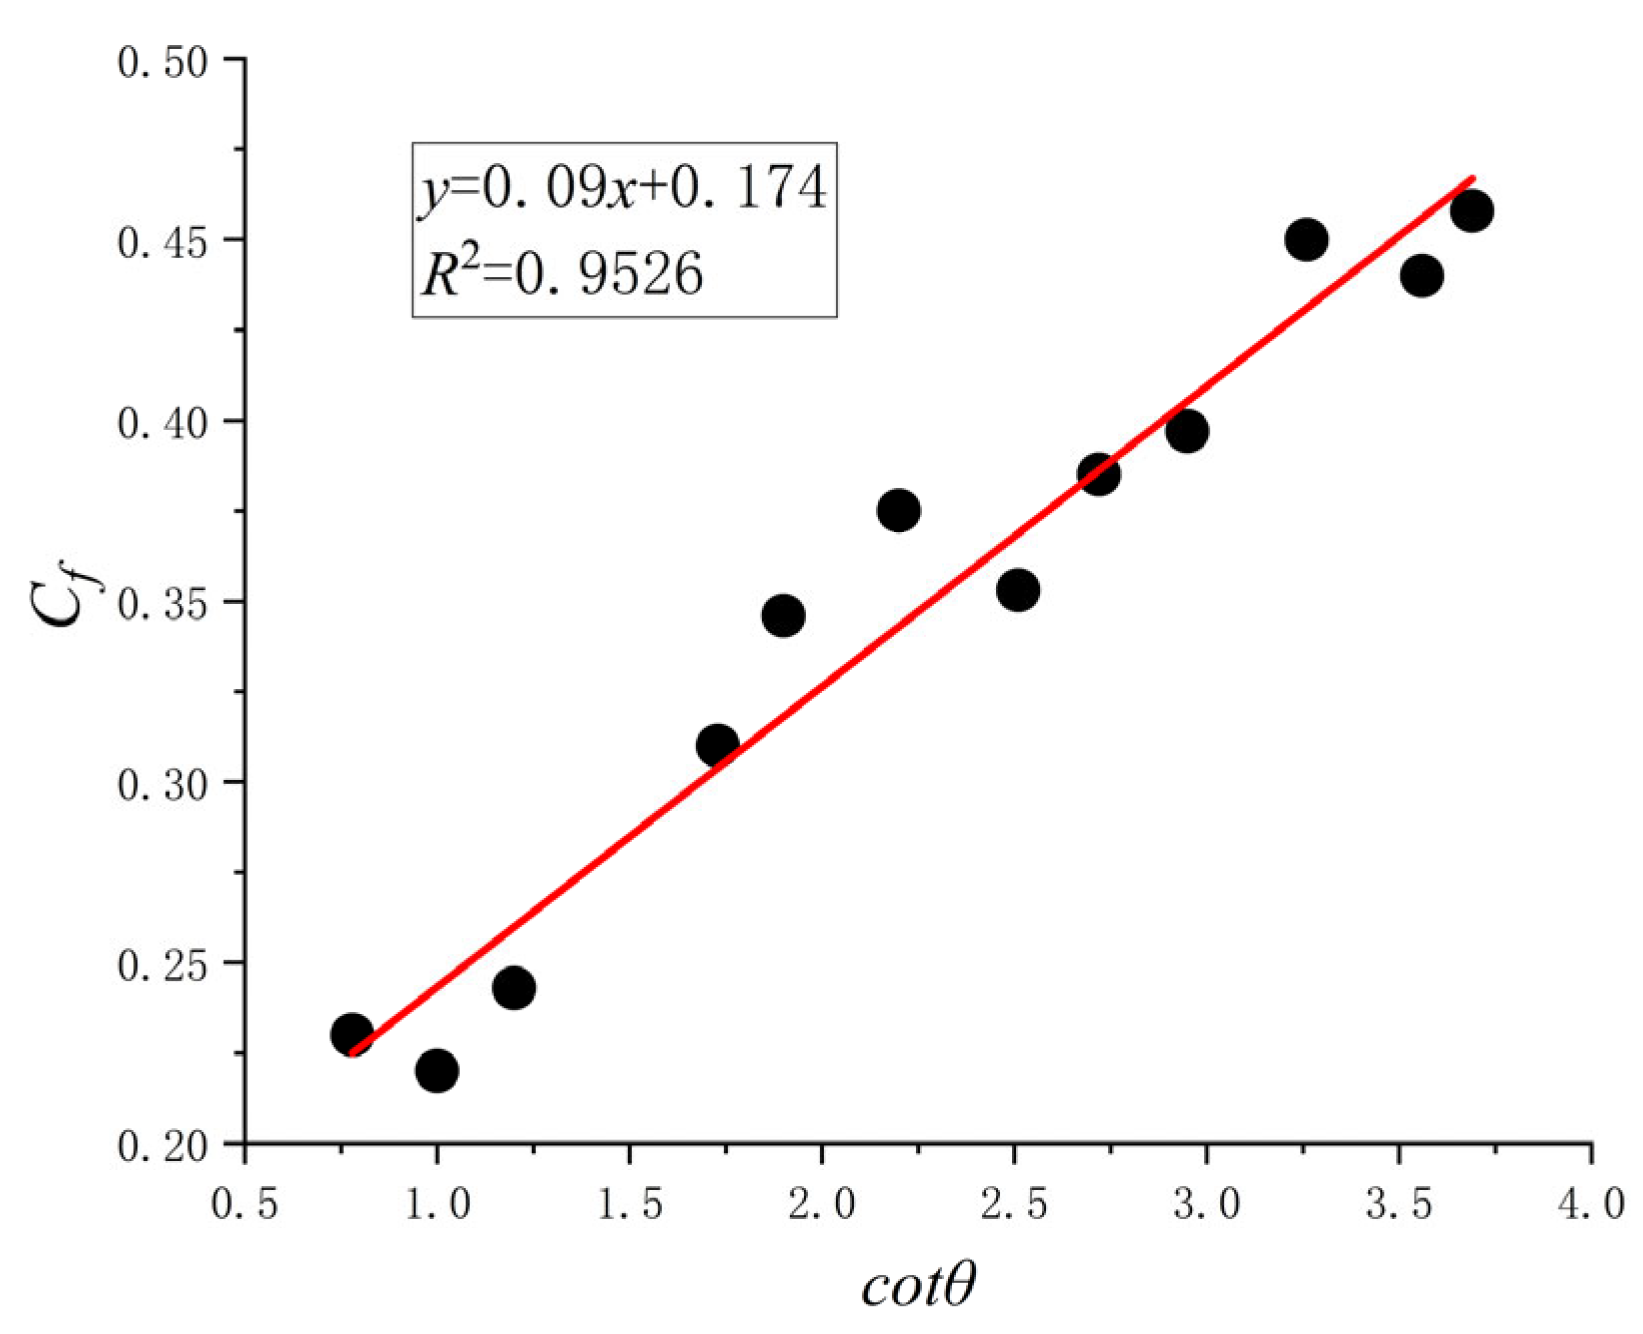
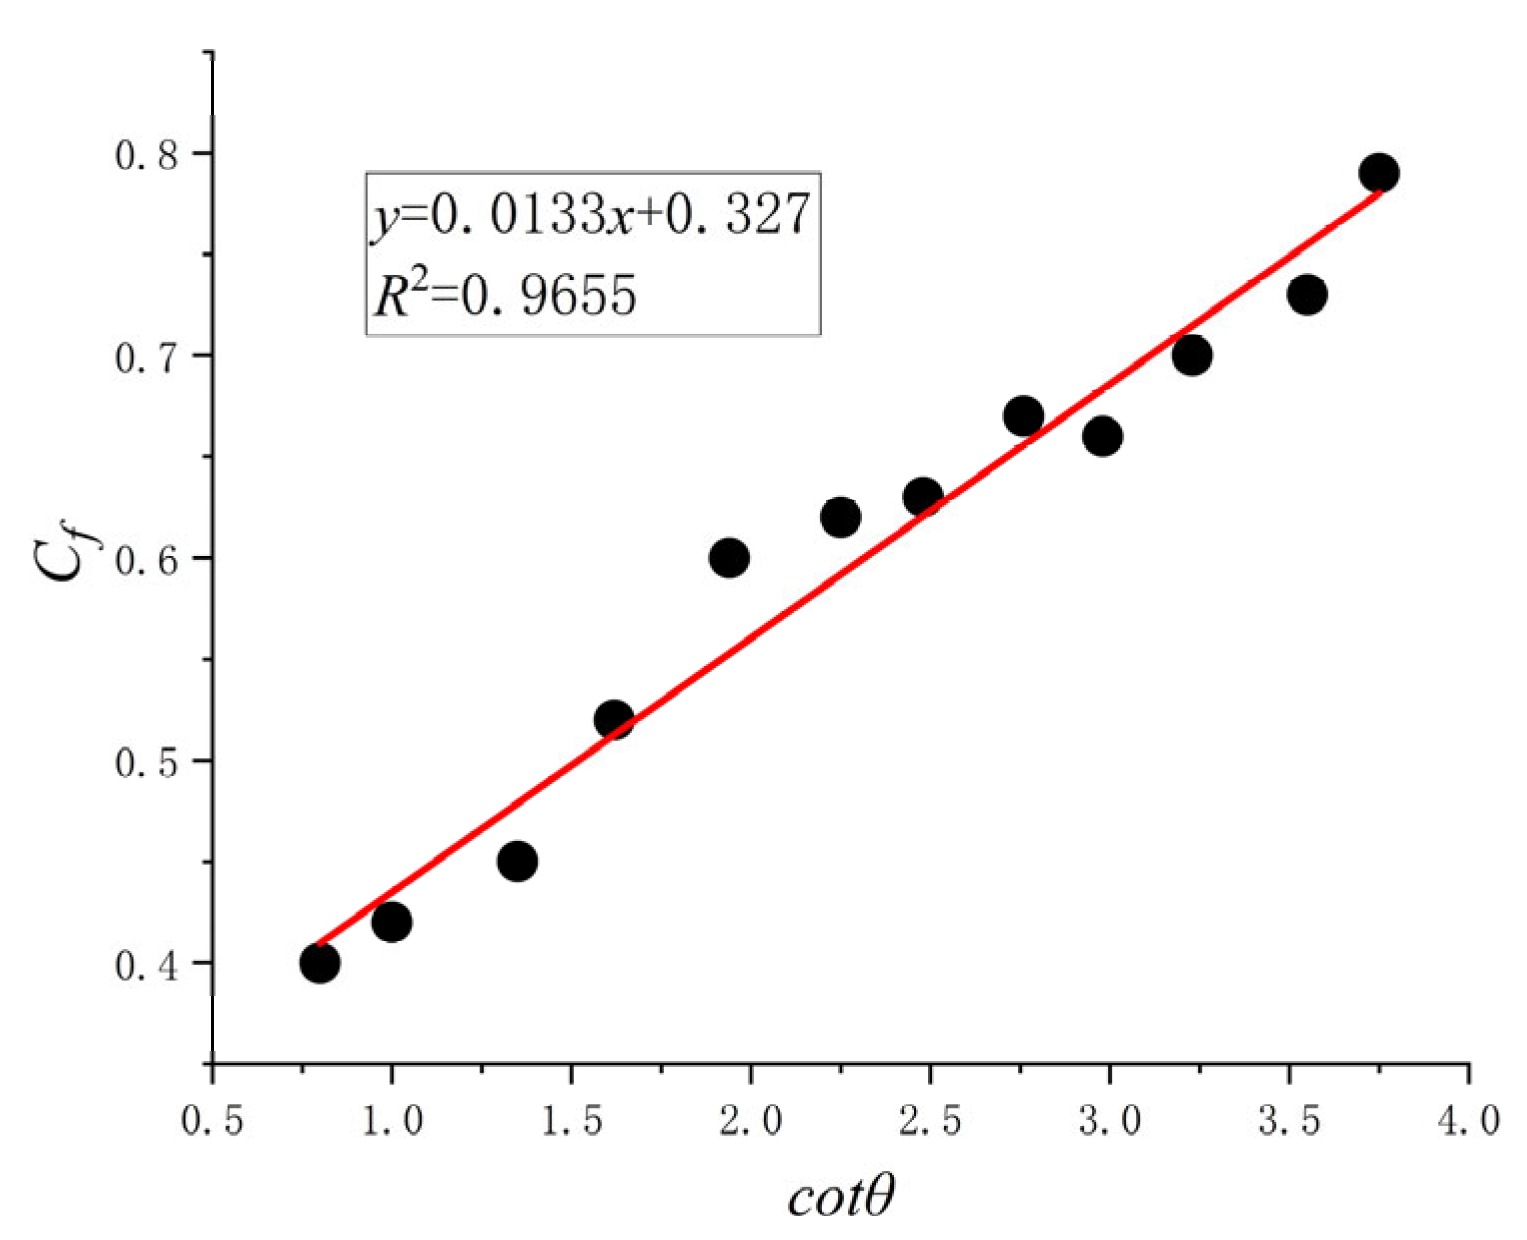
3.3. Calculation of Rolling Friction Coefficients for Different Slope Materials
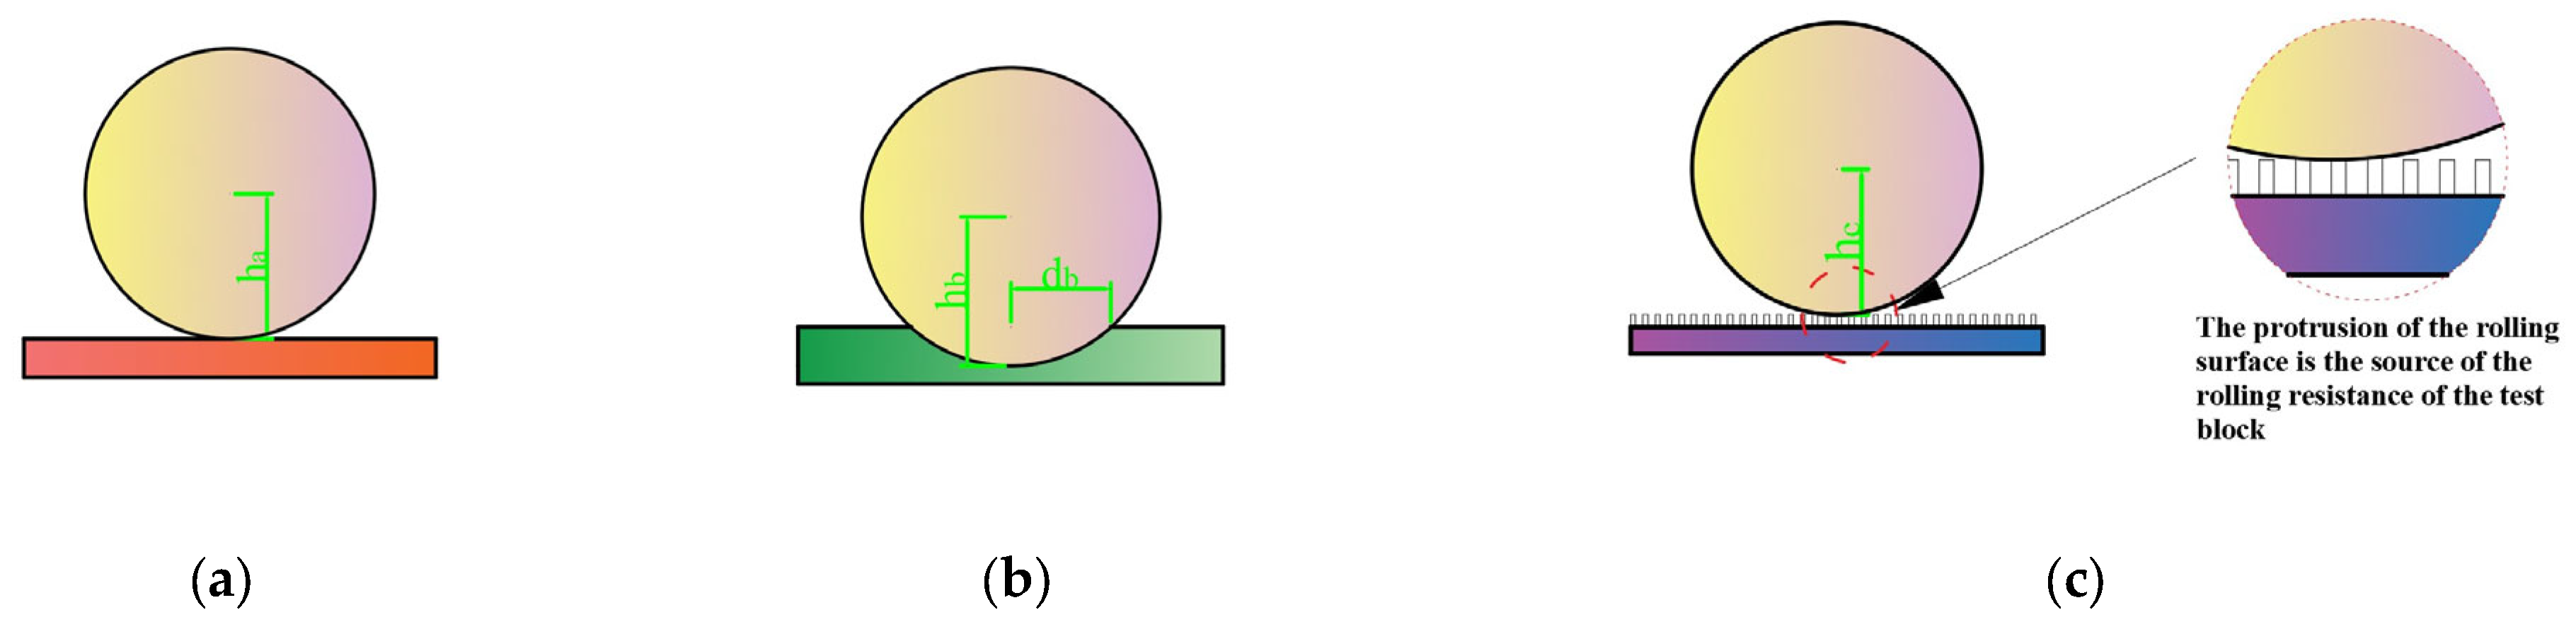
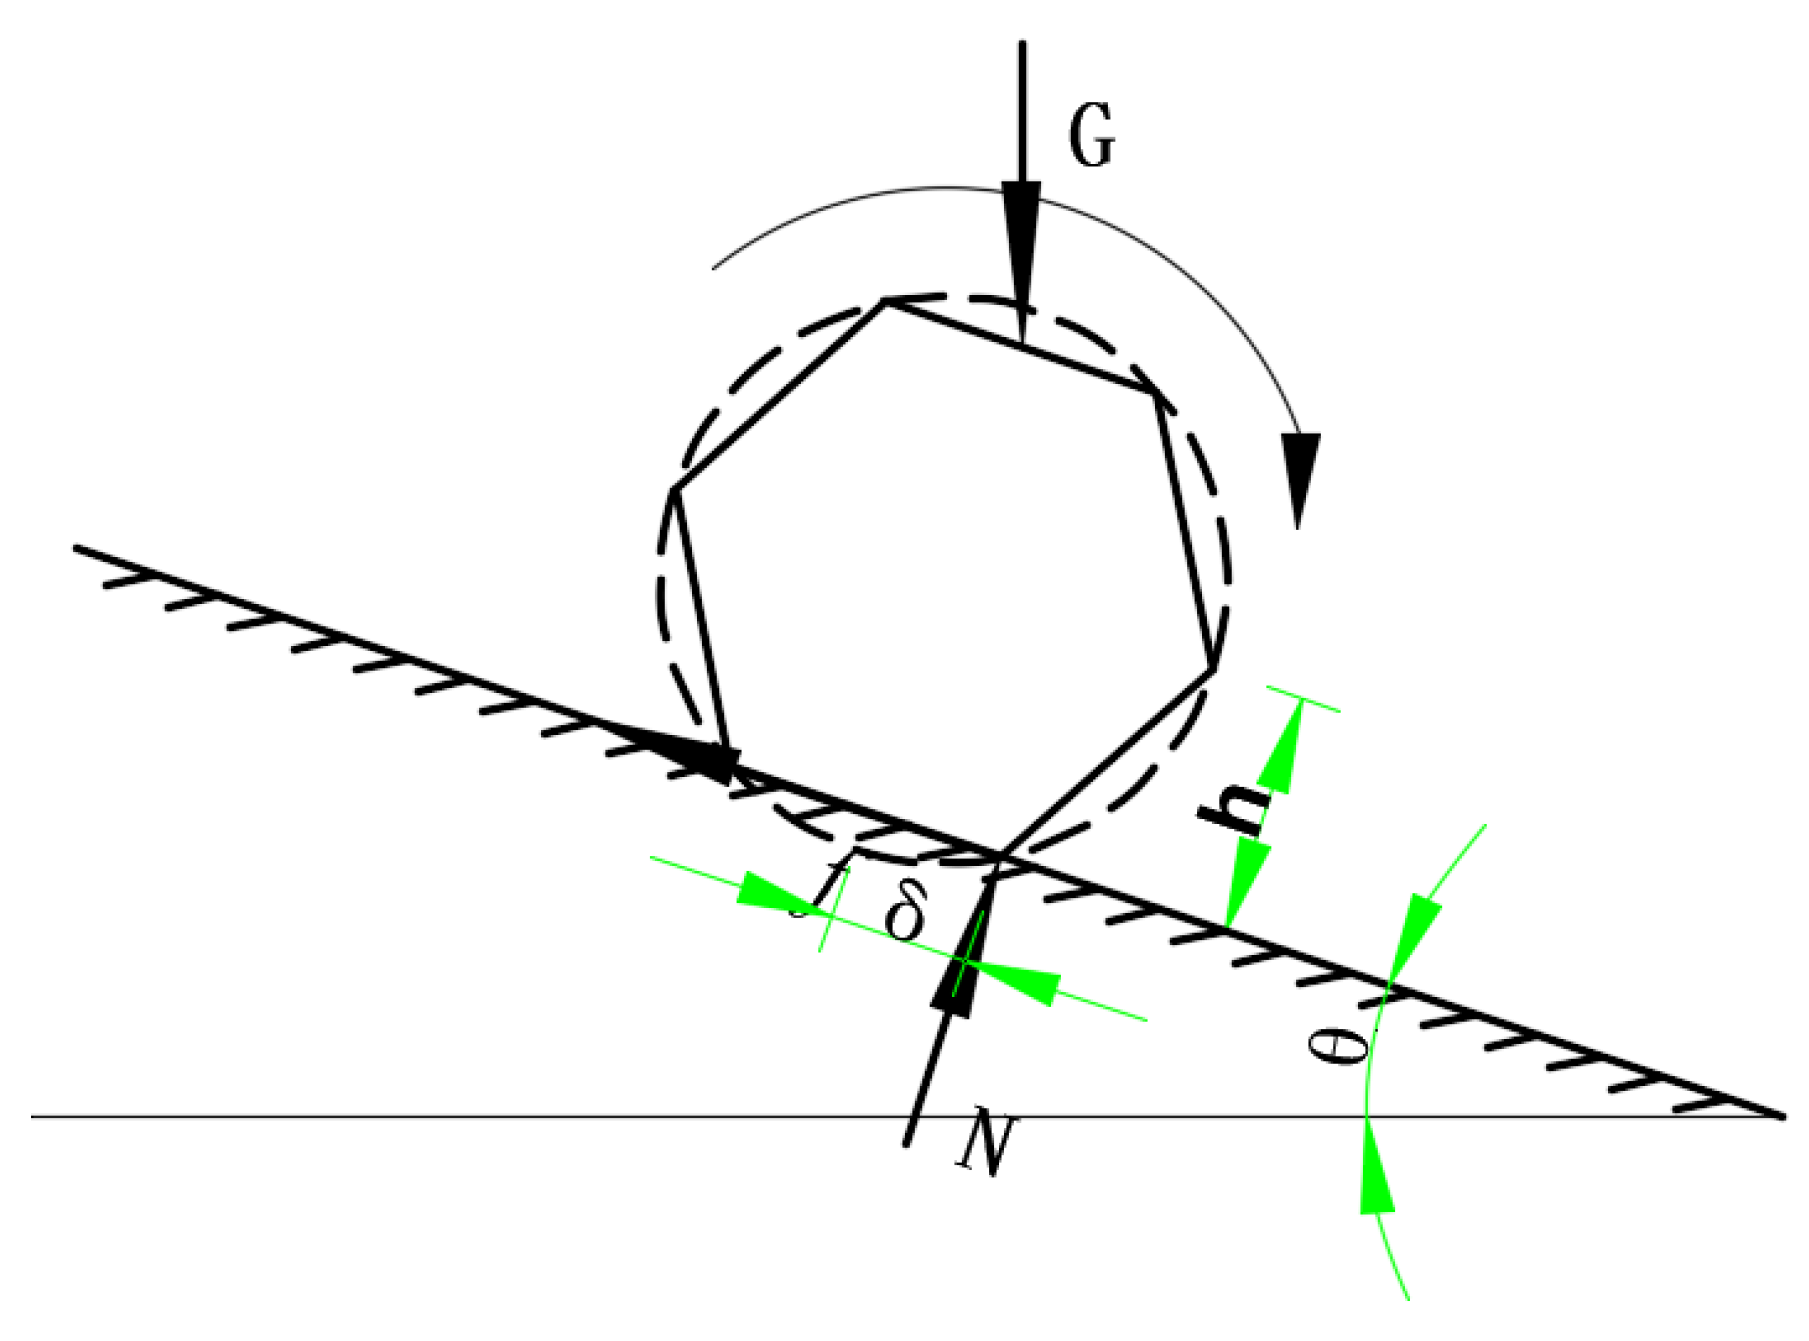
- d—the distance from the instant center to the center of mass of the ball when it rolls on the rolling surface;
- r—the radius of the ball;
- G—the mass of the ball;
- α—the angle formed by the vertical line through the center of mass of the ball and the line from the instant center to the center of mass of the ball.
- L—the rolling distance of the ball on the slope surface;
- θ—the slope.
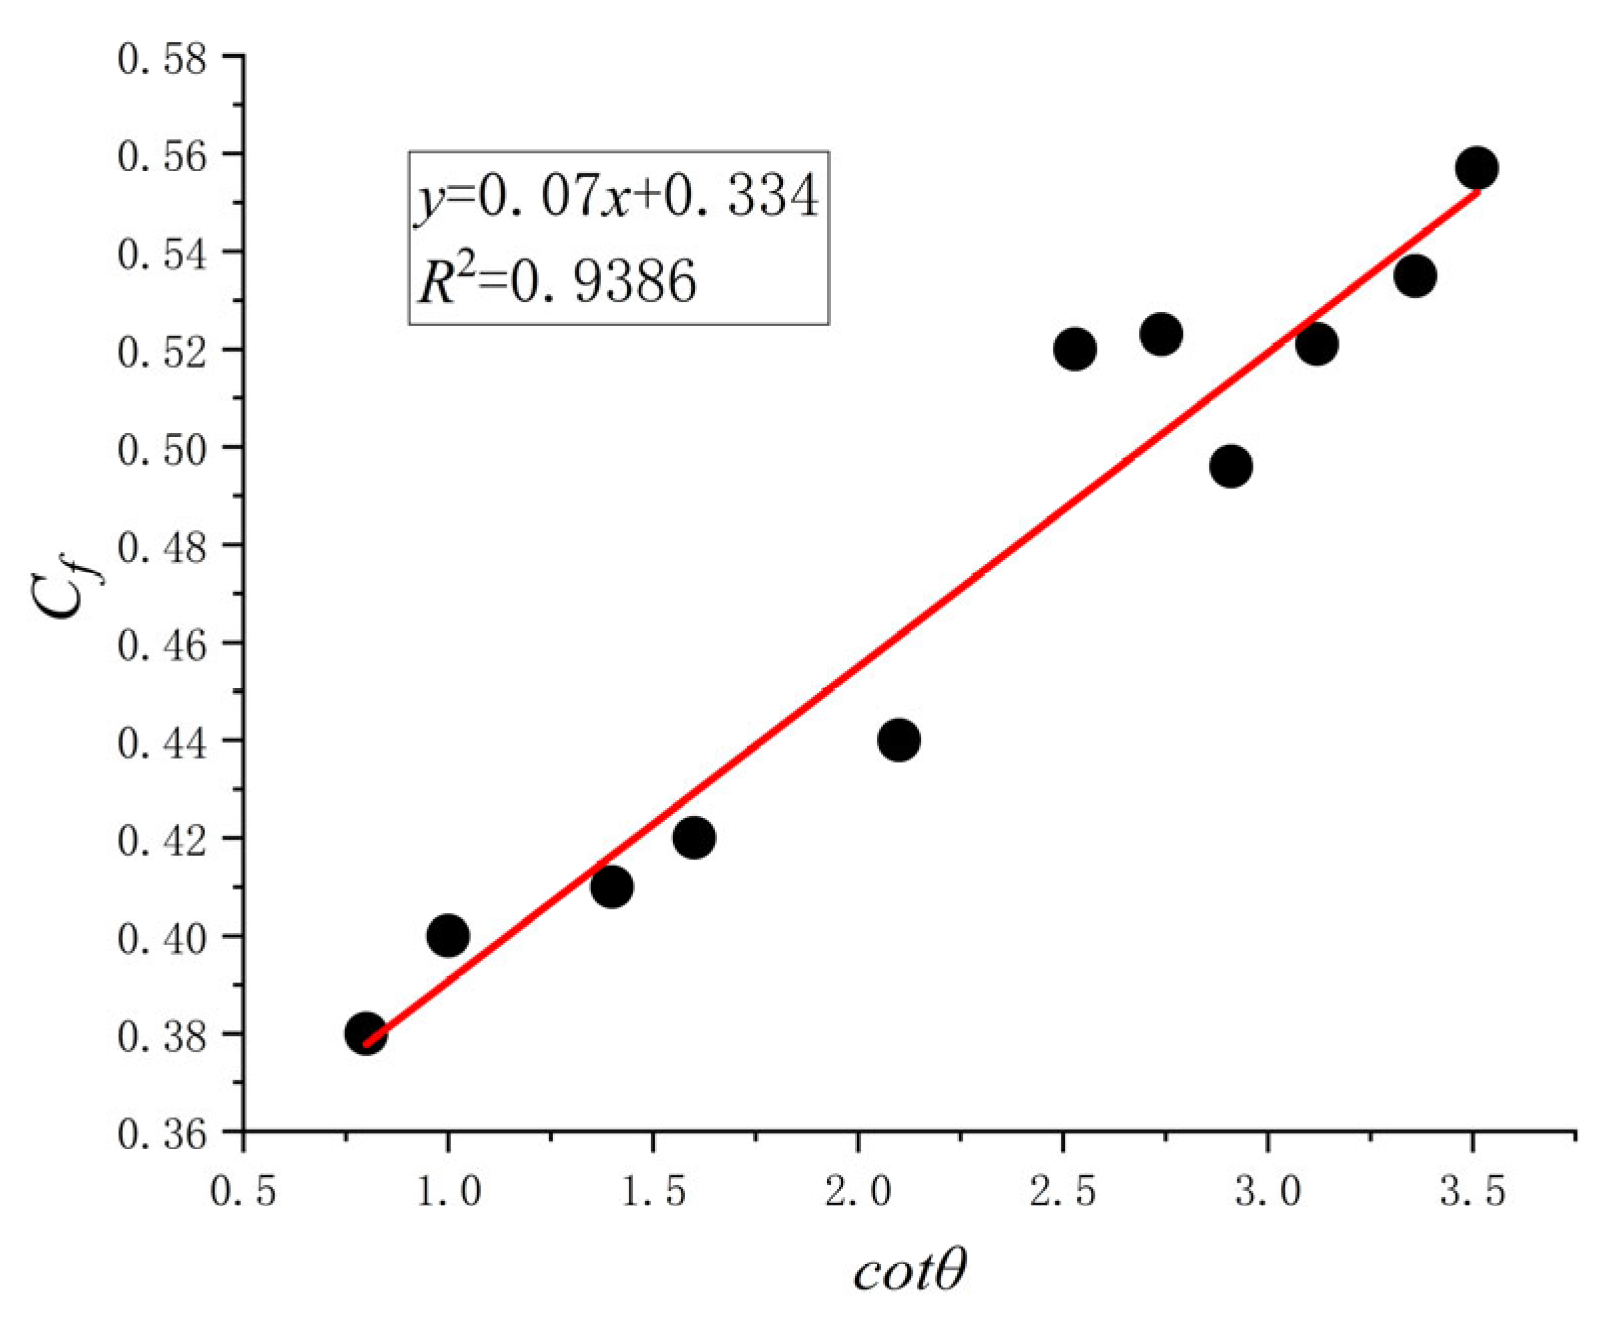
- Cf—linearly related to the slope’s tangent, with the slope-dependent rolling friction coefficient μ;
- v—the rolling velocity of the ball on the slope surface (m/s).
4. Theoretical Analysis
Model Derivation
- u1—the area of the smallest circumscribed circle among the maximum two-dimensional cross-sectional shapes of the stone perpendicular to the slope;
- u2—the area of the maximum two-dimensional cross-sectional shape of the stone perpendicular to the slope.
- μ—rolling friction coefficient originating from ground characteristics, determined experimentally in this paper.
- Smax—maximum rolling distance when rolling around the long axis;
- Smin—minimum rolling distance when rolling around the short axis.
- S1—rolling distance on the first type of rolling surface;
- S2—rolling distance on the second type of rolling surface;
- S—total rolling distance;
- Sn—rolling distance on different ground features.
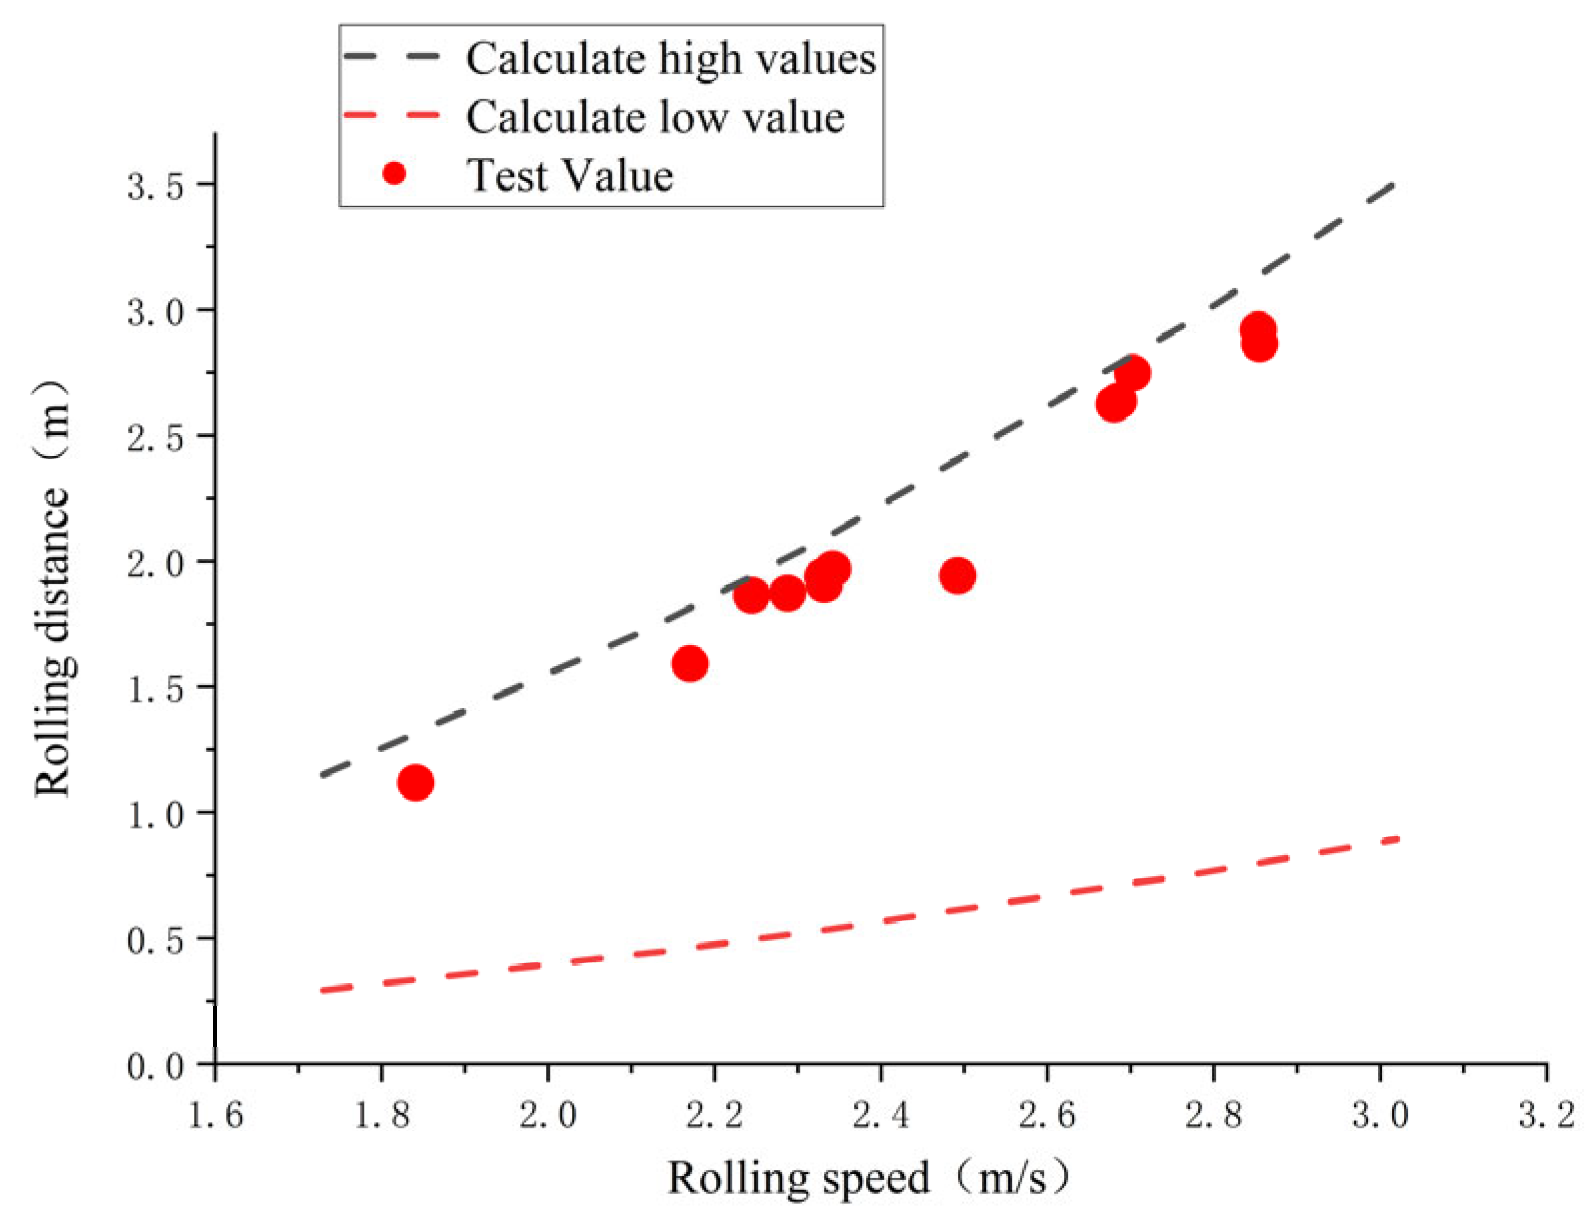
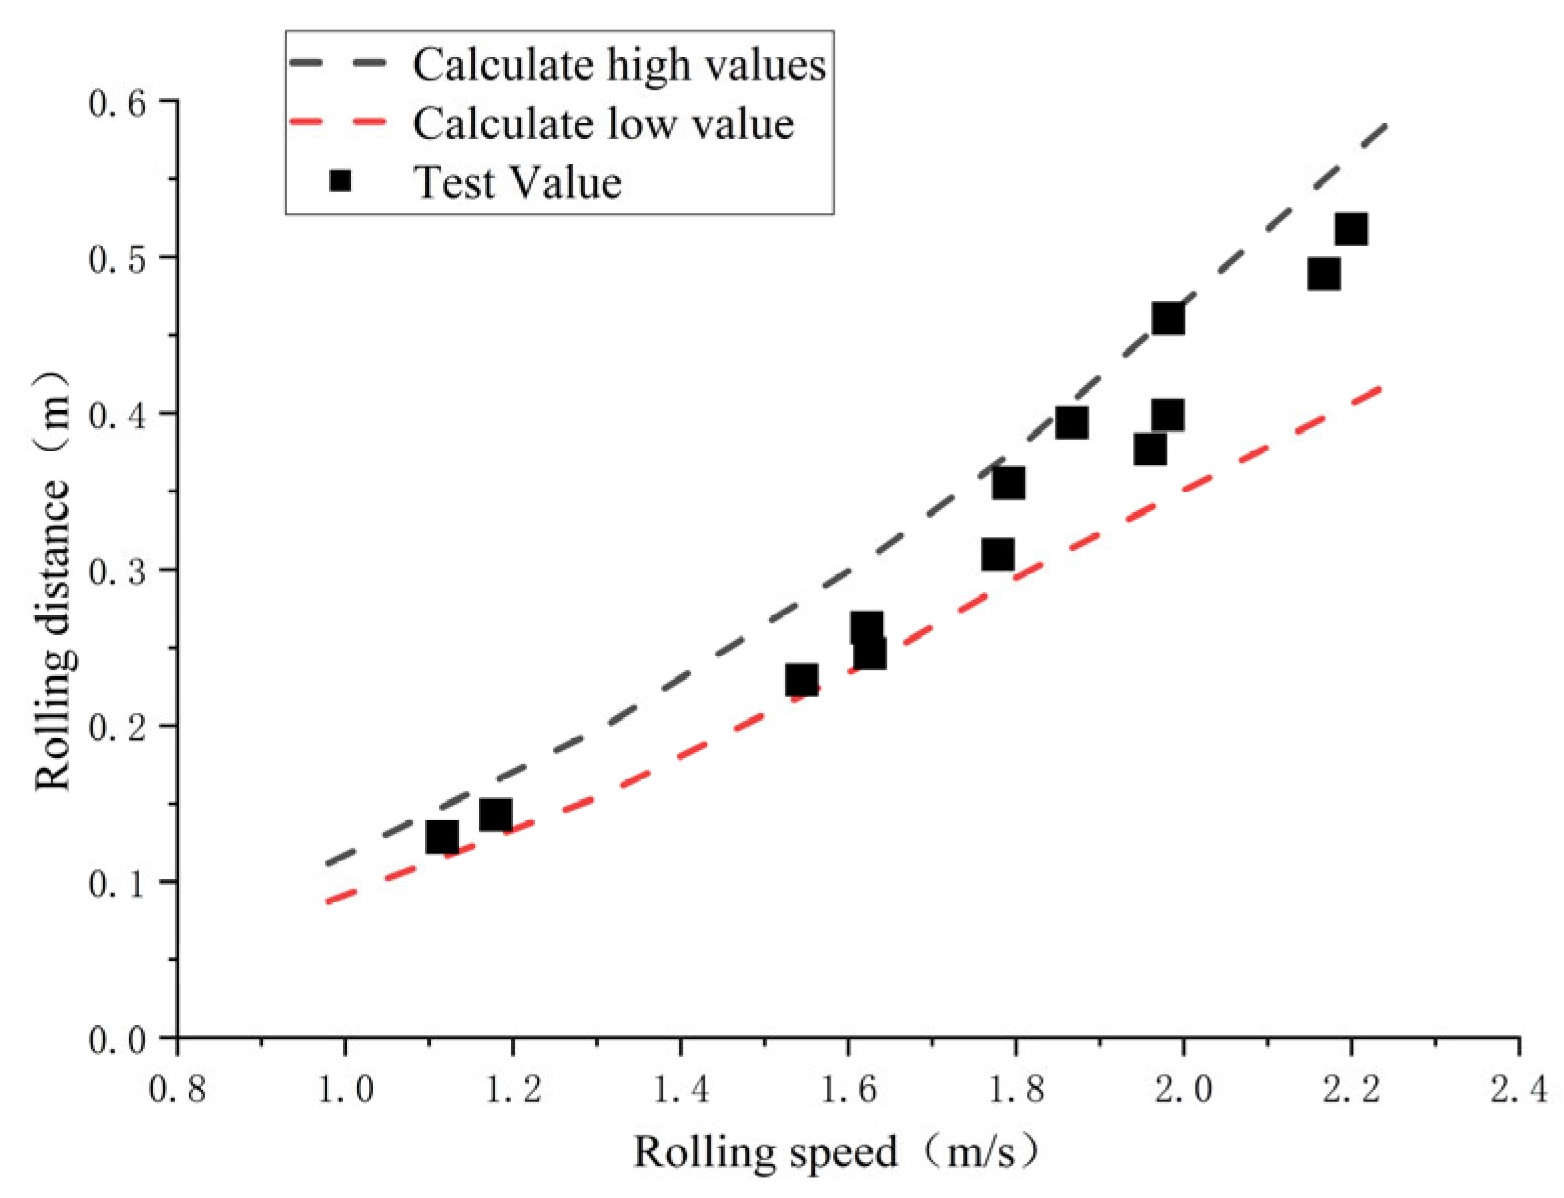
5. Experimental Results and Theoretical Formula Calculation Comparison
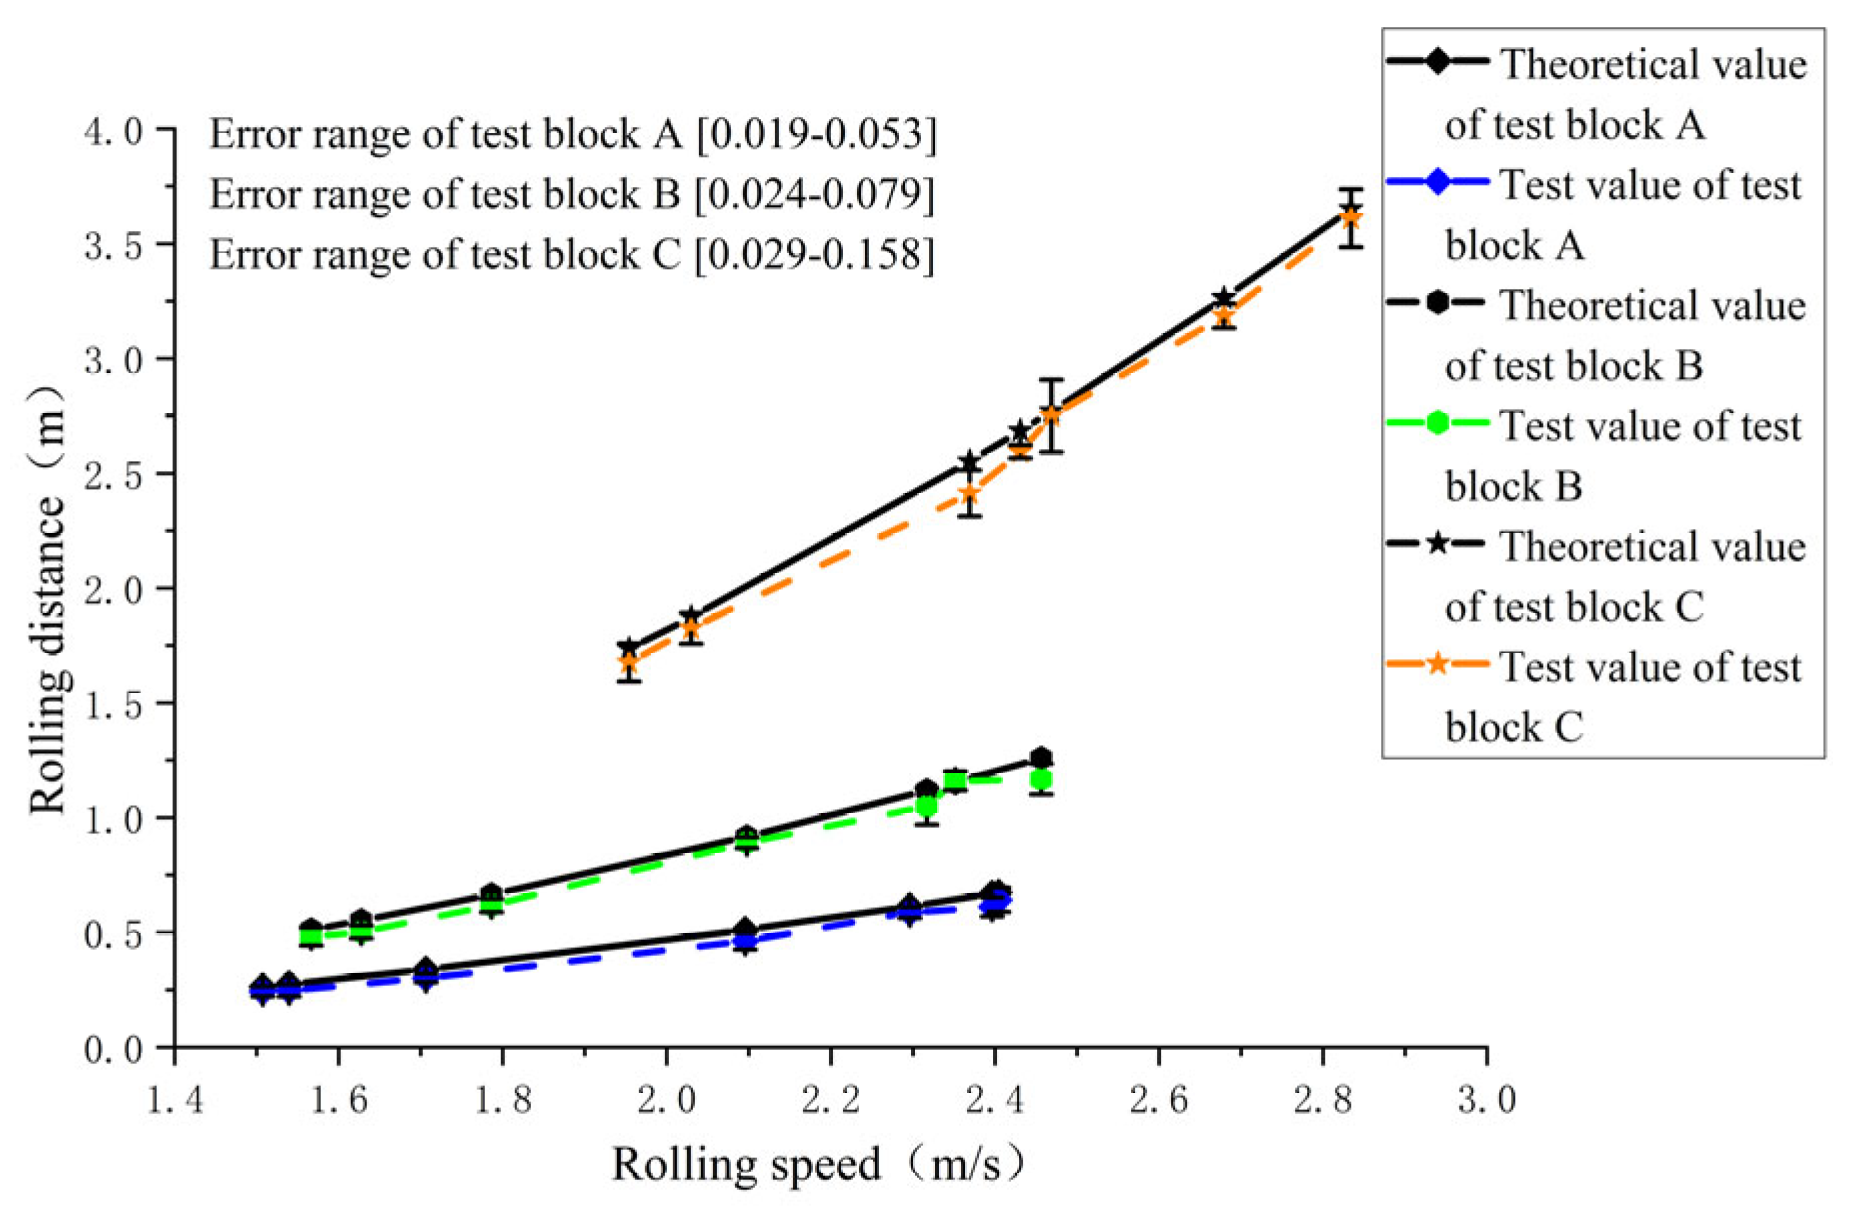
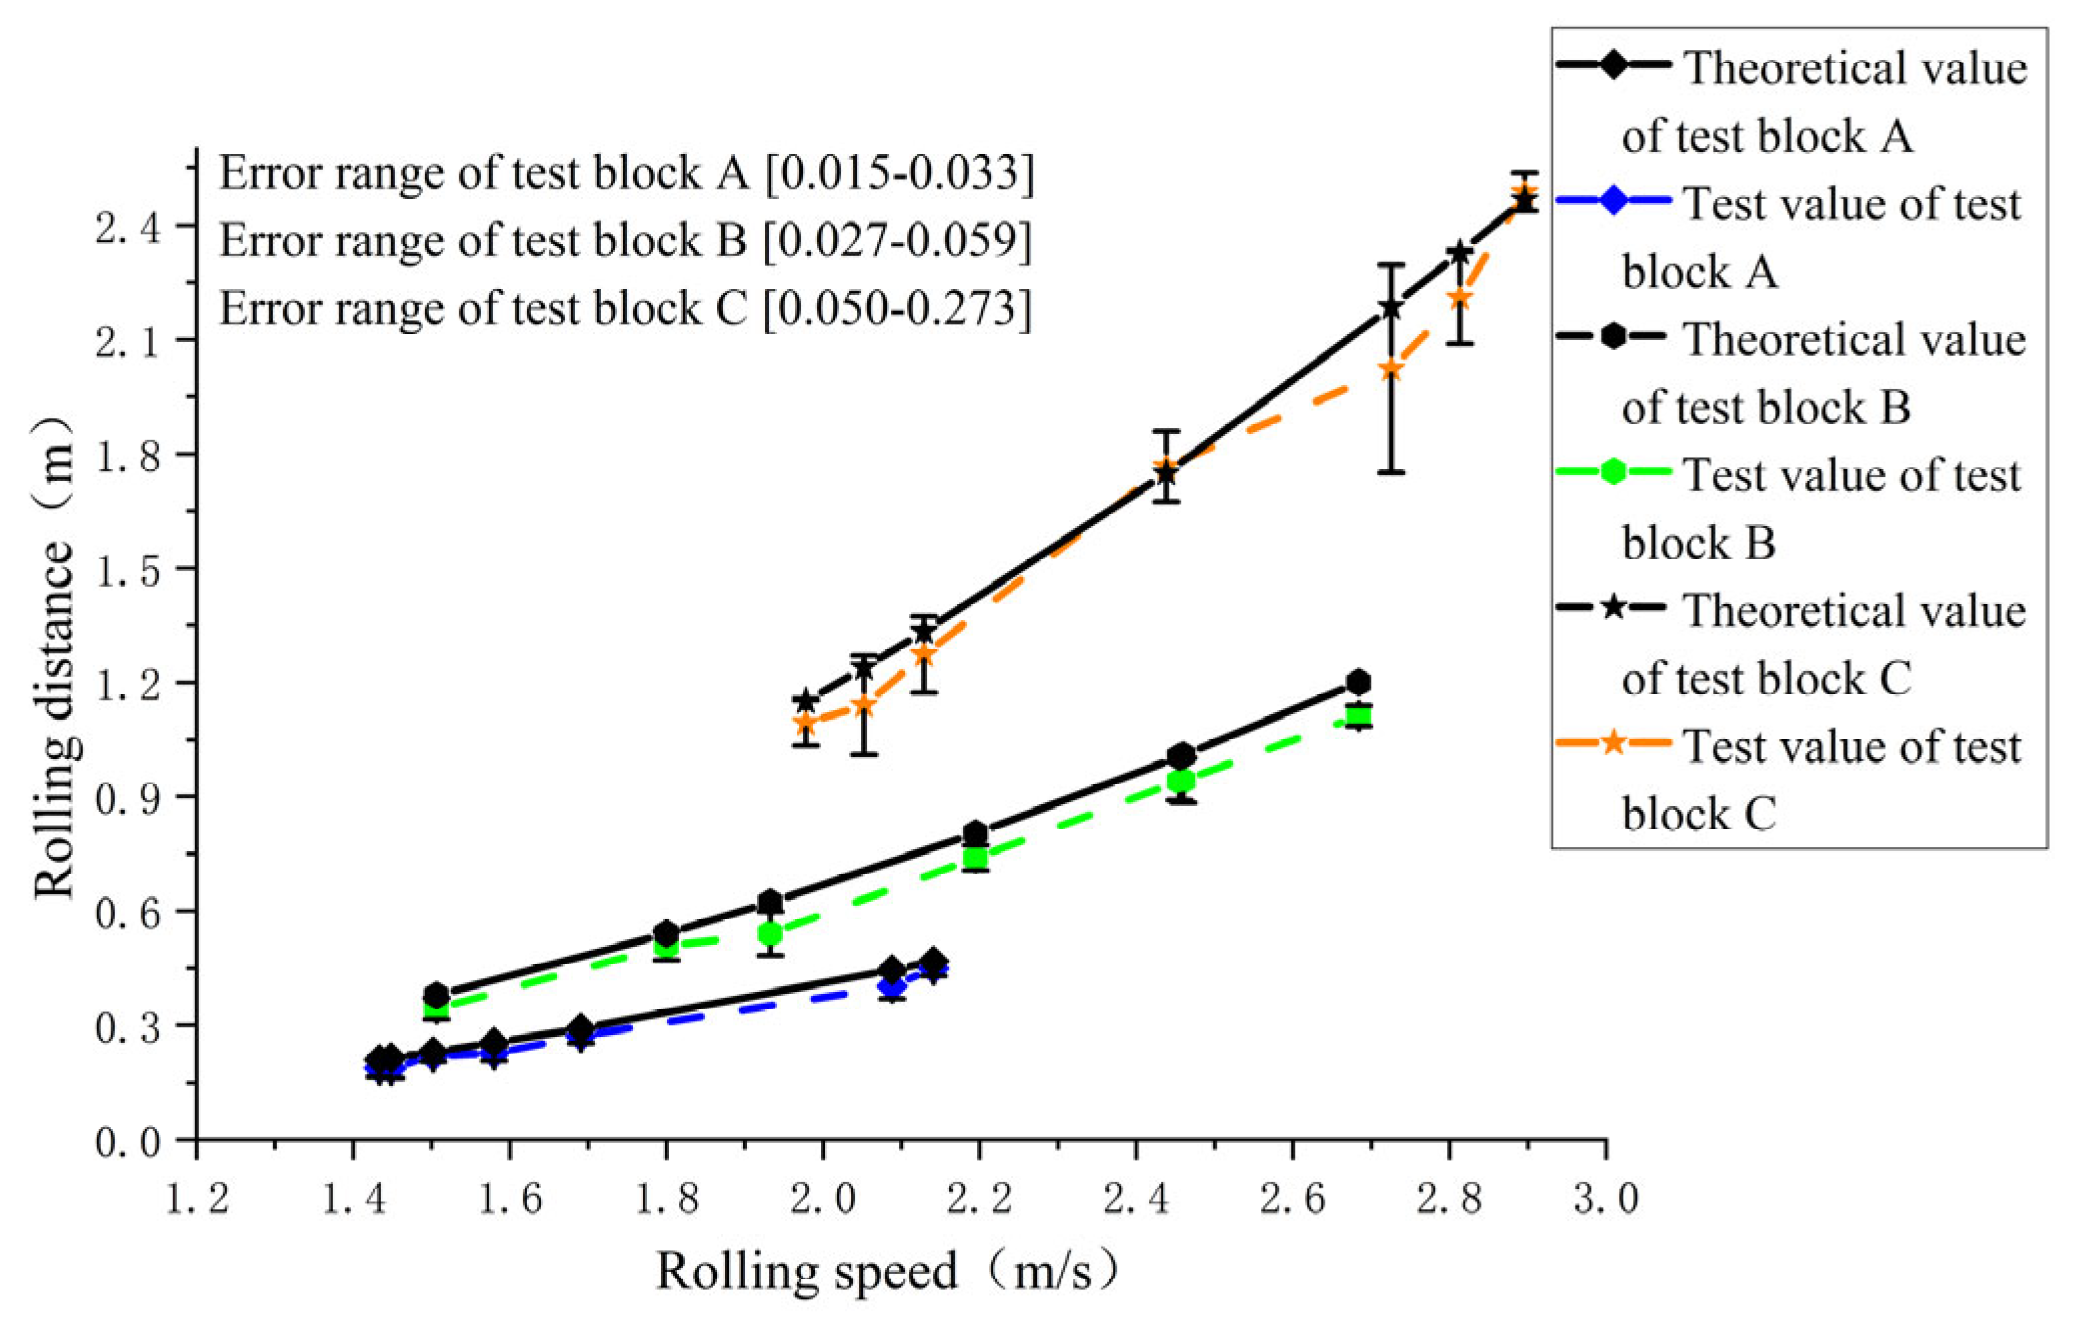
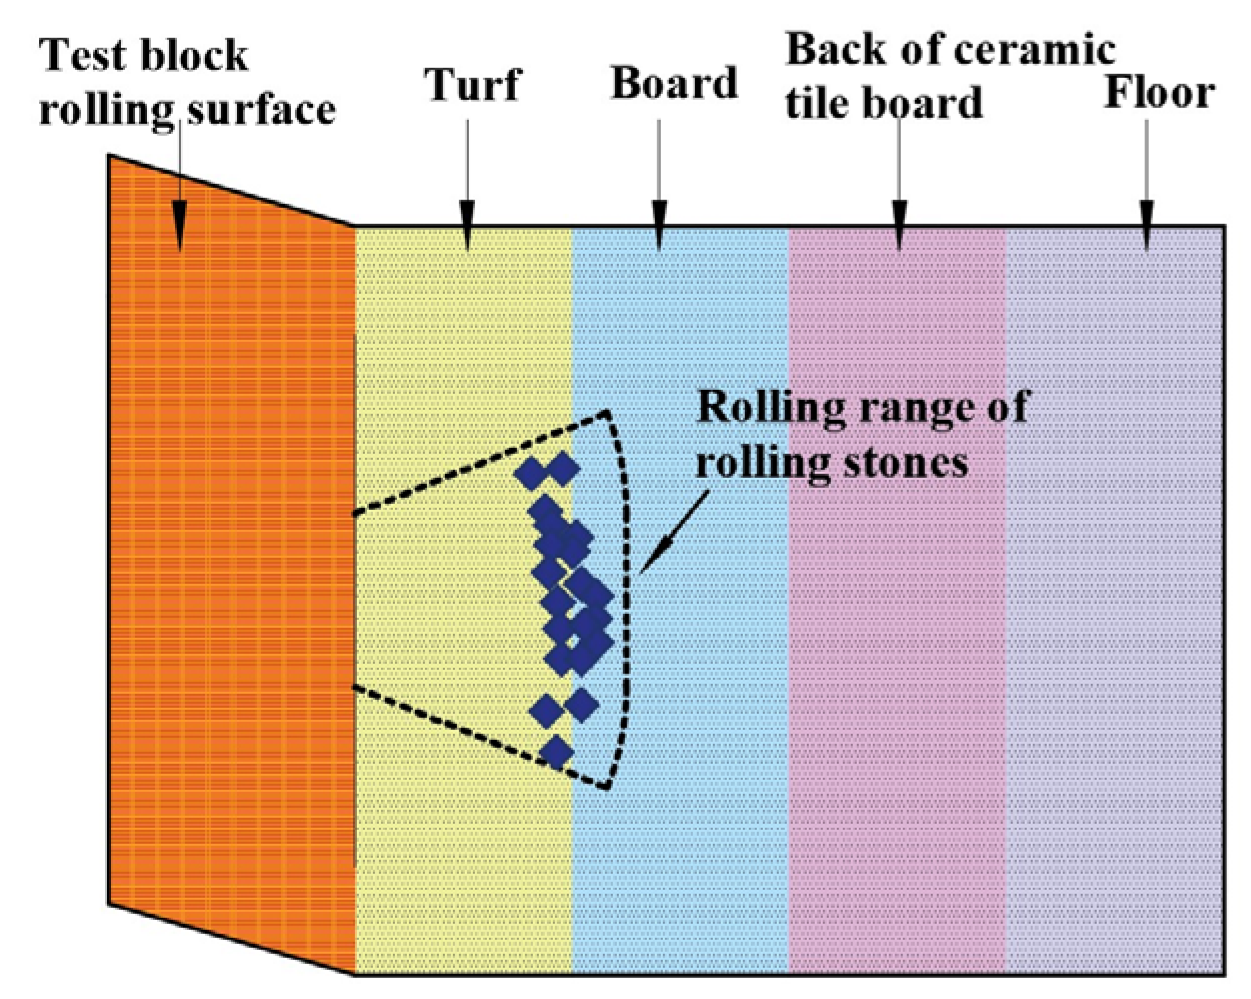
5.1. Comparison Analysis for Single Slope Characteristics
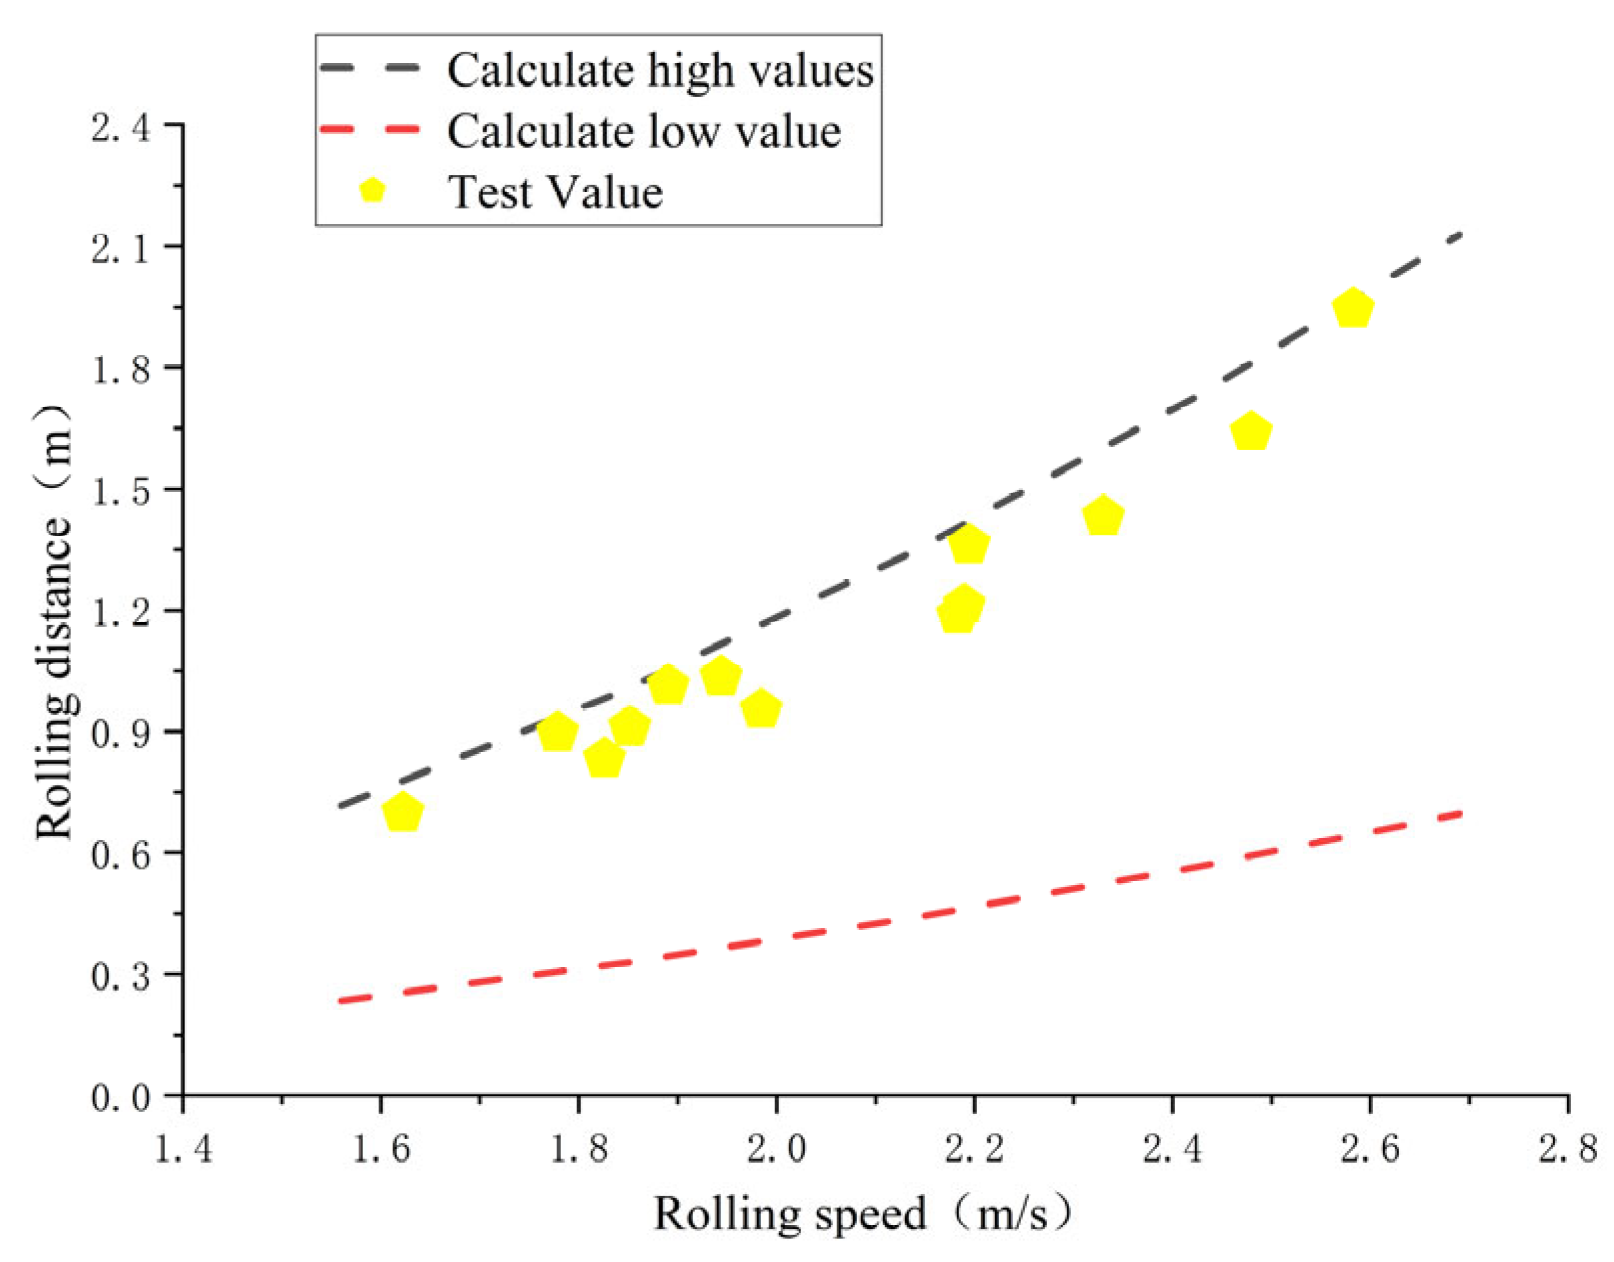
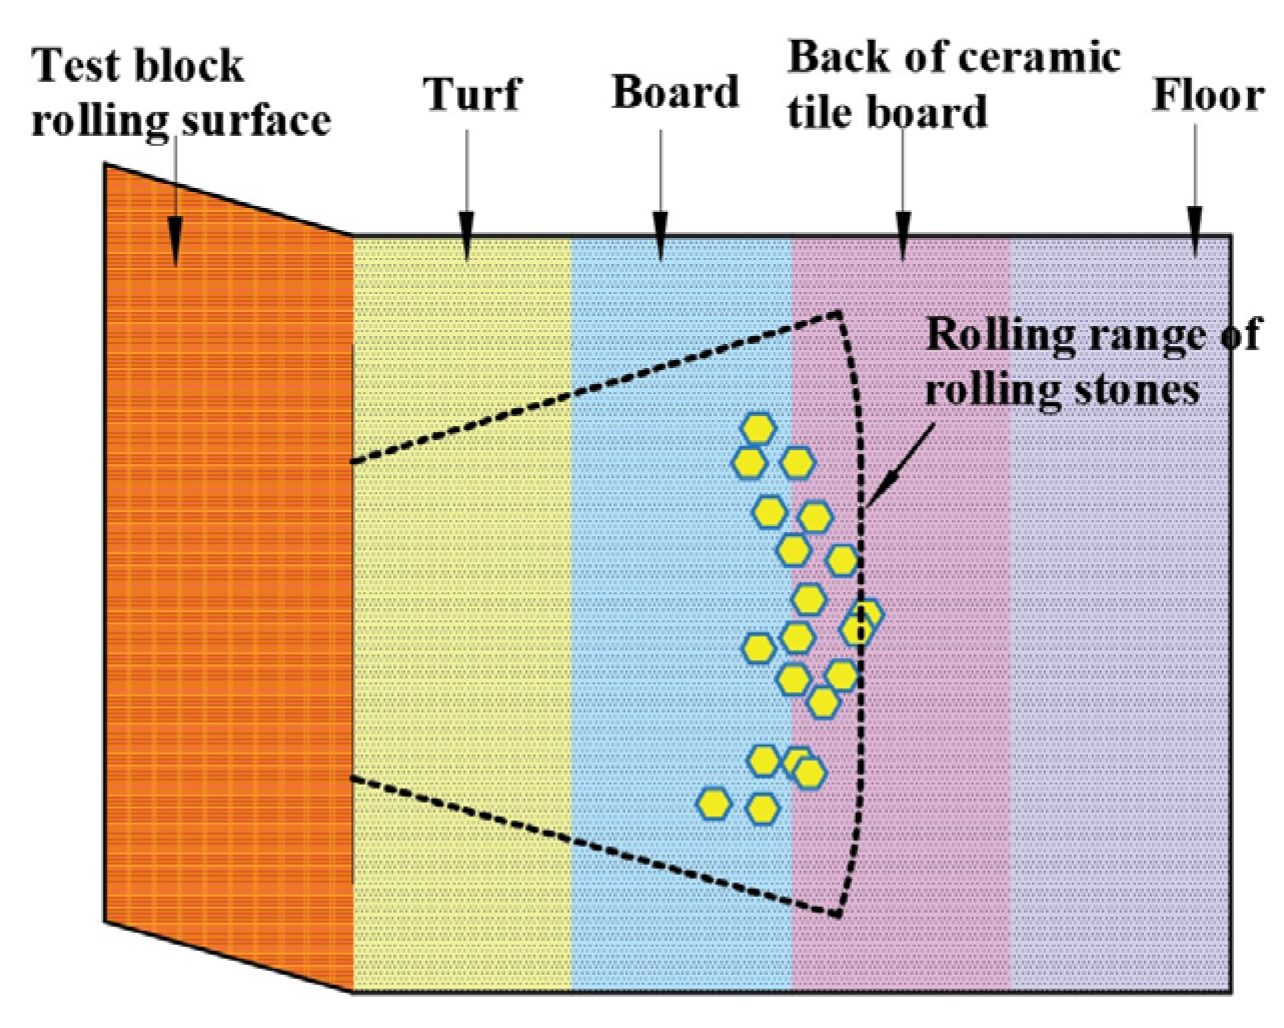
5.2. Comparison Analysis for Composite Slope Characteristics
6. Conclusions and Prospects
6.1. Conclusions
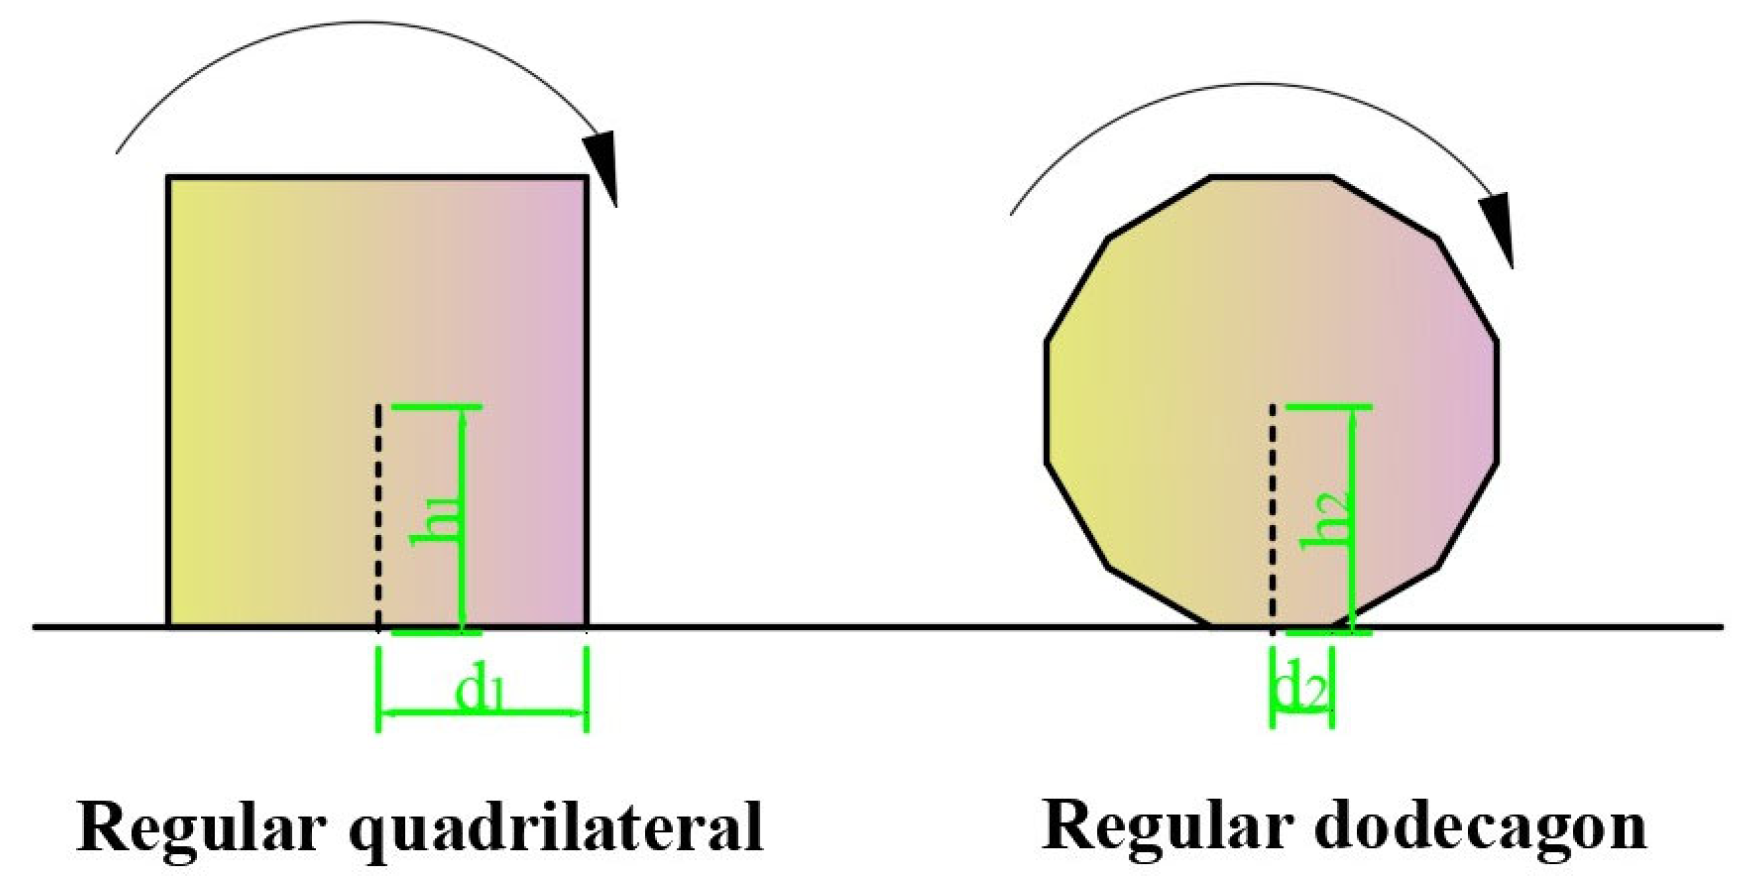
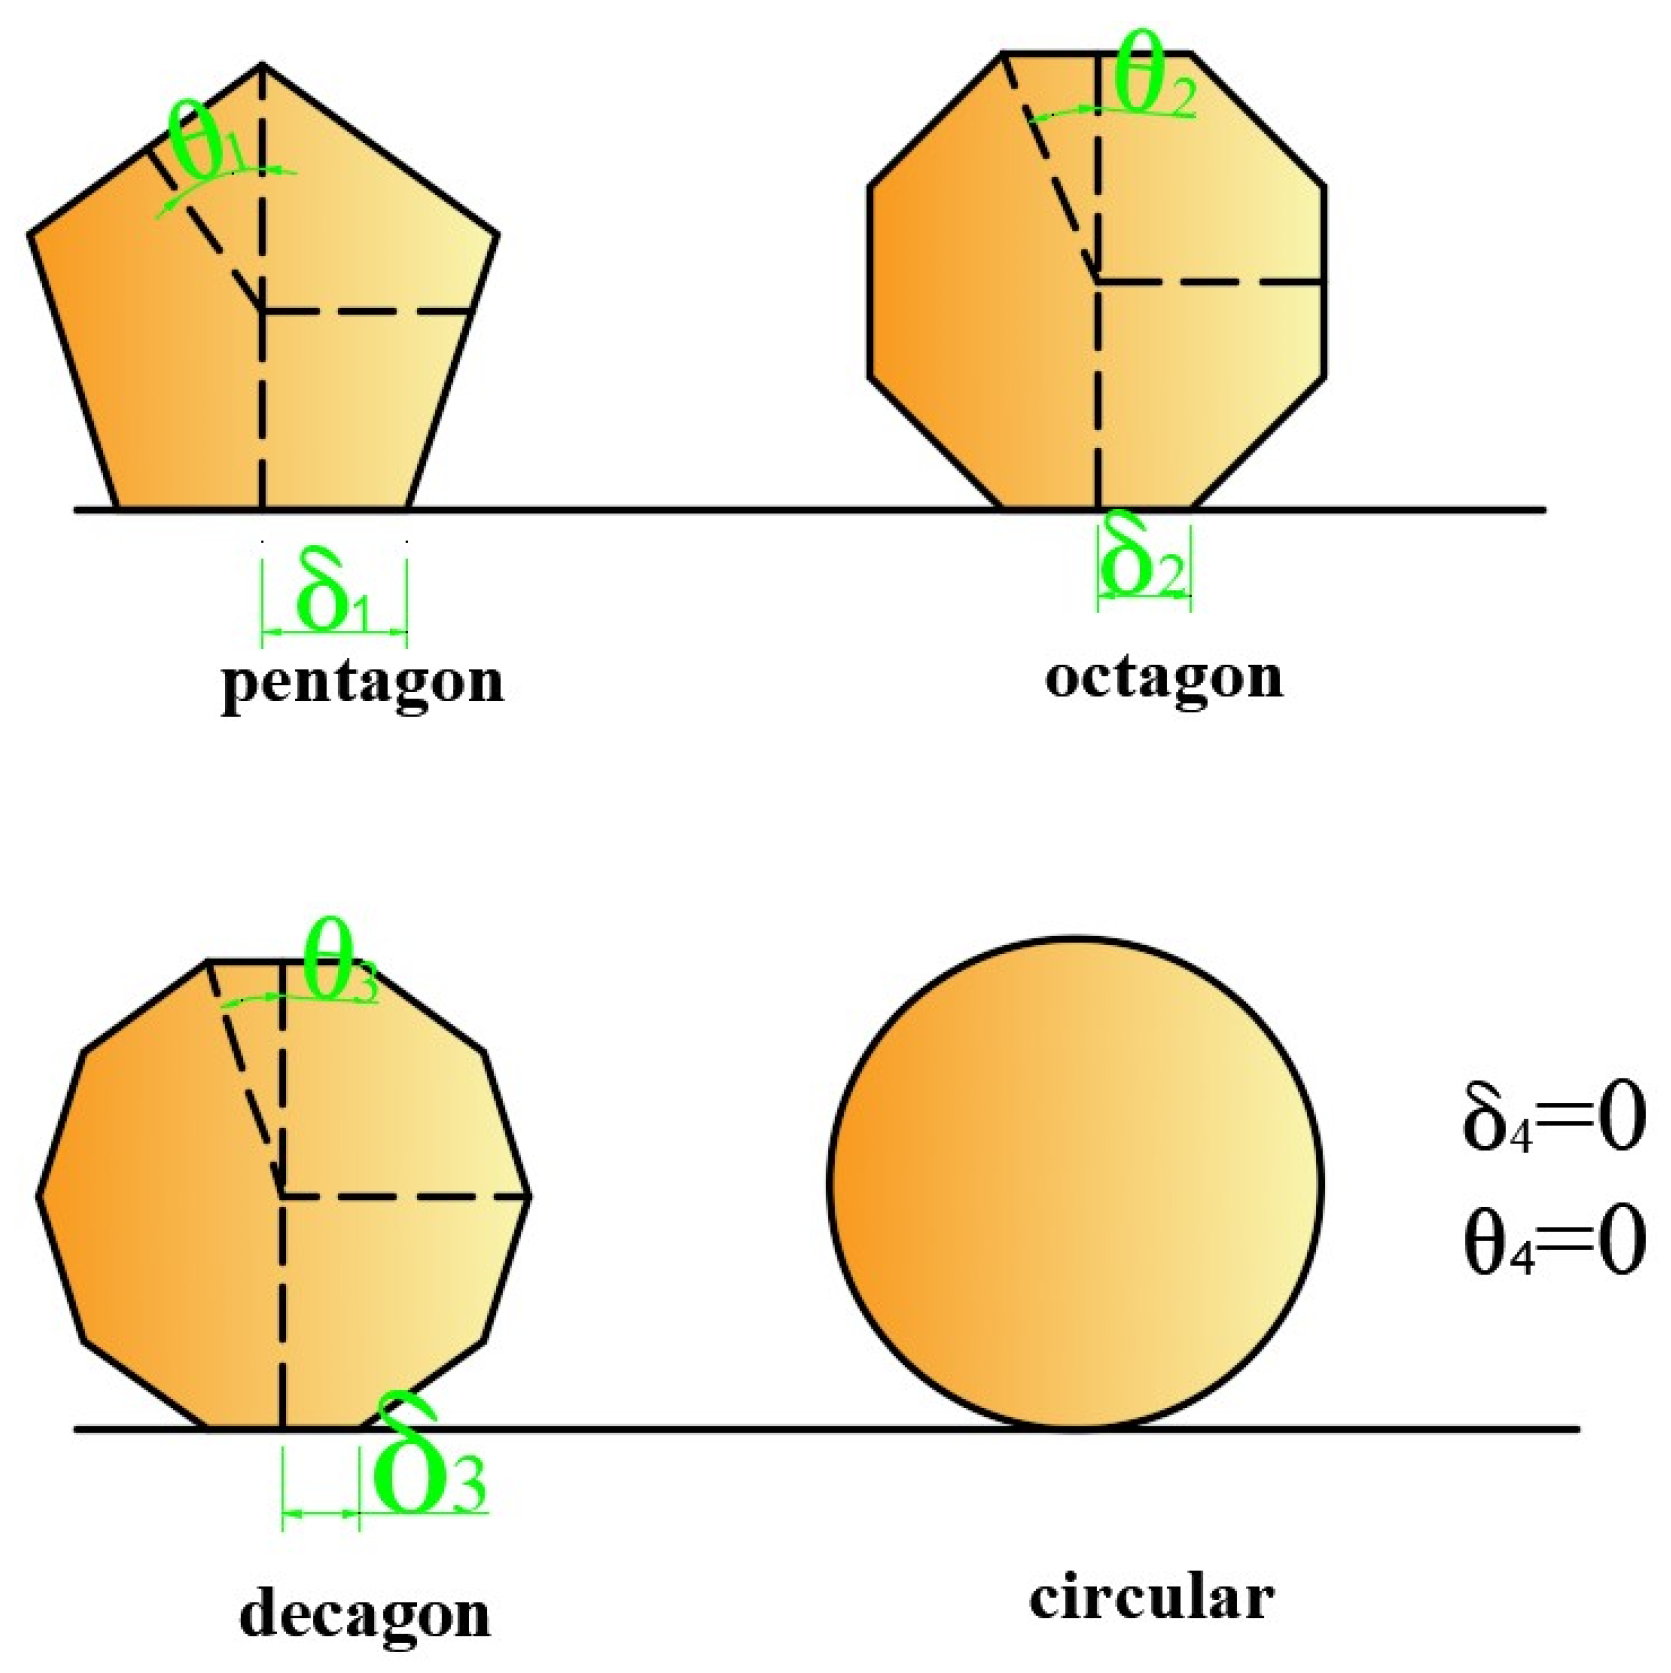
- The shape of rolling stones is a critical factor that impacts rolling distance, and it is associated with the number of edges in the stone’s two-dimensional cross-section perpendicular to the rolling surface. We can quantify the level of difficulty in stone rolling using the RF coefficient introduced in this study.
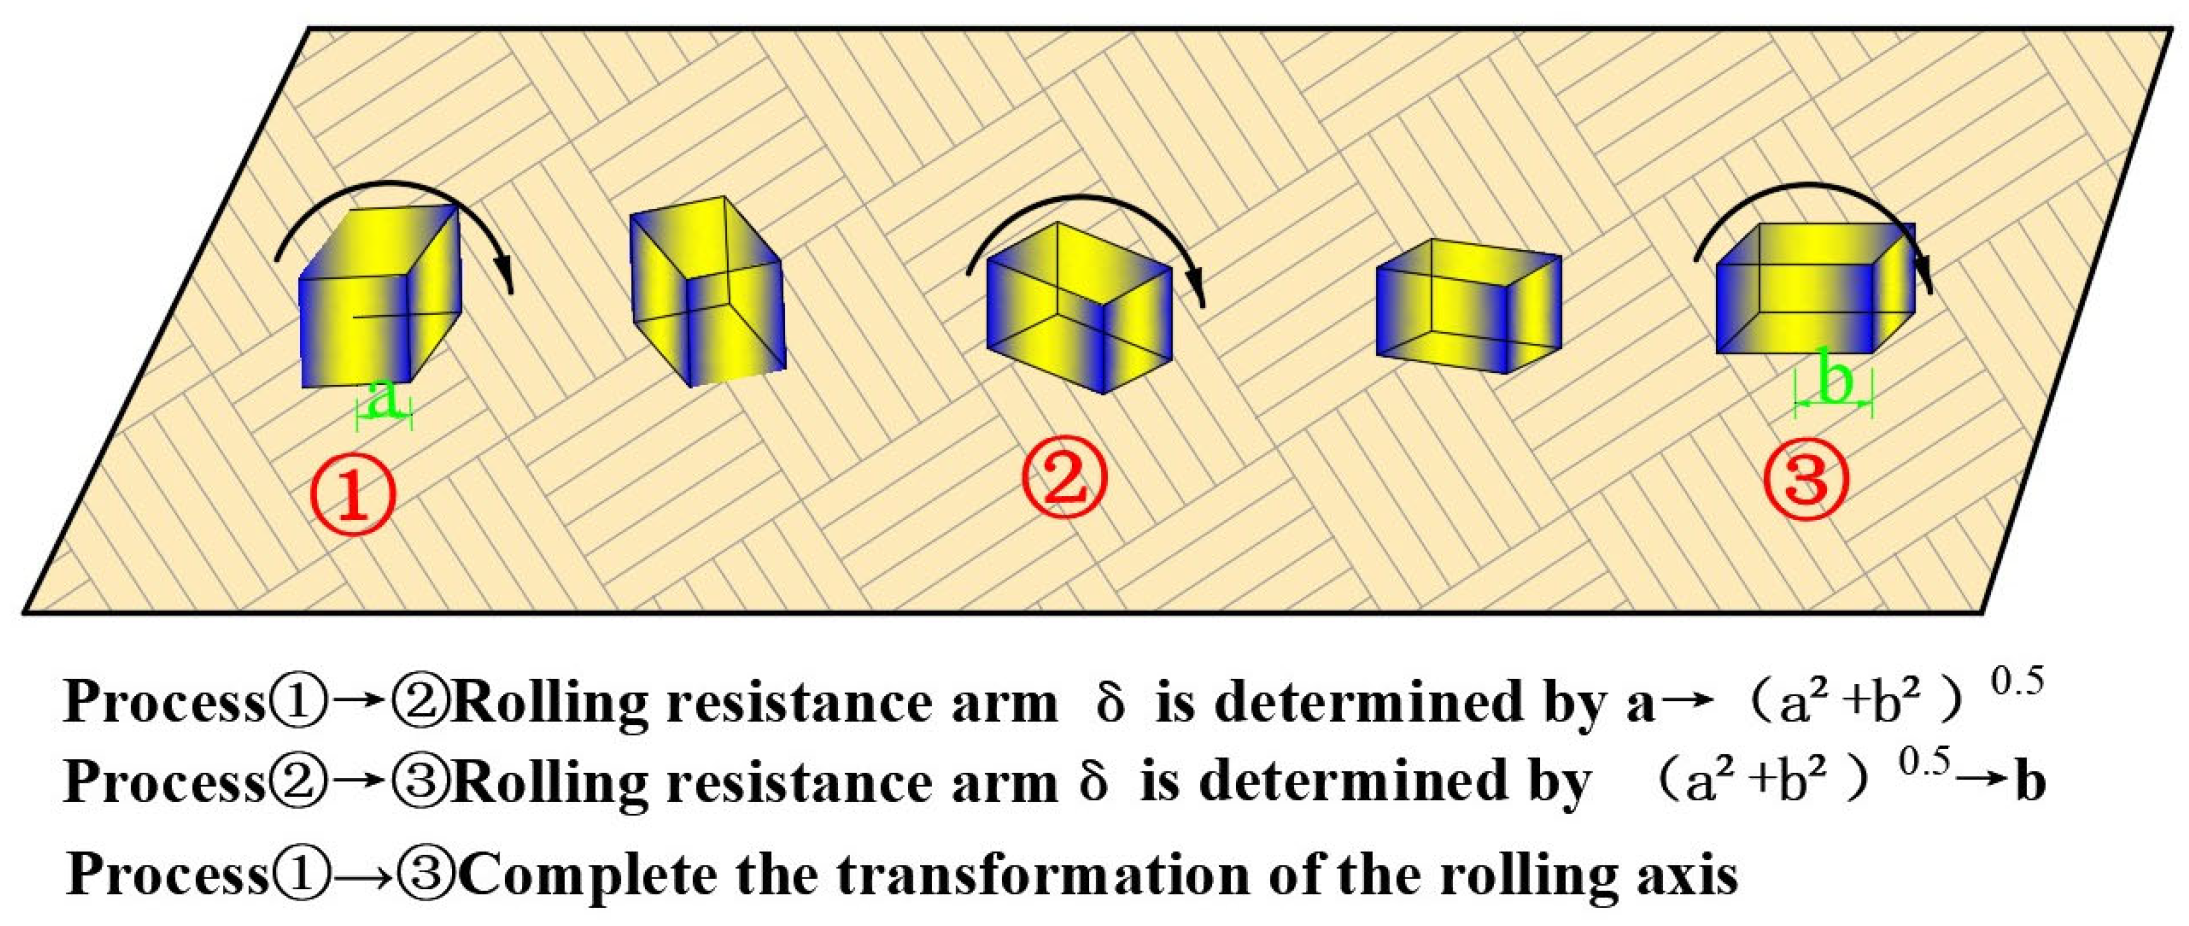
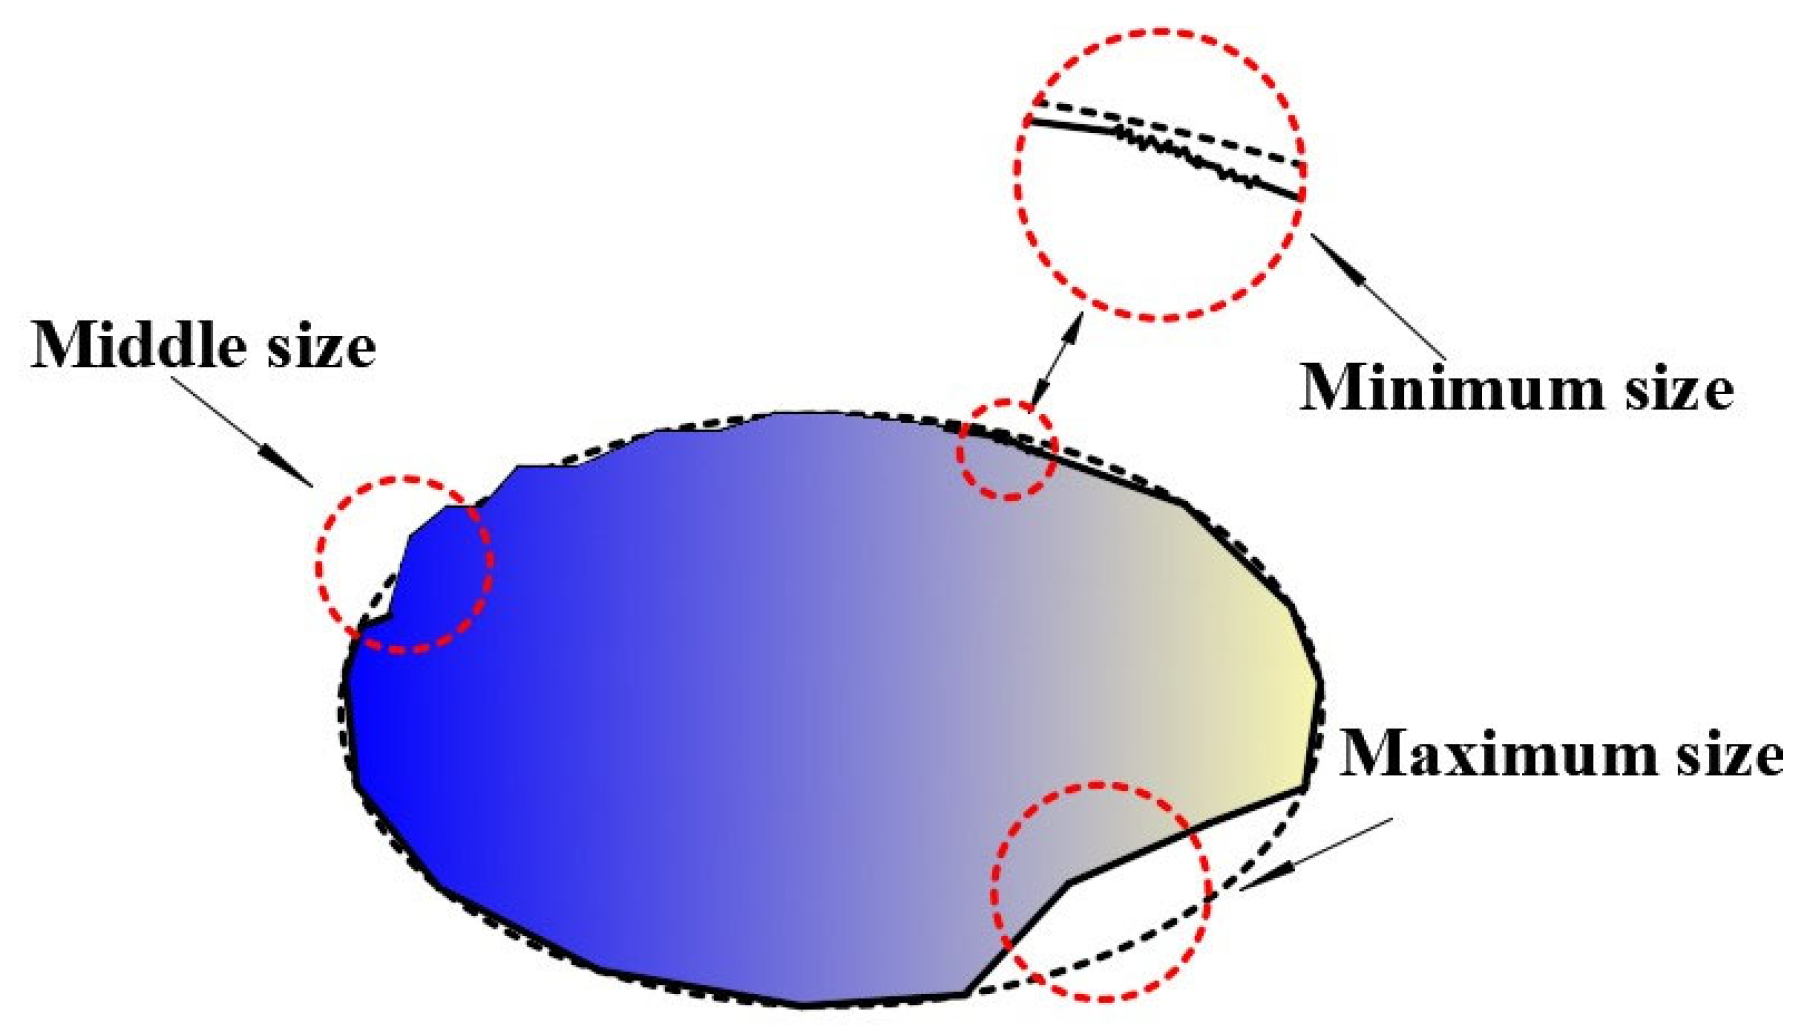
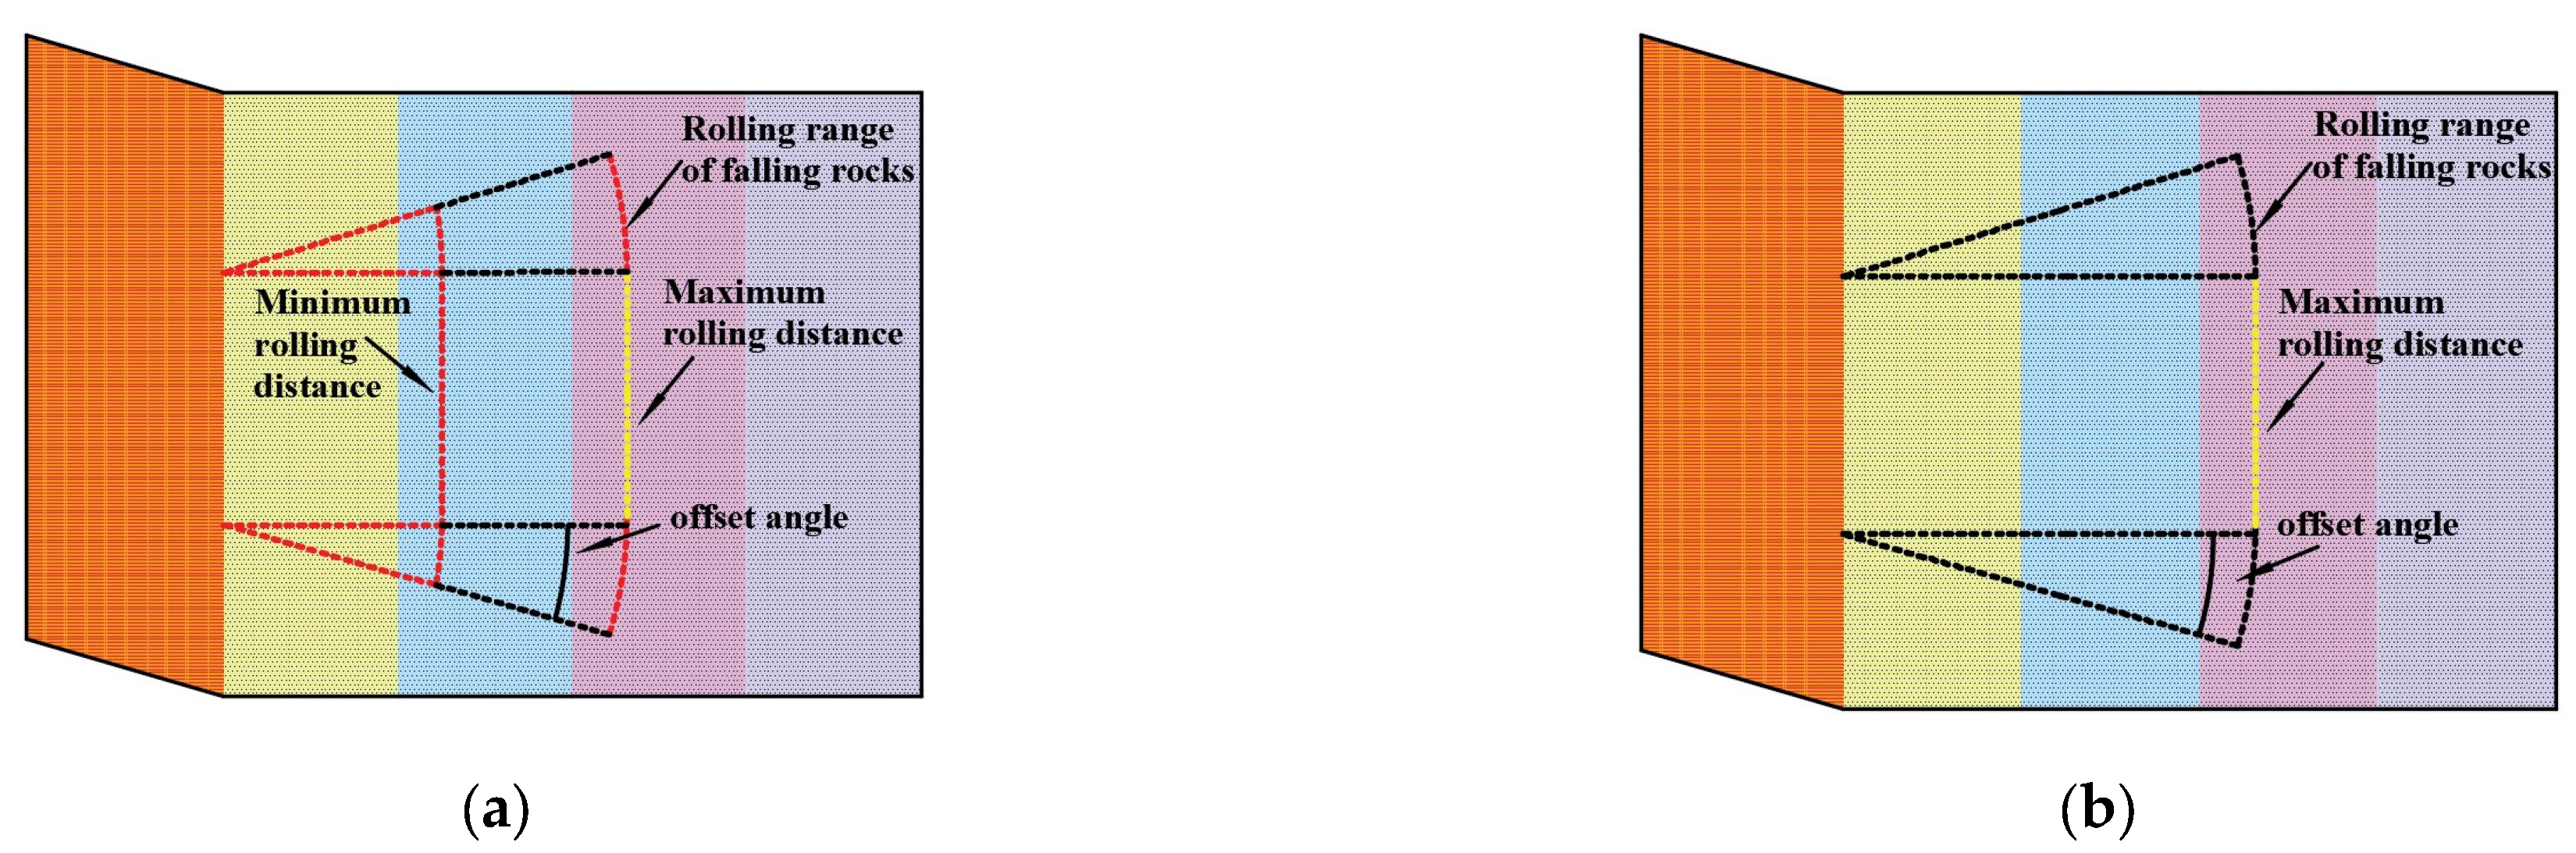
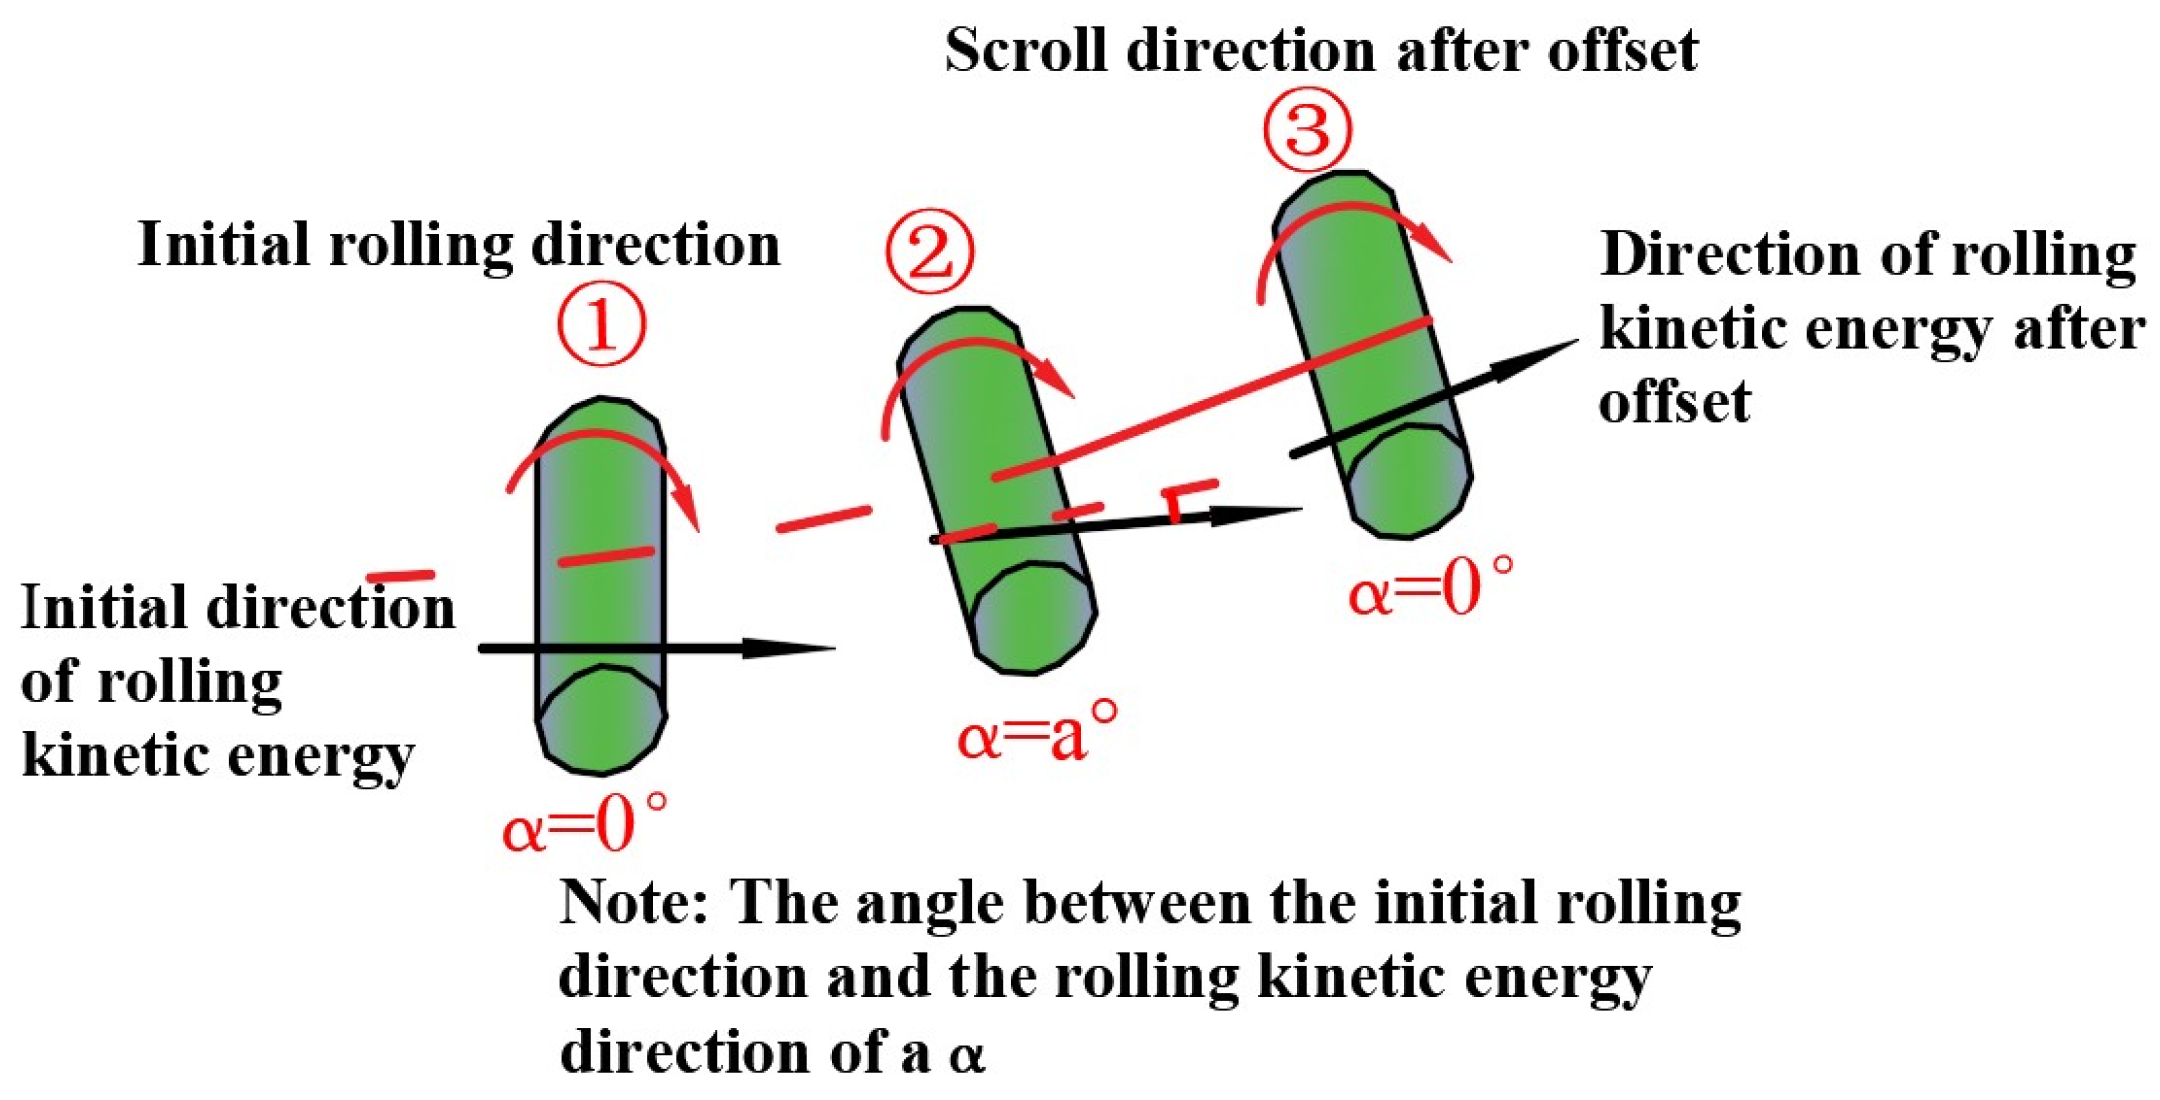
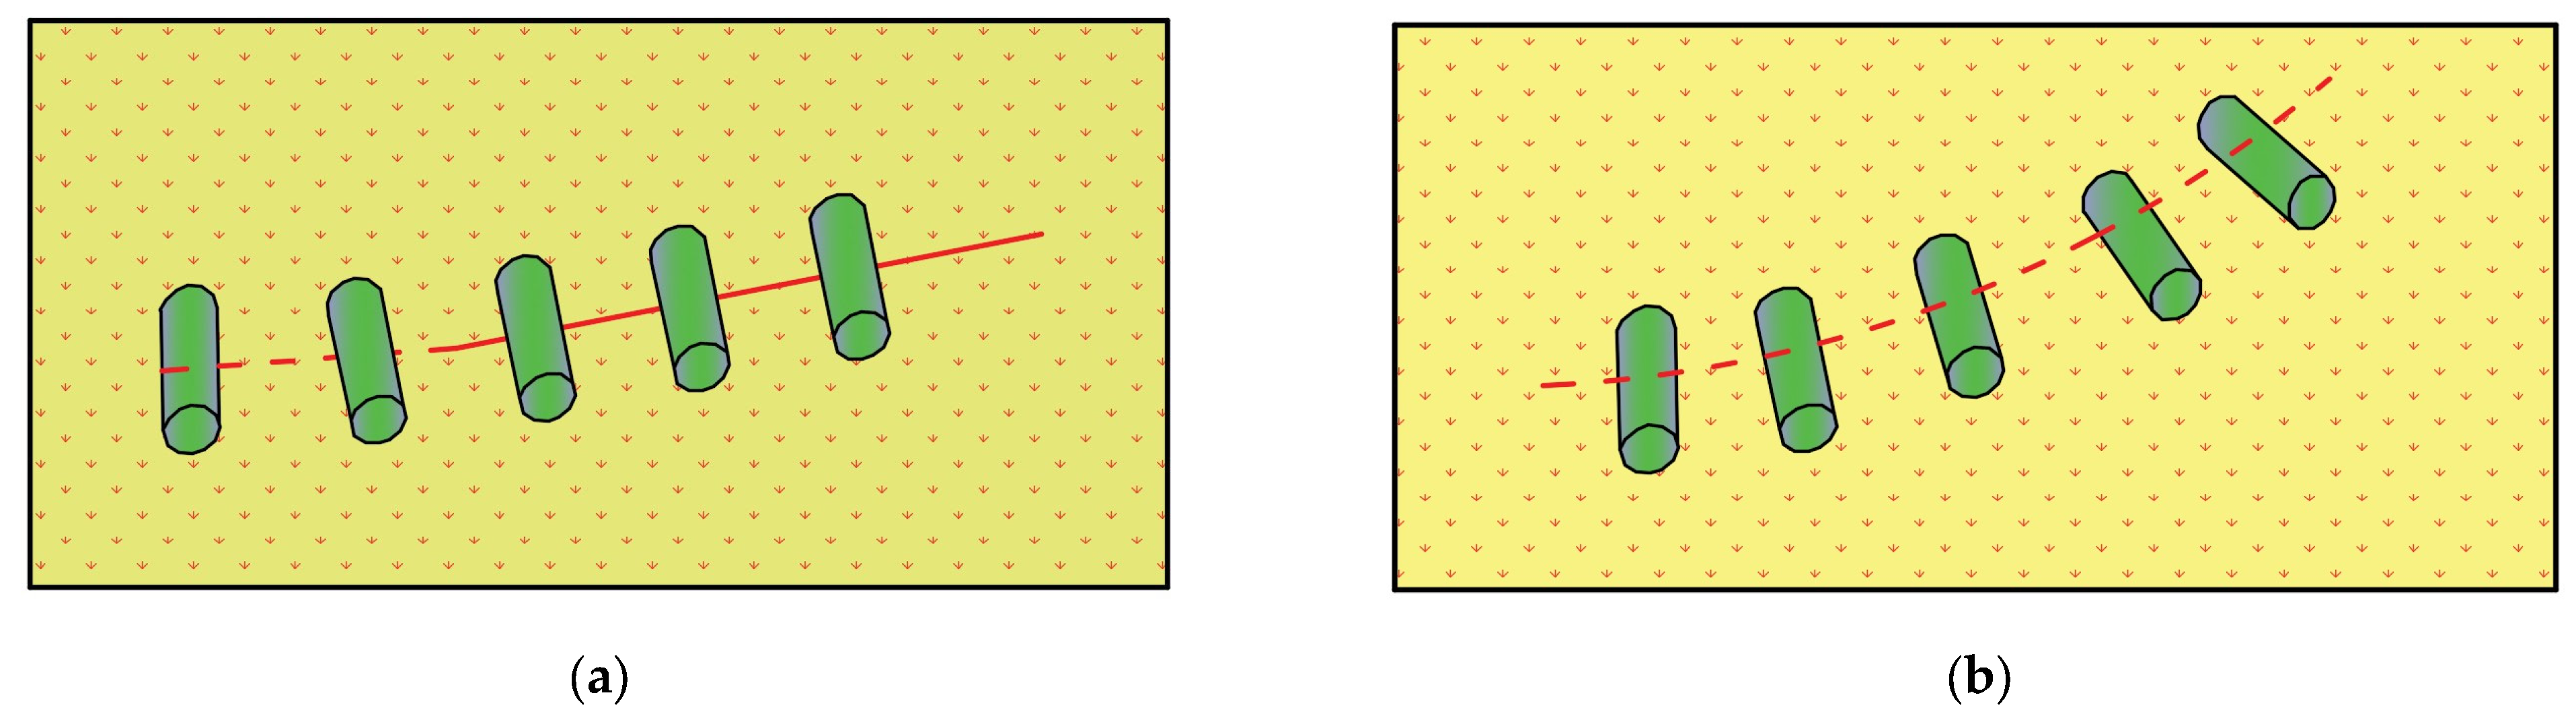
- Deviations or alterations in the rolling axis while a stone is rolling will influence the rolling distance. The degree of this impact is determined by the magnitude of variation in the deviation angle, with greater variations leading to increased energy consumption.
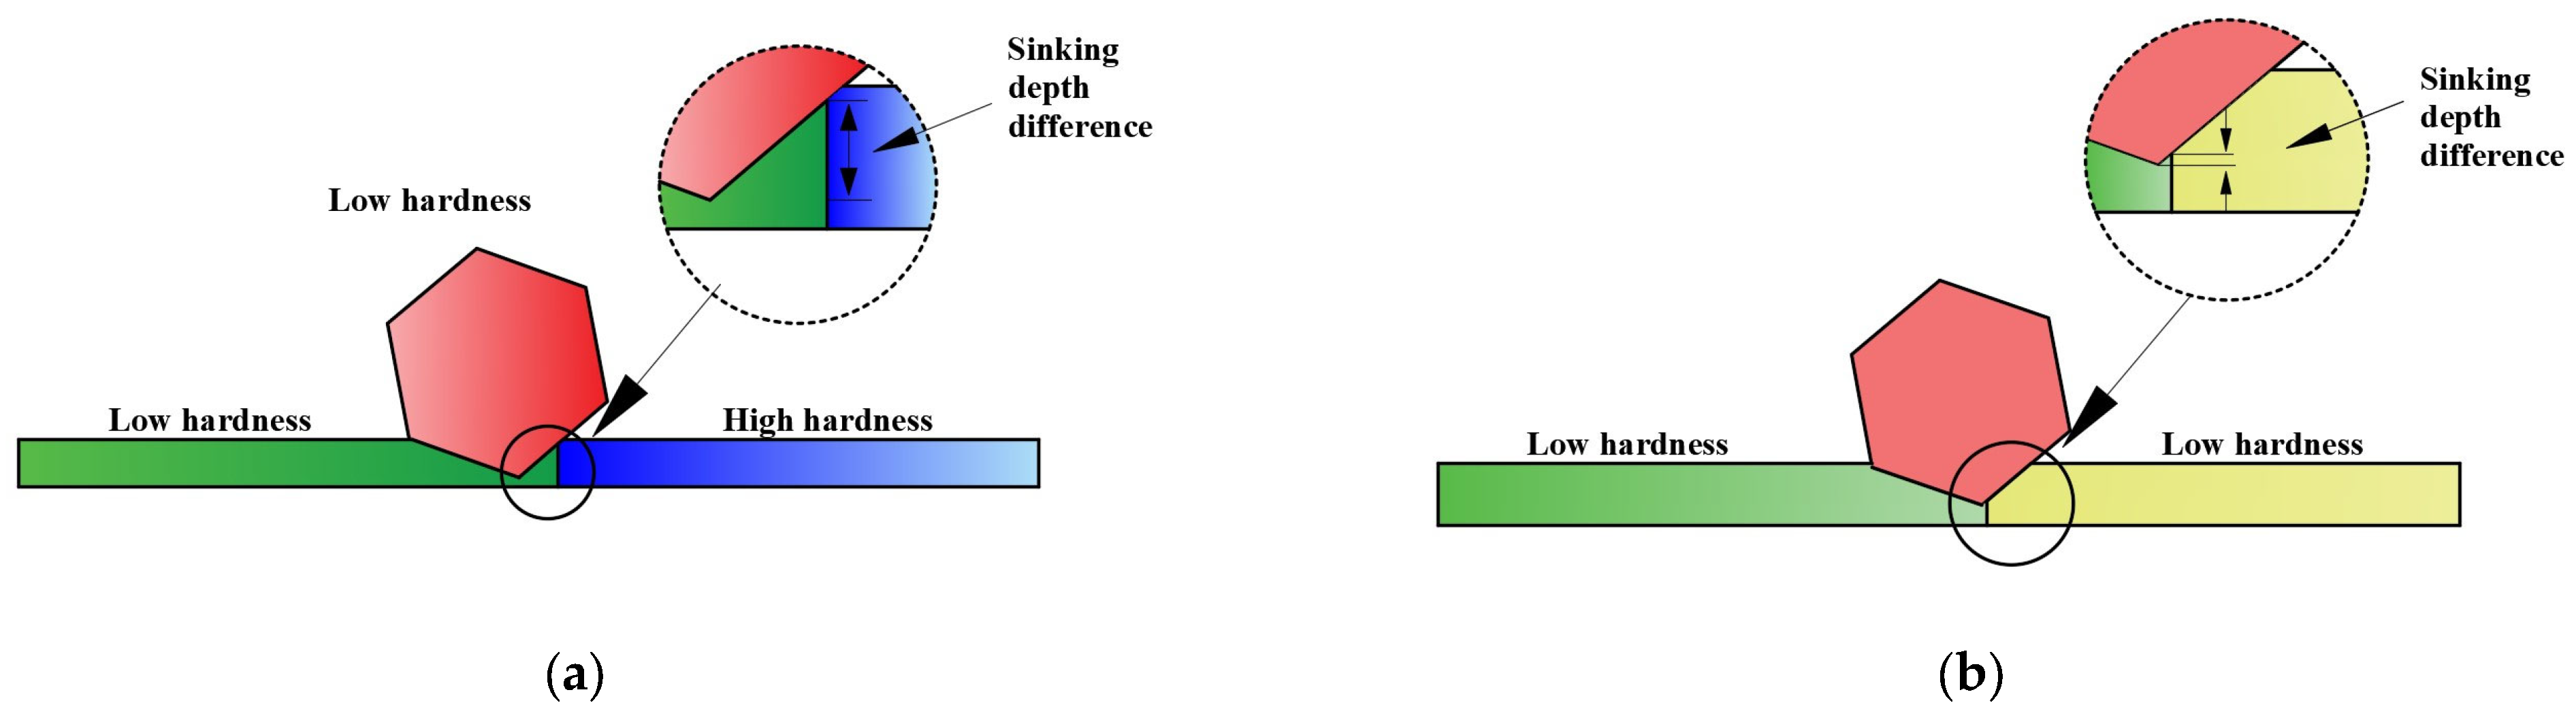
- When stones roll on composite ground with varying hardness on each side, the existence of “steps” created by differences in hardness can result in collisions or deviations at the boundary line. The degree of this impact relies on the size ratio between the stone and the “step”. A greater ratio leads to a reduced impact, while a smaller ratio has the opposite effect.
- Based on experimental data, the influence mechanism of shape on rolling stone distance was analyzed. A parameter quantifying the impact of stone shape on rolling distance was proposed and introduced into kinematic formulas. This led to rolling distance calculation formulas for stones of different shapes on different types of ground. Validation using experimental data showed that the errors between calculated and experimental values were small. It was also noted that energy consumption resulting from stone deviation and changes in the rolling axis during rolling reduced the rolling distance.
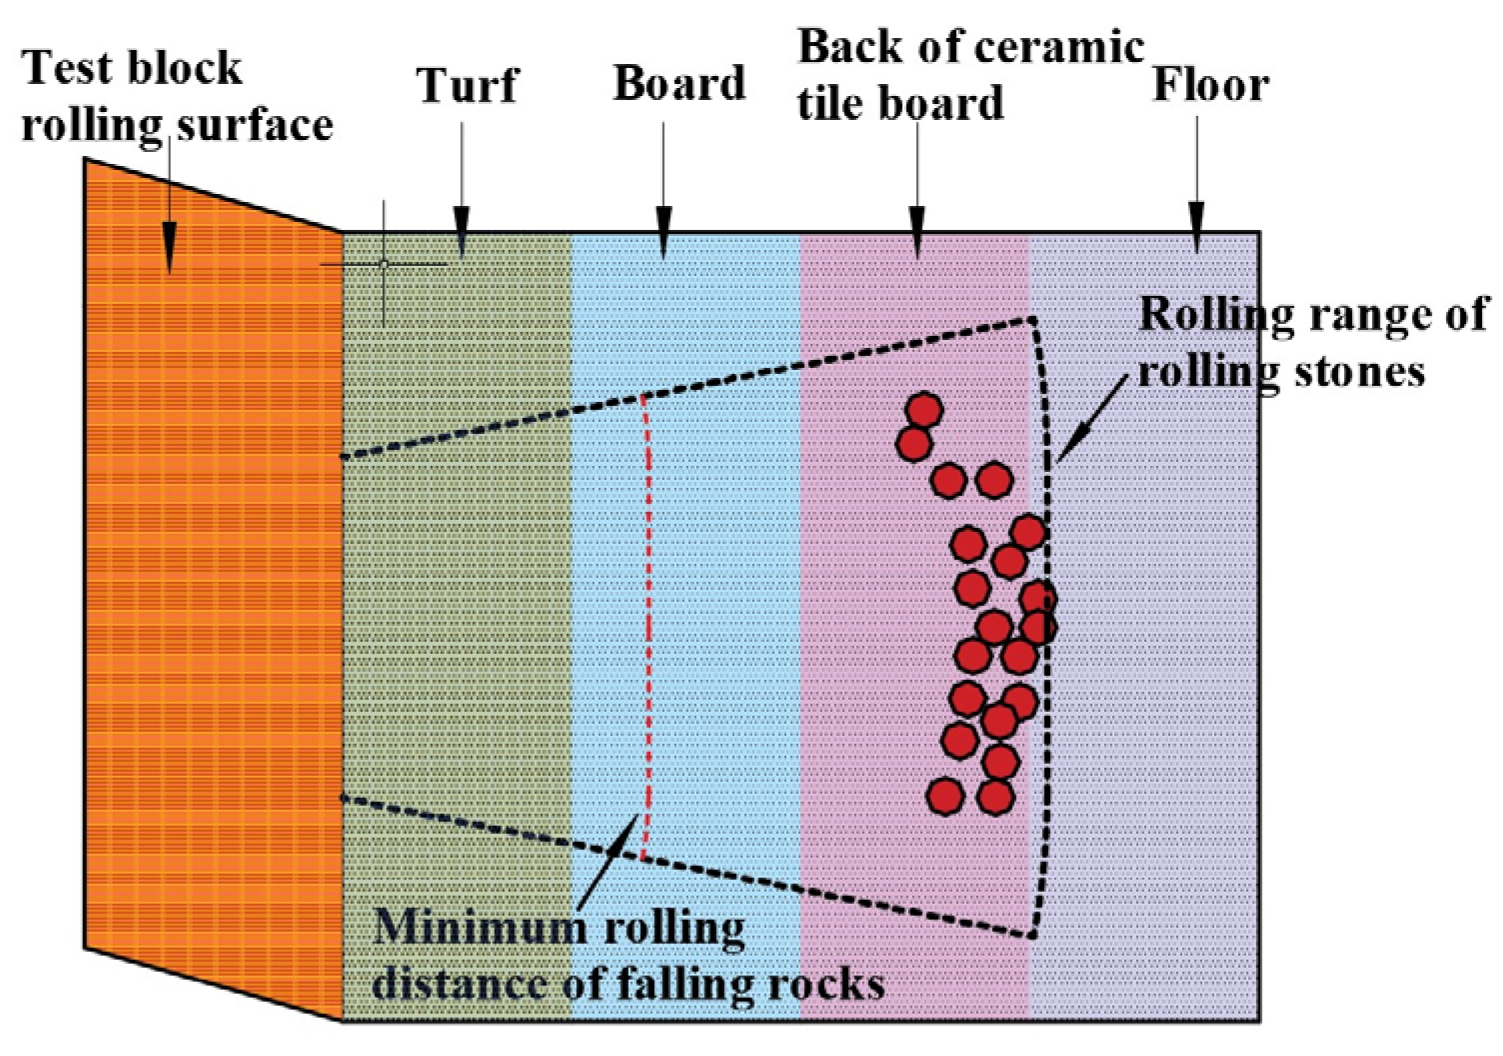
- By using the proposed formulas and considering the deviation of stones with different shapes, the influence range of stones with different shapes rolling at different speeds can be plotted. Model tests were conducted for validation. However, the reduction in the actual terrain and geomorphology in natural rockfall disasters in model tests is limited, and only some factors that affect the rolling distance of rock blocks can be considered. It is impossible to completely replicate the natural characteristics of mountainous terrain. Therefore, after on-site testing verification, these findings can serve as a reference for the assessment of rolling stone danger zones and protection design.
6.2. Prospects
Author Contributions
Funding
Institutional Review Board Statement
Data Availability Statement
Acknowledgments
Conflicts of Interest
References
- Luo, G.; Cheng, Q.G.; Shen, W.G. Research Status and Development Trend of the High-Altitude Extremely-Energetic Rockfalls. Earth Sci. 2022, 47, 913–934. [Google Scholar]
- Zhang, Y.H.; Zhang, M.X.; Chen, Q.; Luo, K.J. Kinematics analysis for calculating distance of rockfalls on typical loose media slope. J. Shanghai Univ. (Nat. Sci. Ed.) 2017, 23, 949–960. [Google Scholar]
- Frattini, P.; Crosta, G.B.; Agliardi, F. 22-Rockfall characterization and modeling. In Landslides: Types, Mechanisms and Modeling; Cambridge University Press: Cambridge, UK, 2012; pp. 267–281. [Google Scholar]
- Leine, R.I.; Schweizer, A.; Christen, M.; Glover, J.; Bartelt, P.; Gerber, W. Simulation of rockfall trajectories with consideration of rock shape. Multibody Syst. Dyn. 2014, 32, 241–271. [Google Scholar] [CrossRef]
- Vishal, V.; Siddique, T.; Purohit, R.; Phophliya, M.K.; Pradhan, S.P. Hazard assessment in rockfall-prone Himalayan slopes along National Highway-58, India: Rating and simulation. Nat. Hazards 2017, 85, 487–503. [Google Scholar] [CrossRef]
- Sengani, F.; Mulenga, F. An improved hazard assessment chart for rock falls in near vertical blocky rock environments. Environ. Earth Sci. 2021, 80, 647. [Google Scholar] [CrossRef]
- Moos, C.; Dorren, L.; Stoffel, M. Quantifying the effect of forests on frequency and intensity of rockfalls. Nat. Hazards Earth Syst. Sci. 2017, 17, 291–304. [Google Scholar] [CrossRef]
- Yan, P.; Zhang, J.; Kong, X.; Fang, Q. Numerical simulation of rockfall trajectory with consideration of arbitrary shapes of falling rocks and terrain. Comput. Geotech. 2020, 122, 103511. [Google Scholar] [CrossRef]
- Shirzadi, A.; Saro, L.; Joo, O.H.; Chapi, K. A GIS-based logistic regression model in rock-fall susceptibility mapping along a mountainous road: Salavat Abad case study, Kurdistan, Iran. Nat. Hazards 2012, 64, 1639–1656. [Google Scholar] [CrossRef]
- Zhang, Y.; Zhang, J.; Wang, Q. Scene analysis of landslide geoscience and characterization of scene evolution. Acta Geophys. 2023, 71, 1539–1564. [Google Scholar] [CrossRef]
- Perret, S.; Dolf, F.; Kienholz, H. Rockfalls into forests: Analysis and simulation of rockfall trajectories—Considerations with respect to mountainous forests in Switzerland. Landslides 2004, 1, 123–130. [Google Scholar] [CrossRef]
- Bourrier, F.; Berger, F.; Tardif, P.; Dorren, L.; Hungr, O. Rockfall rebound: Comparison of detailed field experiments and al-ternative modelling approaches. Earth Surf. Process. Landf. 2012, 37, 656–665. [Google Scholar] [CrossRef]
- Zhu, C.; He, M.-C.; Karakus, M.; Zhang, X.-H.; Guo, Z. The collision experiment between rolling stones of different shapes and protective cushion in open-pit mines. J. Mt. Sci. 2021, 18, 1391–1403. [Google Scholar] [CrossRef]
- Gao, G.; Meguid, M.A. On the role of sphericity of falling rock clusters—Insights from experimental and numerical investigations. Landslides 2018, 15, 219–232. [Google Scholar] [CrossRef]
- Kim, D.H.; Gratchev, I.; Berends, J.; Balasubramaniam, A. Calibration of restitution coefficients using rockfall simulations based on 3D photo-grammetry model: A case study. Nat. Hazards 2015, 78, 1931–1946. [Google Scholar] [CrossRef]
- Fityus, S.; Giacomini, A.; Thoeni, K. The Influence of Shape on the Inherent Rolling Potential of Loose Rocks. In Engineering Geology for Society and Territory—Volume 2: Landslide Processes; Springer International Publishing: Cham, Switzerland, 2015; pp. 2045–2048. [Google Scholar]
- Huang, R.; Liu, W.; Zhou, J.; Pei, X. Experimental field study of movement characteristics of rock blocks falling down a slope. J. Earth Sci. 2010, 21, 330–339. [Google Scholar] [CrossRef]
- Choi, Y.; Lee, J.Y.; Lee, J.; Park, H.D. Engineering geological investigation into rockfall problem: A case study of the Seated Seokgayeorae Image carved on a rock face at the UNESCO World Heritage site in Korea. Geosci. J. 2009, 13, 69–78. [Google Scholar] [CrossRef]
- Cui, S.-H.; Pei, X.-J.; Huang, R.-Q. Rolling motion behavior of rockfall on gentle slope: An experimental approach. J. Mt. Sci. 2017, 14, 1550–1562. [Google Scholar] [CrossRef]
- Haas, F.; Heckmann, T.; Wichmann, V.; Becht, M. Runout analysis of a large rockfall in the Dolomites/Italian Alps using LIDAR derived particle sizes and shapes. Earth Surf. Process. Landf. 2012, 37, 1444–1455. [Google Scholar] [CrossRef]
- Corominas, J. The angle of reach as a mobility index for small and large landslides. Can. Geotech. J. 1996, 33, 260–271. [Google Scholar] [CrossRef]
- Evans, S.G.; Hungr, O. The assessment of rockfall hazard at the base of talus slopes. Can. Geotech. J. 1993, 30, 620–636. [Google Scholar] [CrossRef]
- Zhan, W.; Fan, X.; Huang, R.; Pei, X.; Xu, Q.; Li, W. Empirical prediction for travel distance of channelized rock avalanches in the Wenchuan earthquake area. Nat. Hazards Earth Syst. Sci. 2017, 17, 833–844. [Google Scholar] [CrossRef]
- Copons, R.; Vilaplana, J.M.; Linares, R. Rockfall travel distance analysis by using empirical models (Solà d’Andorra la Vella, Central Pyrenees). Nat. Hazards Earth Syst. Sci. 2009, 9, 2107–2118. [Google Scholar] [CrossRef]
- Yang, L.; Zhang, M.; Jiao, W.; Wu, Y.; Zhang, C.; Wang, Z. Influence of intergranular friction weakening on rock avalanche dynamics. Comput. Geotech. 2023, 159, 105440. [Google Scholar] [CrossRef]
- Basson, F.R.P. Rigid body dynamics for rock fall trajectory simulation. In Proceedings of the ARMA US Rock Mechanics/Geomechanics Symposium (ARMA), Chicago, IL, USA, 24–27 June 2012. [Google Scholar]
- Glover, J.; Bartelt, P.; Christen, M.; Gerber, W. Rockfall-simulation with irregular rock blocks. In Engineering Geology for Society and Territory—Volume 2: Landslide Processes; Springer International Publishing: Cham, Switzerland, 2015; pp. 1729–1733. [Google Scholar]
- Gratchev, I.; Saeidi, S. The effect of surface irregularities on a falling rock motion. Geomech. Geoeng. 2019, 14, 52–58. [Google Scholar] [CrossRef]
- Wang, Y.; Jiang, W.; Cheng, S.; Song, P.; Mao, C. Effects of the impact angle on the coefficient of restitution in rockfall analysis based on a medium-scale laboratory test. Nat. Hazards Earth Syst. Sci. 2018, 18, 3045–3061. [Google Scholar] [CrossRef]
- Nagendran, S.K.; Ismail, M.A.M. Analysis of rockfall hazards based on the effect of rock size and shape. Int. J. Civ. Eng. 2019, 17, 1919–1929. [Google Scholar] [CrossRef]
- Verma, A.K.; Sardana, S.; Singh, T.N.; Kumar, N. Rockfall analysis and optimized design of rockfall barrier along a strategic road near Solang Valley, Himachal Pradesh, India. Indian Geotech. J. 2018, 48, 686–699. [Google Scholar] [CrossRef]
- Ji, Z.-M.; Chen, T.-L.; Wu, F.-Q.; Li, Z.-H.; Niu, Q.-H.; Wang, K.-Y. Assessment and prevention on the potential rockfall hazard of high-steep rock slope: A case study of Zhongyuntai mountain in Lianyungang, China. Nat. Hazards 2023, 115, 2117–2139. [Google Scholar] [CrossRef]
- Tuan, N.Q. Analysis of rock slope failure and rockfall for preliminary hazard assessment of the cliff at Chau Thoi Quarry. In Proceedings of the International Conference on Innovations for Sustainable and Responsible Mining—ISRM 2020, Hanoi, Vietnam, 15–17 October 2020; Volume 2, pp. 230–249. [Google Scholar]
- He, Y.; Nie, L.; Lv, Y.; Wang, H.; Jiang, S.; Zhao, X. The study of rockfall trajectory and kinetic energy distribution based on numerical simulations. Nat. Hazards 2021, 106, 213–233. [Google Scholar] [CrossRef]
- Zhang, Y.; Shao, J.; Liu, Z.; Shi, C. Numerical study on the dynamic behavior of rock avalanche: Influence of cluster shape, size and gradation. Acta Geotech. 2023, 18, 299–318. [Google Scholar] [CrossRef]
- Wang, S.; Yuan, Y.; Zhou, A.; Yin, C. Environmental Study on Analysis of Characteristic Parameters of Rockfall Movement Based on Field Riprap Test and Establishment of SVM and LM-BPNN Prediction Models. Ekoloji 2019, 28, 3319–3326. [Google Scholar]
- Caviezel, A.; Ringenbach, A.; Demmel, S.E.; Dinneen, C.E.; Krebs, N.; Bühler, Y.; Christen, M.; Meyrat, G.; Stoffel, A.; Hafner, E.; et al. The relevance of rock shape over mass—Implications for rockfall hazard assessments. Nat. Commun. 2021, 12, 5546. [Google Scholar] [CrossRef] [PubMed]
- Torsello, G.; Vallero, G.; Castelli, M. The role of block shape and slenderness in the preliminary estimation of rockfall propa-gation. In IOP Conference Series: Earth and Environmental Science: Proceedings of the Mechanics and Rock Engineering, from Theory to Practice, Turin, Italy, 20–25 September 2021; IOP Publishing: Bristol, UK, 2021; Volume 833, p. 012177. [Google Scholar]
- Liu, Y.; Hu, L.; Bai, G.F. Study on the behavior of a single particle rolling down on sidestep. J. Shandong Univ. (Sci. Ed.) 2017, 52, 70–74+84. [Google Scholar]
- Chau, K.T.; Chan, L.C.P.; Wu, J.J.; Liu, J.; Wong, R.H.C.; Lee, C.F. Experimental studies on rock-fall and debris flow. In One Day Seminar on Planning, Design and Implementation of Debris Flow and Rockfall Hazards Mitigation Measures; Wiley: Hong Kong, China, 1998; pp. 115–128. [Google Scholar]
- Pei, X.; Huang, R.; Pei, Z.; Dong, X. Analysis on the movement characteristics of Rolling Rock on slopes caused by intensitive earthquake. J. Eng. Geol. 2011, 19, 498–504. [Google Scholar]
- Siming, H.; Weilin, Z.; Xiong, Z.; Suiwang, J.; Qiang, C. Research on rollfall impact of Chediguan bridge pier, Duwen road. Chin. J. Rock Mech. Eng. 2013, 32 (Suppl. S2), 3421–3427. [Google Scholar]
- Gong, S.Q. Research on the Influence of Shape, Mass and Feature of Slope to Movement Characteristic of Rockfall. Master’s Thesis, Chongqing Jiaotong University, Chongqing, China, 2014. [Google Scholar]
- Wong, L.N.Y.; Tang, Z. Preliminary estimation of rock-fall lateral dispersion by laboratory test. J. Rock Mech. Geotech. Eng. 2023. [Google Scholar] [CrossRef]
- Fityus, S.; Giacomini, A.; Buzzi, O. The significance of geology for the morphology of potentially unstable rocks. Eng. Geol. 2013, 162, 43–52. [Google Scholar] [CrossRef]
- Cui, T.; Liu, J.; Yang, L.; Zhang, D.; Zhang, R.; Lan, W. Experiment and simulation of rolling friction characteristic of corn seed based on high-speed photography. Trans. Chin. Soc. Agric. Eng. 2023, 29, 34–41. (In Chinese) [Google Scholar]
- Ge, Y.; He, X.R.; Yuan, X.Q.; Pu, X.Y.; Meng, L.D.; Wang, H.K.; Huang, Y.Y. Analysis of rockfall hazards stopping position and energy dissipation based on orthogonal experiment. In Proceedings of the 7th International Conference on Energy Materials and Environment Engineering (ICEMEE 2021), Zhangjiajie, China, 23–25 April 2021; Voume 261, p. 01004. [Google Scholar]
- Azzoni, A.; de Freitas, M.H. Experimentally gained parameters, decisive for rock fall analysis. Rock Mech. Rock Eng. 1995, 28, 111–124. [Google Scholar] [CrossRef]
- Su, Y.F.; Bhattacharya, S.; Lee, S.J.; Lee, C.H.; Shin, M. A new interpretation of three-dimensional particle geometry: MAVL. Transp. Geotech. 2020, 23, 100328. [Google Scholar] [CrossRef]
- Hu, J.; Li, S.; Shi, S.; Li, L.; Zhang, Q.; Liu, H.; He, P. Experimental study on parameters affecting the runout range of rockfall. Adv. Civ. Eng. 2018, 2018, 4739092. [Google Scholar] [CrossRef]


| Materials | Po52.5 Cement | 8–20 Mesh Quartz Stone | 20–80 Mesh Quartz Stone | Fly Ash | Silica Fume | Water |
|---|---|---|---|---|---|---|
| Material Usage (%) | 37 | 10 | 45 | 5 | 3 | 12.5 |
| Additive | ZY808 Defoamer | ZY1100 Plastic Expansion Agent | ZY8121 Water Reducing Agent | MK400 Cellulose | ||
| Dosage per 100 kg (g) | 30 | 20 | 130 | 15 |
| Test Block | Shape | Characteristic Length | Value (mm) | Volume (cm3) | Center of Gravity (mm) | Shape Parameter | Density (kg/m) | Mass (g) | |
|---|---|---|---|---|---|---|---|---|---|
| x/y/z | RF | ψ1/ψ2 | |||||||
| A | Regular hexahedron | Edge length | 56 | 175.6 | 28/28/28 | 1 | 0.36 | 2460 | 432 |
| B | 6-edged disk | Edge length/height | 50/27 | 175.4 | 43.3/13.5/43.3 | 0.58 | 0.17 | 2463 | 432 |
| C | 12-edged disk | Edge length/height | 23/30 | 174.9 | 43/11.5/43 | 0.3 | 0.04 | 2493 | 436 |
| D | 4-edged prism | Length/width/height | 45/45/88 | 178.2 | 22.5/44/22.5 | 1 | 0.36/0.48 | 2452 | 437 |
| E | 8-edged prism | Edge length/height | 20/90 | 173.8 | 24.7/45/24.7 | 0.4 | 0.1/0.45 | 2457 | 427 |
| F | 12-edged prism | Edge length/height | 13/91 | 172.2 | 24.2/45.5/24.2 | 0.27 | 0.06/0.44 | 2456 | 423 |
| G | Sphere 1 | Diameter | 60 | 113 | 3/3/3 | 0 | 0 | 2673 | 302 |
| H | Sphere 2 | Diameter | 70 | 179.5 | 3.5/3.5/3.5 | 0 | 0 | 2670 | 483 |
| I | Sphere 3 | Diameter | 100 | 523.3 | 5/5/5 | 0 | 0 | 2430 | 1062 |
| Rolling Surface Material | Test Block Number | Speed (m/s) | Test Rolling Distance (m) | Average | Standard Deviation | Coefficient of Variation (%) | ||||
|---|---|---|---|---|---|---|---|---|---|---|
| S1 | S2 | S3 | S4 | S5 | ||||||
| Turf | A | 1.54 | 0.220 | 0.276 | 0.278 | 0.245 | 0.218 | 0.247 | 0.026 | 10.5 |
| D | 1.18 | 0.168 | 0.150 | 0.174 | 0.130 | 0.140 | 0.152 | 0.017 | 10.8 | |
| D | 1.87 | 0.344 | 0.352 | 0.380 | 0.437 | 0.455 | 0.394 | 0.045 | 11.4 | |
| Board | A | 1.44 | 0.190 | 0.190 | 0.255 | 0.242 | 0.231 | 0.222 | 0.027 | 12.1 |
| A | 2.20 | 0.430 | 0.531 | 0.410 | 0.523 | 0.450 | 0.469 | 0.049 | 10.5 | |
| D | 1.48 | 0.192 | 0.203 | 0.251 | 0.244 | 0.215 | 0.221 | 0.023 | 10.4 | |
| Back of ceramic tile board | A | 1.43 | 0.166 | 0.157 | 0.194 | 0.212 | 0.210 | 0.188 | 0.022 | 12.0 |
| A | 1.45 | 0.208 | 0.214 | 0.192 | 0.155 | 0.159 | 0.186 | 0.024 | 13.2 | |
| B | 1.93 | 0.595 | 0.466 | 0.489 | 0.536 | 0.612 | 0.540 | 0.057 | 10.6 | |
| C | 2.73 | 1.881 | 1.900 | 2.295 | 1.796 | 2.235 | 2.021 | 0.203 | 10.0 | |
| D | 1.51 | 0.226 | 0.185 | 0.192 | 0.241 | 0.183 | 0.205 | 0.024 | 11.5 | |
| F | 2.24 | 1.580 | 1.650 | 1.830 | 2.140 | 2.110 | 1.862 | 0.230 | 12.3 | |
| A | 1.54 | 0.220 | 0.276 | 0.278 | 0.245 | 0.218 | 0.247 | 0.026 | 10.5 | |
| D | 1.18 | 0.168 | 0.150 | 0.174 | 0.130 | 0.140 | 0.152 | 0.017 | 10.8 | |
| D | 1.87 | 0.344 | 0.352 | 0.380 | 0.437 | 0.455 | 0.394 | 0.045 | 11.4 | |
Disclaimer/Publisher’s Note: The statements, opinions and data contained in all publications are solely those of the individual author(s) and contributor(s) and not of MDPI and/or the editor(s). MDPI and/or the editor(s) disclaim responsibility for any injury to people or property resulting from any ideas, methods, instructions or products referred to in the content. |
© 2023 by the authors. Licensee MDPI, Basel, Switzerland. This article is an open access article distributed under the terms and conditions of the Creative Commons Attribution (CC BY) license (https://creativecommons.org/licenses/by/4.0/).
Share and Cite
Liu, F.; Hu, N.; Sun, G.; Yang, B. Study on the Influence of Rock Shape on Rolling Distance. Appl. Sci. 2023, 13, 11351. https://doi.org/10.3390/app132011351
Liu F, Hu N, Sun G, Yang B. Study on the Influence of Rock Shape on Rolling Distance. Applied Sciences. 2023; 13(20):11351. https://doi.org/10.3390/app132011351
Chicago/Turabian StyleLiu, Feng, Ning Hu, Gangchen Sun, and Bai Yang. 2023. "Study on the Influence of Rock Shape on Rolling Distance" Applied Sciences 13, no. 20: 11351. https://doi.org/10.3390/app132011351
APA StyleLiu, F., Hu, N., Sun, G., & Yang, B. (2023). Study on the Influence of Rock Shape on Rolling Distance. Applied Sciences, 13(20), 11351. https://doi.org/10.3390/app132011351