
Multi-Point Deformation Prediction Model for Concrete Dams Based on Spatial Feature Vector

Abstract
:1. Introduction
2. 2D-1D-CNN Deformation Prediction Model for Concrete Dams
2.1. Multi-Point Model of Concrete Dams Incorporating Spatial Coordinates
2.2. Convolutional Neural Network
2.3. 2D-1D-CNN Concrete Dam Deformation Prediction Model Construction Process
- (1)
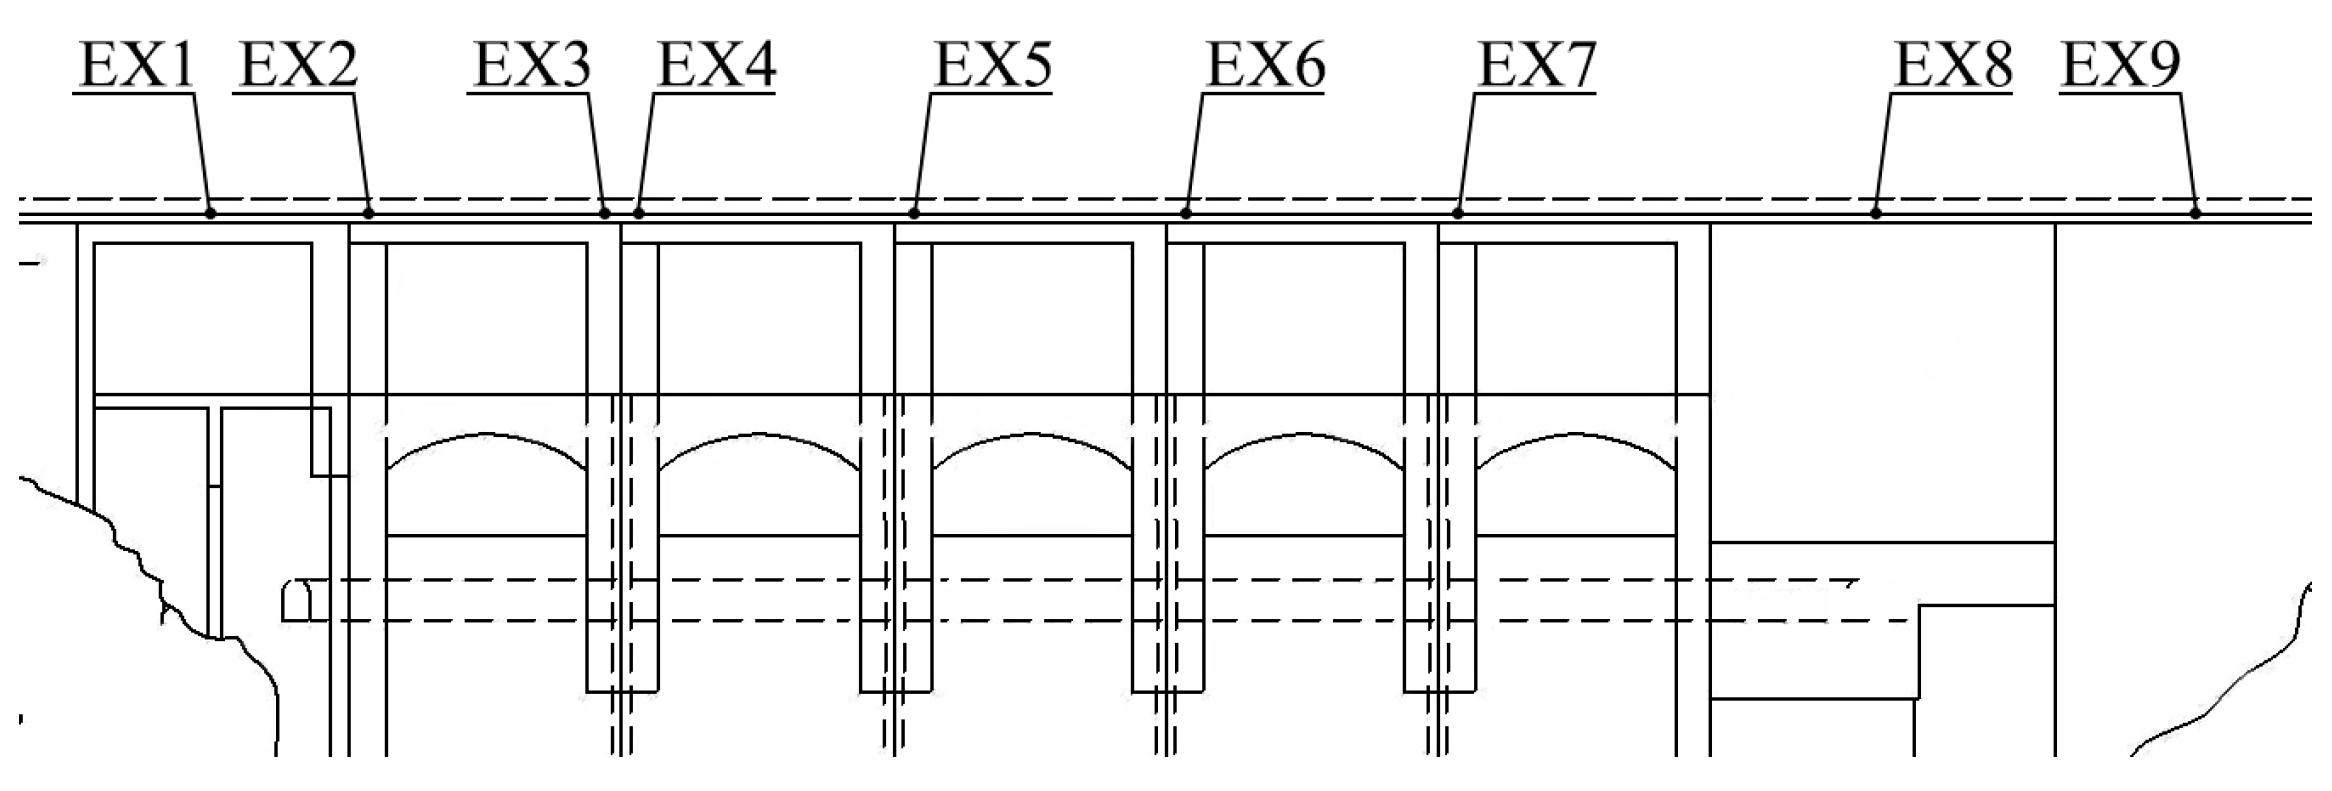
- Data set constructionAs shown in Figure 2, each measuring point is constructed into a spatio-temporal panel data in the form of a grid according to its relative spatial position, with each small square representing the relative position of a measuring point, followed by filling the displacement values of each measuring point into the corresponding square, and filling the part of missing measuring points with 0. According to the above process, the deformation sequence of measuring points on the dam is constructed into a three-dimensional matrix of dimension as the panel data input of the model, where , , represent the horizontal and vertical numbers of measuring point distribution, and t denotes the length of the time window.According to Equation (2), this paper takes , , , , as the environmental casual factors of dam deformation, and constructs sliding windows in the time dimension for data addition, followed by the REPEAT function. The environment casual factor is replicated and filled n times (n is the number of measuring points), and, finally, the casual factor input is obtained.
- (2)
- Spatial feature vector extractionThe spatio-temporal panel data in (1) is input to the 2D-CNN, and the spatial feature vector , which can reflect the spatial features at the current moment, is finally obtained through convolution calculation, and the calculation process is shown in Equation (8).where is the panel data input of the model, , are the weights and bias, MaxPool represents the maximum pooling operation and Relu is the activation function.
- (3)
- Input factors incorporationThe tensor calculation layer is constructed to fuse with the environmental casual factors input according to Equation (9), and the fused factors are normalized by the Batch Normalization layer to obtain the final input factors of the fused spatial feature vector.where represents the batch normalization process and represents the tensor stitching operation.
- (4)
- Concrete dam deformation predictionis input to 1D-CNN for prediction, and the final prediction results are obtained.
3. Case Study
3.1. Model Activation Functions Selection
3.2. Model Hyperparameters Selection
3.3. Prediction Results and Comparative Analysis
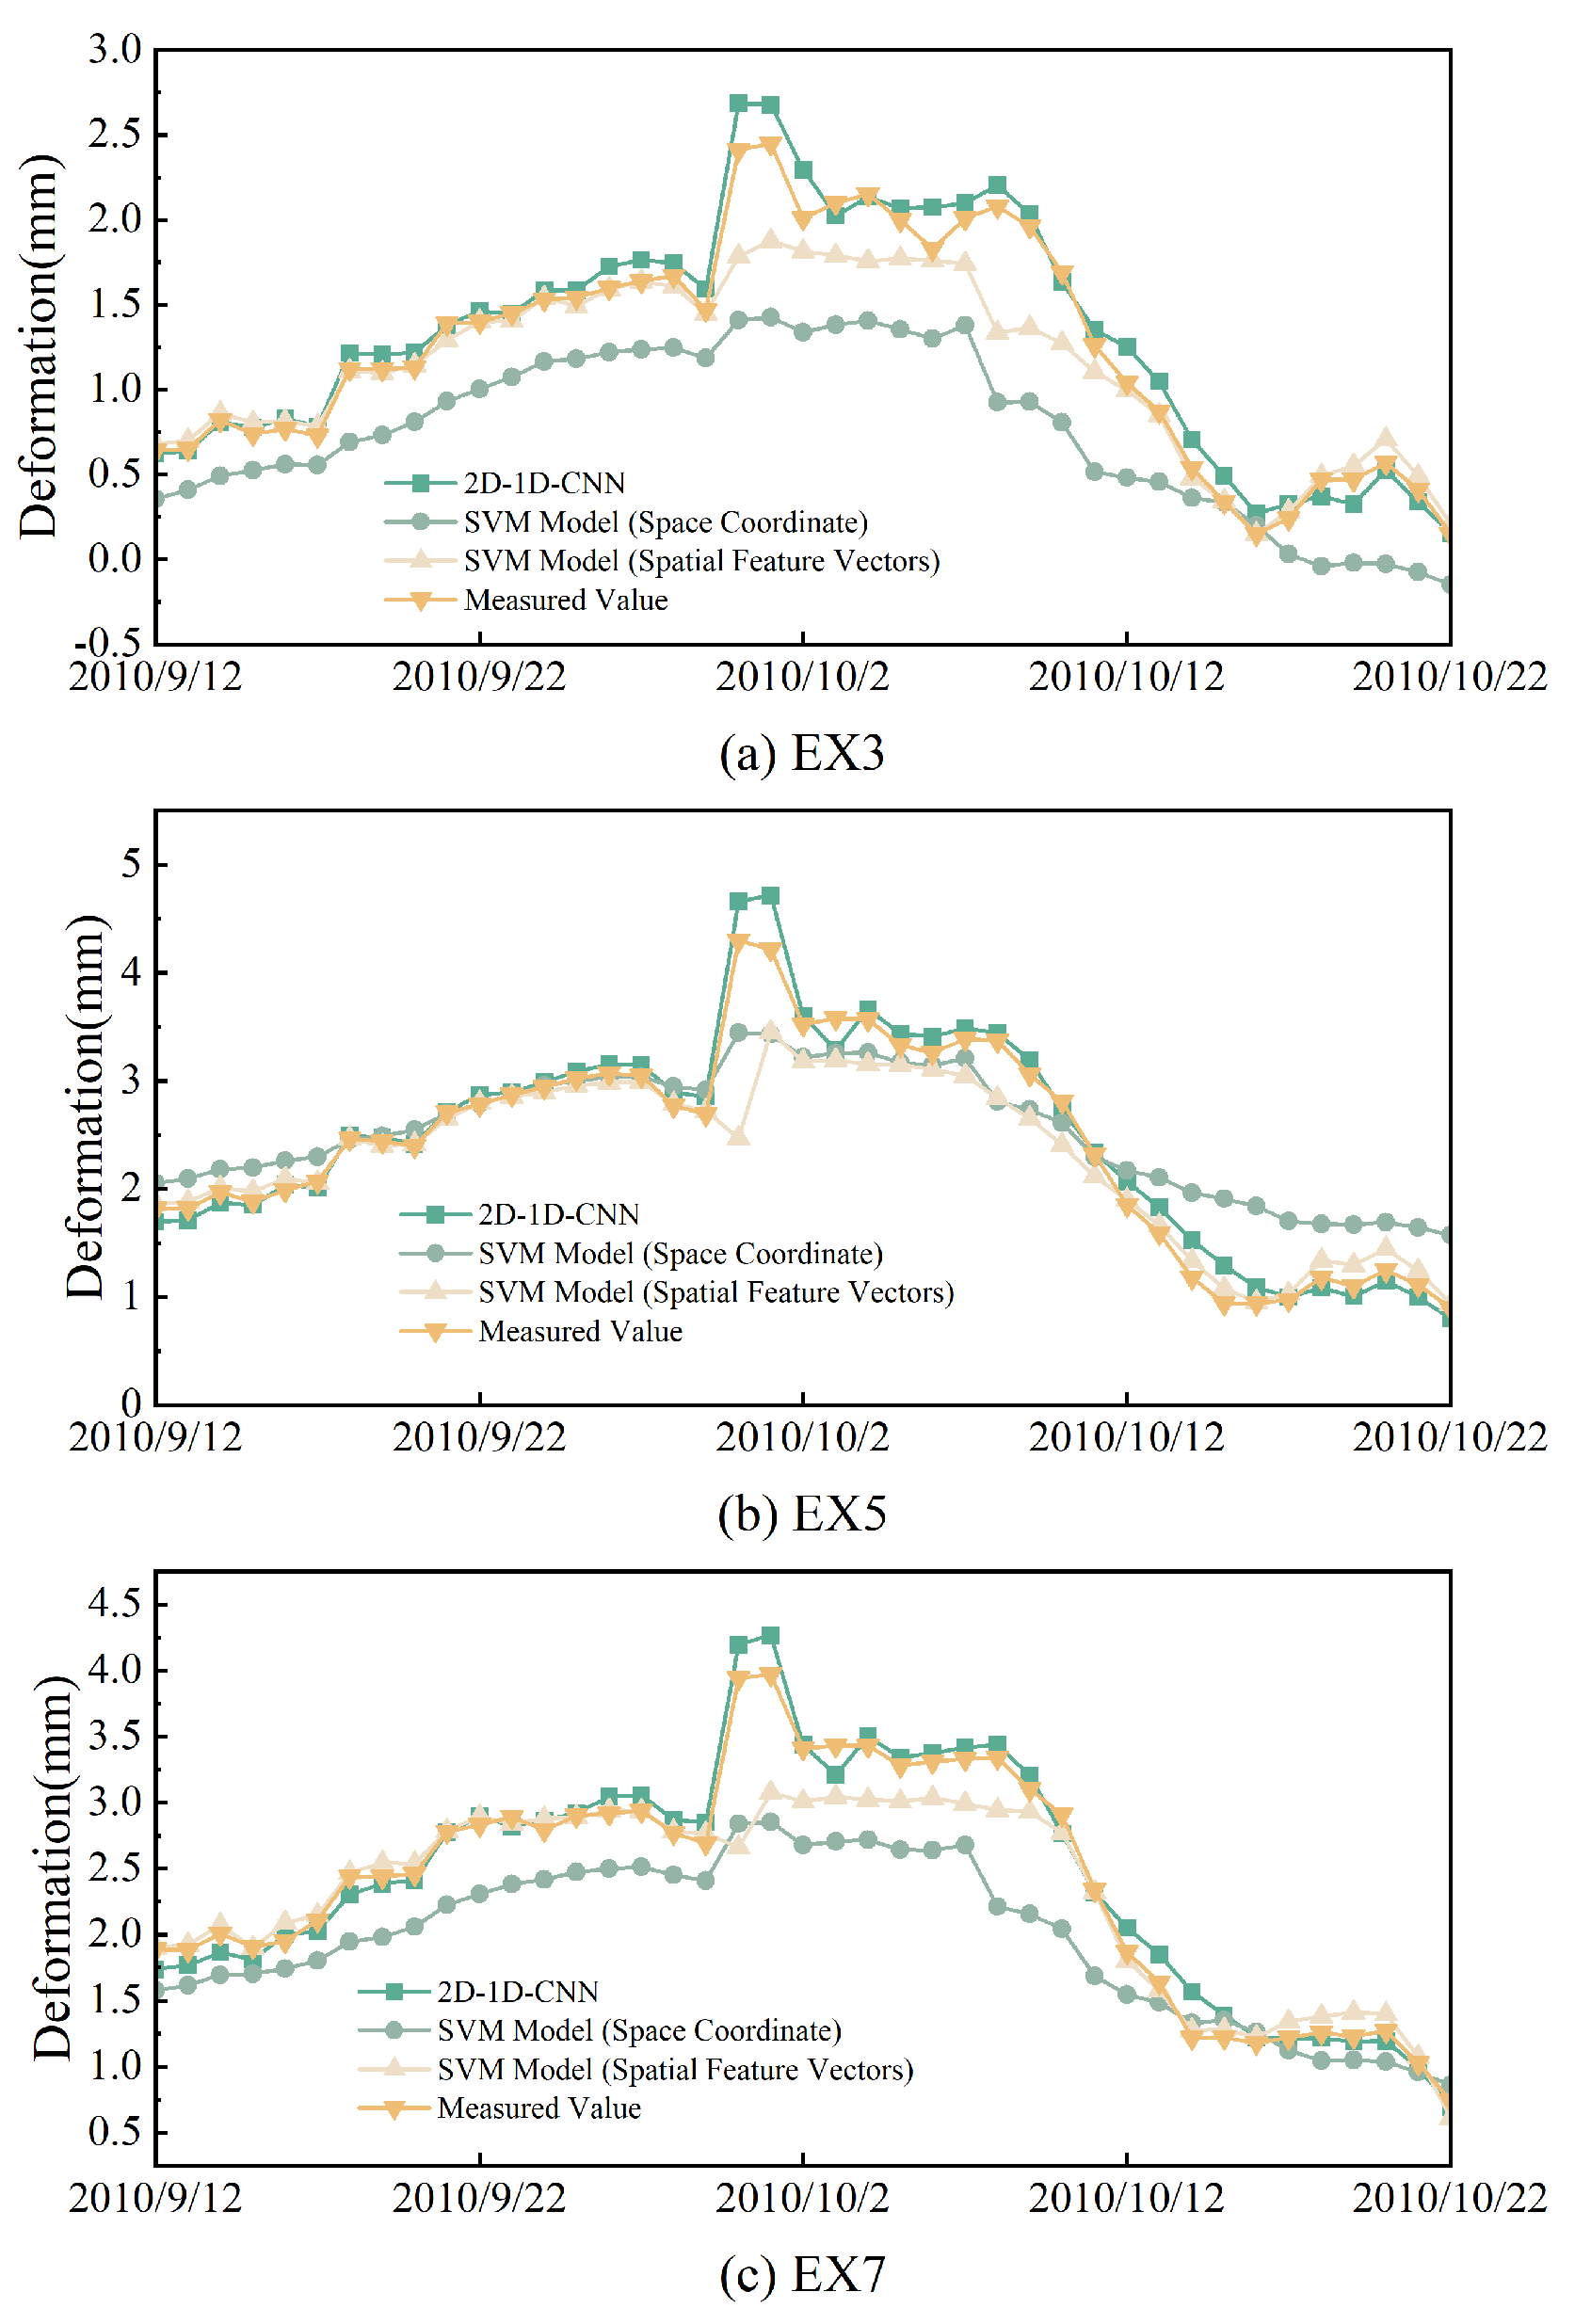
3.4. Validation of the Validity of a Multi-Point Model Incorporating Spatial Feature Vectors
4. Conclusions
- (1)
- The multi-point model based on the fusion of spatial feature vectors can effectively extract the spatial connection between the measuring points and, compared with the other models, the model proposed in this paper shows a great improvement in the prediction accuracy.In addition, the experimental results indicated that the prediction accuracy of the deep-learning-based prediction model is higher than that of the machine learning model and the statistical model in most cases.
- (2)
- The case study shows that the proposed 2D-1D-CNN model is able to accurately predict the deformation of concrete dams so that it is effective and feasible.
- (3)
- In this paper, 2D-CNN and 1D-CNN are fused into the same network model, which, on the one hand, improves the fitting ability of the network for dam deformation sequences, and, on the other hand, it also increases the hyperparameters that need to be adjusted to a certain extent. Since this paper only adopts the artificial coarse tuning method, the optimization algorithm can be combined in future studies to further improve the prediction performance of the model.
Author Contributions
Funding
Institutional Review Board Statement
Informed Consent Statement
Data Availability Statement
Conflicts of Interest
References
- Ren, Q.; Li, M.; Li, H.; Shen, Y. A novel deep learning prediction model for concrete dam displacements using interpretable mixed attention mechanism. Adv. Eng. Inform. 2021, 50, 101407. [Google Scholar] [CrossRef]
- Kang, F.; Zhao, L.S.; Wang, Y. Structural health monitoring of concrete dams using long-term air temperature for thermal effect simulation. Eng. Struct. 2019, 180, 642–653. [Google Scholar] [CrossRef]
- Salazar, F.; Morán, R.; Toledo, M.Á.; Eugenio, O. Data-Based Models for the Prediction of Dam Behaviour: A Review and Some Methodological Considerations. Arch. Computat. Methods Eng. 2017, 24, 1–21. [Google Scholar] [CrossRef]
- Niu, J.; Zhou, H.; Wu, B.; Deng, Z.; Ren, C. Spatio-temporal monitoring model for super-high arch dams considering multicollinearity effects. Adv. Sci. Technol. Water Resour. 2023, 43, 29–35. [Google Scholar]
- Su, H.; Li, X.; Yang, B.; Wen, Z. Wavelet support vector machine-based prediction model of dam deformation. Mech. Syst. Signal Process. 2018, 110, 412–427. [Google Scholar] [CrossRef]
- Kang, F.; Liu, X.; Li, J. Temperature effect modeling in structural health monitoring of concrete dams using kernel extreme learning machines. Struct. Health Monit. 2020, 19, 987–1002. [Google Scholar] [CrossRef]
- Wei, B.; Xiong, W.; Li, H.; Mao, Y. Dam deformation forecasting of leapfrog combined model merging residual errors of chaos. Geomat. Inf. Sci. Wuhan Univ. 2016, 41, 1272–1278. [Google Scholar]
- Wei, B.; Liu, B.; Yuan, D.; Mao, Y.; Yao, S. Spatiotemporal hybrid model for concrete arch dam deformation monitoring considering chaotic effect of residual series. Eng. Struct. 2021, 228, 111488. [Google Scholar] [CrossRef]
- Wei, B.; Liu, B.; Xu, F.; Li, H.; Mao, Y. Multi-point Hybrid Model Based on PSO-SVM for Concrete Arch Dam Deformation Monitoring. Geomat. Inf. Sci. Wuhan Univ. 2023, 48, 396–407. [Google Scholar]
- Li, D.; Zhou, Y.; Gan, X. Research on multiple points deterministic displacement monitoring model of concrete arch dam. J. Hydraul. Eng. 2011, 42, 981–985+994. [Google Scholar]
- Song, B.; Bao, T.; Xiang, Z.; Wang, R. SSA-ELM Deformation Spatio-temporal Prediction Model of Dam Based Wavelet. J. Yangtze River Sci. Res. Inst. 2023, 40, 145. [Google Scholar]
- Chen, Y.; Ma, G.; Zhou, W.; Wu, J.; Zou, Q. Rockfill Dam Deformation Prediction Model Based on Deep Learning Extracting Spatiotemporal Features. J. Hydraul. Eng. 2023, 42, 120–132. [Google Scholar]
- Ren, Q.; Li, M.; Shen, Y.; Li, M. Dynamic monitoring model for dam deformation with spatiotemporal coupling correlation characteristics. J. Hydraul. Eng. 2021, 40, 160–172. [Google Scholar]
- Madiniyeti, J.; Chao, Y.; Li, T.; Qi, H.; Wang, F. Concrete Dam Deformation Prediction Model Research Based on SSA–LSTM. Appl. Sci. 2023, 13, 7375. [Google Scholar] [CrossRef]
- Lin, C.; Weng, K.; Lin, Y.; Zhang, T.; He, Q.; Su, Y. Time Series Prediction of Dam Deformation Using a Hybrid STL–CNN–GRU Model Based on Sparrow Search Algorithm Optimization. Appl. Sci. 2022, 12, 11951. [Google Scholar] [CrossRef]
- Zhang, Q.; Meng, J.; Ren, C. Crop classification based on two-dimensional representation and CNN model from remote sensing. Natl. Remote Sens. Bull. 2022, 26, 1437–1449. [Google Scholar] [CrossRef]
- Wang, G.; Hu, Y.; Zhang, S.; Ru, Y.; Chen, K.; Wu, M. Water identification from the GF-1 satellite image based on the deep Convolutional Neural Networks. Natl. Remote Sens. Bull. 2022, 26, 2304–2316. [Google Scholar] [CrossRef]
- Zhang, X.; Zhang, G.; Zhang, H.; Zhang, X. Short-term traffic flow prediction based on ACBiGRU model. Huazhong Univ. Sci. Tech. (Nat. Sci. Ed.) 2023, 51, 88–93. [Google Scholar]
- Zhang, W.; Yang, H.; Zhang, B.; Li, X. Short-time Passenger Flow Prediction Model of Urban Rail Transit Considering Multi-timescale Features. J. Transp. Syst. Eng. Inf. Technol. 2022, 22, 212–223. [Google Scholar]
- Rosso, M.M.; Marasco, G.; Aiello, S.; Aloisio, A.; Chiaia, B.; Marano, G.C. Convolutional Networks and Transformers for Intelligent Road Tunnel Investigations. Comput. Struct. 2023, 275, 106918. [Google Scholar] [CrossRef]
- Hua, G.; Wang, S.; Xiao, M.; Hu, S. Research on the Uplift Pressure Prediction of Concrete Dams Based on the CNN-GRU Model. Water 2023, 15, 319. [Google Scholar] [CrossRef]
- Wang, S.; Xu, C.; Liu, Y.; Wu, B. A spatial association-coupled double objective support vector machine prediction model for diagnosing the deformation behaviour of high arch dams. Struct. Health Monit. 2022, 21, 945–964. [Google Scholar] [CrossRef]
- Bai, S.; Kolter, J.Z.; Koltun, V. An Empirical Evaluation of Generic Convolutional and Recurrent Networks for Sequence Modeling [EB/OL]. Available online: https://arxiv.org/pdf/1803.01271.pdf (accessed on 22 September 2021).


| k | 1 | 2 | 3 | 4 | 5 | 6 |
|---|---|---|---|---|---|---|
| RMSE | 0.2291 | 0.2029 | 0.1688 | 0.1468 | 0.1720 | 0.2085 |
| Monitoring Points | Statistical Indexes | 2D-1D-CNN | SVM | BPNN | 1D-CNN | |
|---|---|---|---|---|---|---|
| RMSE/mm | 0.121 | 0.5472 | 0.4162 | 0.4222 | 0.3426 | |
| EX3 | MAE/mm | 0.0971 | 0.4782 | 0.3649 | 0.3826 | 0.2840 |
| MAPE | 11.75% | 46.82% | 39.14% | 51.27% | 38.30% | |
| 0.9658 | 0.8678 | 0.5957 | 0.5840 | 0.7261 | ||
| ine | RMSE/mm | 0.1635 | 0.4263 | 0.7347 | 0.4413 | 0.5345 |
| EX5 | MAE/mm | 0.1241 | 0.3245 | 0.6284 | 0.2713 | 0.4236 |
| MAPE | 6.47% | 21.04% | 24.90% | 13.82% | 19.43% | |
| 0.9694 | 0.8486 | 0.3833 | 0.7775 | 0.6736 | ||
| ine | RMSE/mm | 0.1296 | 0.5349 | 0.4781 | 0.5115 | 0.4134 |
| EX7 | MAE/mm | 0.1045 | 0.4501 | 0.3176 | 0.412 | 0.3437 |
| MAPE | 4.95% | 17.27% | 14.53% | 16.54% | 15.94% | |
| 0.9772 | 0.8817 | 0.6892 | 0.6442 | 0.7676 |
| Monitoring Points | Statistical Indexes | 2D-1D-CNN | SVM (Space Coordinate) | SVM (Spatial Feature Vector) |
|---|---|---|---|---|
| RMSE/mm | 0.121 | 0.5472 | 0.238 | |
| EX3 | MAE/mm | 0.0971 | 0.4782 | 0.1406 |
| MAPE | 11.75% | 46.82% | 10.52% | |
| 0.9658 | 0.3010 | 0.8678 | ||
| ine | RMSE/mm | 0.1635 | 0.4263 | 0.364 |
| EX5 | MAE/mm | 0.1241 | 0.3245 | 0.1946 |
| MAPE | 6.47% | 21.04% | 7.45% | |
| 0.9694 | 0.7923 | 0.8486 | ||
| ine | RMSE/mm | 0.1296 | 0.5349 | 0.2949 |
| EX7 | MAE/mm | 0.1045 | 0.4501 | 0.1671 |
| MAPE | 4.95% | 17.27% | 6.42% | |
| 0.9772 | 0.6110 | 0.8817 |
Disclaimer/Publisher’s Note: The statements, opinions and data contained in all publications are solely those of the individual author(s) and contributor(s) and not of MDPI and/or the editor(s). MDPI and/or the editor(s) disclaim responsibility for any injury to people or property resulting from any ideas, methods, instructions or products referred to in the content. |
© 2023 by the authors. Licensee MDPI, Basel, Switzerland. This article is an open access article distributed under the terms and conditions of the Creative Commons Attribution (CC BY) license (https://creativecommons.org/licenses/by/4.0/).
Share and Cite
Chen, Z.; Liu, X. Multi-Point Deformation Prediction Model for Concrete Dams Based on Spatial Feature Vector. Appl. Sci. 2023, 13, 11212. https://doi.org/10.3390/app132011212
Chen Z, Liu X. Multi-Point Deformation Prediction Model for Concrete Dams Based on Spatial Feature Vector. Applied Sciences. 2023; 13(20):11212. https://doi.org/10.3390/app132011212
Chicago/Turabian StyleChen, Zhuoxun, and Xiaosheng Liu. 2023. "Multi-Point Deformation Prediction Model for Concrete Dams Based on Spatial Feature Vector" Applied Sciences 13, no. 20: 11212. https://doi.org/10.3390/app132011212
APA StyleChen, Z., & Liu, X. (2023). Multi-Point Deformation Prediction Model for Concrete Dams Based on Spatial Feature Vector. Applied Sciences, 13(20), 11212. https://doi.org/10.3390/app132011212