


Study on Nonlinear Vibration of Vertical Lifting Section of Bulk Grain Entrainment Ship Unloader


Abstract
:1. Introduction
2. Modeling the Vibration Differential Equation of the Vertical Lifting Section of the Entrainment Ship Unloader
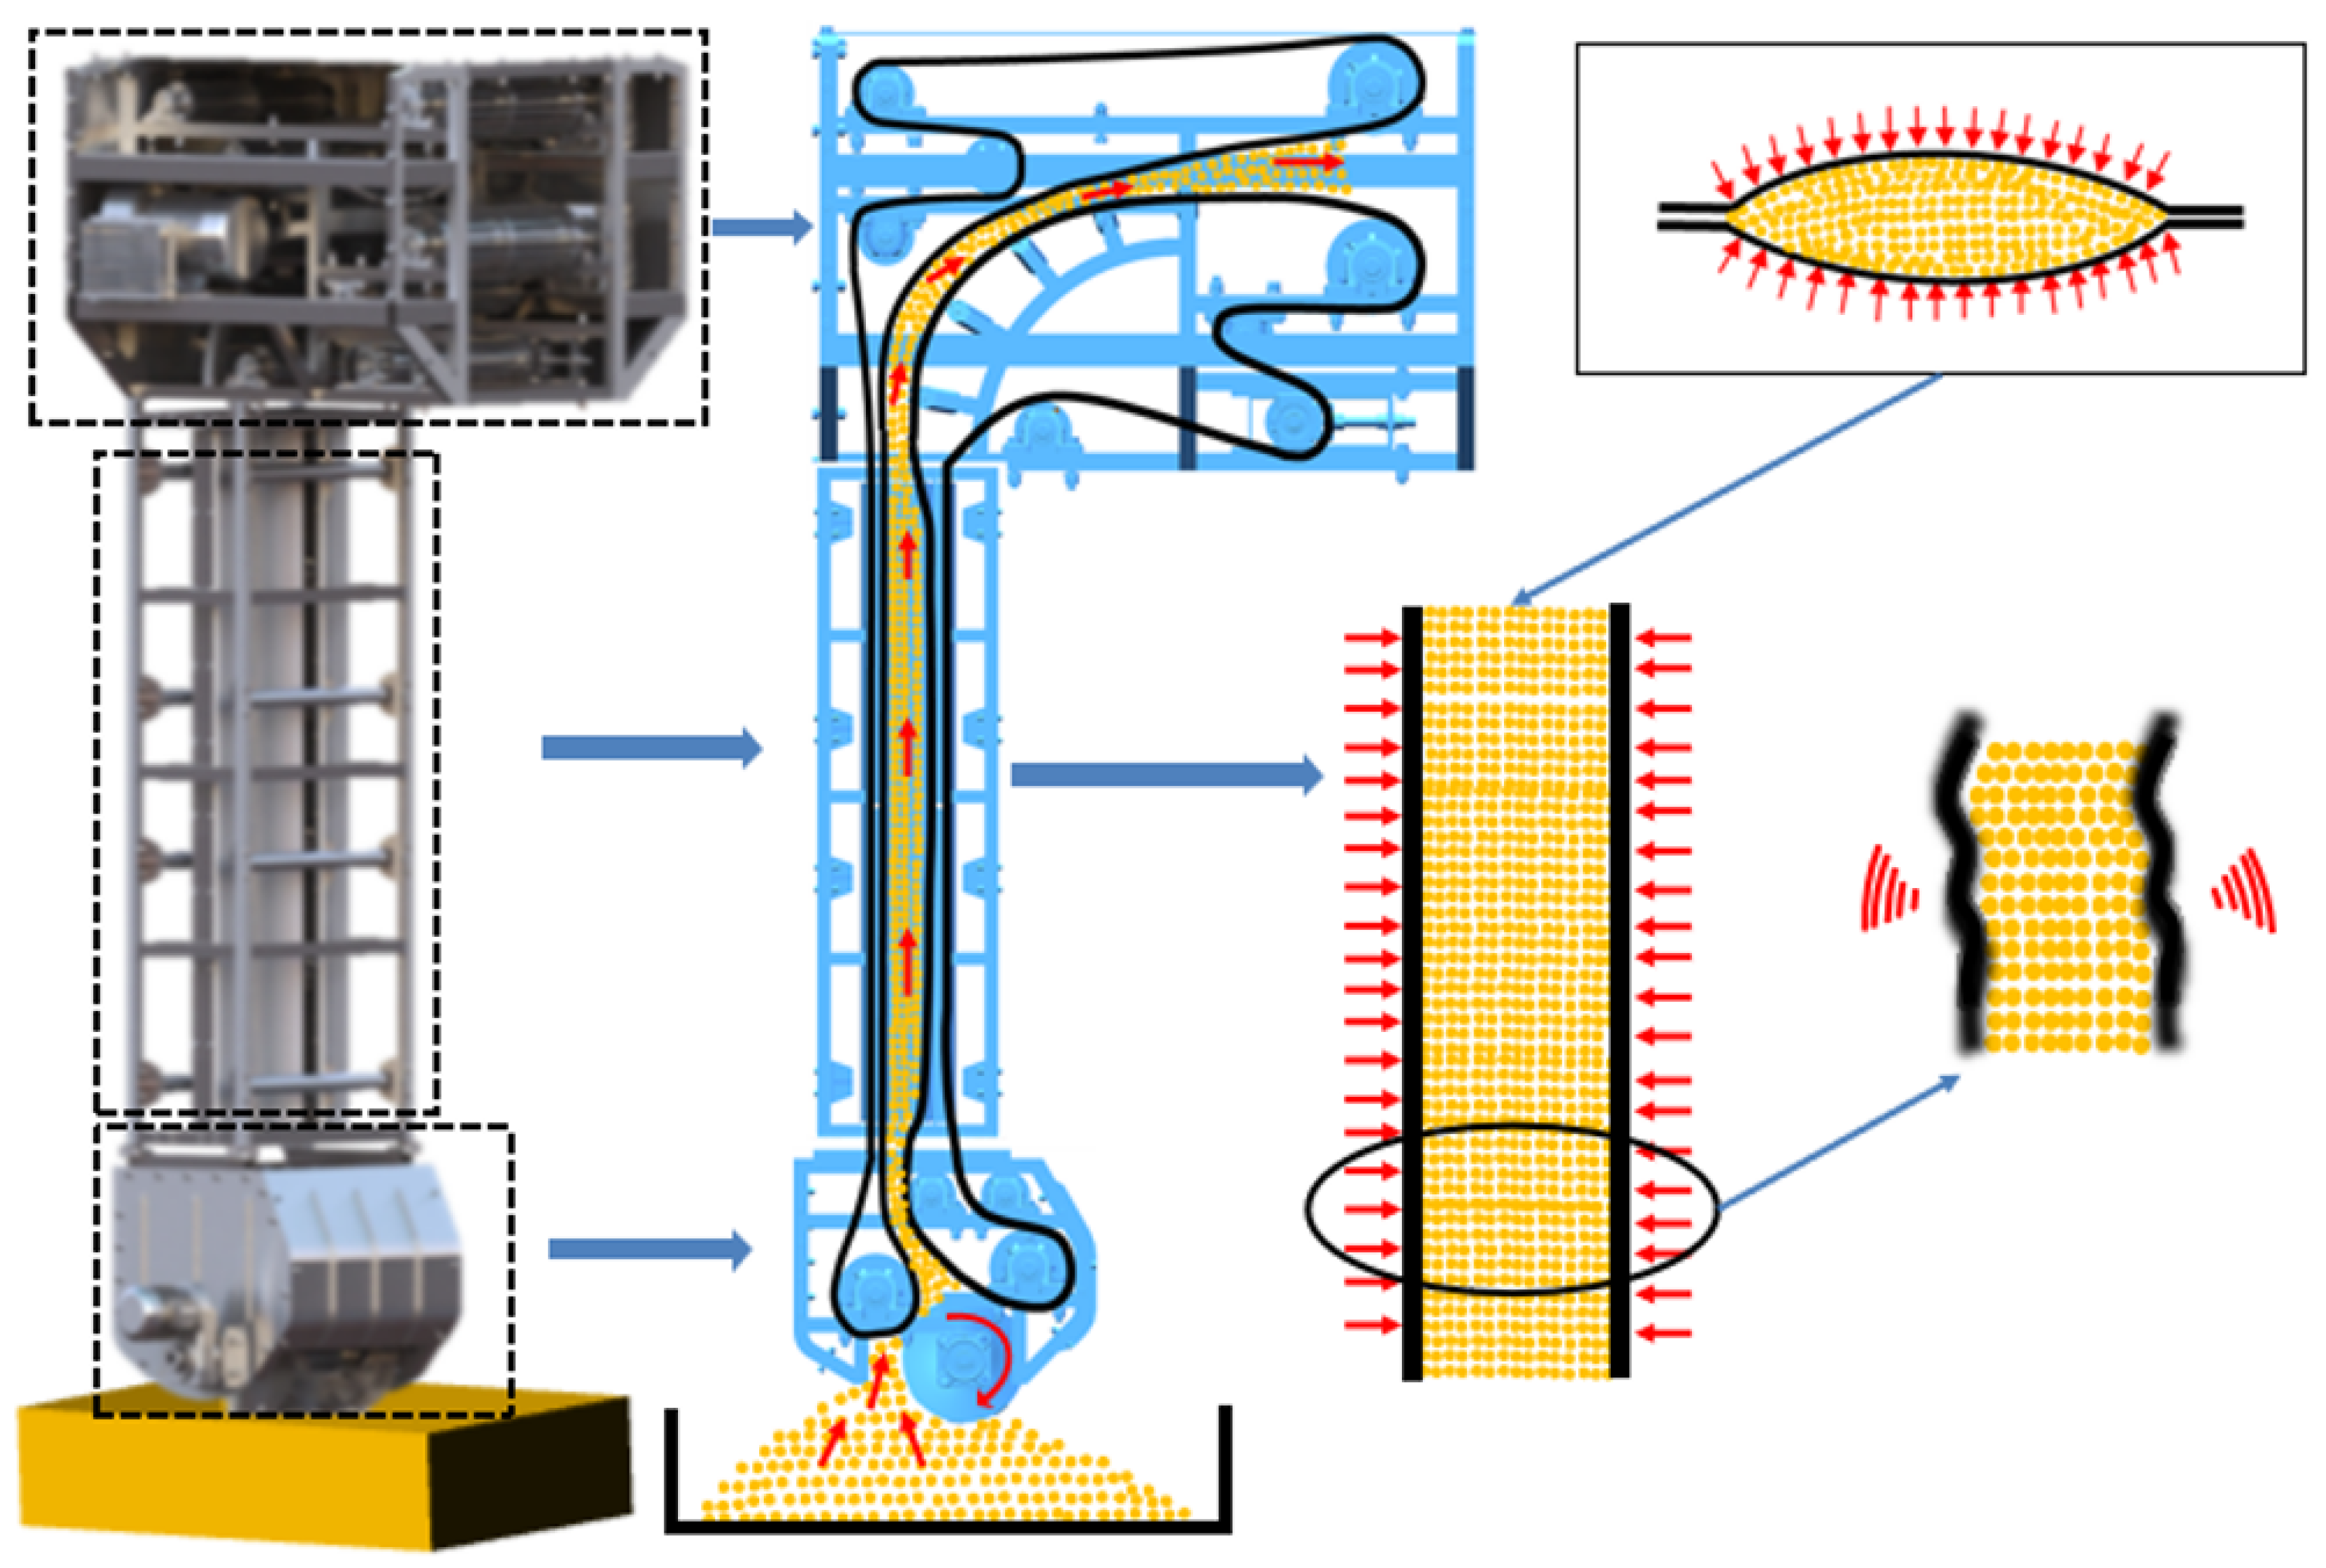
2.1. Entrainment Ship Unloader Vertical Lifting Principle
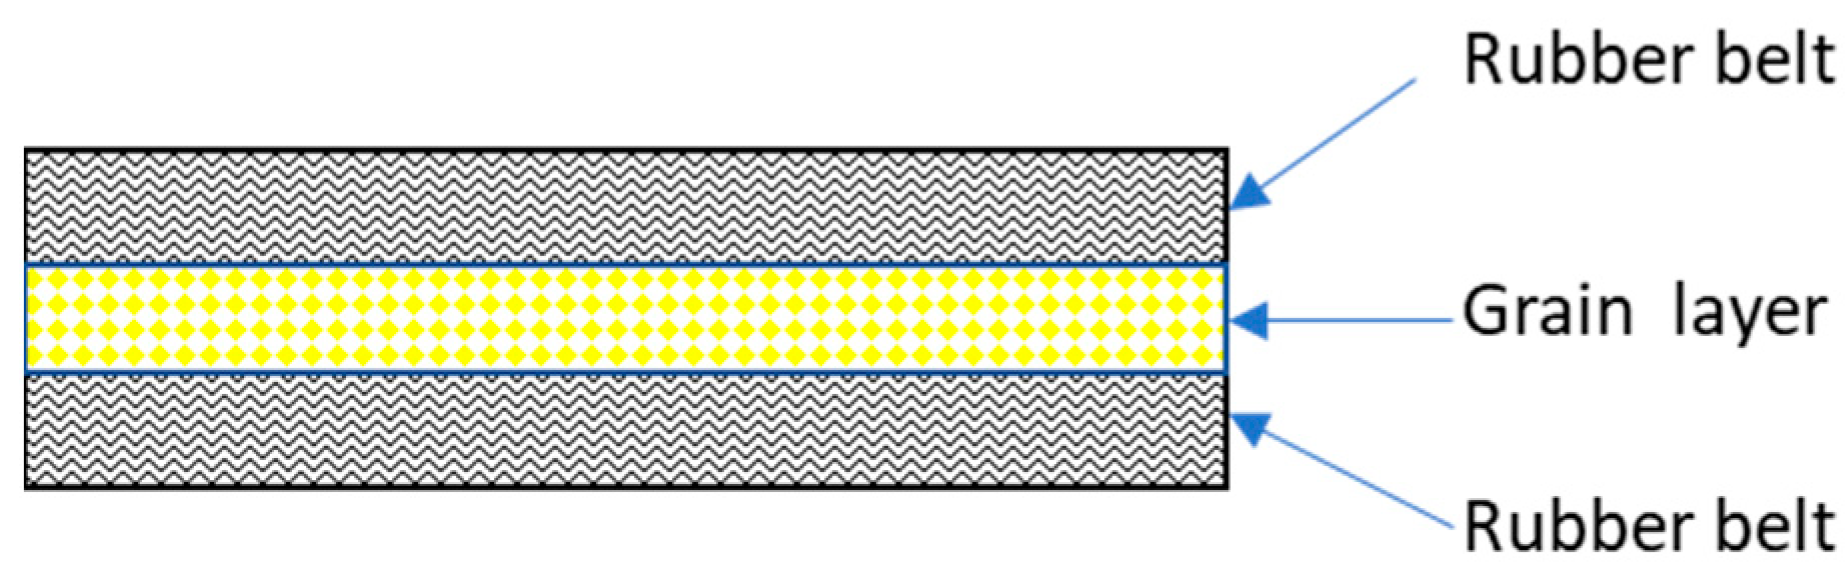
2.2. Vertical Lifting Process Rubber Belt, Material Three-Layer Structure
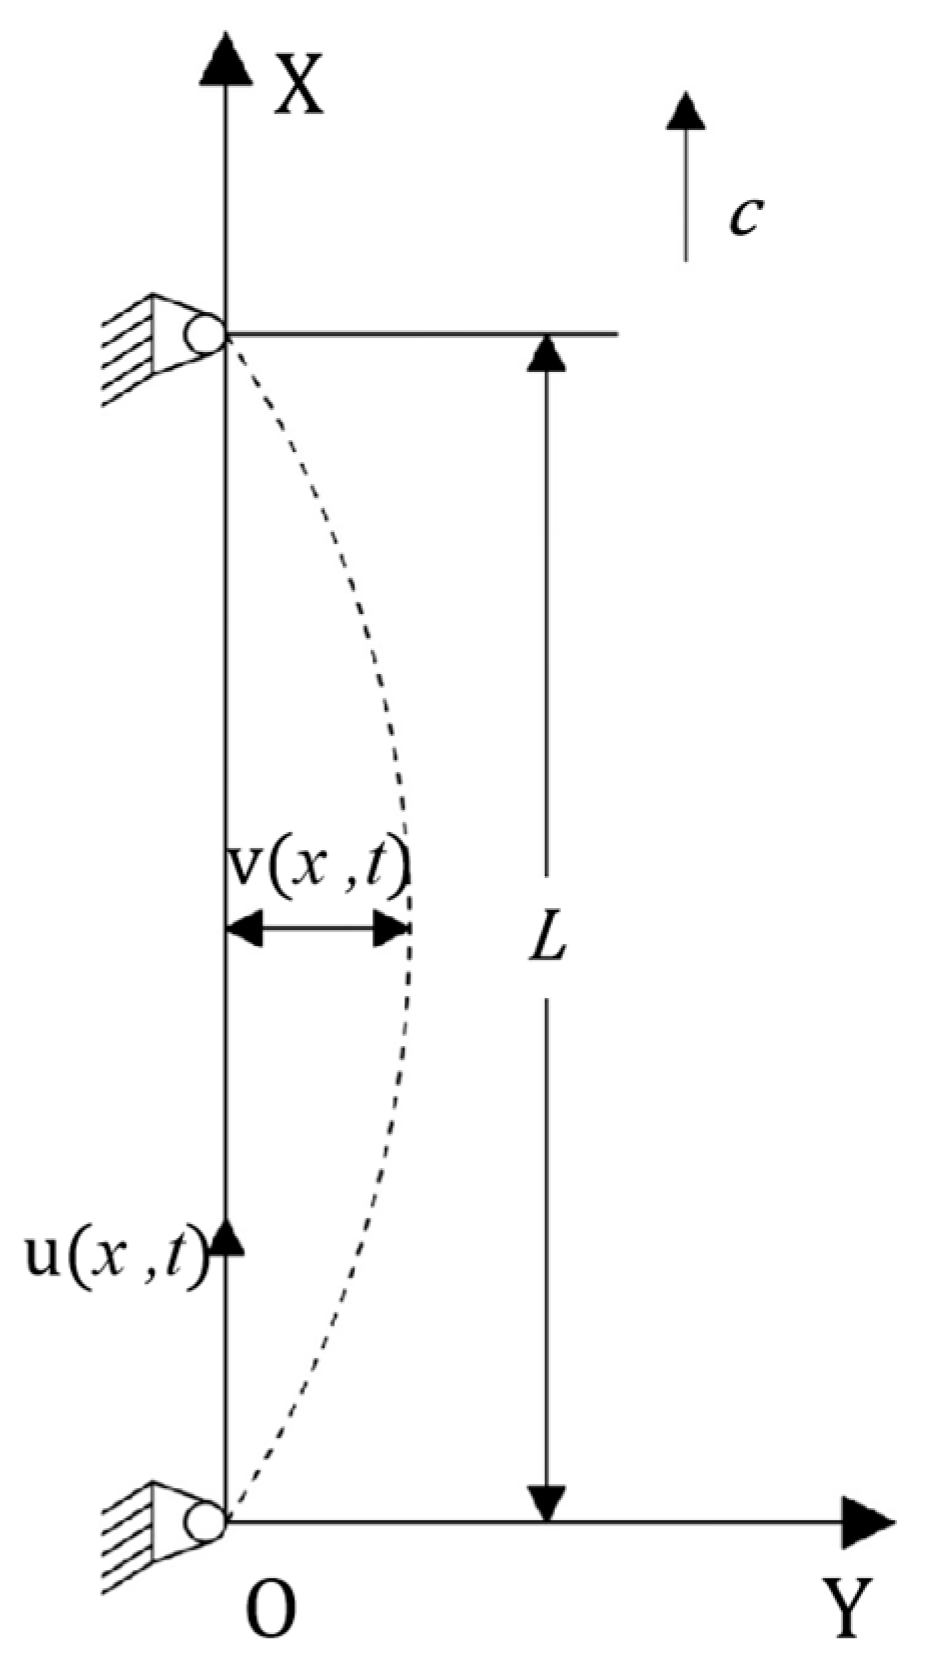
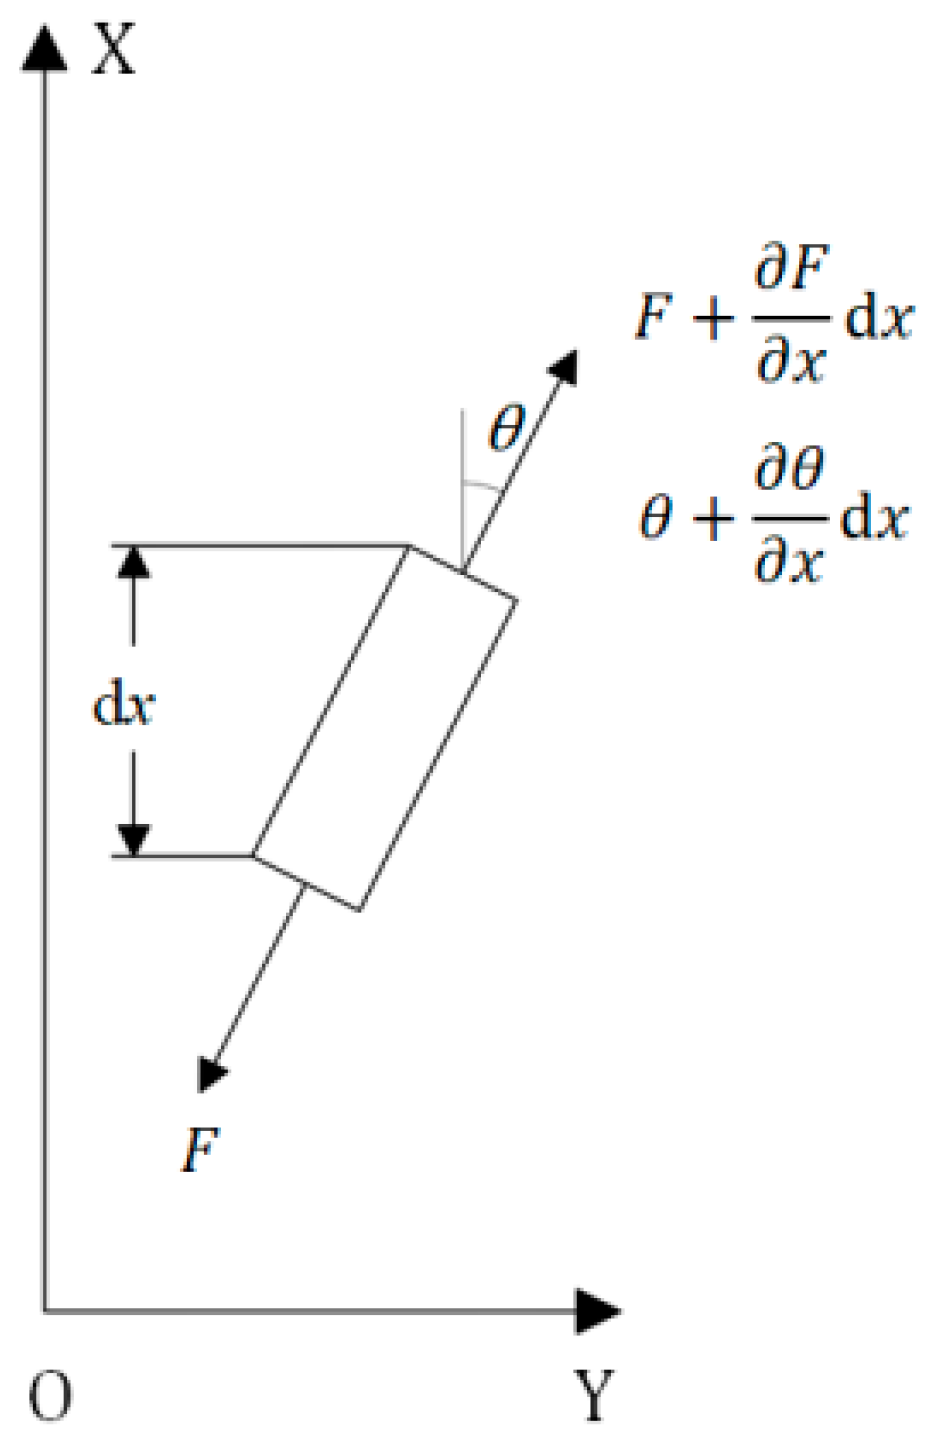
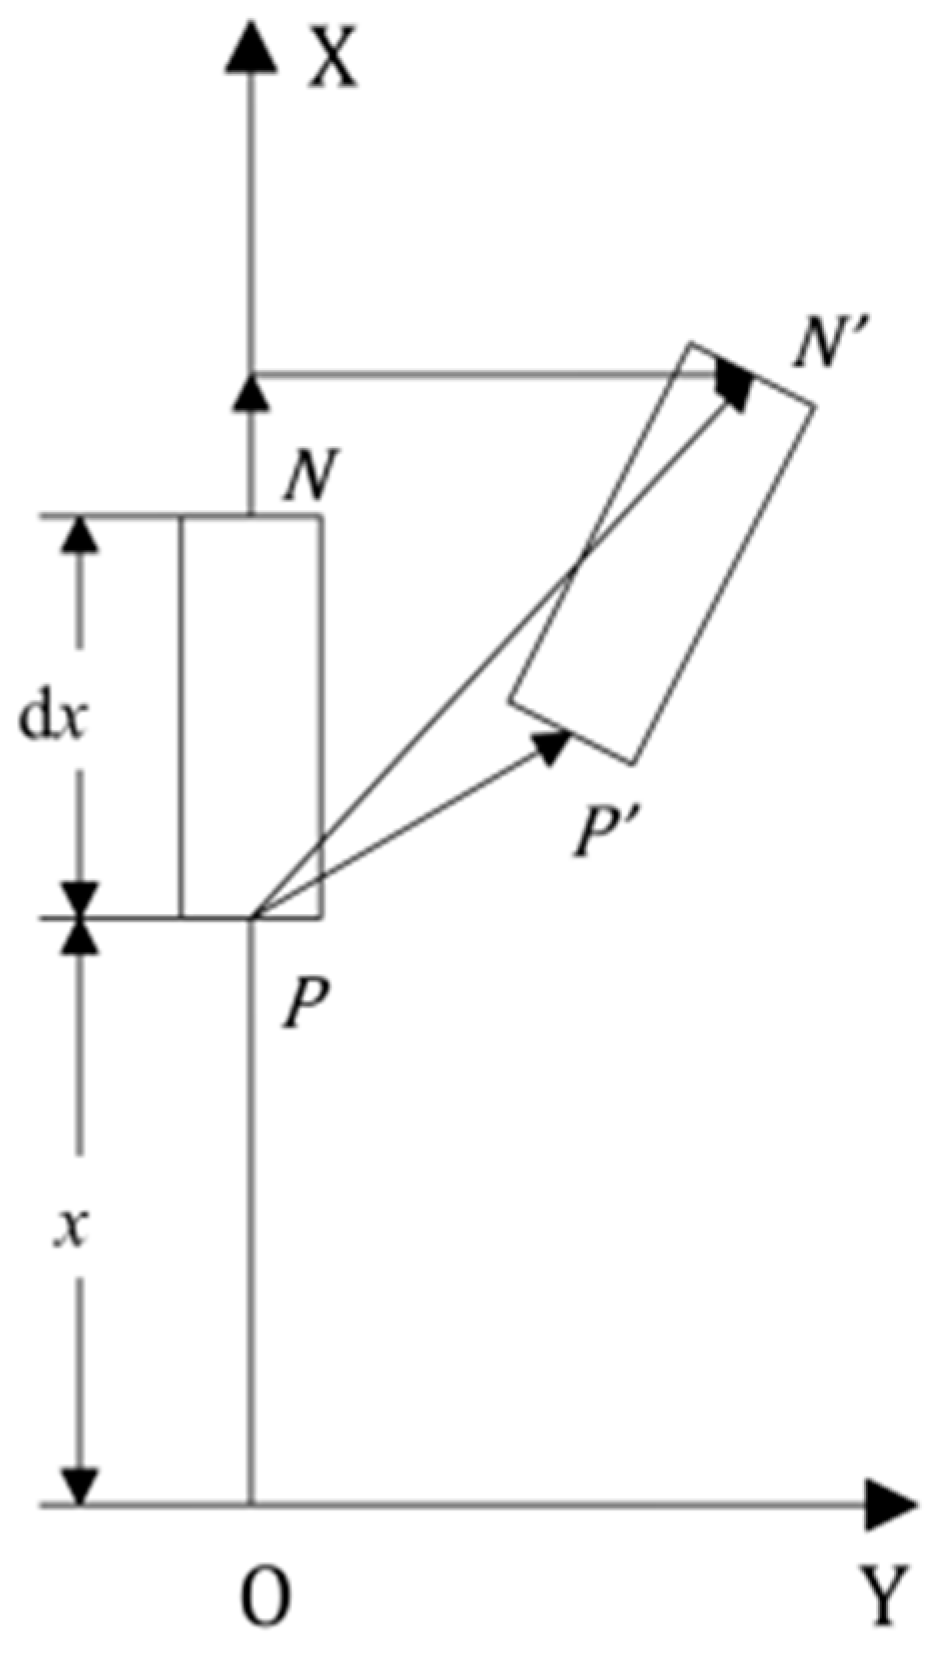
2.3. Vibration Differential Equations for Vertical Lifting Processes
- (1)
- The composite structure is composed of uniform materials and the stress is within the elastic limit range;
- (2)
- The movement speed c of the structure in the axial direction is constant and uniform;
- (3)
- Only consider the lateral displacement of the structure in the Y direction;
- (4)
- The bending stiffness of the structure is negligible;
- (5)
- The structure is in a uniform initial tensile state.
3. Solving Vibration Differential Equations Based on Perturbation Method
3.1. Solution Based on Galerkin Discrete Analysis
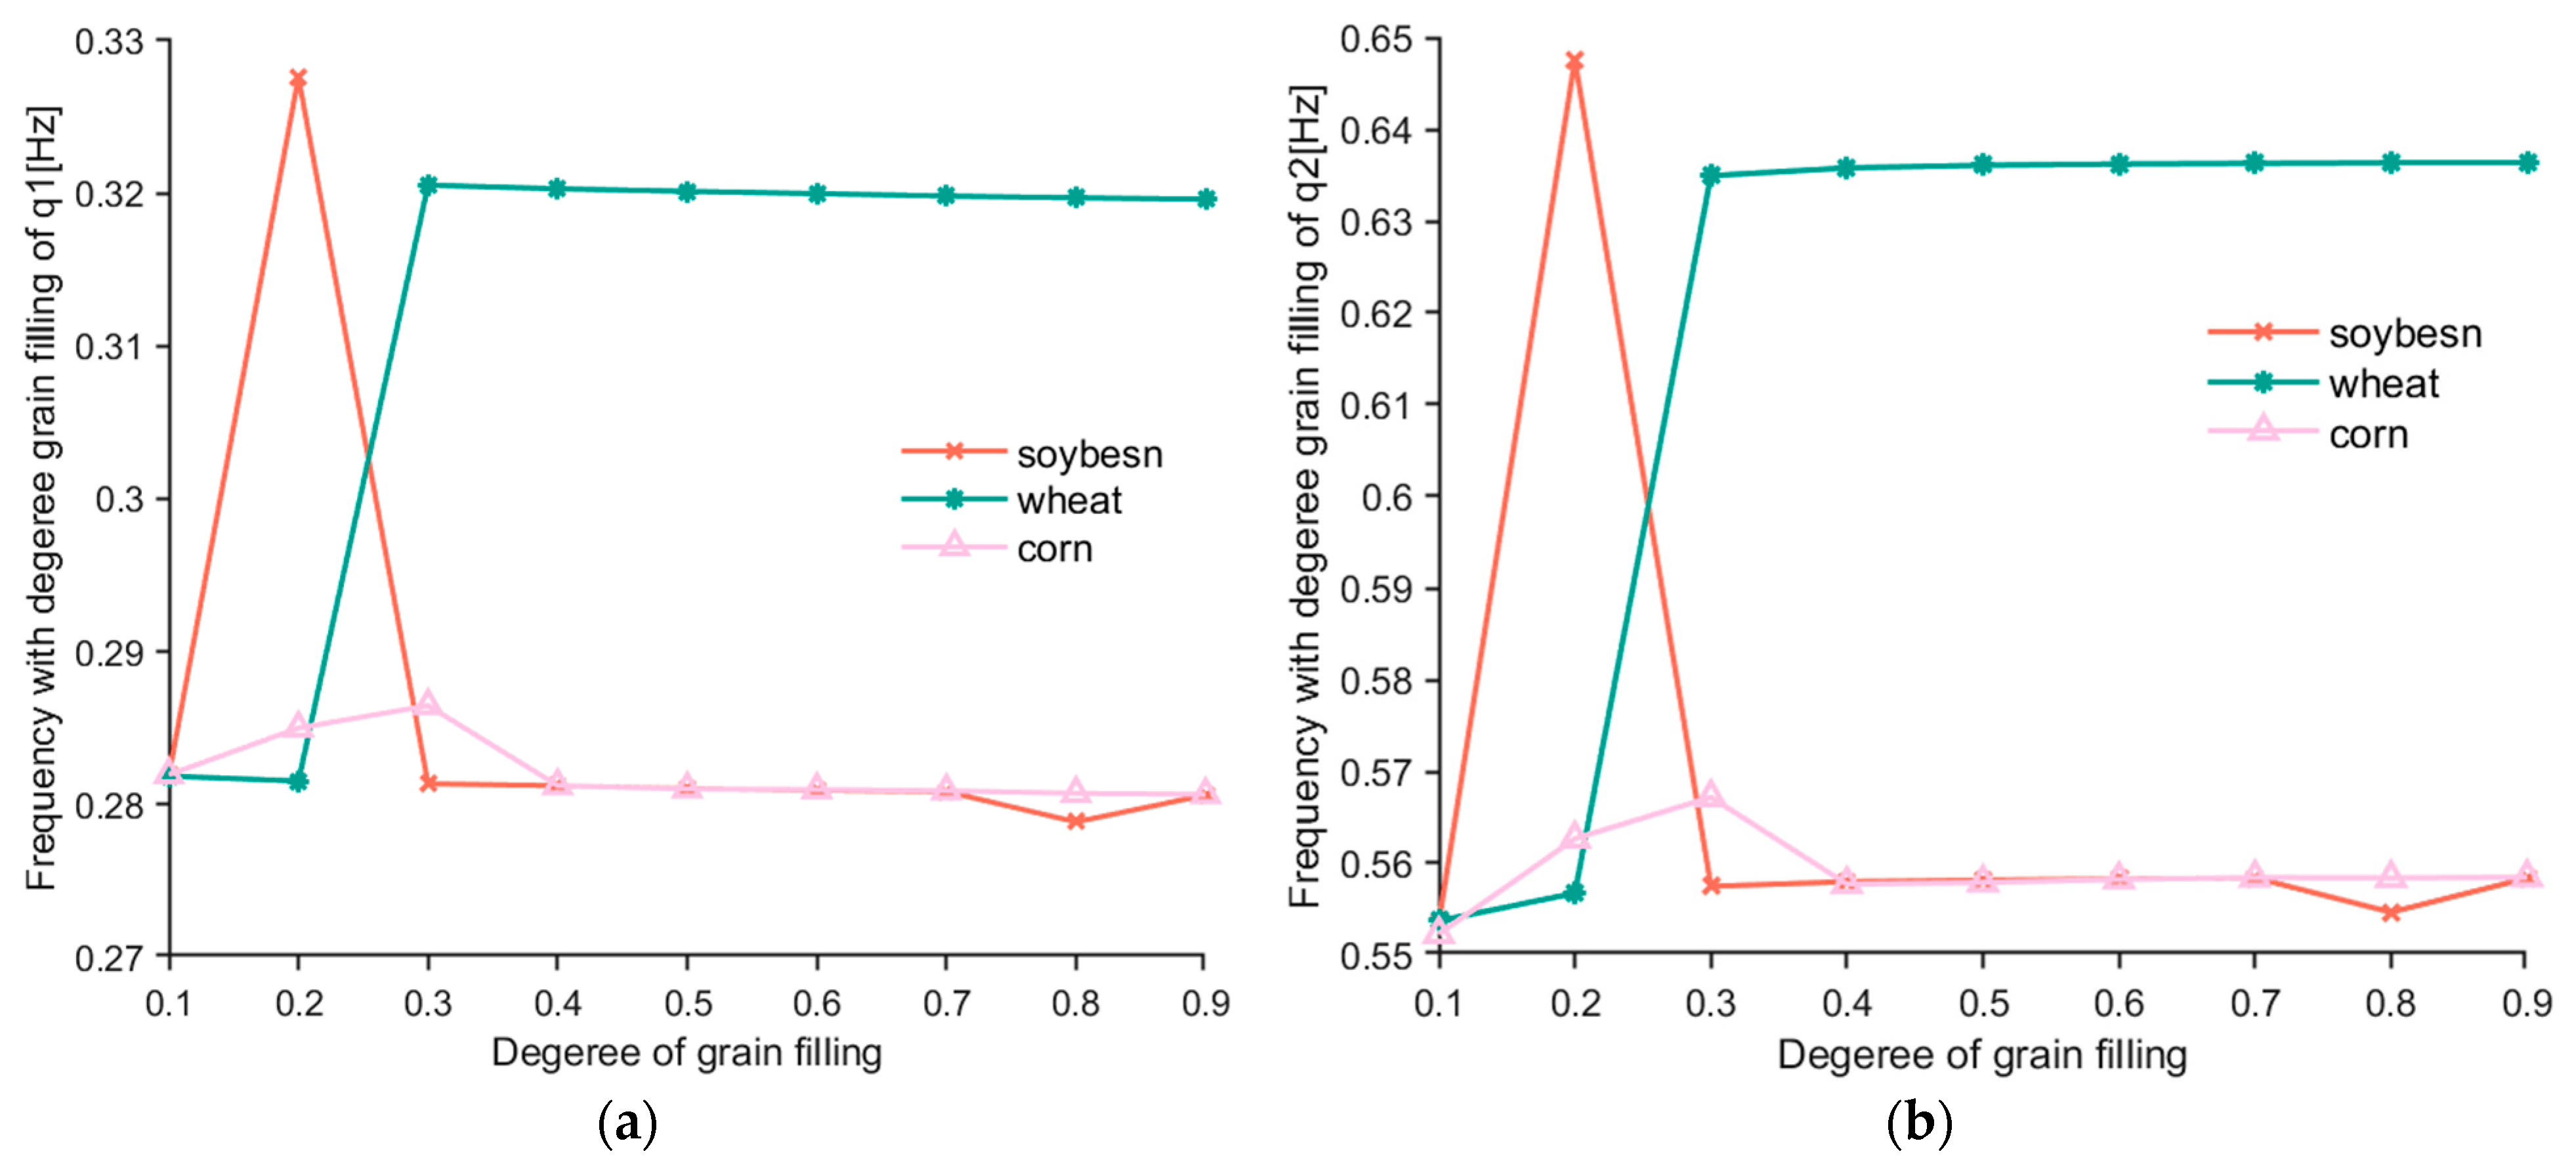
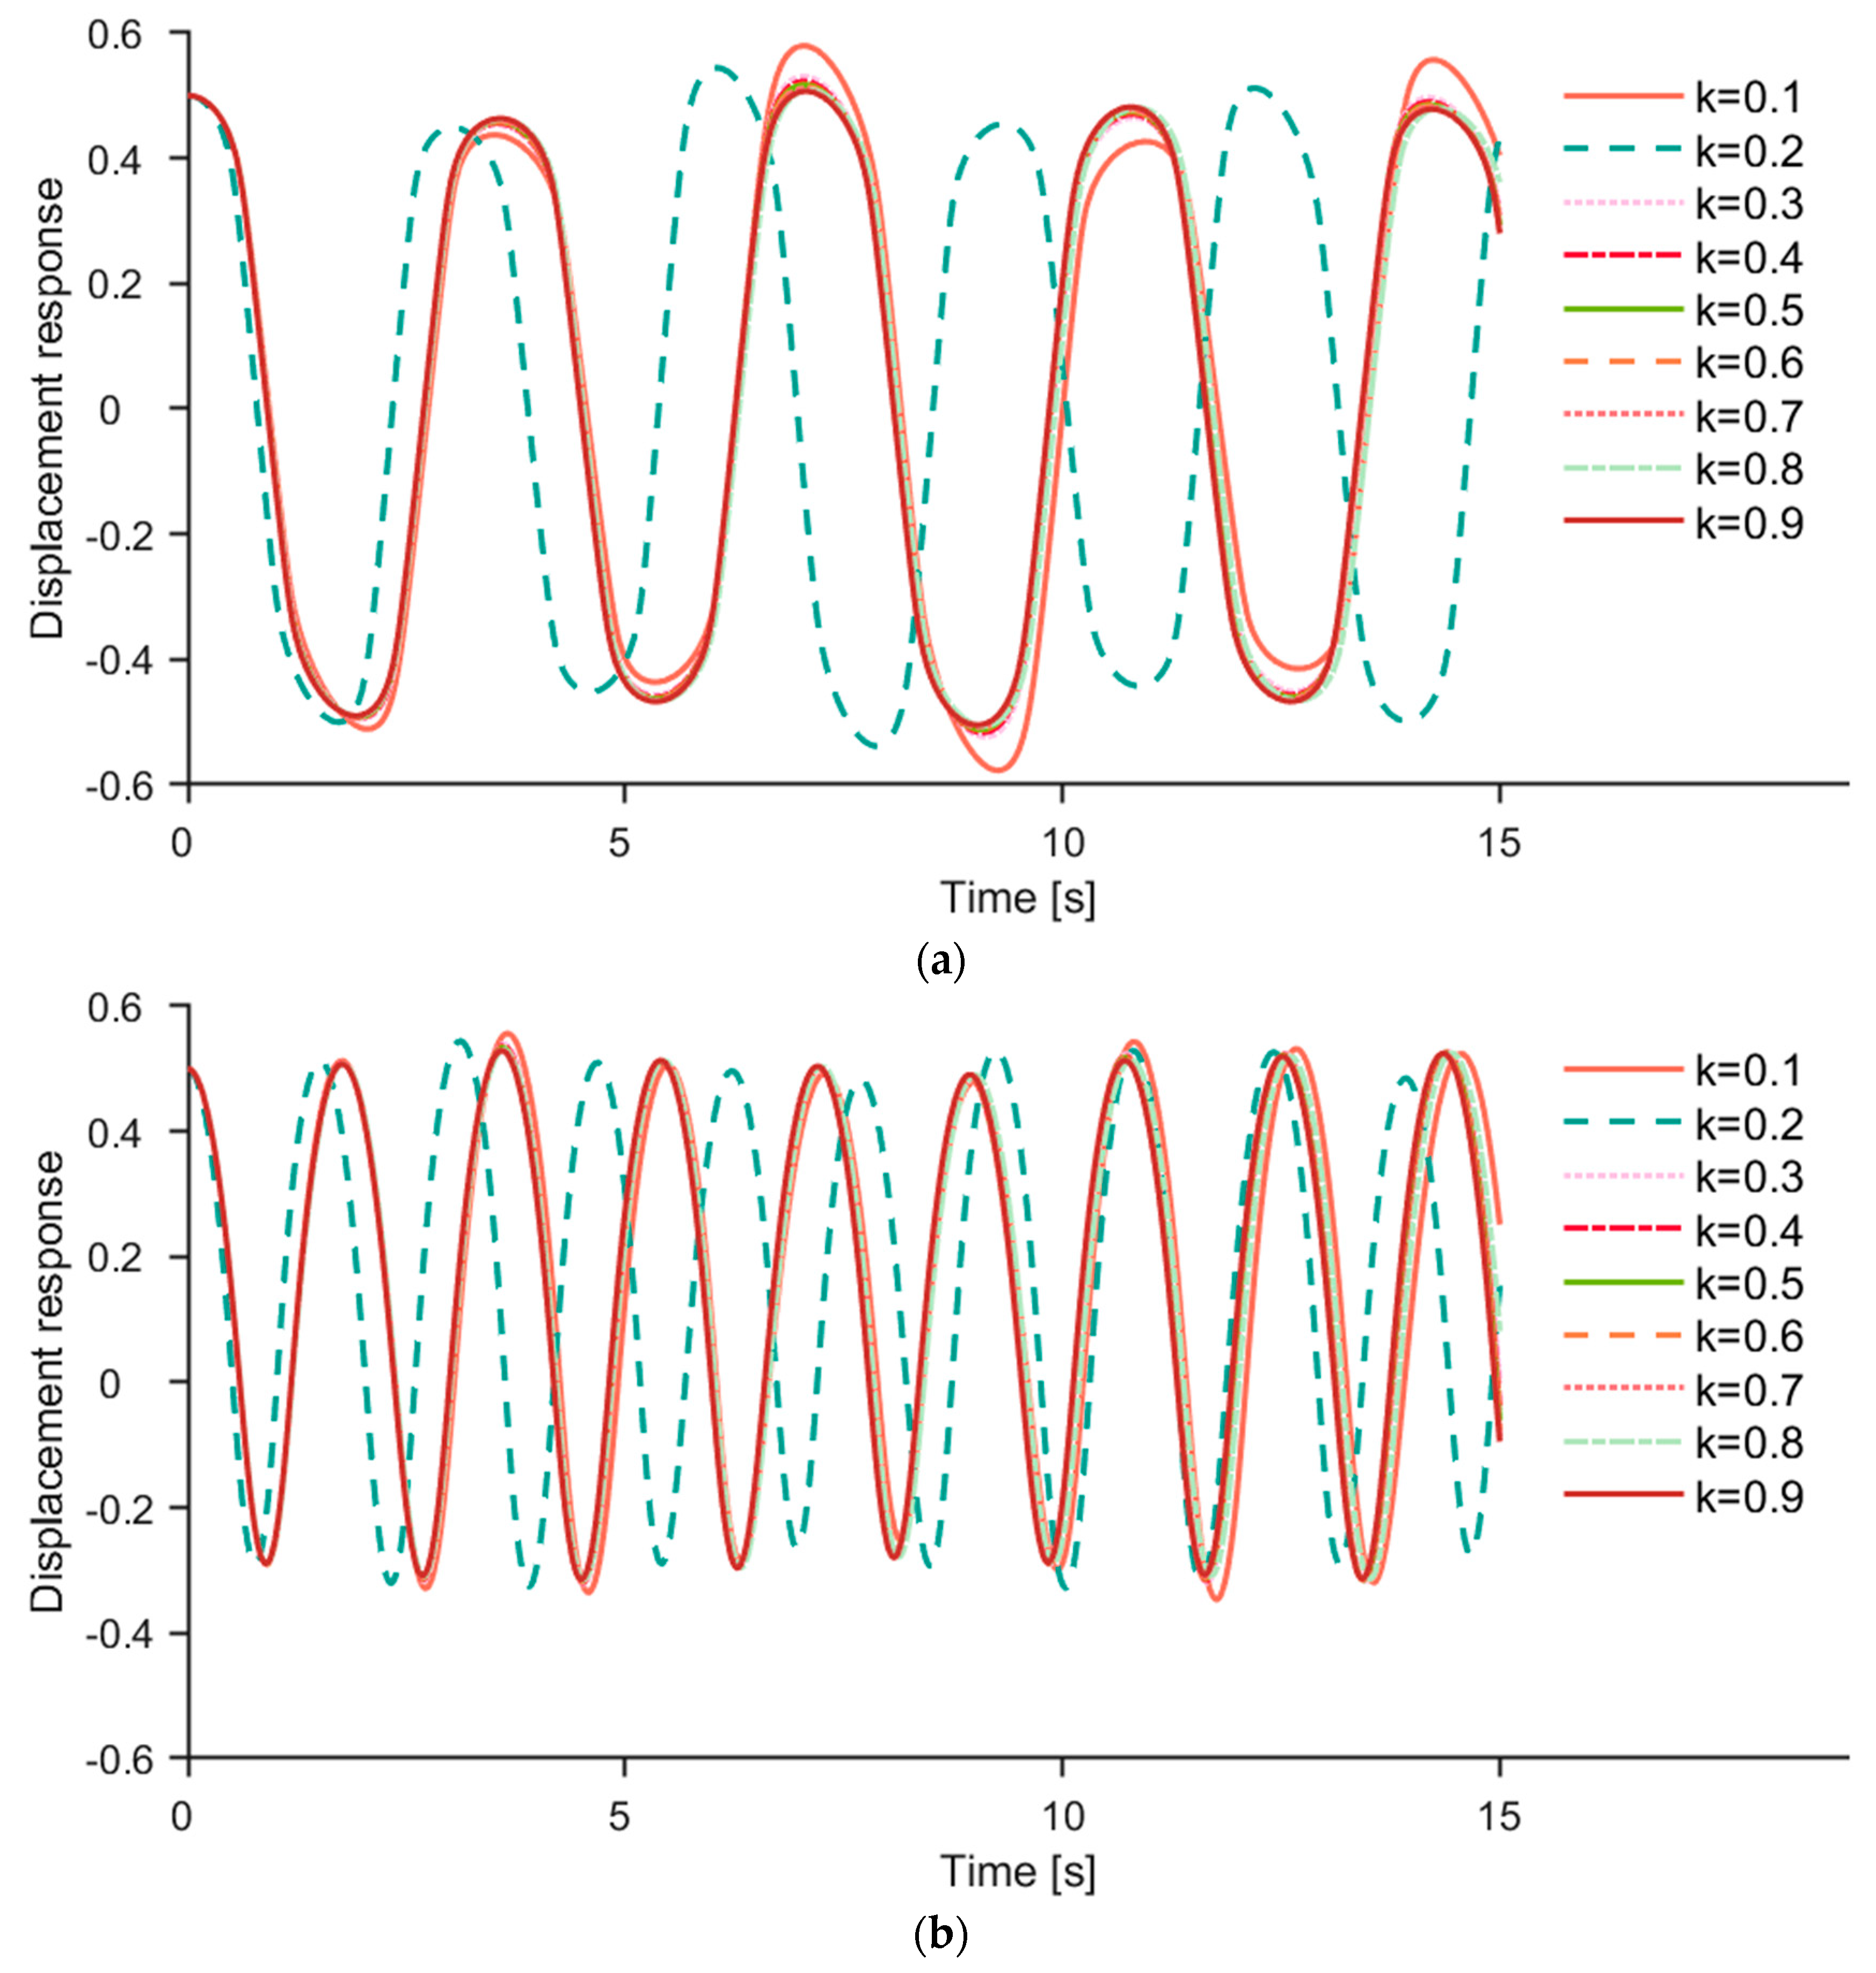
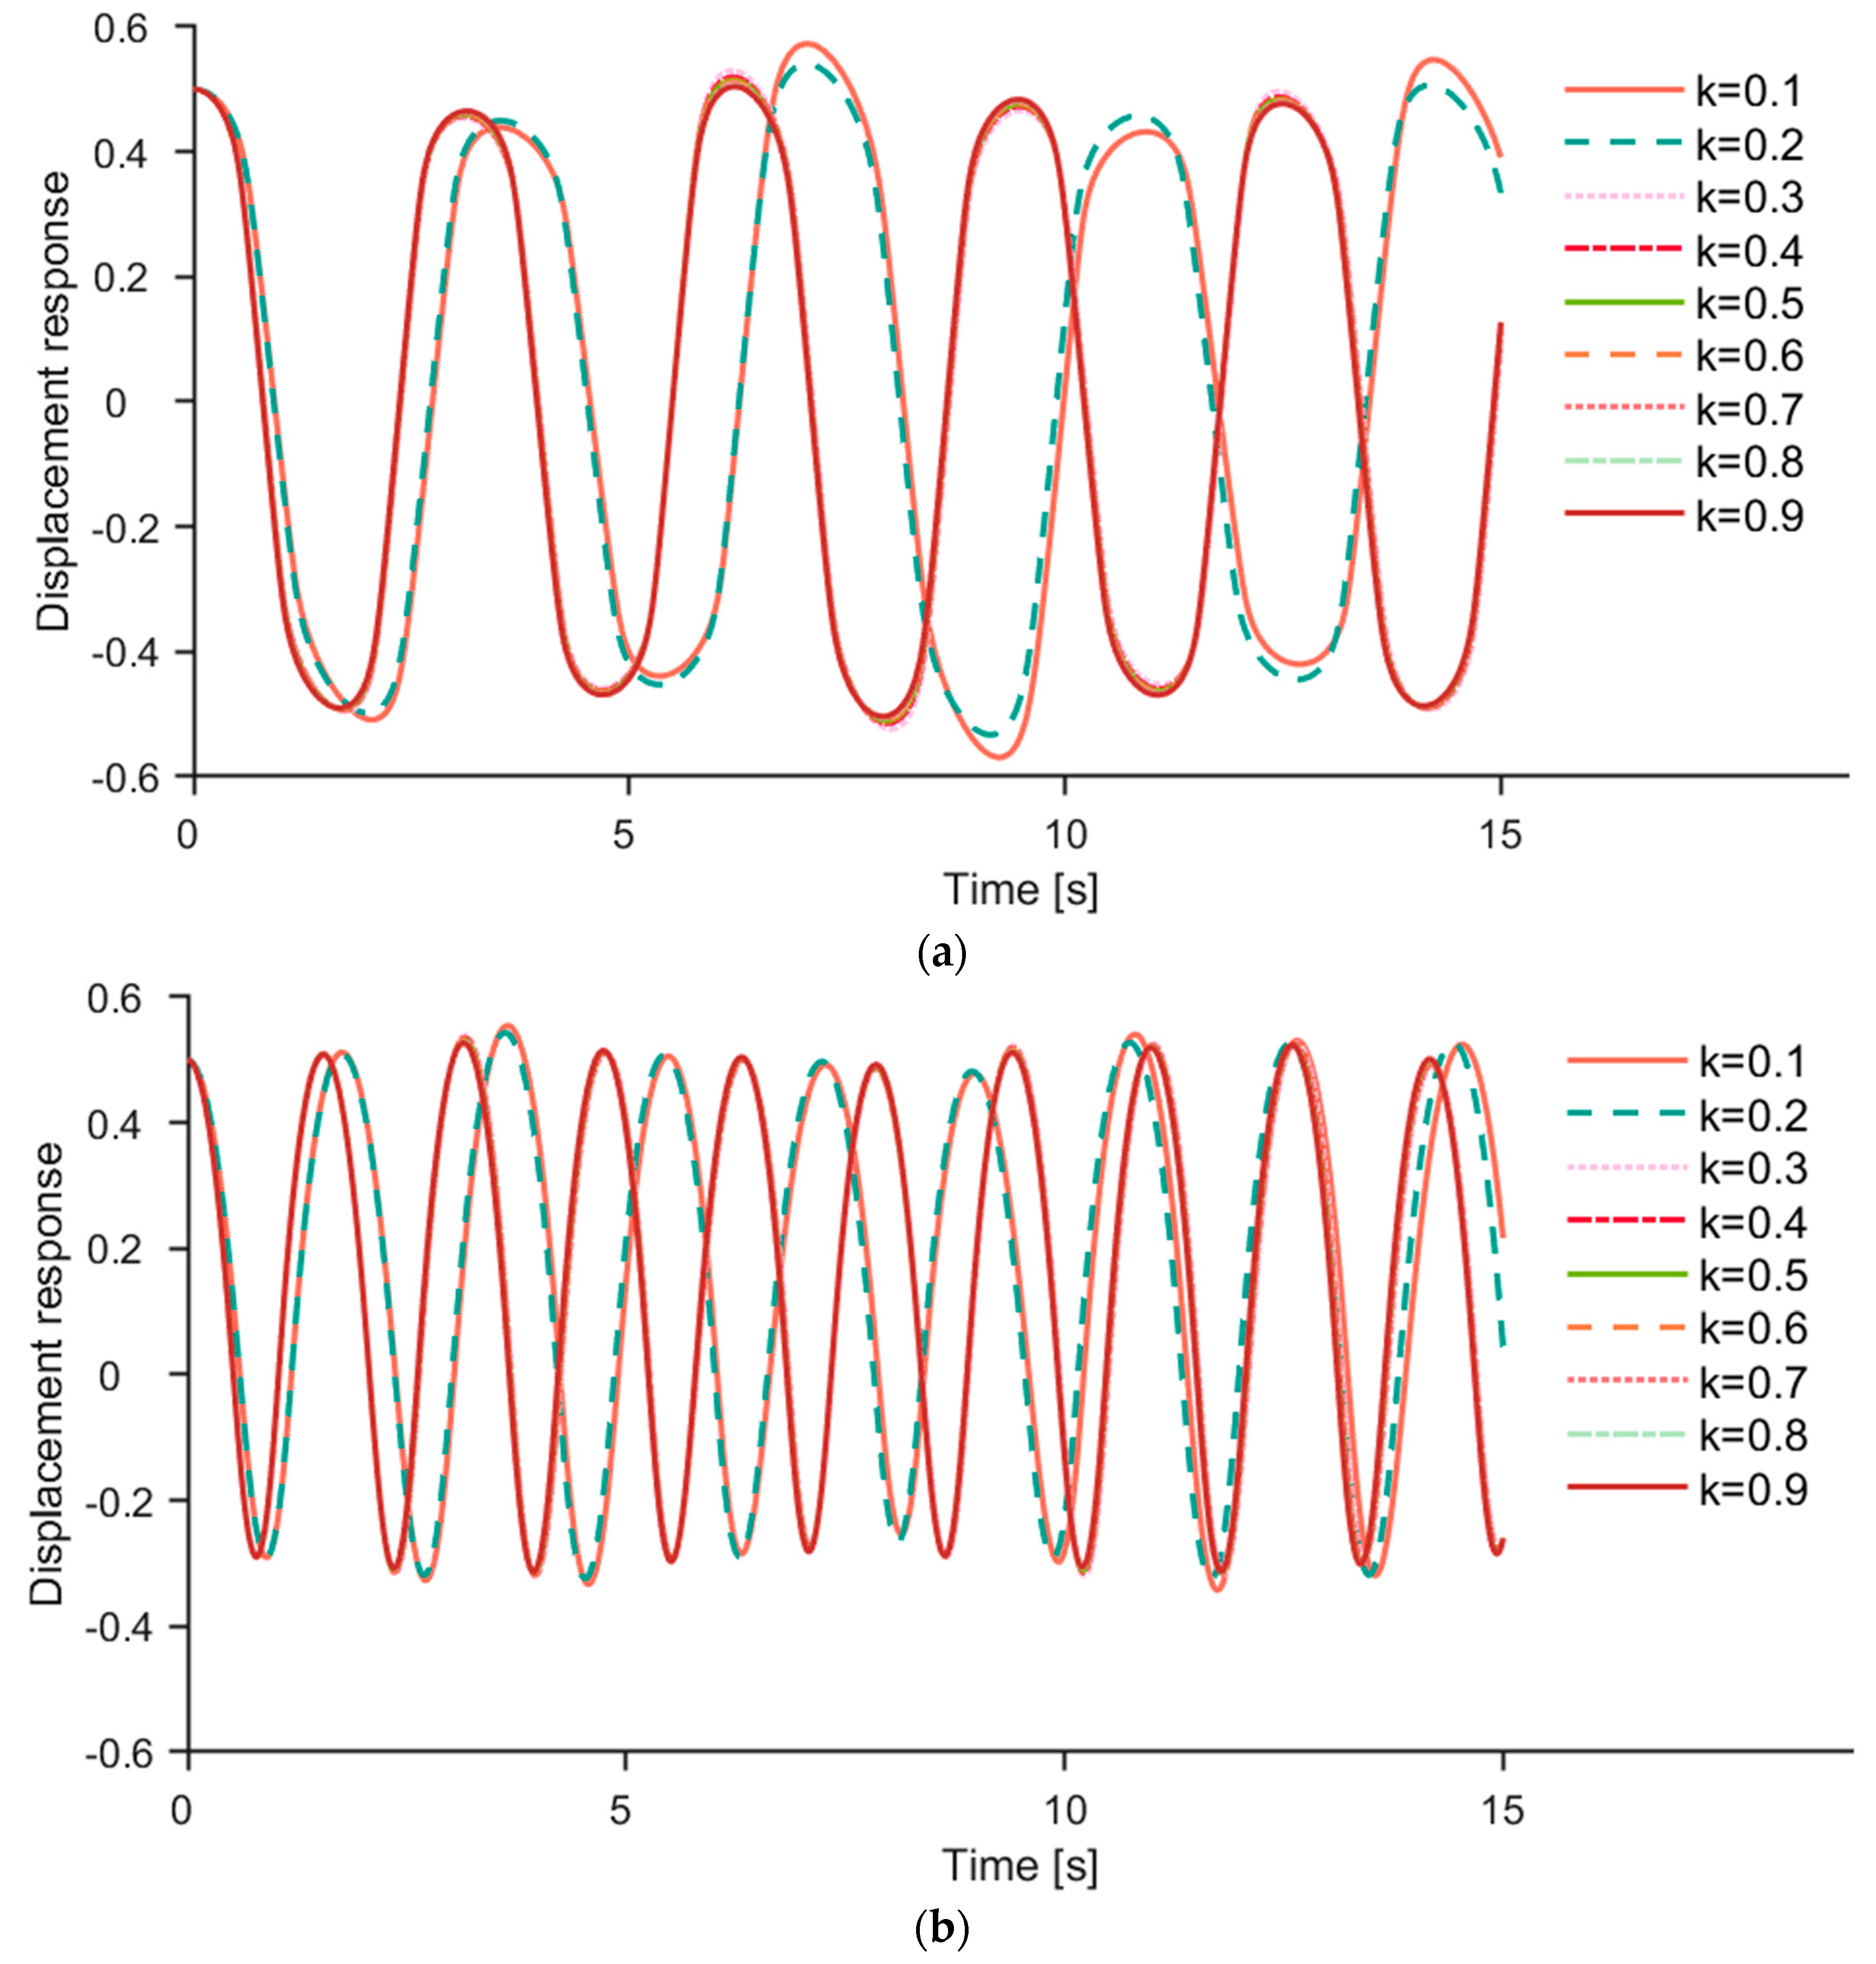
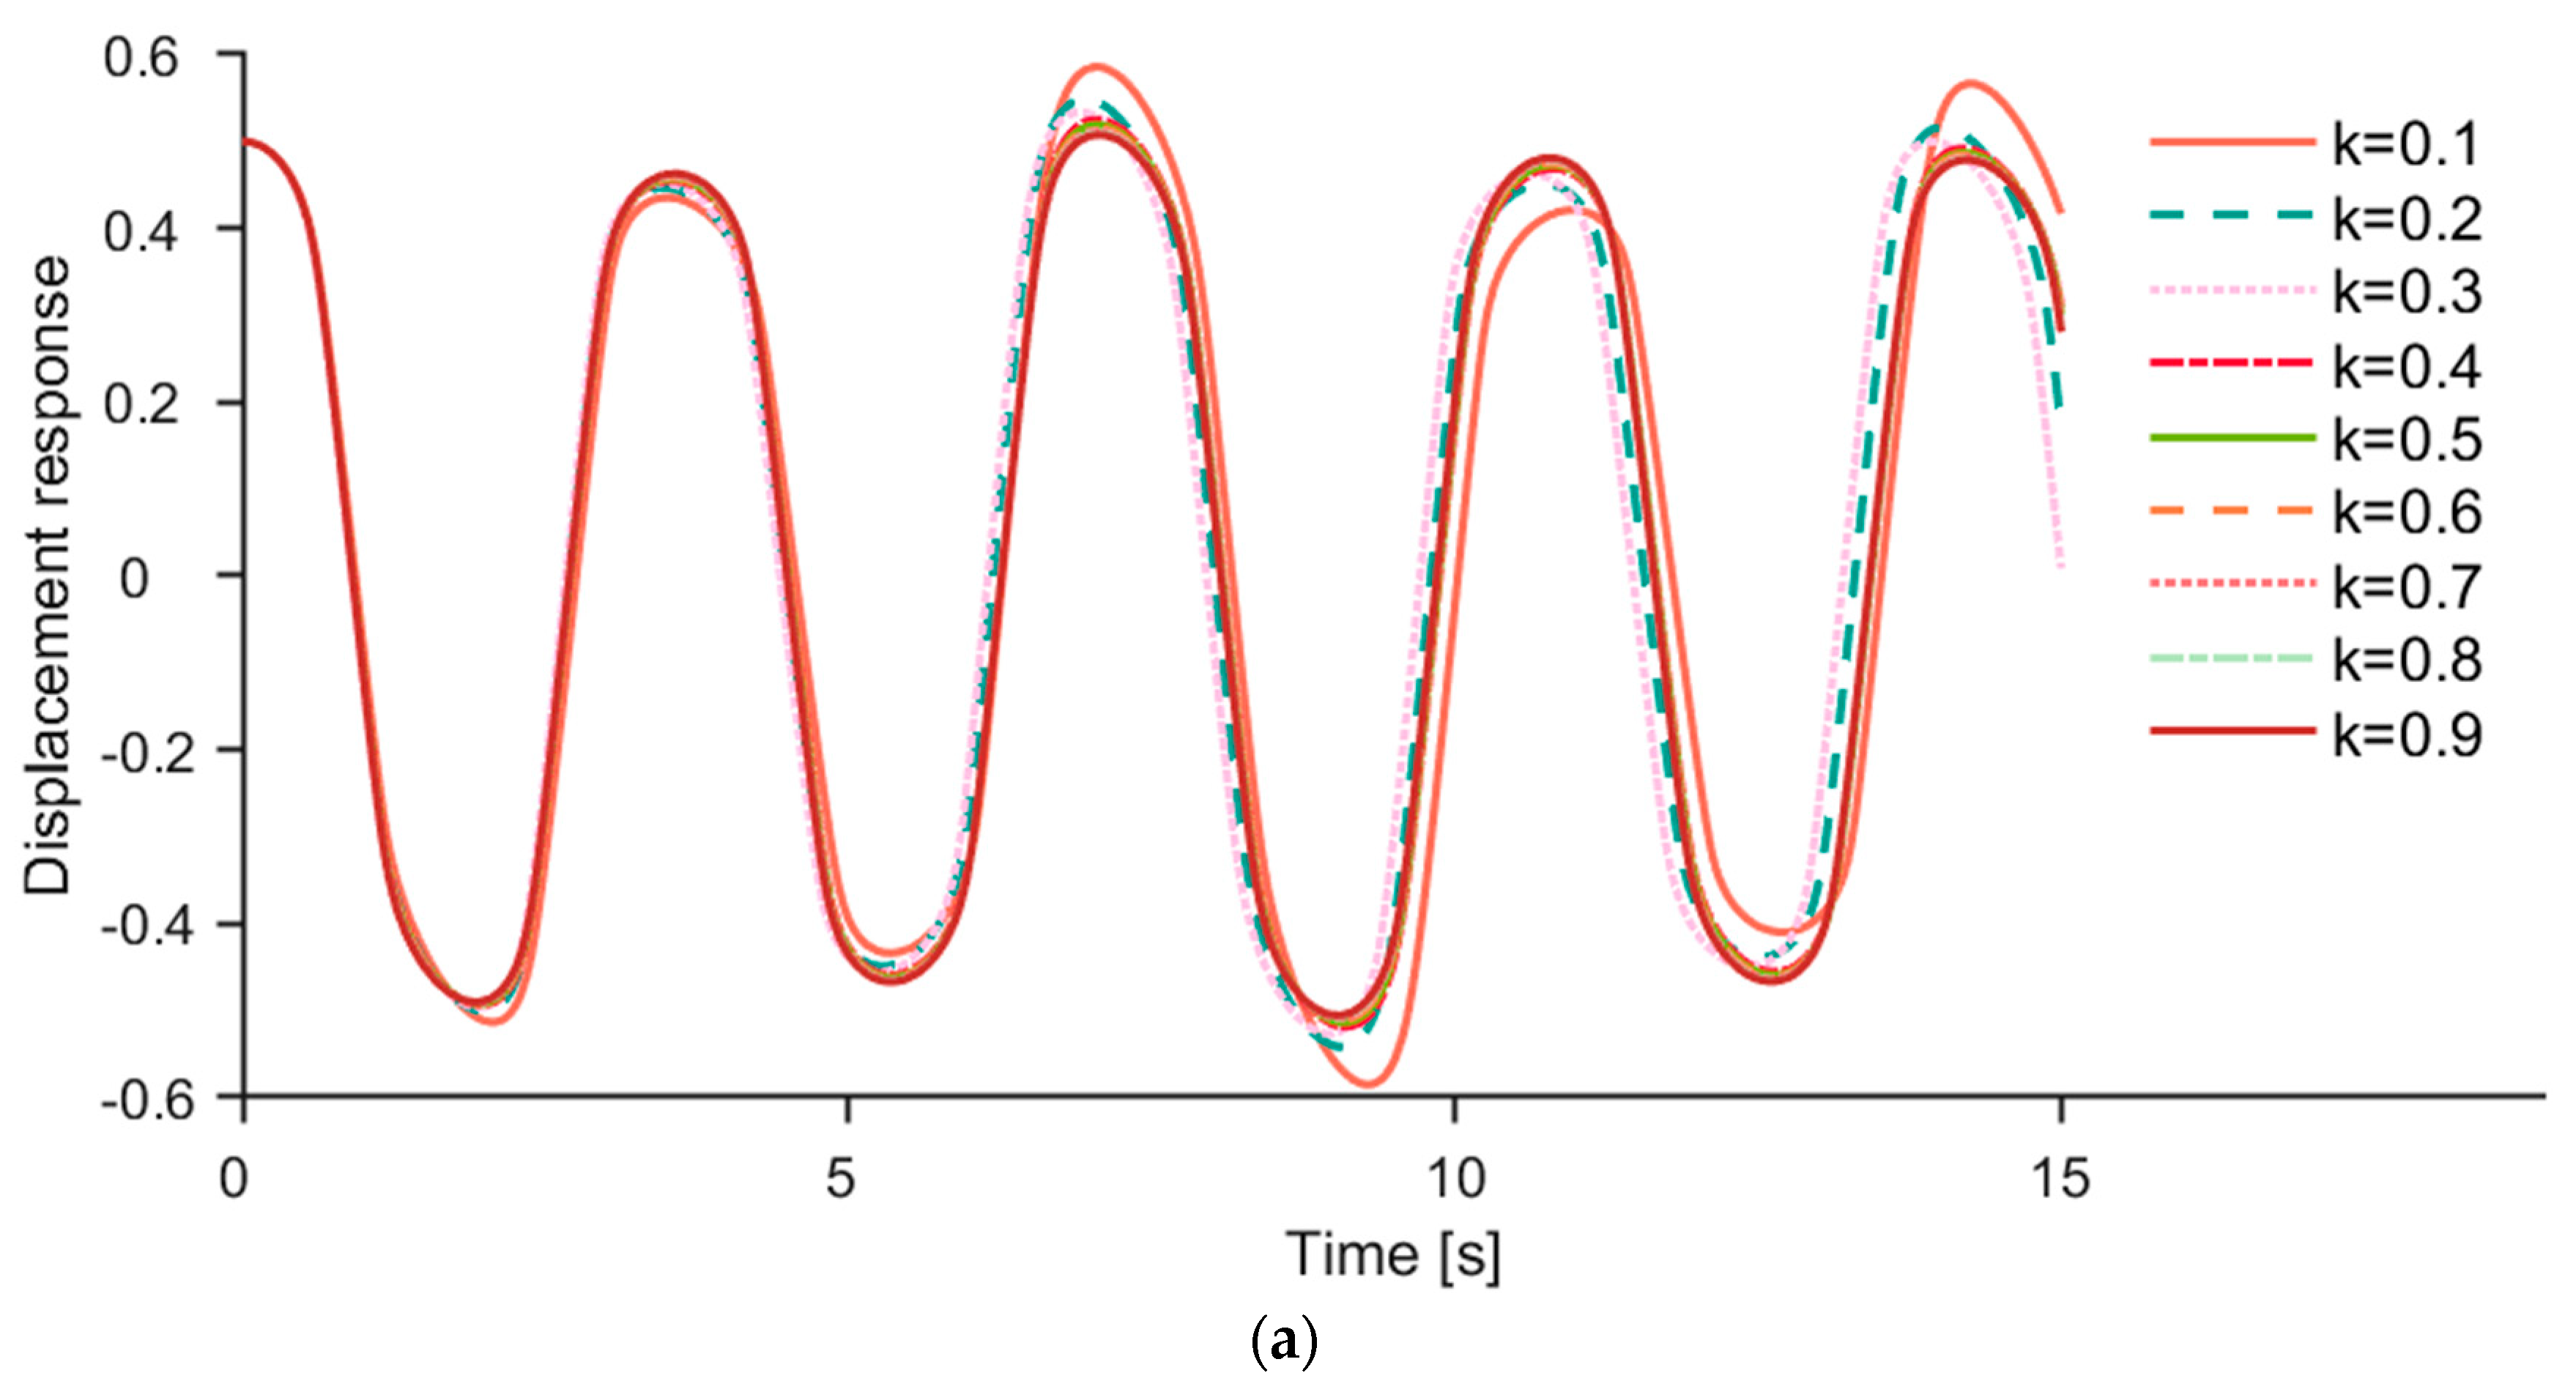
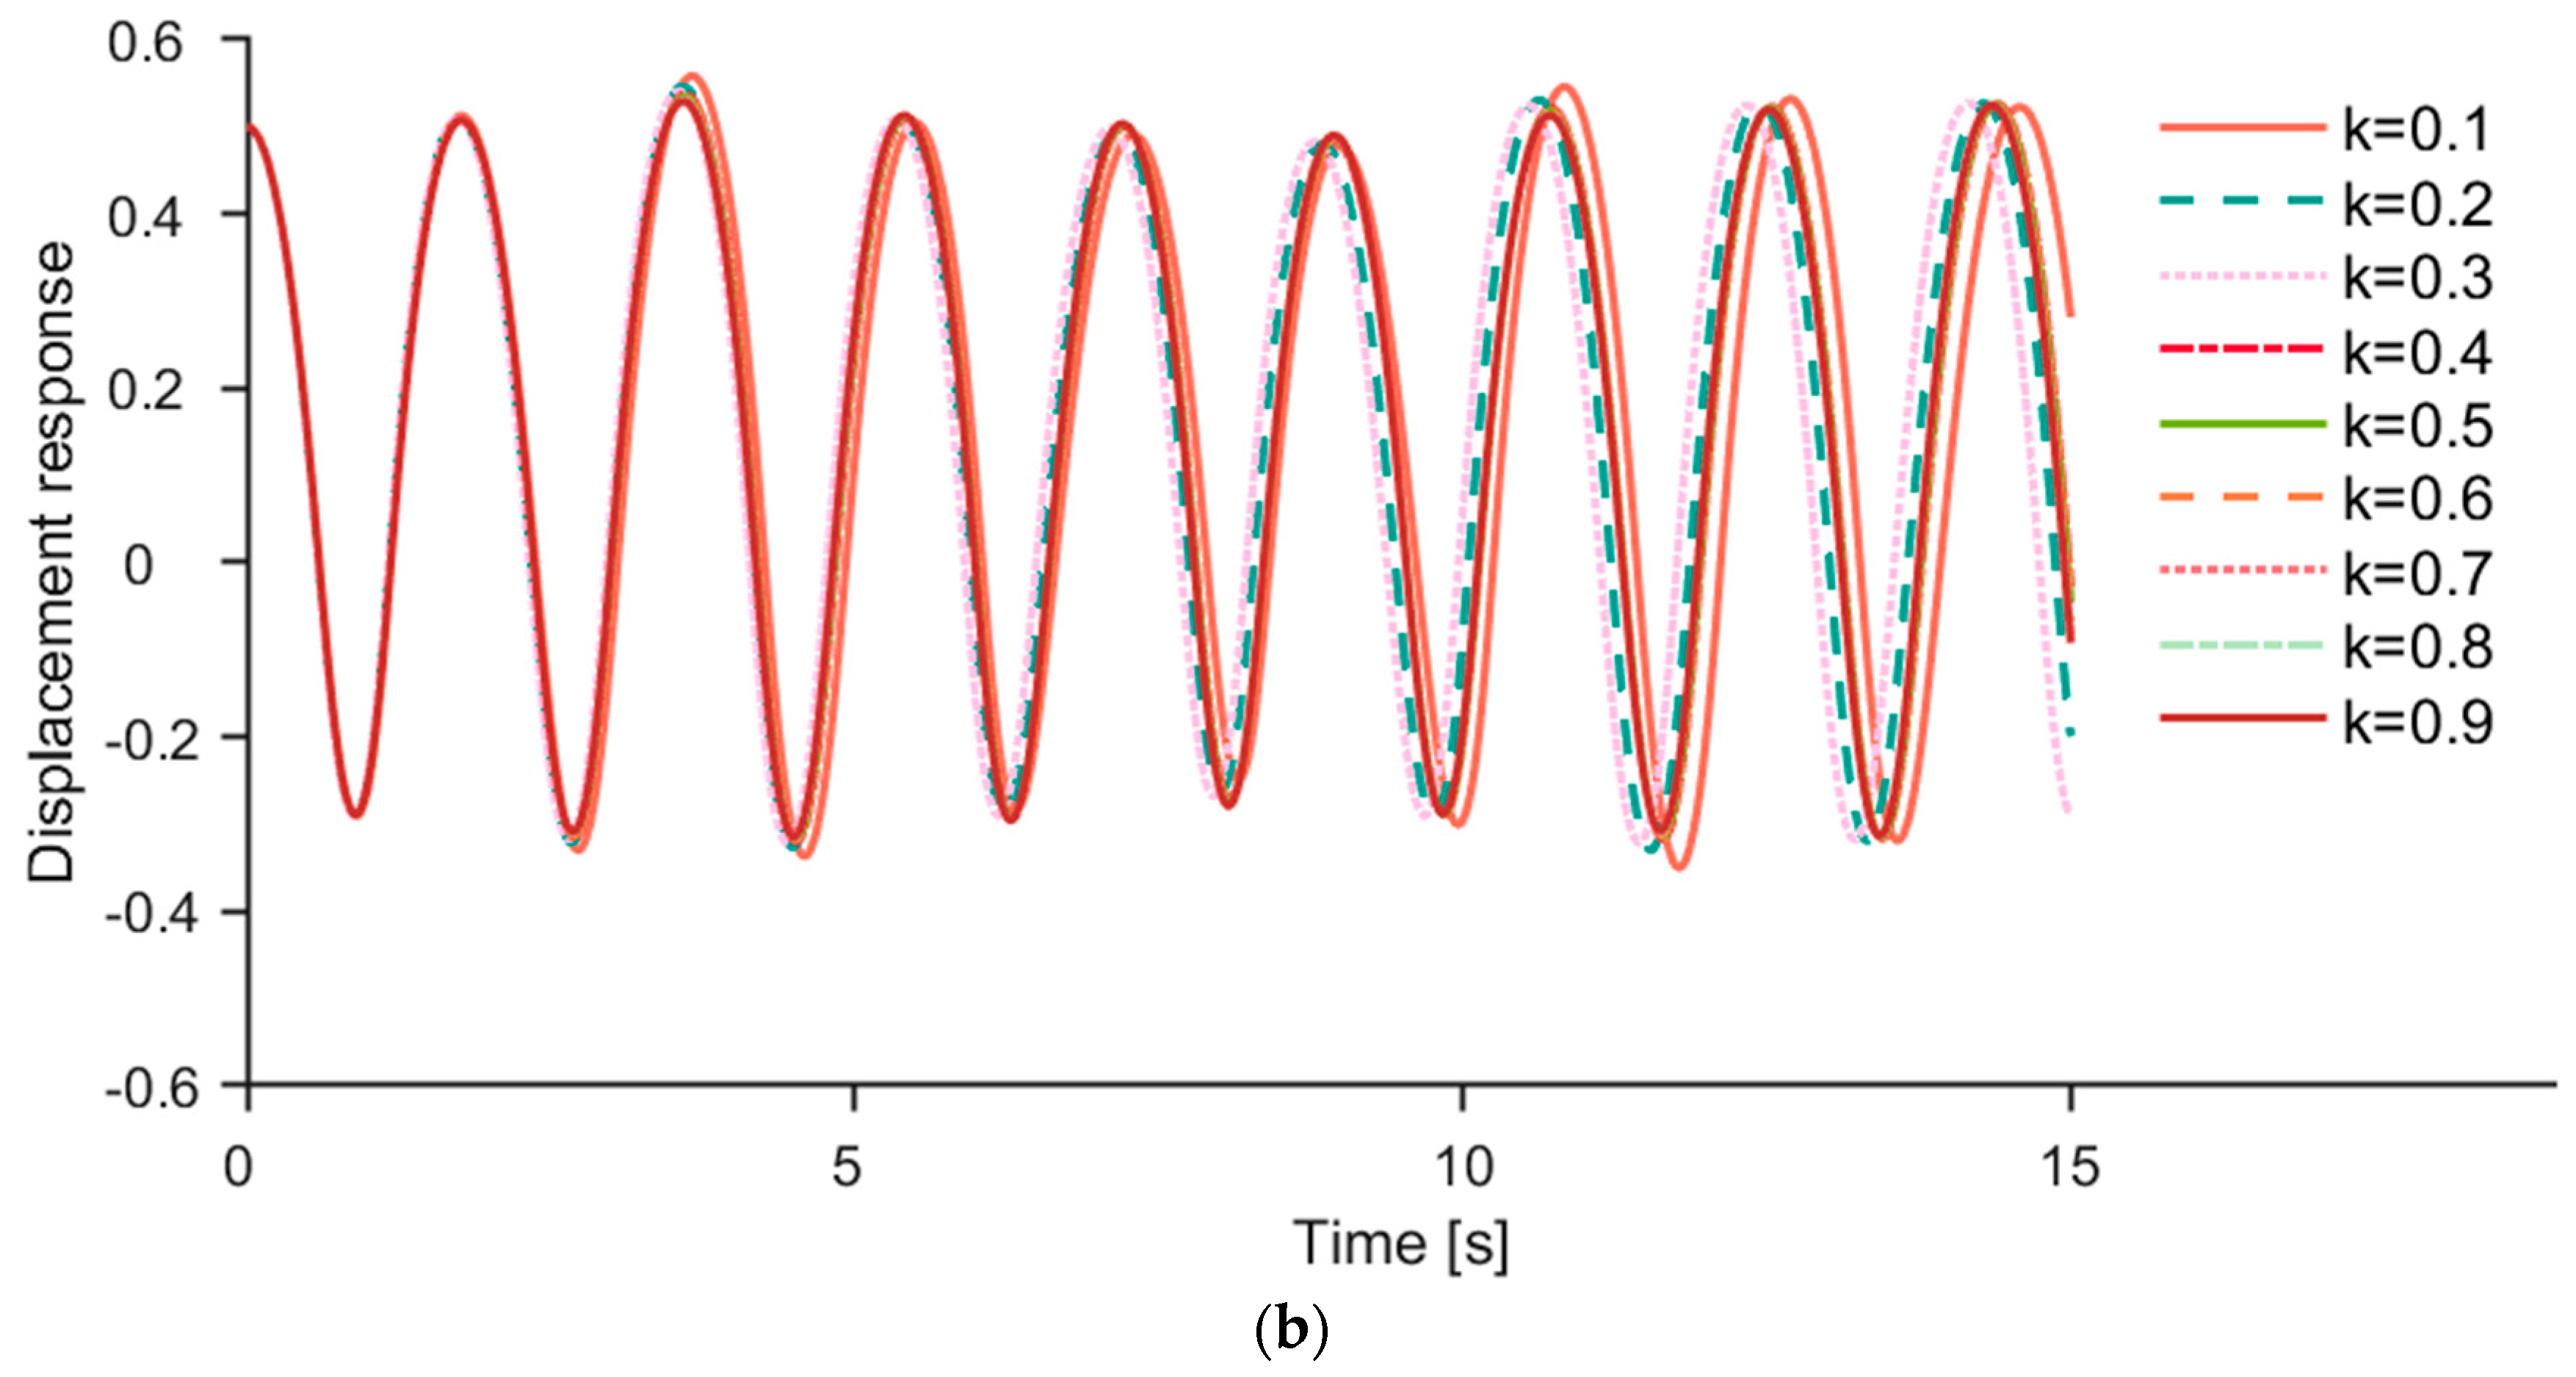
3.2. Discussion of Results
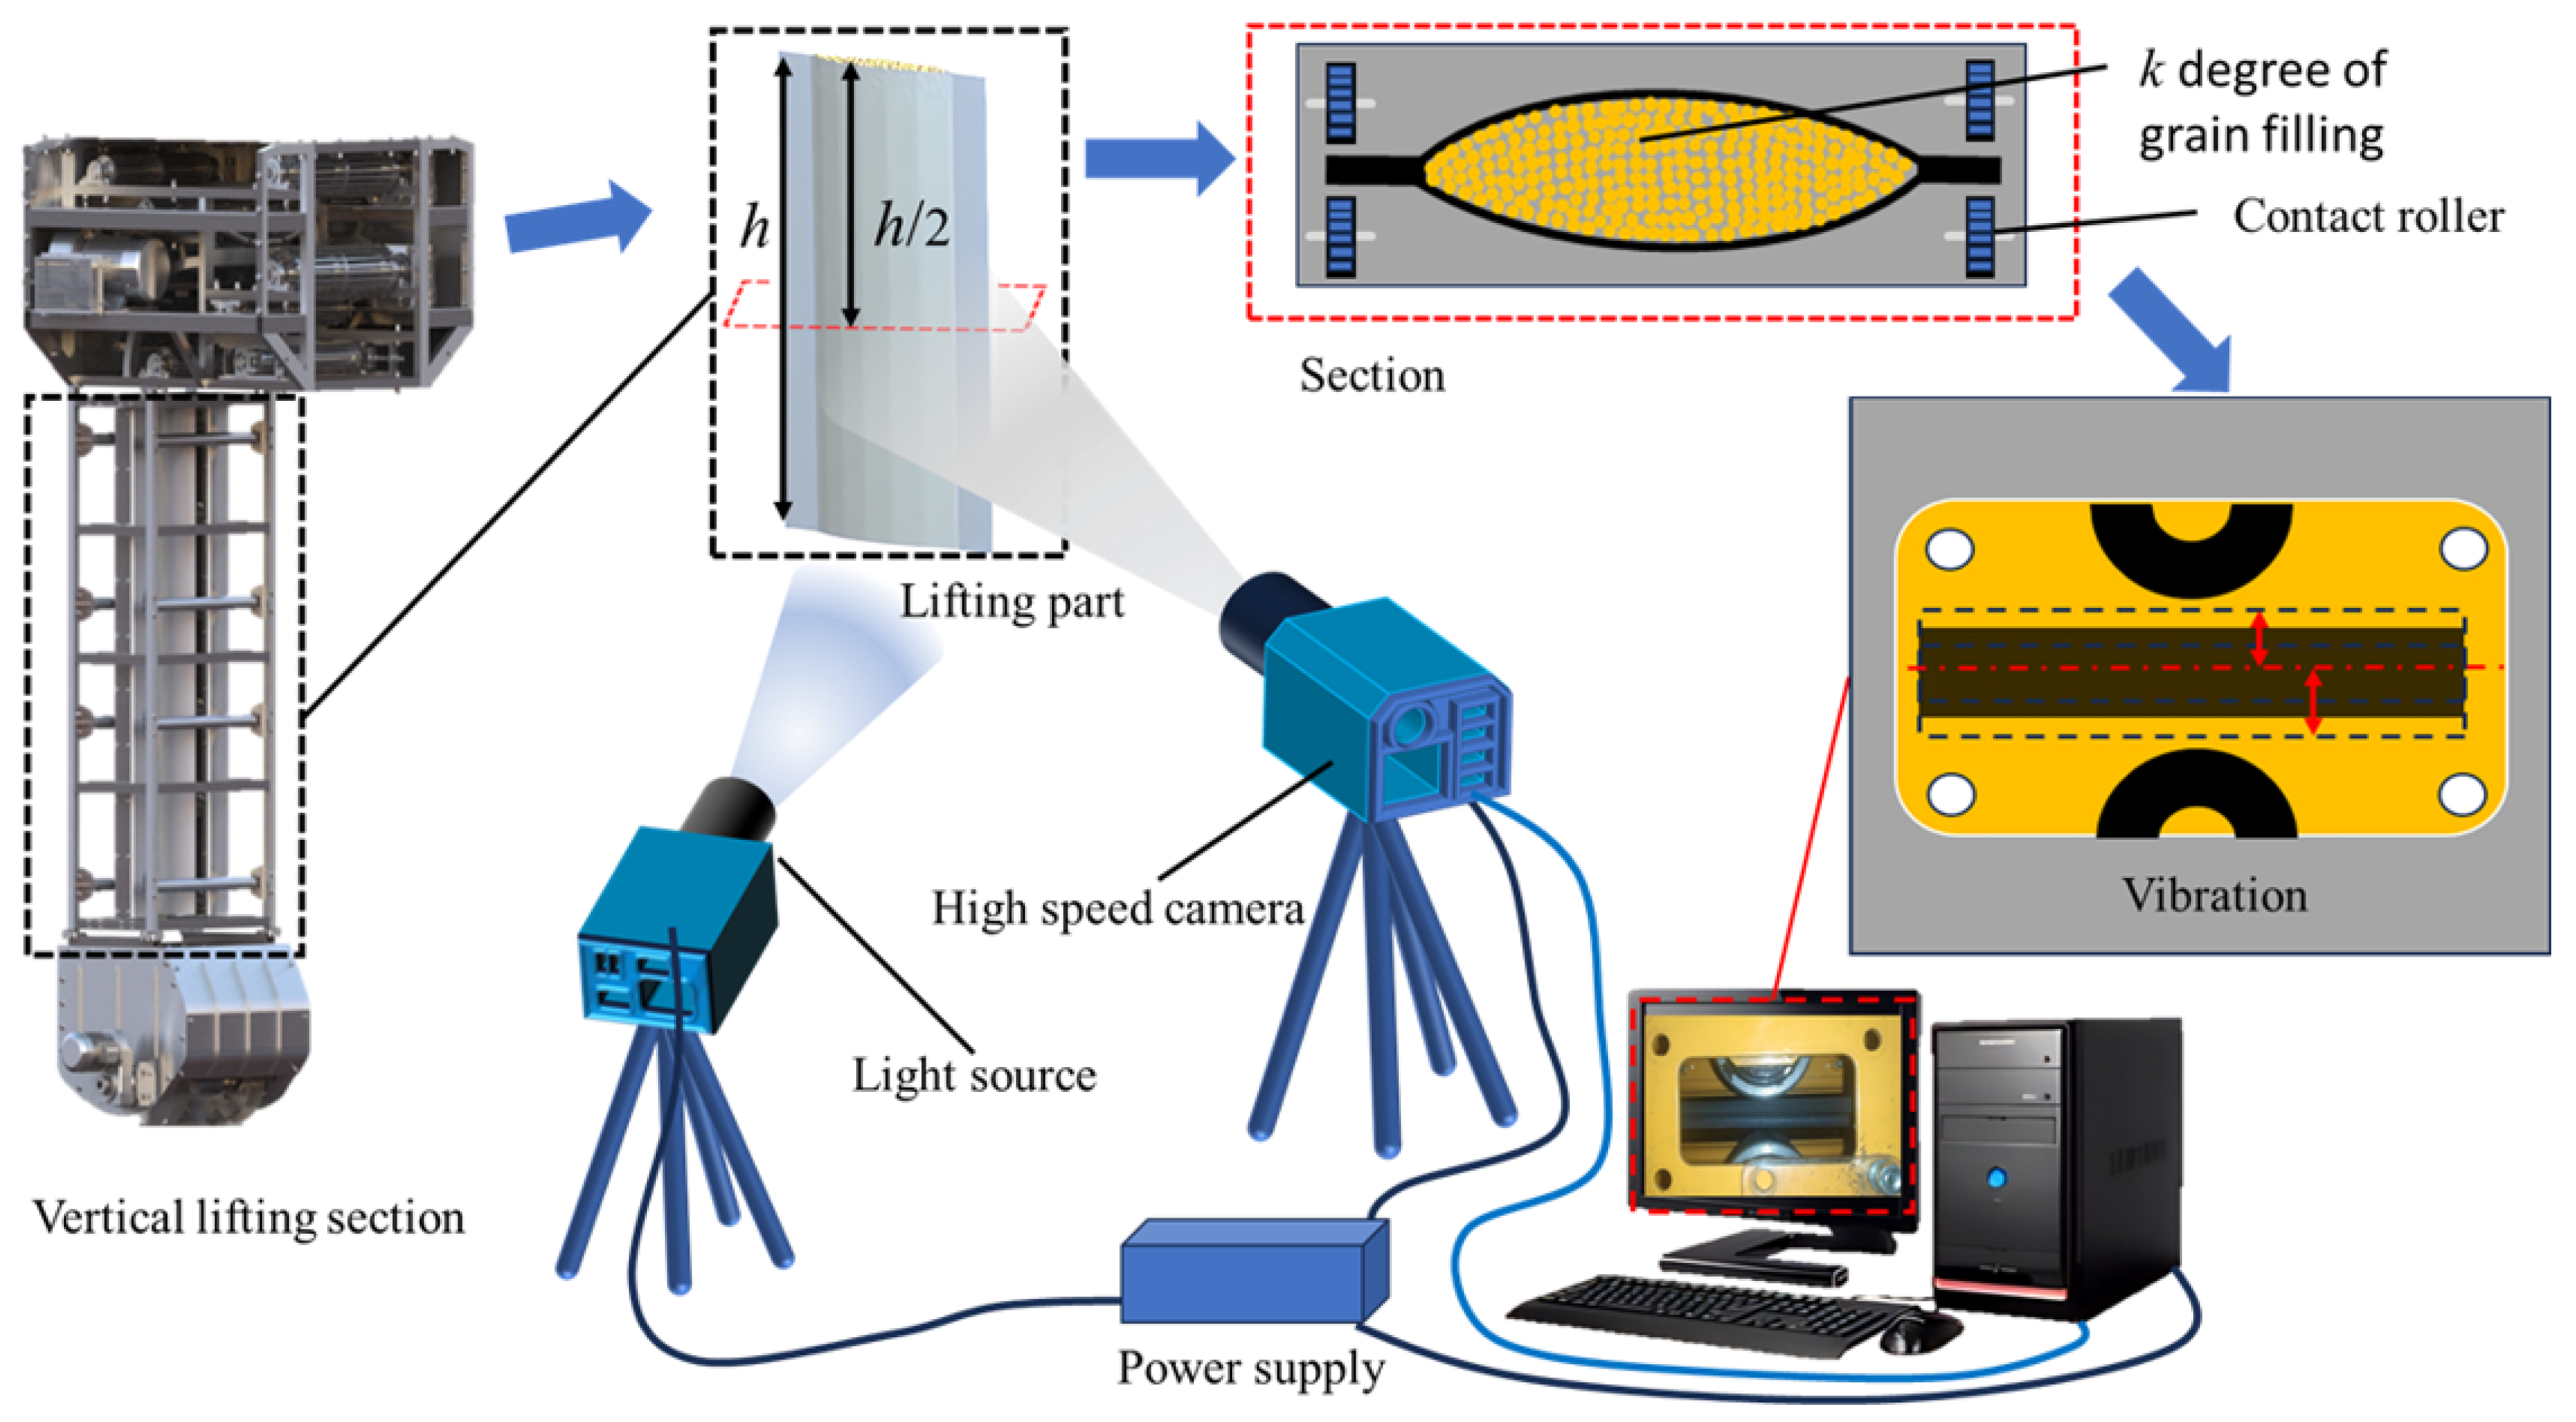
4. Verification Experiment
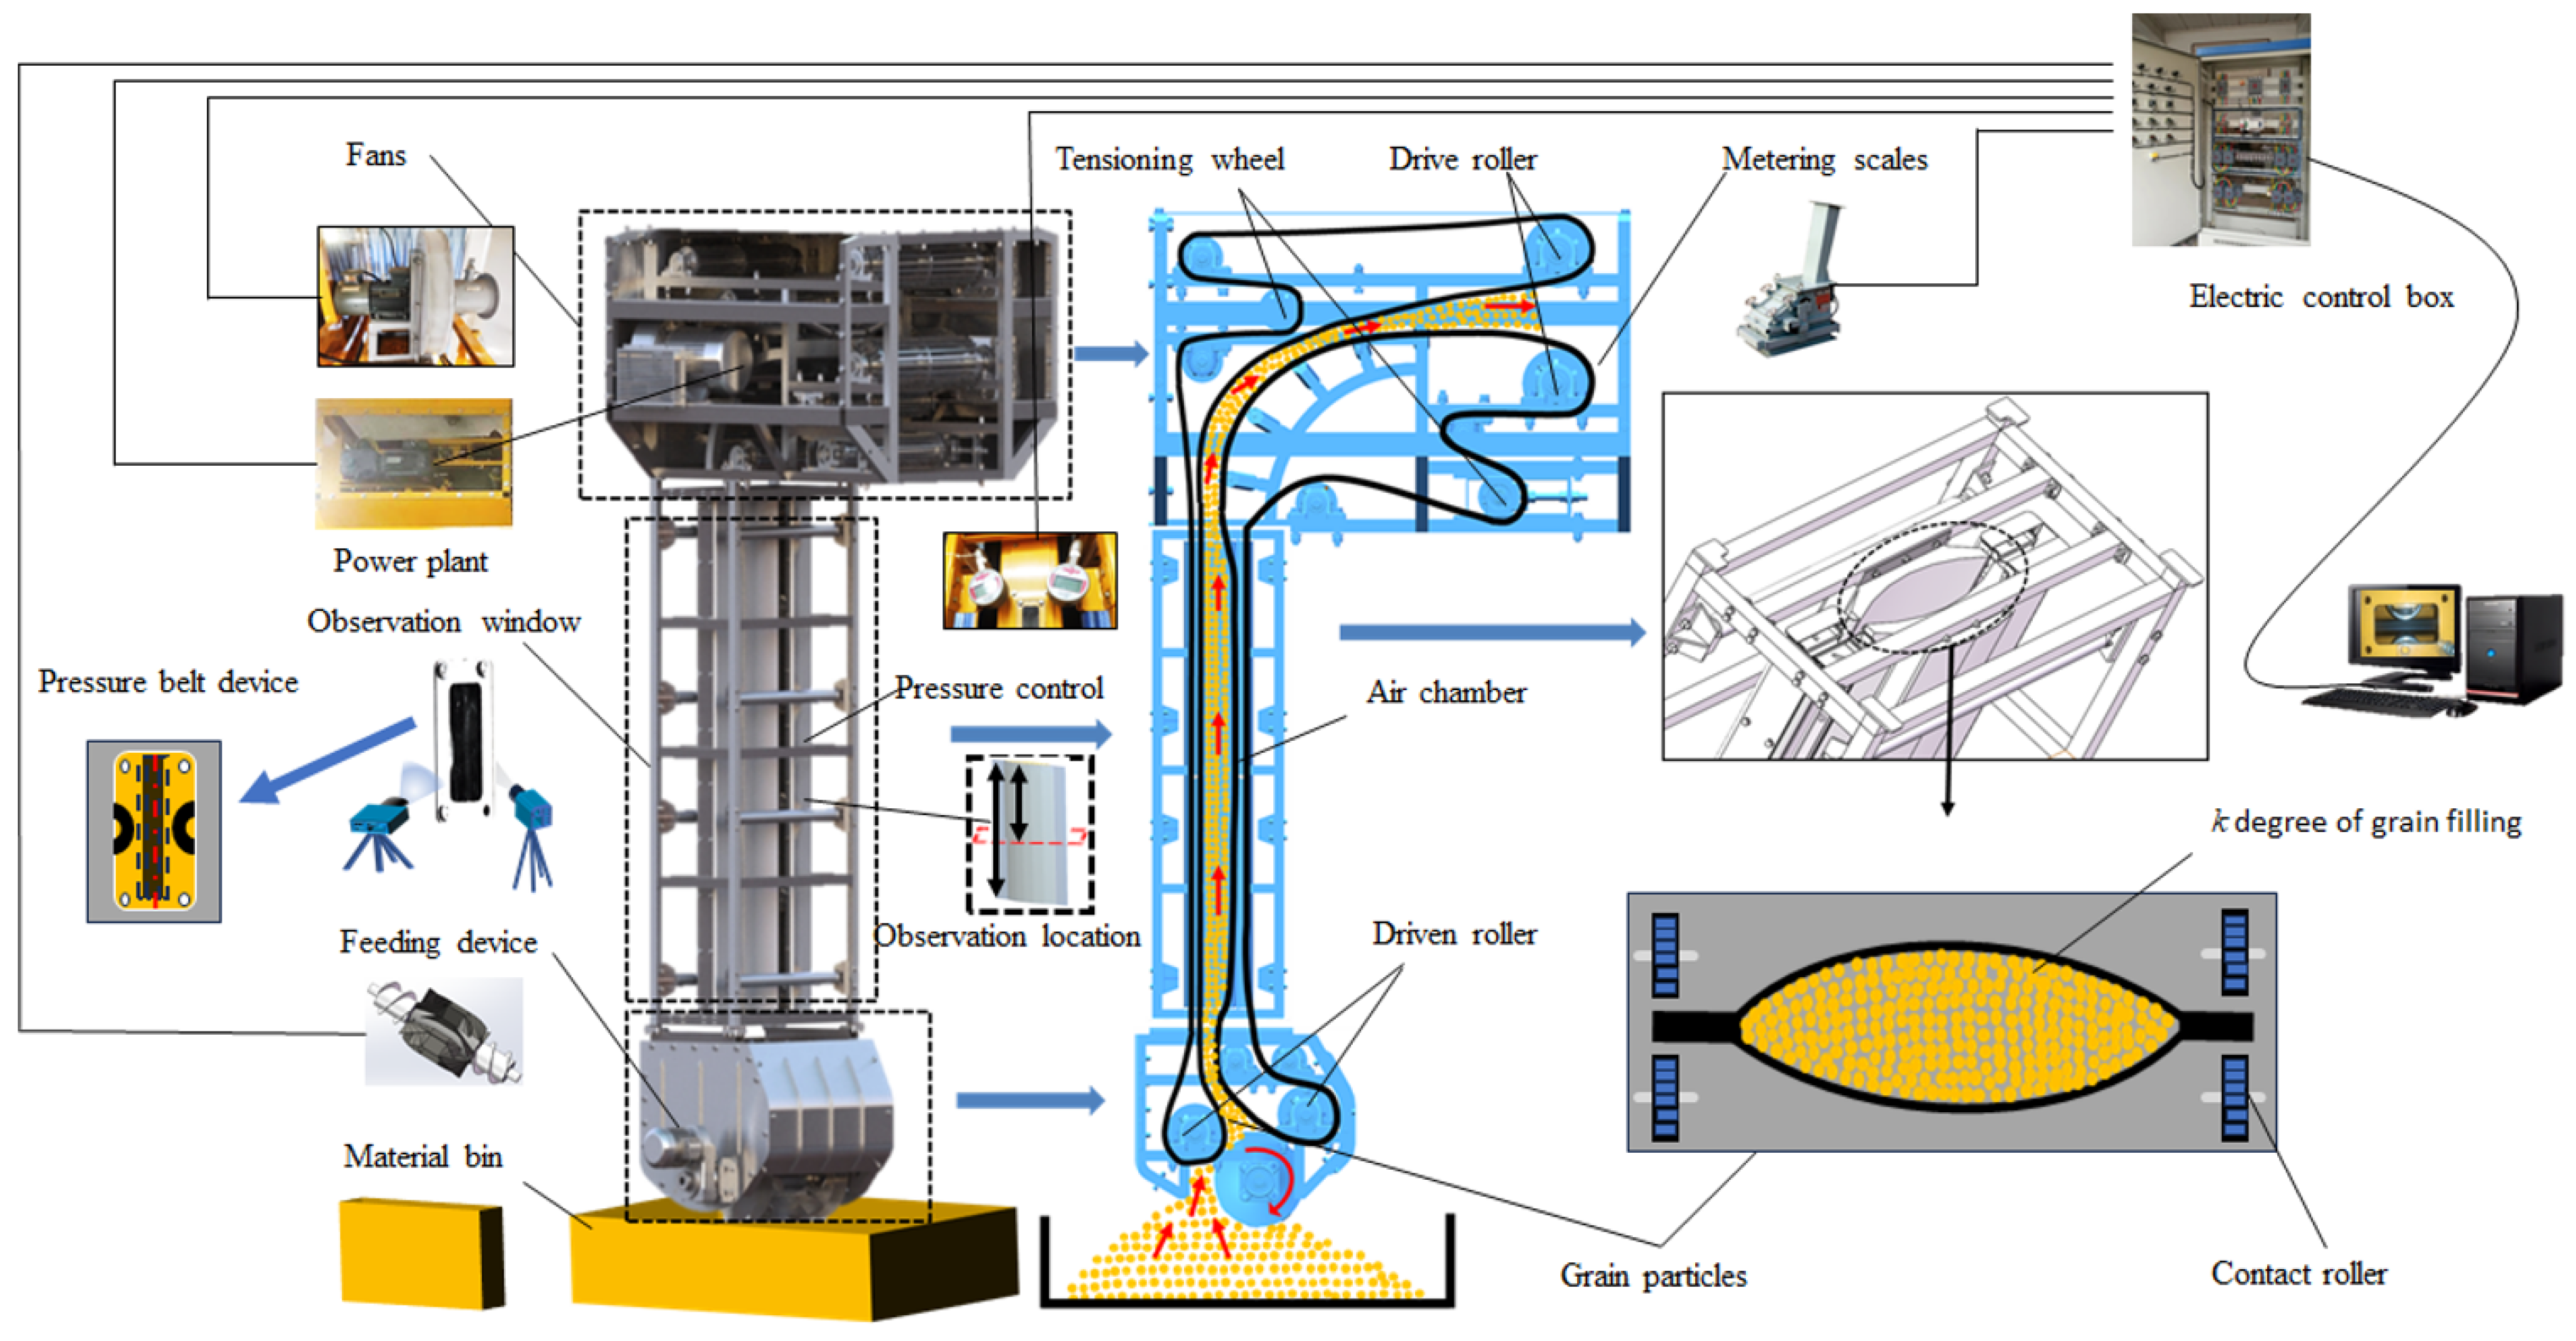
4.1. Experiment Devices
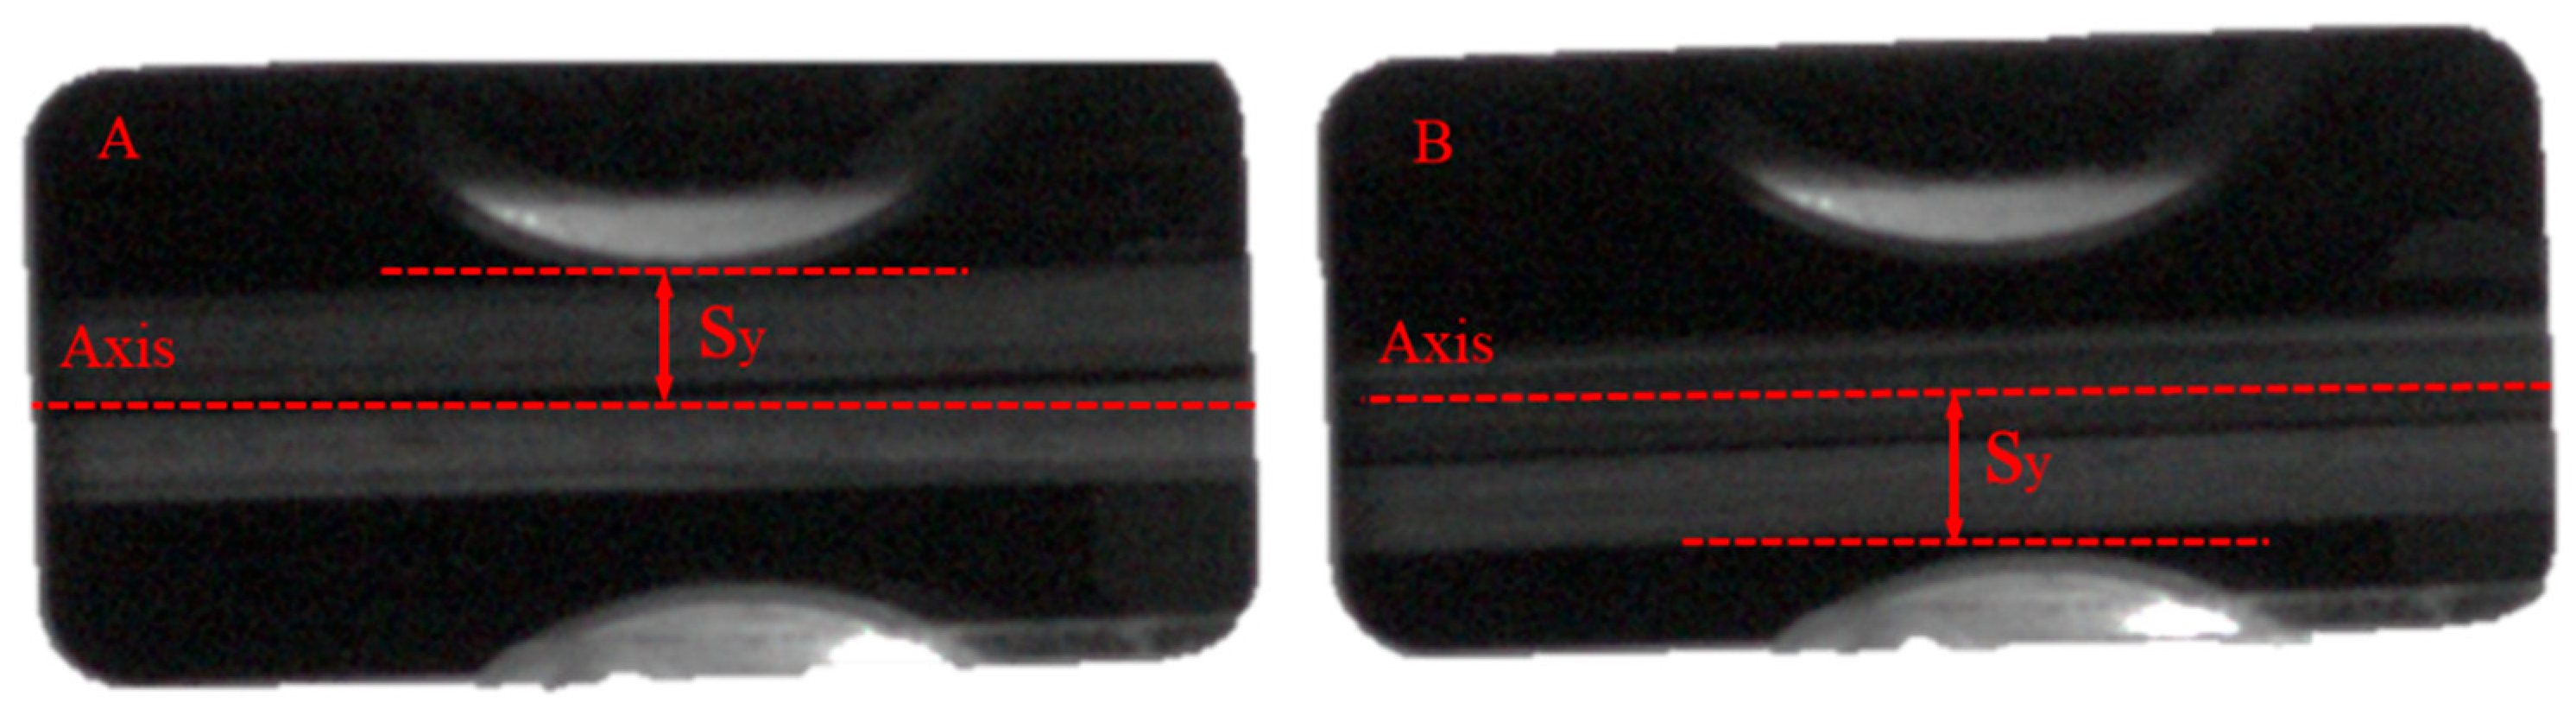
4.2. Experimental Method
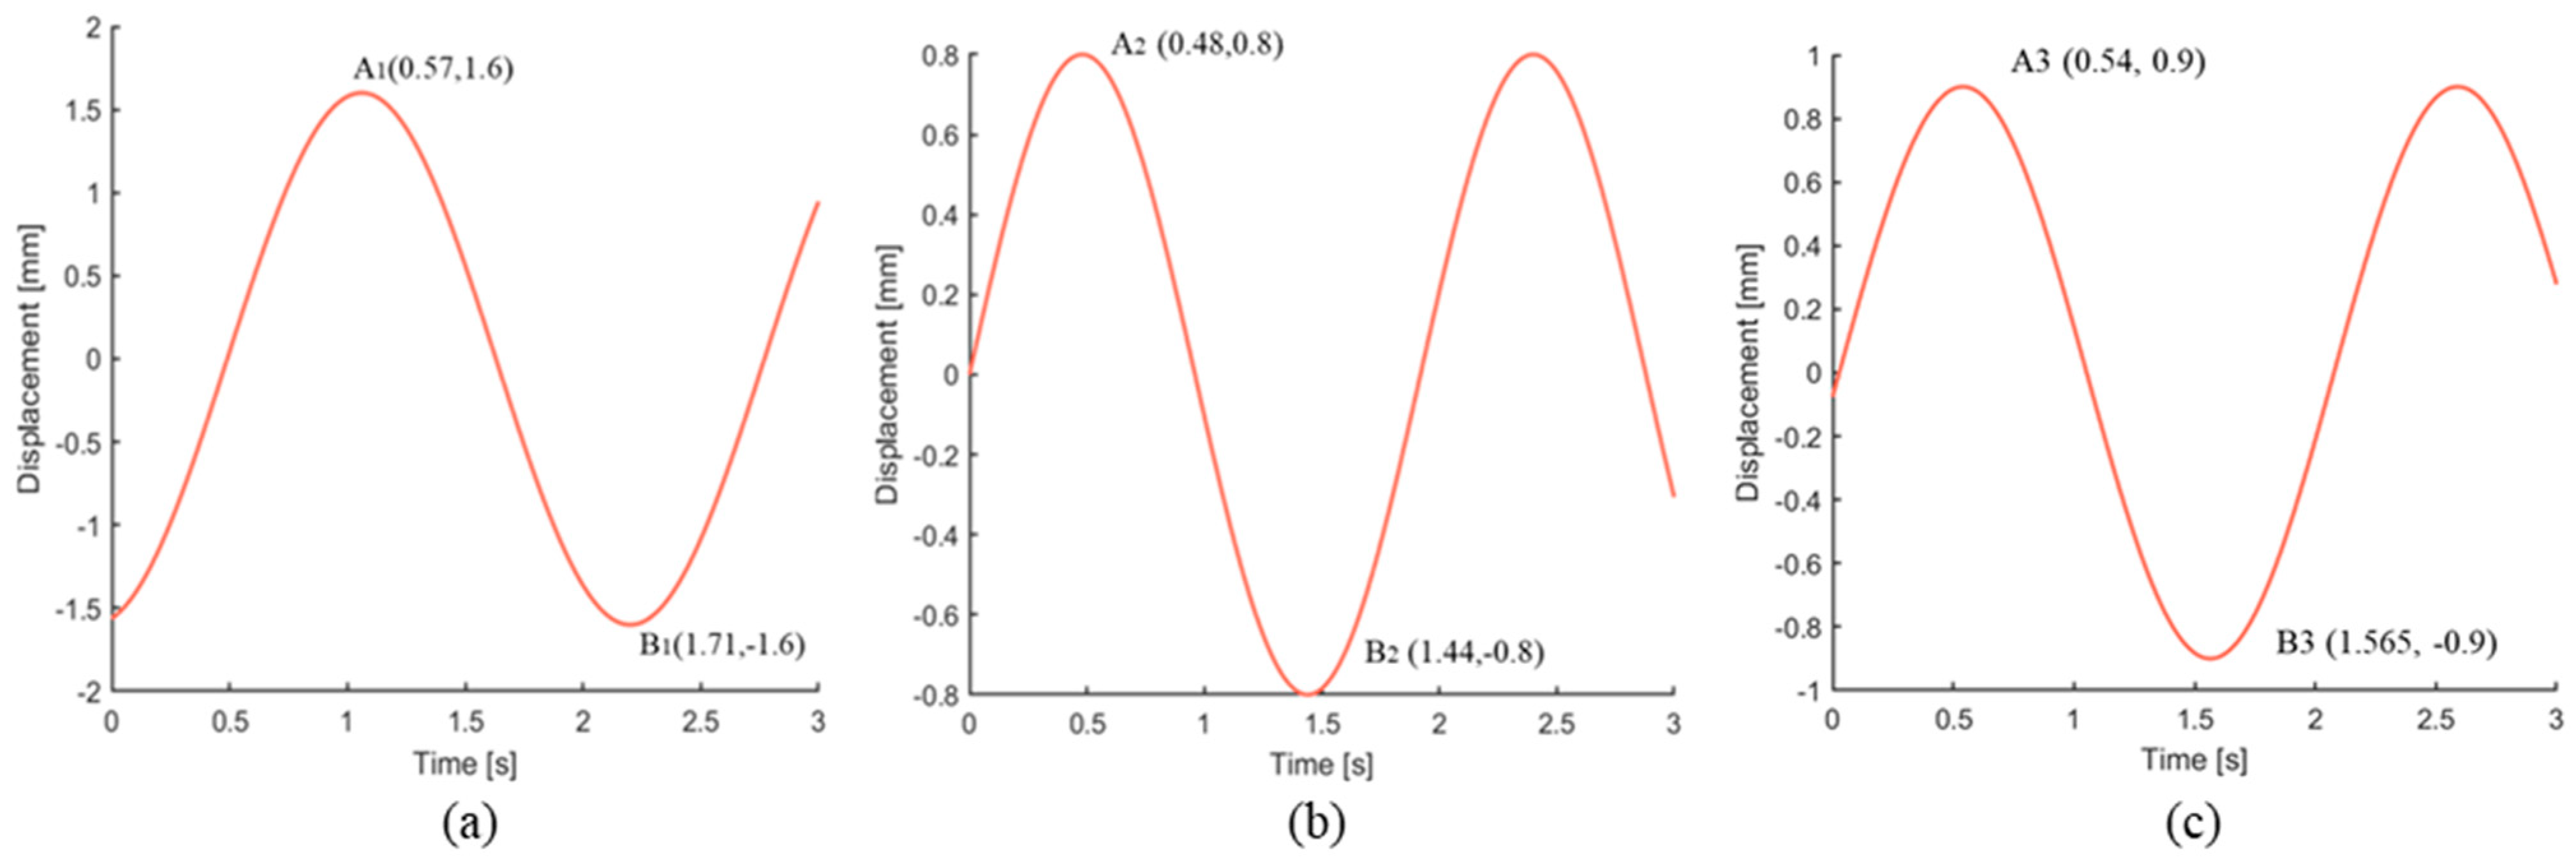
4.3. Results of Experiment
5. Discussion
6. Conclusions
- (1)
- The structure of grain particles in a double-layer belt is simplified into a three-layer composite structure, and the grain material in a vertical lifting belt is laminated based on the theory of layer rationality. The nonlinear vibration differential equation of the vertical lifting section of a grain-carrying ship unloader is established by means of elastoplastic mechanics. The vibration differential equation is solved by perturbation theory and Galerkin discrete analysis.
- (2)
- The vibration response curve and natural frequency of the vertical lifting section of the bulk grain conveyor are obtained by numerical solution, and the proportion of grain in the cross section of the vertical lifting section is analyzed, that is, the effect of grain filling degree k on the vibration response and the natural frequency of the structure.
- (3)
- The experimental platform was built, and the rationality of the theoretical calculated method was verified by the experimental method, which provides a basis and reference for avoiding the occurrence of severe flutter in the conveyance process and improving conveyance efficiency.
Author Contributions
Funding
Institutional Review Board Statement
Informed Consent Statement
Data Availability Statement
Conflicts of Interest
Nomenclature
| E1 | Elastic modulus of the rubber belt [Pa] | x* | Equivalent coordinate in the X direction [-] |
| E2 | Elastic modulus of grain material [Pa] | t* | Equivalent time [s] |
| ρ1 | Density of the rubber belt [Kg/m3] | N(v) | Define a function [-] |
| ρ2 | Density of grain material structure [Kg/m3] | No dimensional parameters [-] | |
| k | Degree of grain filling [-] | M | Mass-array operator [-] |
| ρ | Density of the composite structure [Kg/m3] | G | Gyroscope-array operator [-] |
| c | Axial motion speed of the structure [m/s] | K | Stiffness-array operator [-] |
| L | Span length of the laminated structure [m] | γ | [-] |
| E | Elastic modulus of the composite structure [Pa] | E* | Equivalent elastic modulus of the composite structure [Pa] |
| u | Displacement of X directions [m] | T0, T1 | [-] |
| v | Displacement of Y directions [m] | v0, v1 | Displacement at timeT0, T1 [m] |
| F | Tension force [N] | Φn(x) | The nth-order modal function of the system [-] |
| x | Coordinate in the X direction [-] | An(T1) | The nth-order vibration amplitude of the system [-] |
| t | Time [s] | ωn | The nth natural frequency [-] |
| dx | Infinitesimal element in the X direction [-] | v(x,t) | The solution of vibration equation [-] |
| ΔP | Displacement of point P [m] | qr(t) | Time function [-] |
| ΔN | Displacement of point N [m] | φr(x) | Spatial function [-] |
| ds | Length of the microelement segment after deformation [-] | aa | The complex conjugate of the previous term [-] |
| ε | Strain [-] | r | Ordinal number [-] |
| Stress [Pa] | μ | Poisson’s ratio [-] | |
| F0 | Initial tension force [N] | q1 | First-order vibration response [-] |
| A | Cross-sectional area of the structure [m2] | q2 | Second-order vibration response [-] |
| θ | Deflection angle of along the X-axis [-] | Sy | Deviate-center point displacement [m] |
| v* | Equivalent displacement of Y directions [m] |
References
- Zhang, R.; Si, X.; Yang, W.; Wang, N. Analysis of resonance reliability for synchronous-belt transmission with transverse vibration. J. Vibroeng. 2014, 16, 891–900. [Google Scholar]
- Ding, X.; Shen, G.; Tang, Y.; Li, X. Axial vibration suppression of wire-ropes and container in double-rope mining hoists with adaptive robust boundary control. Mechatronics 2022, 85, 102817. [Google Scholar] [CrossRef]
- Bortnowski, P.; Gładysiewicz, L.; Król, R.; Ozdoba, M. Models of Transverse Vibration in Conveyor Belt—Investigation and Analysis. Energies 2021, 14, 4153. [Google Scholar] [CrossRef]
- Bortnowski, P.; Kawalec, W.; Król, R.; Ozdoba, M. Identification of conveyor belt tension with the use of its transverse vibration frequencies. Measurement 2022, 190, 110706. [Google Scholar] [CrossRef]
- Dowell, E.H. Nonlinear flutter of curved plates. AIAA J. 1969, 7, 424–431. [Google Scholar] [CrossRef]
- Bilasse, M.; Azrar, L.; Daya, E.M. Complex modes based numerical analysis of viscoelastic sandwich plates vibrations. Comput. Struct. 2011, 89, 539–555. [Google Scholar] [CrossRef]
- Amabili, M. Nonlinear vibrations of viscoelastic rectangular plates. J. Sound Vib. 2016, 362, 142–156. [Google Scholar] [CrossRef]
- Li, H.; Li, Z.; Safaei, B.; Rong, W.; Wang, W.; Qin, Z.; Xiong, J. Nonlinear vibration analysis of fiber metal laminated plates with multiple viscoelastic layers. Thin-Walled Struct. 2021, 168, 108297. [Google Scholar] [CrossRef]
- Ragb, O.; Matbuly, M.S. Nonlinear vibration analysis of elastically supported multi-layer composite plates using efficient quadrature techniques. Int. J. Comput. Methods Eng. Sci. Mech. 2022, 23, 129–146. [Google Scholar] [CrossRef]
- Bert, C.W. Classical lamination theory. In Manual on Experimental Methods for Mechanical Testing of Composites; Springer: Dordrecht, The Netherlands, 1989; pp. 11–16. [Google Scholar]
- Maji, A.; Mahato, P.K. Development and applications of shear deformation theories for laminated composite plates: An overview. J. Thermoplast. Compos. Mater. 2022, 35, 2576–2619. [Google Scholar] [CrossRef]
- Li, D. Layerwise theories of laminated composite structures and their applications: A review. Arch. Comput. Methods Eng. 2021, 28, 577–600. [Google Scholar] [CrossRef]
- Tho, N.C.; Cong, P.H.; Zenkour, A.M.; Doan, D.H.; van Minh, P. Finite element modeling of the bending and vibration behavior of three-layer composite plates with a crack in the core layer. Compos. Struct. 2023, 305, 116529. [Google Scholar]
- van Hai, N.T.; Hong, N.T. Novel finite element modeling for free vibration and buckling analysis of non-uniform thickness 2D-FG sandwich porous plates using refined Quasi 3D theory. Mech. Based Des. Struct. Mach. 2023, 51, 1–27. [Google Scholar] [CrossRef]
- Sayyad, A.S.; Ghugal, Y.M. On the free vibration analysis of laminated composite and sandwich plates: A review of recent literature with some numerical results. Compos. Struct. 2015, 129, 177–201. [Google Scholar] [CrossRef]
- Hedrih, K. Transversal vibrations of the axially moving sandwich belts. Arch. Appl. Mech. 2007, 77, 523–539. [Google Scholar] [CrossRef]
- Hedrih, K. Transversal forced vibrations of an axially moving sandwich belt system. Arch. Appl. Mech. 2008, 78, 725–735. [Google Scholar] [CrossRef]
- Di Rocco, H.O.; Aguiar, J.C. Some applications of perturbation theory in atomic physics. Eur. J. Phys. 2021, 42, 065403. [Google Scholar] [CrossRef]
- Fernández, F.M. Perturbation theory by the moment method and point-group symmetry. J. Math. Chem. 2015, 53, 998–1009. [Google Scholar] [CrossRef]
- Wang, Q.; Wang, Z.; Fan, B. Coupled bending and torsional vibration characteristics analysis of inhomogeneous wind turbine tower with variable cross section under elastic constraint. Appl. Math. Model. 2021, 93, 188–205. [Google Scholar] [CrossRef]
- Salas, A.H.S. The Galerkin Method for Solving Strongly Nonlinear Oscillators. Sci. World J. 2022, 2022, 8141227. [Google Scholar] [CrossRef] [PubMed]
- Wang, J.; Wu, R. The extended Galerkin method for approximate solutions of nonlinear vibration equations. Appl. Sci. 2022, 12, 2979. [Google Scholar] [CrossRef]
- Hongyuan, Z.; Shulin, W.; Chunshan, L.; Jiehan, L.; Zhenxu, W.; Siyu, C.; Hongyi, L. Grain mechanical properties experimental study. J. Agric. Mech. Res. 2024, 46–2, 193–197. [Google Scholar]
- Xu, Z. Elasticity, 4th ed.; Higher Education Press: Beijing, China, 2008; p. 289. [Google Scholar]


| Materials | Young’s Modulus (MPa) | Bulk Density (103 Kg/m3) | Area of the Structure’s Cross Section (m2) | Height of Lifting Section h (m) | Degree of the Grain Filling (-) |
|---|---|---|---|---|---|
| Rubber bands | 6 | 1.1 | 0.1 | 2.5 | 0.1~0.9 |
| Soybean | 100 | 0.78 | 0.1 | 2.5 | 0.1~0.9 |
| Wheat | 110 | 0.65 | 0.1 | 2.5 | 0.1~0.9 |
| Corn | 90 | 0.75 | 0.1 | 2.5 | 0.1~0.9 |
| k | 0.1 | 0.2 | 0.3 | 0.4 | 0.5 | 0.6 | 0.7 | 0.8 | 0.9 |
|---|---|---|---|---|---|---|---|---|---|
| γ | 21.06 | 31.62 | 32.37 | 37.15 | 41.88 | 45.98 | 50.22 | 54.04 | 58.59 |
| E* | 576.8 | 957.5 | 1362.5 | 1794.2 | 2280.8 | 2748.9 | 3278.5 | 3848.3 | 4463.1 |
| k | 0.1 | 0.2 | 0.3 | 0.4 | 0.5 | 0.6 | 0.7 | 0.8 | 0.9 |
|---|---|---|---|---|---|---|---|---|---|
| γ | 21.87 | 28.57 | 37.22 | 45.49 | 51.49 | 57.41 | 63.36 | 69.43 | 75.71 |
| E* | 621.8 | 1061 | 1385 | 2069 | 2651 | 3296 | 4015 | 4821 | 5732 |
| k | 0.1 | 0.2 | 0.3 | 0.4 | 0.5 | 0.6 | 0.7 | 0.8 | 0.9 |
|---|---|---|---|---|---|---|---|---|---|
| γ | 20.39 | 26.48 | 31.62 | 35.62 | 39.95 | 44.15 | 48.29 | 52.40 | 56.55 |
| E* | 540.8 | 889.7 | 1254 | 1650 | 2076.6 | 2534.8 | 3031.5 | 3570.7 | 4157.9 |
| Laminated Plate Model | Degree of Soybean Filling (k) | ||
|---|---|---|---|
| 0.1 | 0.2 | 0.3 | |
| Equivalent calculated values (Hz) | 0.2823 | 0.3283 | 0.2810 |
| Calculated values (Hz) | 0.5646 | 0.6566 | 0.5620 |
| Experimental values (Hz) | 0.4386 | 0.5208 | 0.4880 |
| Error (-) | 22.3% | 20.7% | 13.2% |
Disclaimer/Publisher’s Note: The statements, opinions and data contained in all publications are solely those of the individual author(s) and contributor(s) and not of MDPI and/or the editor(s). MDPI and/or the editor(s) disclaim responsibility for any injury to people or property resulting from any ideas, methods, instructions or products referred to in the content. |
© 2023 by the authors. Licensee MDPI, Basel, Switzerland. This article is an open access article distributed under the terms and conditions of the Creative Commons Attribution (CC BY) license (https://creativecommons.org/licenses/by/4.0/).
Share and Cite
Yan, L.; Li, Y.; Cheng, M.; Wang, M.; Liu, P. Study on Nonlinear Vibration of Vertical Lifting Section of Bulk Grain Entrainment Ship Unloader. Appl. Sci. 2023, 13, 11213. https://doi.org/10.3390/app132011213
Yan L, Li Y, Cheng M, Wang M, Liu P. Study on Nonlinear Vibration of Vertical Lifting Section of Bulk Grain Entrainment Ship Unloader. Applied Sciences. 2023; 13(20):11213. https://doi.org/10.3390/app132011213
Chicago/Turabian StyleYan, Li, Yongxiang Li, Min Cheng, Mingxu Wang, and Peng Liu. 2023. "Study on Nonlinear Vibration of Vertical Lifting Section of Bulk Grain Entrainment Ship Unloader" Applied Sciences 13, no. 20: 11213. https://doi.org/10.3390/app132011213
APA StyleYan, L., Li, Y., Cheng, M., Wang, M., & Liu, P. (2023). Study on Nonlinear Vibration of Vertical Lifting Section of Bulk Grain Entrainment Ship Unloader. Applied Sciences, 13(20), 11213. https://doi.org/10.3390/app132011213