Article

A Modeling of Human Reliability Analysis on Dam Failure Caused by Extreme Weather

1
School of Water Resources and Hydropower Engineering, Wuhan University, Wuhan 430072, China
2
Dam Safety Management Department, Nanjing Hydraulic Research Institute, Nanjing 210029, China
3
College of Water Conservancy and Hydropower Engineering, Hohai University, Nanjing 210098, China
*
Author to whom correspondence should be addressed.
Appl. Sci. 2023, 13(23), 12968; https://doi.org/10.3390/app132312968
Submission received: 7 November 2023 / Revised: 28 November 2023 / Accepted: 1 December 2023 / Published: 4 December 2023
(This article belongs to the Special Issue Structural Health Monitoring for Concrete Dam)

Abstract

:

Featured Application

The results of the paper can help to conduct a more scientific dam risk analysis, identify human errors in dam collapse accidents, and improve risk management in a targeted manner.

Abstract

Human factors are introduced into the dam risk analysis method to improve the existing dam risk management theory. This study constructs the path of human factor failure in dam collapse, explores the failure pattern of each node, and obtains the performance shaping factors (PSFs) therein. The resulting model was combined with a Bayesian network, and sensitivity analysis was performed using entropy reduction. The study obtained a human factor failure pathway consisting of four components: monitoring and awareness, state diagnosis, plan formulation and operation execution. Additionally, a PSFs set contains five factors: operator, technology, organization, environment, and task. Operator factors in a BN (Bayesian network) are the most sensitive, while the deeper causes are failures in organizational and managerial factors. The results show that the model can depict the relationship between the factors, explicitly measure the failure probability quantitatively, and identify the causes of high impact for risk control. Governments should improve the significance of the human factor in the dam project, constantly strengthen the safety culture of the organization’s communications, and enhance the psychological quality and professional skills of management personnel through training. This study provides valuable guidelines for the human reliability analysis on dam failure, which has implications for the theoretical research and engineering practice of reservoir dam safety and management.

1. Introduction

Dams are essential water infrastructures in ensuring regional socio-economic and ecological security and promoting sustainable development. By the end of 2020, China had 98,566 existing reservoirs with a total capacity of 930.6 billion m3, including 774 large reservoirs, 4098 medium reservoirs and 93,694 small reservoirs (categorization is defined by the reservoir capacity). Reservoir dams produce multiple benefits, such as flood control, irrigation, power generation, navigation, and environmental protection. However, dam collapse seriously threatens human lives and property downstream and causes adverse socio-economic impacts.
China has seen a significant decrease in the number of dam failures since the turn of the century [1]. According to the historical dam-break database of the Nanjing Hydraulic Research Institute, from 1954 to 1990 a total of 3260 reservoirs failed, with an annual average of about 88. Comparatively, from 1990 to 2000, 227 dams failed, giving an annual average of about 23. From 2000 to 2014, only 72 reservoirs failed, averaging 4.8 dams per year, and the annual average rate of dam failure was only 0.5 × 10⁻⁴. This is mainly associated with the improvement of construction and management levels and the continuous enhancement of relevant laws and regulations. Hundreds of dam failures have occurred throughout U.S. history, causing thousands of people to be killed and enormous property and environmental damage. Data records of ASDSO (The Association of State Dam Safety Officials) shows that from January 2005 through June 2013, US state dam safety programs reported 173 dam failures and 587 “incidents” that without intervention would have become accidents.
The ASDSO believes the most likely causes of dam failure are overflow, foundation defects, cracking, inadequate maintenance and upkeep, and piping. The Chinese Ministry of Water Resources has categorized the causes of dam failures into five major groups and 16 sub-groups, i.e., height of the dam, quality problems, mismanagement, other and unknown causes. Many scholars at home and abroad have already divided the causes of dam failure into three categories: natural factors, engineering factors, and anthropogenic factors, while human factors include mismanagement, man-made destruction, and so on. In fact, dam failures caused by natural and engineering factors are also highly related to human-caused errors, such as quality problems in construction, poor decision-making by managers during the overtopping process, and ineffective rescue efforts.
Advances in science and technology have led to continuous improvement in the management of dam construction, with a decreasing proportion of failure accidents during the construction period and an increasing proportion during the operational period. At the same time, as most of China’s reservoirs were built in the 1950s to 1970s and are now approaching their 50-year service life, they need further assessment and maintenance [2]. In 2017, the American Society of Civil Engineers report emphasized the importance of public safety and maintenance, with measures to reduce the risk of dam failures encompassing ‘better planning for mitigating the effects; increased regulatory oversight; improving coordination and communication across governing agencies; and the development of tools, training, and technology’.
With the development of urbanization, the downstream of reservoirs is densely populated, making the dam safety closely related to public safety. Emphasizing the security of the utility system and reducing risks through reservoir dams are garnering consensus among decision-makers, practitioners, and researchers worldwide [3]. The Ministry of Water Resources [4] put forward the defense objectives of ‘no casualties, no dam collapse, no breakage of important dykes, and no impact on major infrastructure’. Climate change has had significant adverse impacts on reservoir engineering since the turn of the new century [5]. The frequent occurrence of extreme weather, such as heavy rainfall and floods, has directly led to the need for further accounting and updating of the engineering-designed flood series of many reservoirs, increasing their uncertainty. As a result, the risk of designing and operating watershed development and utilization projects, flood control and drought relief projects obtained from existing engineering hydrological calculation methods has increased. The significance of safety management measures such as operational monitoring and emergency plans has been enhanced.
The concept of risk is closely related to the method of calculating probability. The development of risk analysis techniques first originated in the United States, was used in the military industry, and then constantly researched and applied in various fields. The concept of dam risk has been introduced since the failure of the Teton Dam and Taccoa Fans Dam in the USA in 1976. In the early 1980s, the United States published a series of principles and methods for analyzing the risk of dams, primarily including the Relative Risk Index (RRI) put forward by the US Army Corps of Engineers (USACE) and the Field Scoring method put forward by the US Bureau of Reclamation (USBR) [6]. Dam risk analysis techniques have evolved since then. In the 1990s, Canada, the United States, Australia, and other countries established a dam safety evaluation method based on risk analysis techniques, formulated a series of regulations and guidelines on risk evaluation, and formed a basic framework for risk management. Presently, risk management is entering a practical phase in countries like Canada and Australia. BC Hydro’s dam risk analysis [7] begins with a dam safety review process that includes design calculations, design criteria, construction records, dam operating conditions, dam operation and maintenance practices. Its main task is to evaluate the results of the risk analysis against risk criteria, considering factors such as the owner’s dam safety regulations, the value of life and property of downstream residents, national laws, and the owner’s ability to compensate. Australia, for its part, has developed a series of guidelines identifying steps in the process of risk categorization, risk analysis, risk assessment and risk treatment, and has applied the analysis methodology to several dams.
China began research on dam risk assessment and management at the beginning of the 21st century and has achieved a series of results. A study of dam failure mechanism and dam failure path [8] revealed the dam failure recording mechanism and failure process of earth-rock dams through field failure tests and laboratory tests. Ref. [9] proposed a fuzzy closeness-based dam failure pattern recognition method and a dam failure path mining a hierarchical analysis method. In the failure probability calculation, [10] established the performance functions of the dam structure and foundation and proposed a model for calculating the failure probability of a gravity dam structural system using Bayesian networks with integral Monte Carlo simulation. Ref. [11] investigated the overall damage mechanism of arch dams and the corresponding analysis criterion and proposed an orthotropic anisotropic damage principal model for dam concrete and its numerical simulation method. For the consequences of dam failure, [12] proposed a method for evaluating the service state of dams considering the socio-economic benefits, dam safety, environment and ecology, establishing a comprehensive evaluation model. Ref. [13] proposed a Bayesian Network-based human risk analysis model for estimating the loss of life due to flooding from dam failure.
Dam risk analysis has experienced a shift from deterministic to probabilistic, and from the engineering safety concept to the engineering risk concept. Many scholars have realized the need for reservoir risk management as a dynamic management of the whole life process. However, existing dam risk analyses lack specific consideration of human factors. In fact, many dam failures could have been avoided, but people failed to intervene in advance or to mitigate the damage. In 2016, the annual U.S. Dam Safety Conference suggested that “all dam failures and accidents can be attributed to human causes” [14].
Human factors, or human-related factors, are defined by the International Electrotechnical Commission (IEC) as “human capabilities, limitations, and a variety of other human characteristics that can affect the performance of the overall system and are relevant to the design, operation, and maintenance of the system and/or its components” [15]. Human Reliability Analysis (HRA) is an emerging discipline that evaluates and analyses the reliability of human factors, with predictive analysis and reduction in the human error probability as its core of research, based on behavioral cognitive science and information processing technology [16], which is mainly used in the fields of nuclear power plants [17,18,19], navigation [20,21], and aeronautics [22]. In the field of dam safety analysis, Jinbao Sheng [23] analyzed dam failure accidents in the reinforcement projects of sick reservoirs and found that they were mainly caused by various human factors during construction and management, and he proposed that the mechanism by which human error causes dam failure is the difficulty in the analysis of today’s dam failure accidents. Dandan Li et al. [24] suggested introducing human factor reliability theory into dam risk analysis and proposed the analysis method and the root cause of human error in dam failure accidents. Meanwhile, they proposed a Bayesian Network-based dam failure model, which is divided into four parts: management, individual, institution, and environment, and the hierarchical analysis method is applied to determine the weights of each indicator.
This paper is structured as follows. Section 2 constructs the HRA framework applicable to human factors analyses of dams. Section 3 introduces performance shaping factors (PSFs) hierarchy and composition of dams. Section 4 conducts a case study for extreme weather, constructs a fault tree and Bayesian network for the event, and validates the model. Section 5 gives the main conclusions of this paper.

2. HRA Analysis Framework Construction

To explore the human influence factors in dam failure accidents scientifically and effectively, it is necessary to determine the research methodology and process first. Swain [22,25] proposed a four-part procedure for calculating the probability of human-caused error using THERP (Technique for human error-rate prediction) which includes familiarity, qualitative analysis, quantitative analysis, and incorporation. Marcelo Ramos Martins [26] builds on this by comparing the THERP method with the BBN (modeling the human factor) technique and combines it with Bayesian networks to propose the steps when applying BNN for HRA analysis. Based on these studies, it can be borrowed and used in this study to propose a more applicable HRA analysis path for dams, as shown in Figure 1.
As shown in Figure 1, the proposed HRA analysis framework also consists of four parts, mainly improved for integration with Bayesian networks and for the reservoir dam industry. The first stage is mainly to gather relevant information. Firstly, historical dam failure information is collected to construct a human-caused failure database. The acquisition of anthropogenic data is the basis of human failure research, which generally comes from accident analysis reports, simulator test data, expert judgment data, etc. [27]. In other areas, national and foreign researchers have designed and established databases with their own distinctive features. In the nuclear power field, there is the CORE-DATA human factors database based on actual operational data in the UK, the NUCLARR human factors database in the US, which mainly collects data on the probability of hardware failure and expert judgment, and human factors databases in China, mainly in the form of data reports [28]. Ref. [29] collected and established a human factors database for Chinese power systems. Ref. [30] collects and studies submarine evacuation data for maritime data and proposes a method for calculating relative human error probabilities. Human factors databases in various fields are often confidential, and since human errors in dam engineering do not only come from front-line managers and operators but can also from regulatory and policymakers, with significantly different impacts than in systems such as the nuclear industry, data from other fields are only available for reference and not for direct use. That is why it is particularly significant to construct a dam failure database in the field of dams based on historical collapse events.
The second stage, the qualitative analysis of human-caused errors, focused on task analysis, PSF studies, and Bayesian network construction, extracting influencing factors from the historical dam failure man-made database, creating a human-failure-influencing factor set, analyzing human errors along the failure pathway, and deriving PSFs from them. The specific PSFs are used as BN nodes to explore the causal relationships among them and construct a directed acyclic graph (DAG) of the Bayesian network.
The third stage is a quantitative analysis of the human error. Starting from Bayesian network causality, expert judgment and historical dam breach data were used to consider the interdependencies between the nodes, to populate the Conditional Probability Tables (CPT). The probability of failure is calculated based on Bayesian inference, and human intervention actions can be considered.
The final stage is incorporation, where the obtained model is analyzed and the results are applied. In this step, the model needs to be validated through sensitivity analysis and expert judgement. After confirming the reliability of the model, the results were validated and the main human factors with high sensitivity were obtained to provide advice on dam management.

3. PSFs Analysis

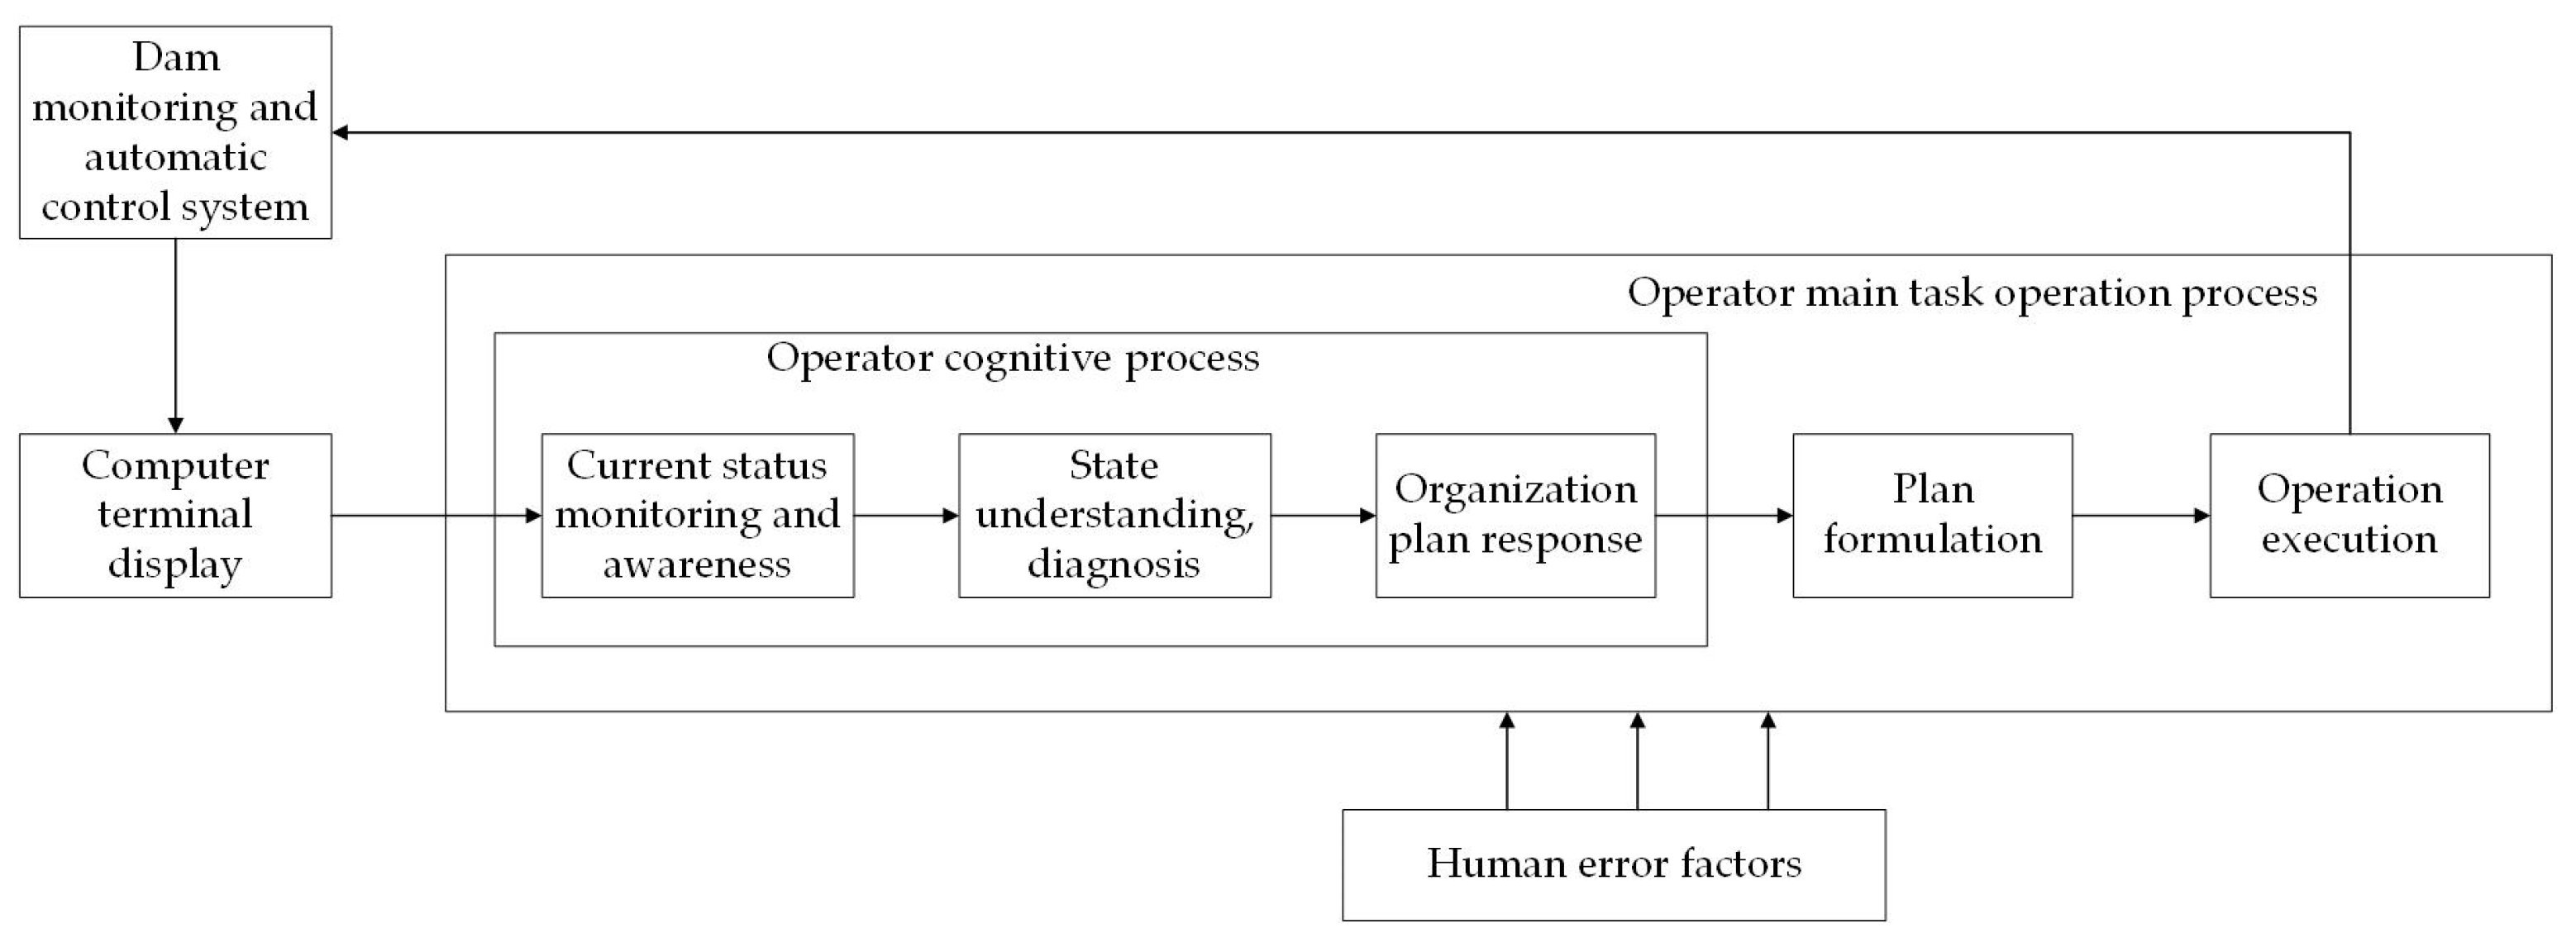
3.1. The Basic Path of Human Error in Dam Failure

The basic path of human error in dam failure accidents is the failure path that human behavior patterns will always follow under different causes and for various dam types. Judgments can be made in relation to human information processing paths, which can be divided into two categories: explicit failure paths and implicit ones. In the management of reservoirs, the basic path of explicit failures is caused by manifest failures, mainly the process of unsafe operator behaviors that increase unreliability. Implicit errors, on the other hand, stem from organizational management deficiencies that act on the system’s deeper defenses and increase the chances of human error. The discussion in this paper focuses on explicit failure pathways.
The process of human influence on dam safety is realized through the manipulation of the human–machine interface. It has been suggested that the manipulator undertakes two main tasks during digitization [31]: type I and type II tasks. Type I tasks, namely, primary tasks, are those performed to fulfill the objectives of the mandate. Type II tasks are interface management tasks, which are tasks that are performed concurrently to fulfill Type I tasks, such as computer interface management, information seeking, and processing. Combining the analysis of human error in other fields with dam safety and referring to the relevant rules and regulations for dam management, the basic path of human error in the dam failure process is constructed, which mainly consists of four parts, including monitoring and awareness, state diagnosis, plan formulation and operation execution, as shown in Figure 2.
  • Monitoring and awareness;
Monitoring and awareness is the process by which reservoir managers obtain information from the situational environment. Abnormal conditions of the reservoir are mainly detected during daily inspections, or abnormal parameters are detected through monitoring equipment, alarms, and other display devices. Monitoring means that the operator checks the various parameters on the computer screen, and in some cases where there is a lack of digital displays, it refers to the checking of the reservoir’s appearance, measuring instruments and so on, by the managers. Awareness is when an operator discovers in a timely manner that some data in a computer/measuring instrument are abnormal, or that there are warning signs of distress in a reservoir. Monitoring and awareness is the most frequent and important task of the operator.
Therefore, the main human error factors influencing this phase are the human cognitive functioning aspects and psychological factors, which mainly include:
Individual factors: Physiological factors such as level of vision, color weakness, color blindness, fatigue, level of health; psychological factors such as mental state, concentration, emotions; qualitative factors such as level of skill, experience, level of training, sense of responsibility.
Among them, the operator’s physiological factors will affect the sensitivity of its perception of information. For example, operators with color weakness and blindness have more difficulty in receiving emergency information, and people in a state of fatigue are inattentive, and so on. Psychological factors such as poor emotional and bad psychological states can distract attention, resulting in cognitive decline and inability to recognize erroneous information in a timely manner. The operator’s lack of skill and experience can lead to the creation of an unreliable mental model that reduces human reliability while ignoring many possible signs of malpractice.
Technical factors: Display equipment characteristics of the human–machine system display interface; alarm systems; advanced technologies such as water and rainfall measurement, safety monitoring facilities, dam hazard detection technology, and penetrating sensing technology.
The user-friendliness, screen size, information distribution, information quantity, and information density of the human–machine system all affect the ease with which a person can access information. If the screen is small and the amount of information is too much or too dense, it will greatly consume attention resources and reduce performance. The presence or absence of an alarm system and the prominence of the alarm system can also have an impact on human surveillance awareness. Reservoir dam water and rainfall measurement, safety monitoring facilities, potential hazards detection, and penetrating sensing technology can detect and provide early warning of irregularities promptly, and their degree of perfection will also affect the management personnel. On the other hand, if people depend excessively on advanced technology and neglect the development of managers’ own skills, the probability of error will increase when advanced means are unavailable or incorrectly displayed.
For extreme weather, a good weather prediction and warning system is very crucial. If heavy rainfall can be predicted, gates can be opened and released, and emergency response can be carried out, the probability of a dam failure will be greatly reduced.
Organizational factors: Communication and co-operation of the organization, management system, distribution of tasks.
Communication and cooperation within the organization and the management system can affect the operator’s mood and attention level. At the same time, a good safety culture improves their responsibility and technical knowledge. The organization’s rationality in assigning tasks affects the operator’s mental stress, attention, etc.
Environmental factors: Physical factors like light and sound in the situational environment, social factors like social propaganda.
The color and intensity of light in the control room, the level of illumination and the presence or absence of noise all affect the ease with which human beings can receive information, and inappropriate environments may reduce human attention. Factors such as social promotion may increase managers’ acceptance of their work and thus their accountability.
In extreme weather, poor climatic conditions can make it more difficult for operators to access information, leading to an increased probability of errors.
The factors affecting monitoring and awareness phase reliability are shown in Figure 3.
  • State diagnosis;
During normal operation of the system, the operator evaluates the acceptability of each status obtained from monitoring based on protocols, skill level, personal experience, etc. In the event of an abnormality, the operator uses his working memory to analyze and diagnose the possible reasons, for example, to determine the cause and location of the fault after a problem with an instrument parameter, which serves as a basis for the subsequent plan formulation and execution. This is the state diagnosis phase.
In this phase, the operator acquires real-time information about the dam and inputs the message into his mind to form his own state-specific understanding of reality, known as the Operator System State Model (OSM). When an operator performs actions, it is a process of constantly comparing and matching the state model formed every moment with the prejudgment of the intrinsic representation of the system, that is, the mental model, formed internally by his or her long-term operating experience. In complex task scenarios, operators are unable to build state models that match reality and often use mental models to facilitate judgment, leading to an increased probability of human error.
In the state diagnostic phase, the more important influencing factors are mainly human quality aspects, which mainly include:
Individual factors: Psychological factors such as tension; qualitative factors such as skill level and experience.
In complex scenarios where accidents occur, time pressure is high, cognitive load increases, situational awareness decreases, and the psychological quality of managers affects the time required and diagnostic results. The level of knowledge and technical experience possessed by the operator form the basis of his or her mental model and the basis on which the diagnosis is made.
Technical factors: Information, pictures, and other system-display interface features; intelligent diagnostic technology.
The formation of operator system state models is based on the information received during the monitoring phase, so the completeness and correctness of the information and graphics presented on the screen will also have an impact. The latest intelligent diagnostic technology can also greatly improve the speed and reliability of diagnosis; on the other hand, similarly, advanced science and technology may lead to a reduction in human expertise and become unreliable under unexpected events.
The factors influencing state diagnosis are shown in Figure 4.
  • Plan formulation;
This phase mainly refers to daily work performed under normal system operation by assigning work and planning tasks, as well as implementing operations under abnormal conditions according to the alarm response or emergency plan, which needs to be reformulated according to the actual situation when the existing protocols are not available. The main cognitive activities that the operator needs to perform in this process are:
  • Use one’s own state model to determine goals;
  • Select the appropriate protocol step;
  • Assess whether the behavior in the process will meet the objectives;
  • Adapt the protocols to the actual conditions.
During this course, the operator may generate multiple potential plans which are evaluated, and then select the plan most appropriate to the current state model. The difficulty of plan development required to be completed by the operator varies for different accident scenarios. If there are no existing contingency plans to draw on, it is necessary to mobilize one’s long-term technical knowledge and experience to make analytical decisions. At this point, the stress load is extremely high, the attention resources are difficult to sustain, and the probability of human error increases.
The main human factors influencing this phase are not only human qualities but also organizational factors and task difficulty.
Individual factors: Psychological factors such as tension and stress tolerance; qualitative factors such as level of knowledge and experience.
Under emergencies, which are often time-critical and stressful, stress affects the operator’s safety attitude and increases the rate of operational errors, as well as affecting the level of knowledge and experience, and operators may find it difficult to carry out a rational analysis under high-pressure situations. On the other hand, the operator’s knowledge level, experience, and other quality factors dominate the knowledge-based behavior, and the rich experiential knowledge also stabilizes his stress level and enables him to complete the operation correctly in complex situational environments.
Technical factors: Software facilities, smart decision-making technology; emergency plans.
In the event of an accident, software facilities including alarms and the completeness of emergency protocols will affect the ease with which operator plans can be developed. If there are contingency plans or reliable intelligent decision-making techniques that can be relied upon, rules are in place, operators do not need to make autonomous decisions under pressure, and behaviors are mostly skill-based or rule-based, then the probability of human error is low.
Organizational factors: Factors such as the internal climate of the organization, communication and cooperation, and safety culture.
Organizational training and inter-shift communication and cooperation can make up for the operator’s deficiencies in quality factors and improve the level of human knowledge. Meanwhile, in the rule-based, knowledge-based behavior, there is a need not only to operate based on the existing rules but also perhaps to analyze the state model for plan development, which is more difficult to accomplish by relying on the front-line operators alone, and there is probably a need to report to the team for guidance, as well as for the reservoir management to work together in order to solve the problem.
Mission factors.
Due to the varying complexity of occurrences and the complexity of tasks to be completed, planning can be skill-based, rule-based, or knowledge-based behavior, and the probability of human-caused error rises as a result. On the other hand, complex tasks and tight schedules also increase personal stress load, thus affecting reliability.
The factors influencing the plan development phase are shown in Figure 5.
  • Operation execution.
This phase refers to the completion of the action or sequence of actions identified in the previous step, mainly physical operations such as monitoring and controlling, behavioral inputs, etc., most of which are performed step-by-step in accordance with the requirements of the protocol. At the same time, the execution of certain operations may require communication and co-operation between different teams. Operational execution may consist solely of the operator working alone to complete the tasks required in a developed plan, or it may consist of coordinated cooperation between shifts in order to jointly perform a series of tasks.
Thus, the human factors that influence the operational execution phase are related to both human and organizational factors.
Individual factors: Physiological factors; psychological factors; qualitative factors.
The human being is the operating subject of the human–machine system and therefore the main influencing factor in the operation execution. THERP categorizes human errors in performing operations into errors of omission (EOO) and errors of execution (EOC). Errors of omission are mainly omissions of the whole task or omission of a step in the task, and errors of execution are mainly errors in the selection, sequence, timing, quality, and so on.
Technical factors: Hardware such as gates and display facilities; software such as control systems.
During the execution of the operation, the operator is required to complete the Class I and Class II tasks from the previous step and implement the operation of the hardware and software equipment. The maneuverability of the human–machine interface affects the operation of operators. Hardware such as gates and spillways needs to be more operable after a dam incident, and some of the equipment that requires manual control can be challenging.
Organizational factors: Factors such as communication and cooperation, coordination, level of management, and distribution of tasks in the work group.
Implementation of complex tasks may require inter-shift communication and cooperation to complete the task sequence. The atmosphere within the team, the management system, and the collaboration of parallel departments will also improve the efficiency of completing the operation and reduce the probability of human error.
Environmental factors: Physical environment; social environment; engineering environment.
An unfavorable environment may reduce human reliability by affecting the efficiency and correctness when performing an operation. Especially in extreme weather, the difficulty of manually opening gates, operating machinery, and other behaviors rises accordingly.
The operational execution influences are shown in Figure 6.

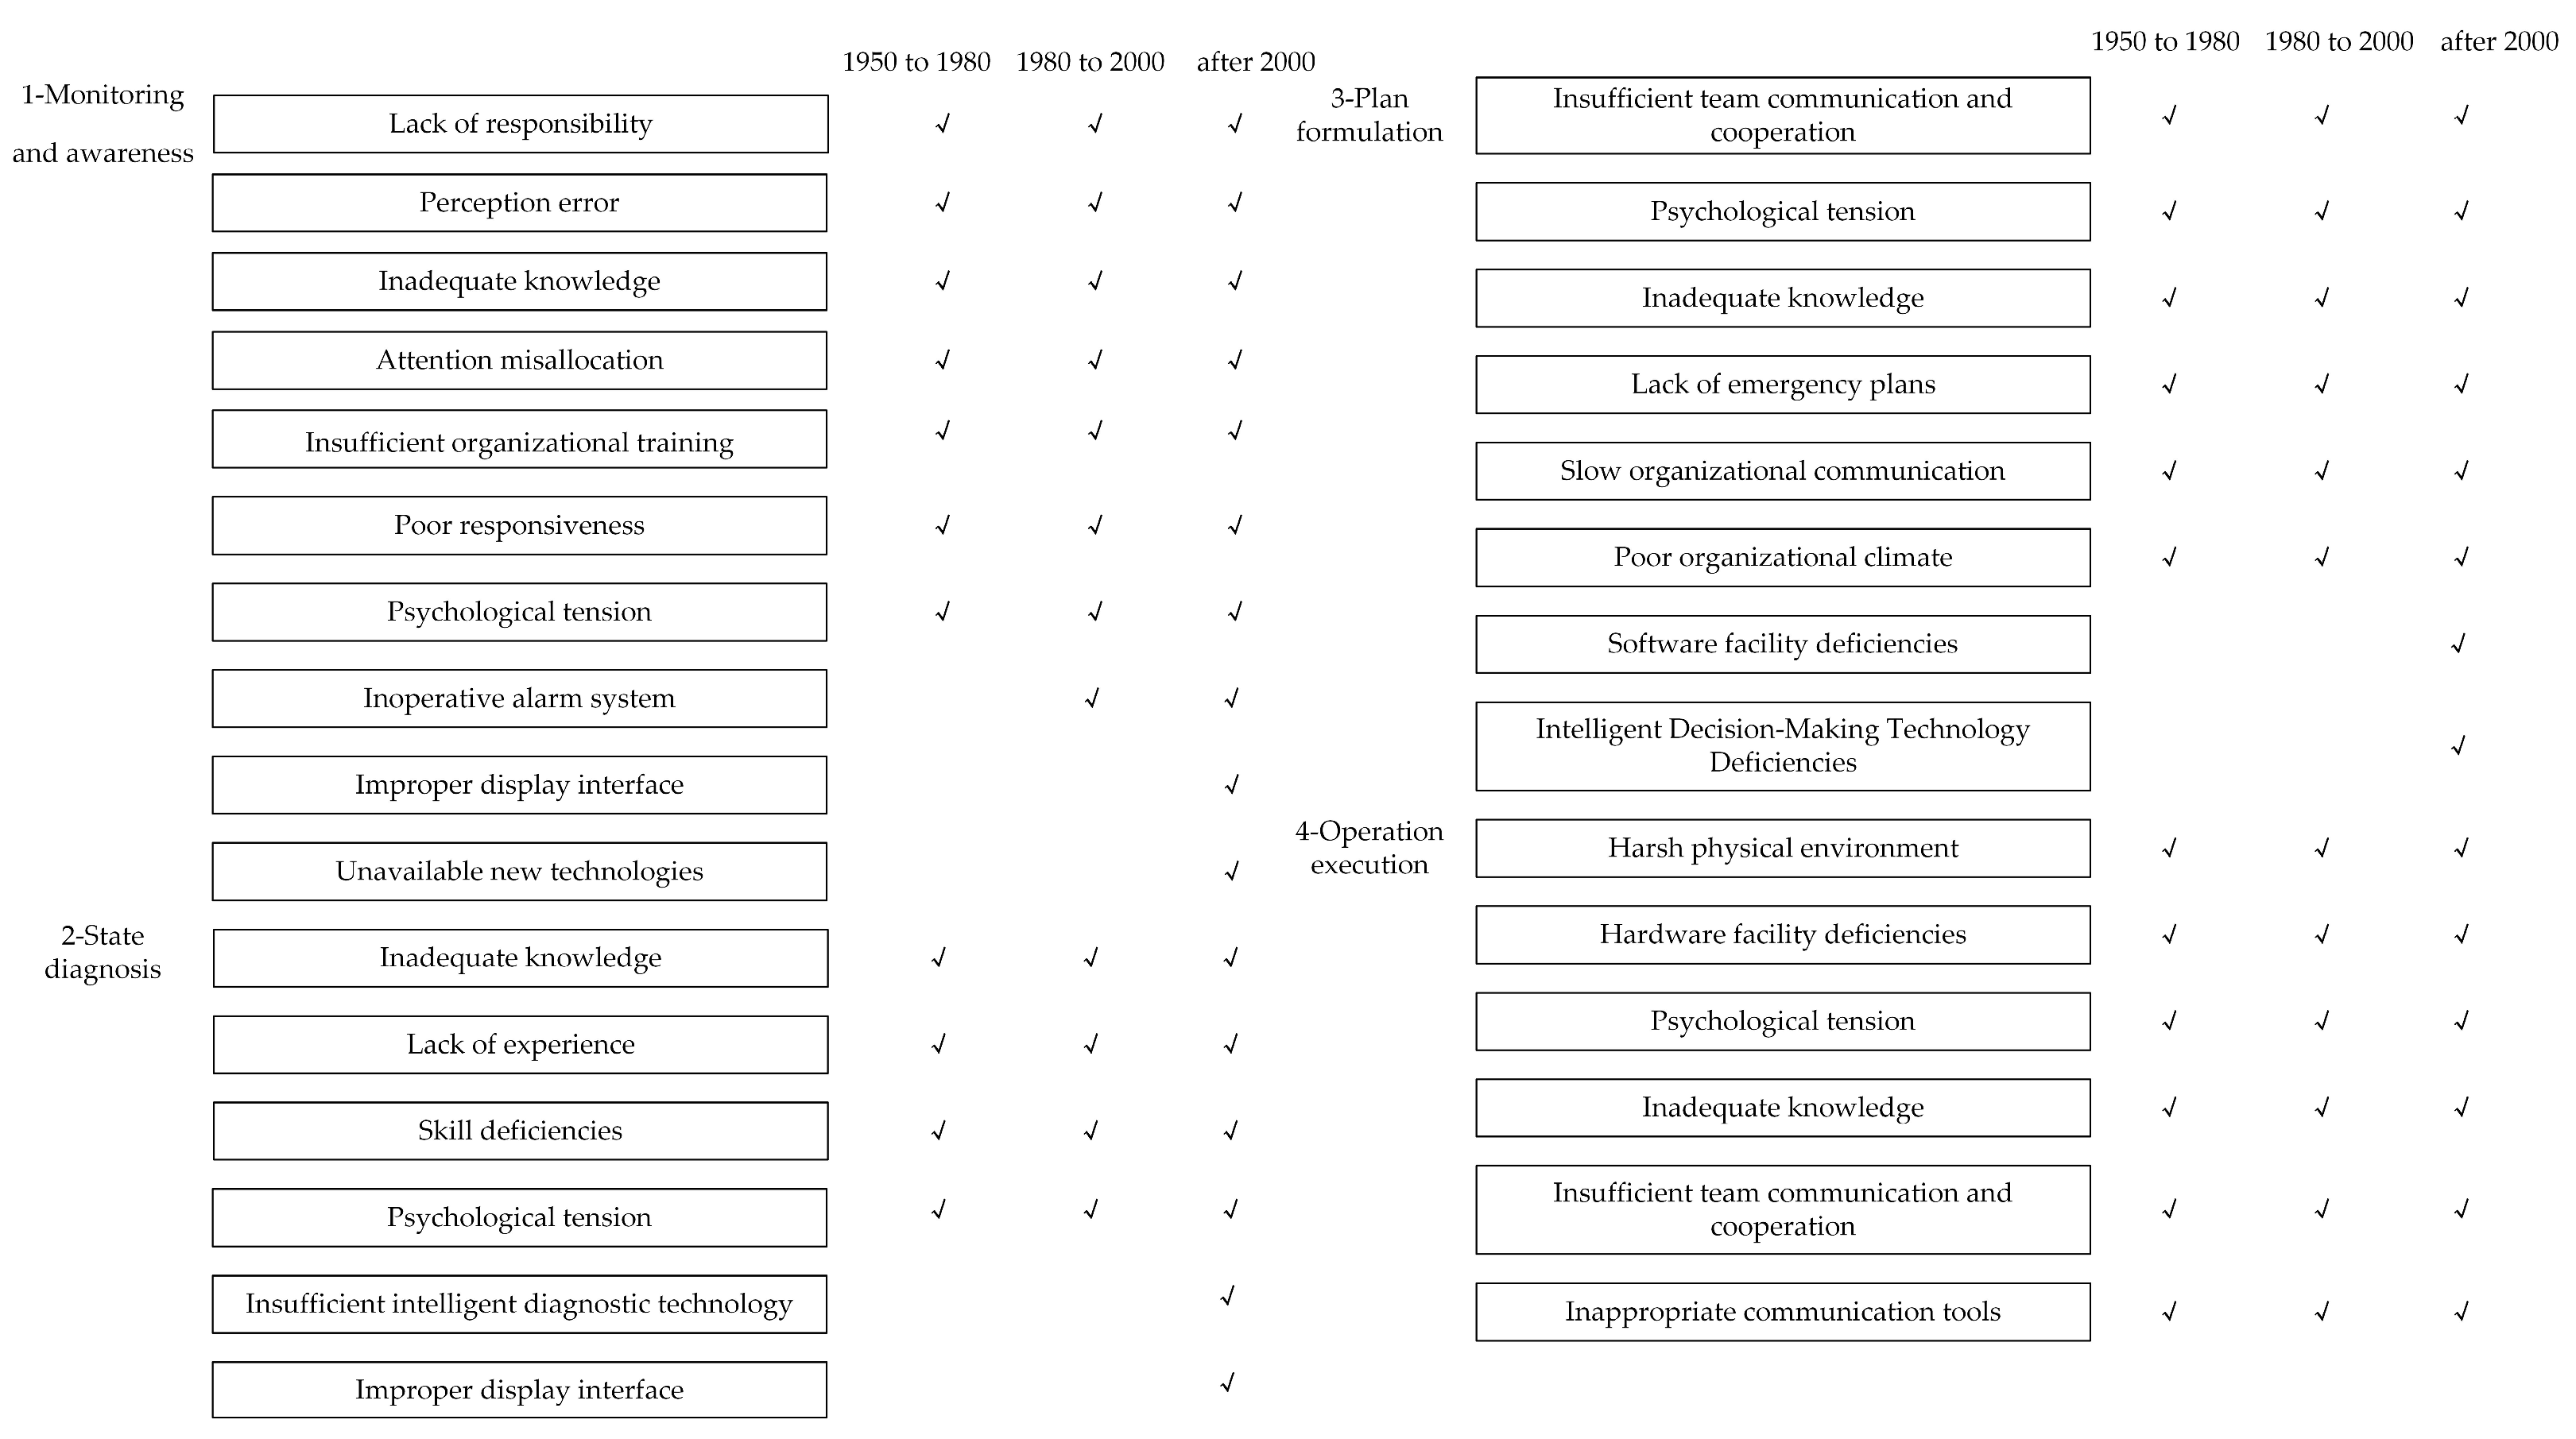
3.2. Failure Patterns of Nodes on the Basic Path

The concepts of explicit and implicit human factors failures proposed by Reason [32] are considered to categorize failures. In dam safety accidents, manifest failures are mainly late opening of gates, illegal impoundment, and the wrong choice in preserving the dam or the spillway, including wrong time, wrong behavior, wrong goal, wrong sequence. Potential failures are categorized into macro and micro aspects. Micro-types, i.e., perceptual and decision-making errors that arise during cognitive processes, mainly include perceptual errors, misallocation of attention, memory errors, and decision-making errors. Macro-type refers to the organizational management level, for example, failure of safety culture, poor management, inadequate patrol and inspection, and inadequate routine maintenance of buildings or gates. Macro-type failures consist of four main areas, which are poor decision-making, management deficiencies at several levels, potential production (or operational) prerequisite failures, and possible failures by maintenance personnel [33].
For the influences on the basic path of human failure above, combined with the classification of manifest failures, the possible failure patterns at each node were derived and are shown in Table 1. According to the path of “monitoring and awareness–state diagnosis–plan formulation–operation execution“, the analysis is based on the traceability method of CREAM [34]. For the possible causes thereof, starting from the failure path, search for the main influencing factor, and take this effect consequently to search for its antecedents until the root cause is found, constructing Figure 7 of the cause-and-effect relationship.
As can be seen from the causality diagram in Figure 7, in the process of dam accidents, the direct influencing factors of the failures at all stages are mostly the on-site operators and crews, who in turn are influenced by the upper organization and administration, so that the deeper cause of the potential failures is still the insufficiency in areas such as the safety culture and the management of the system.

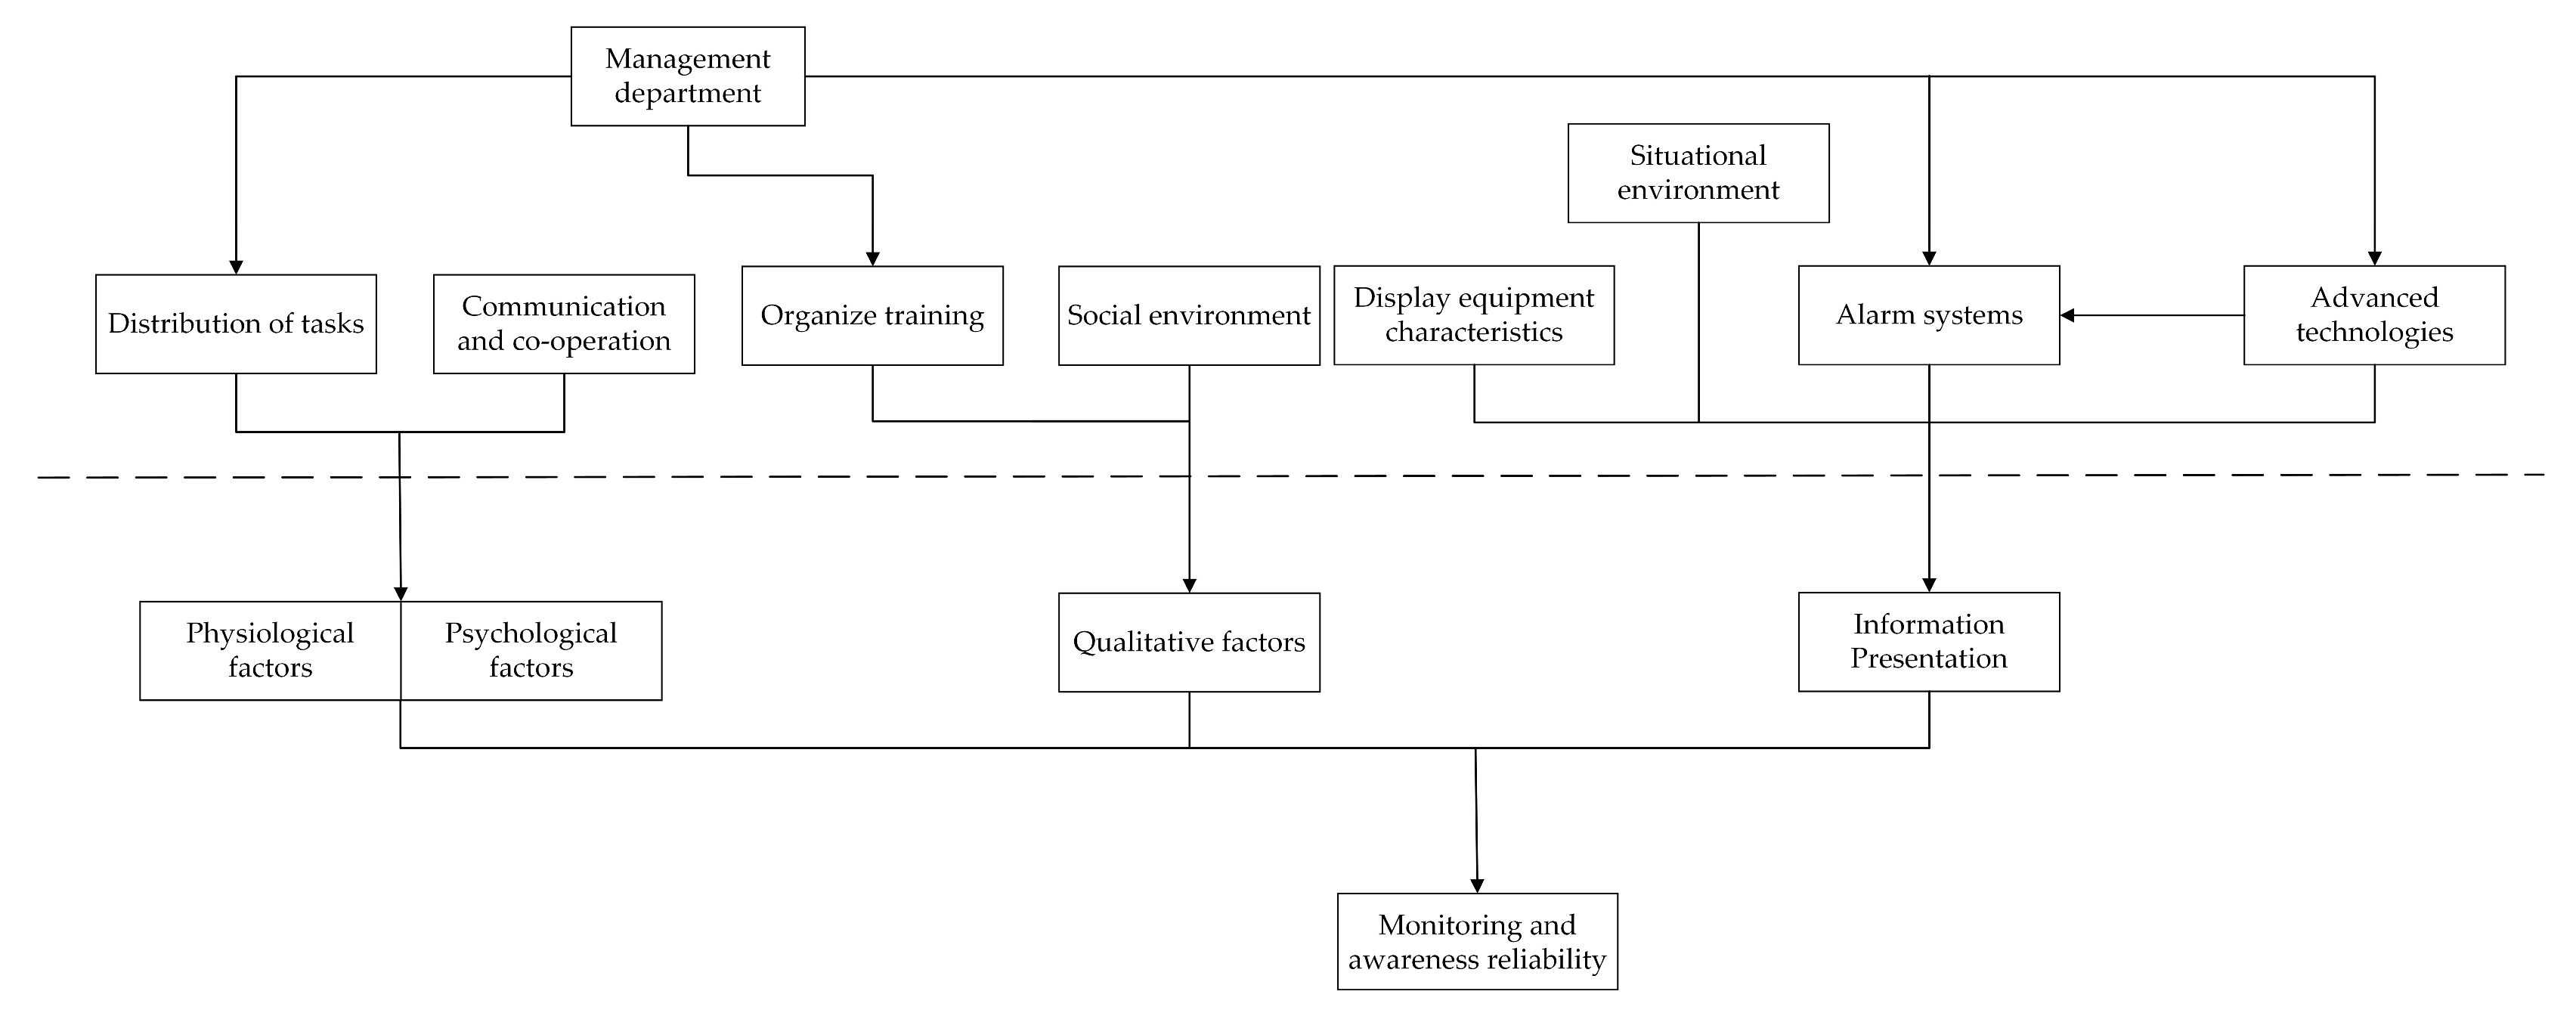
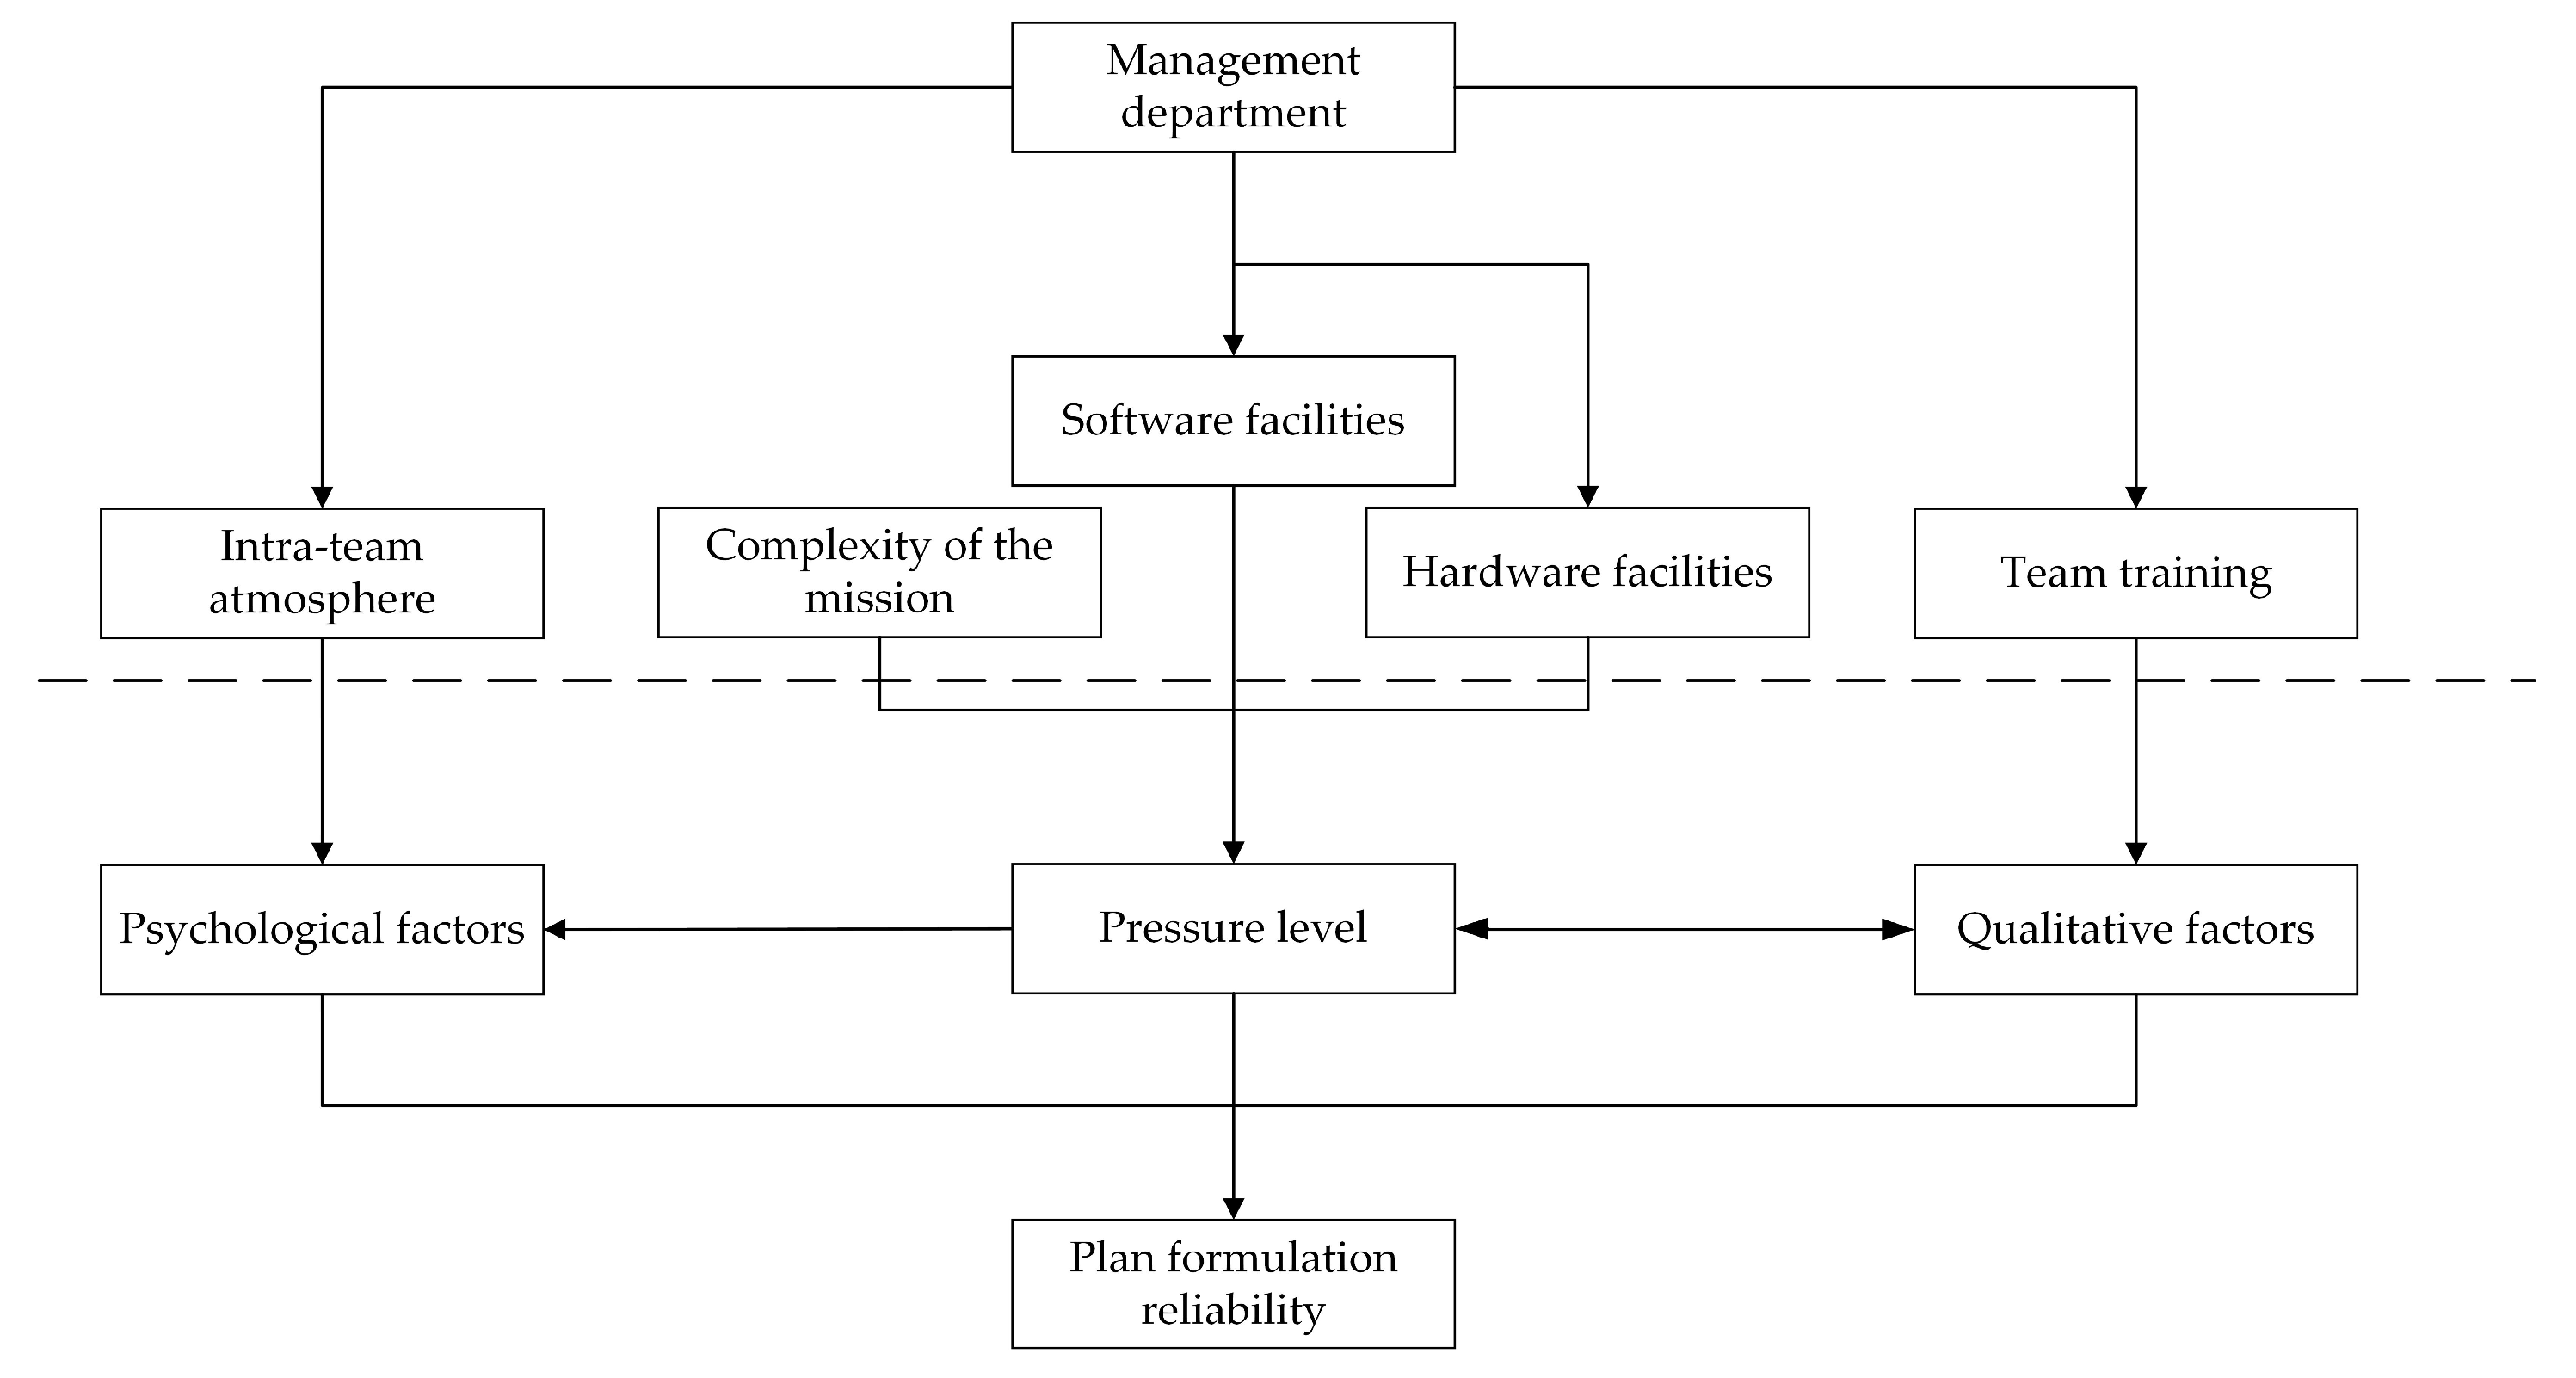
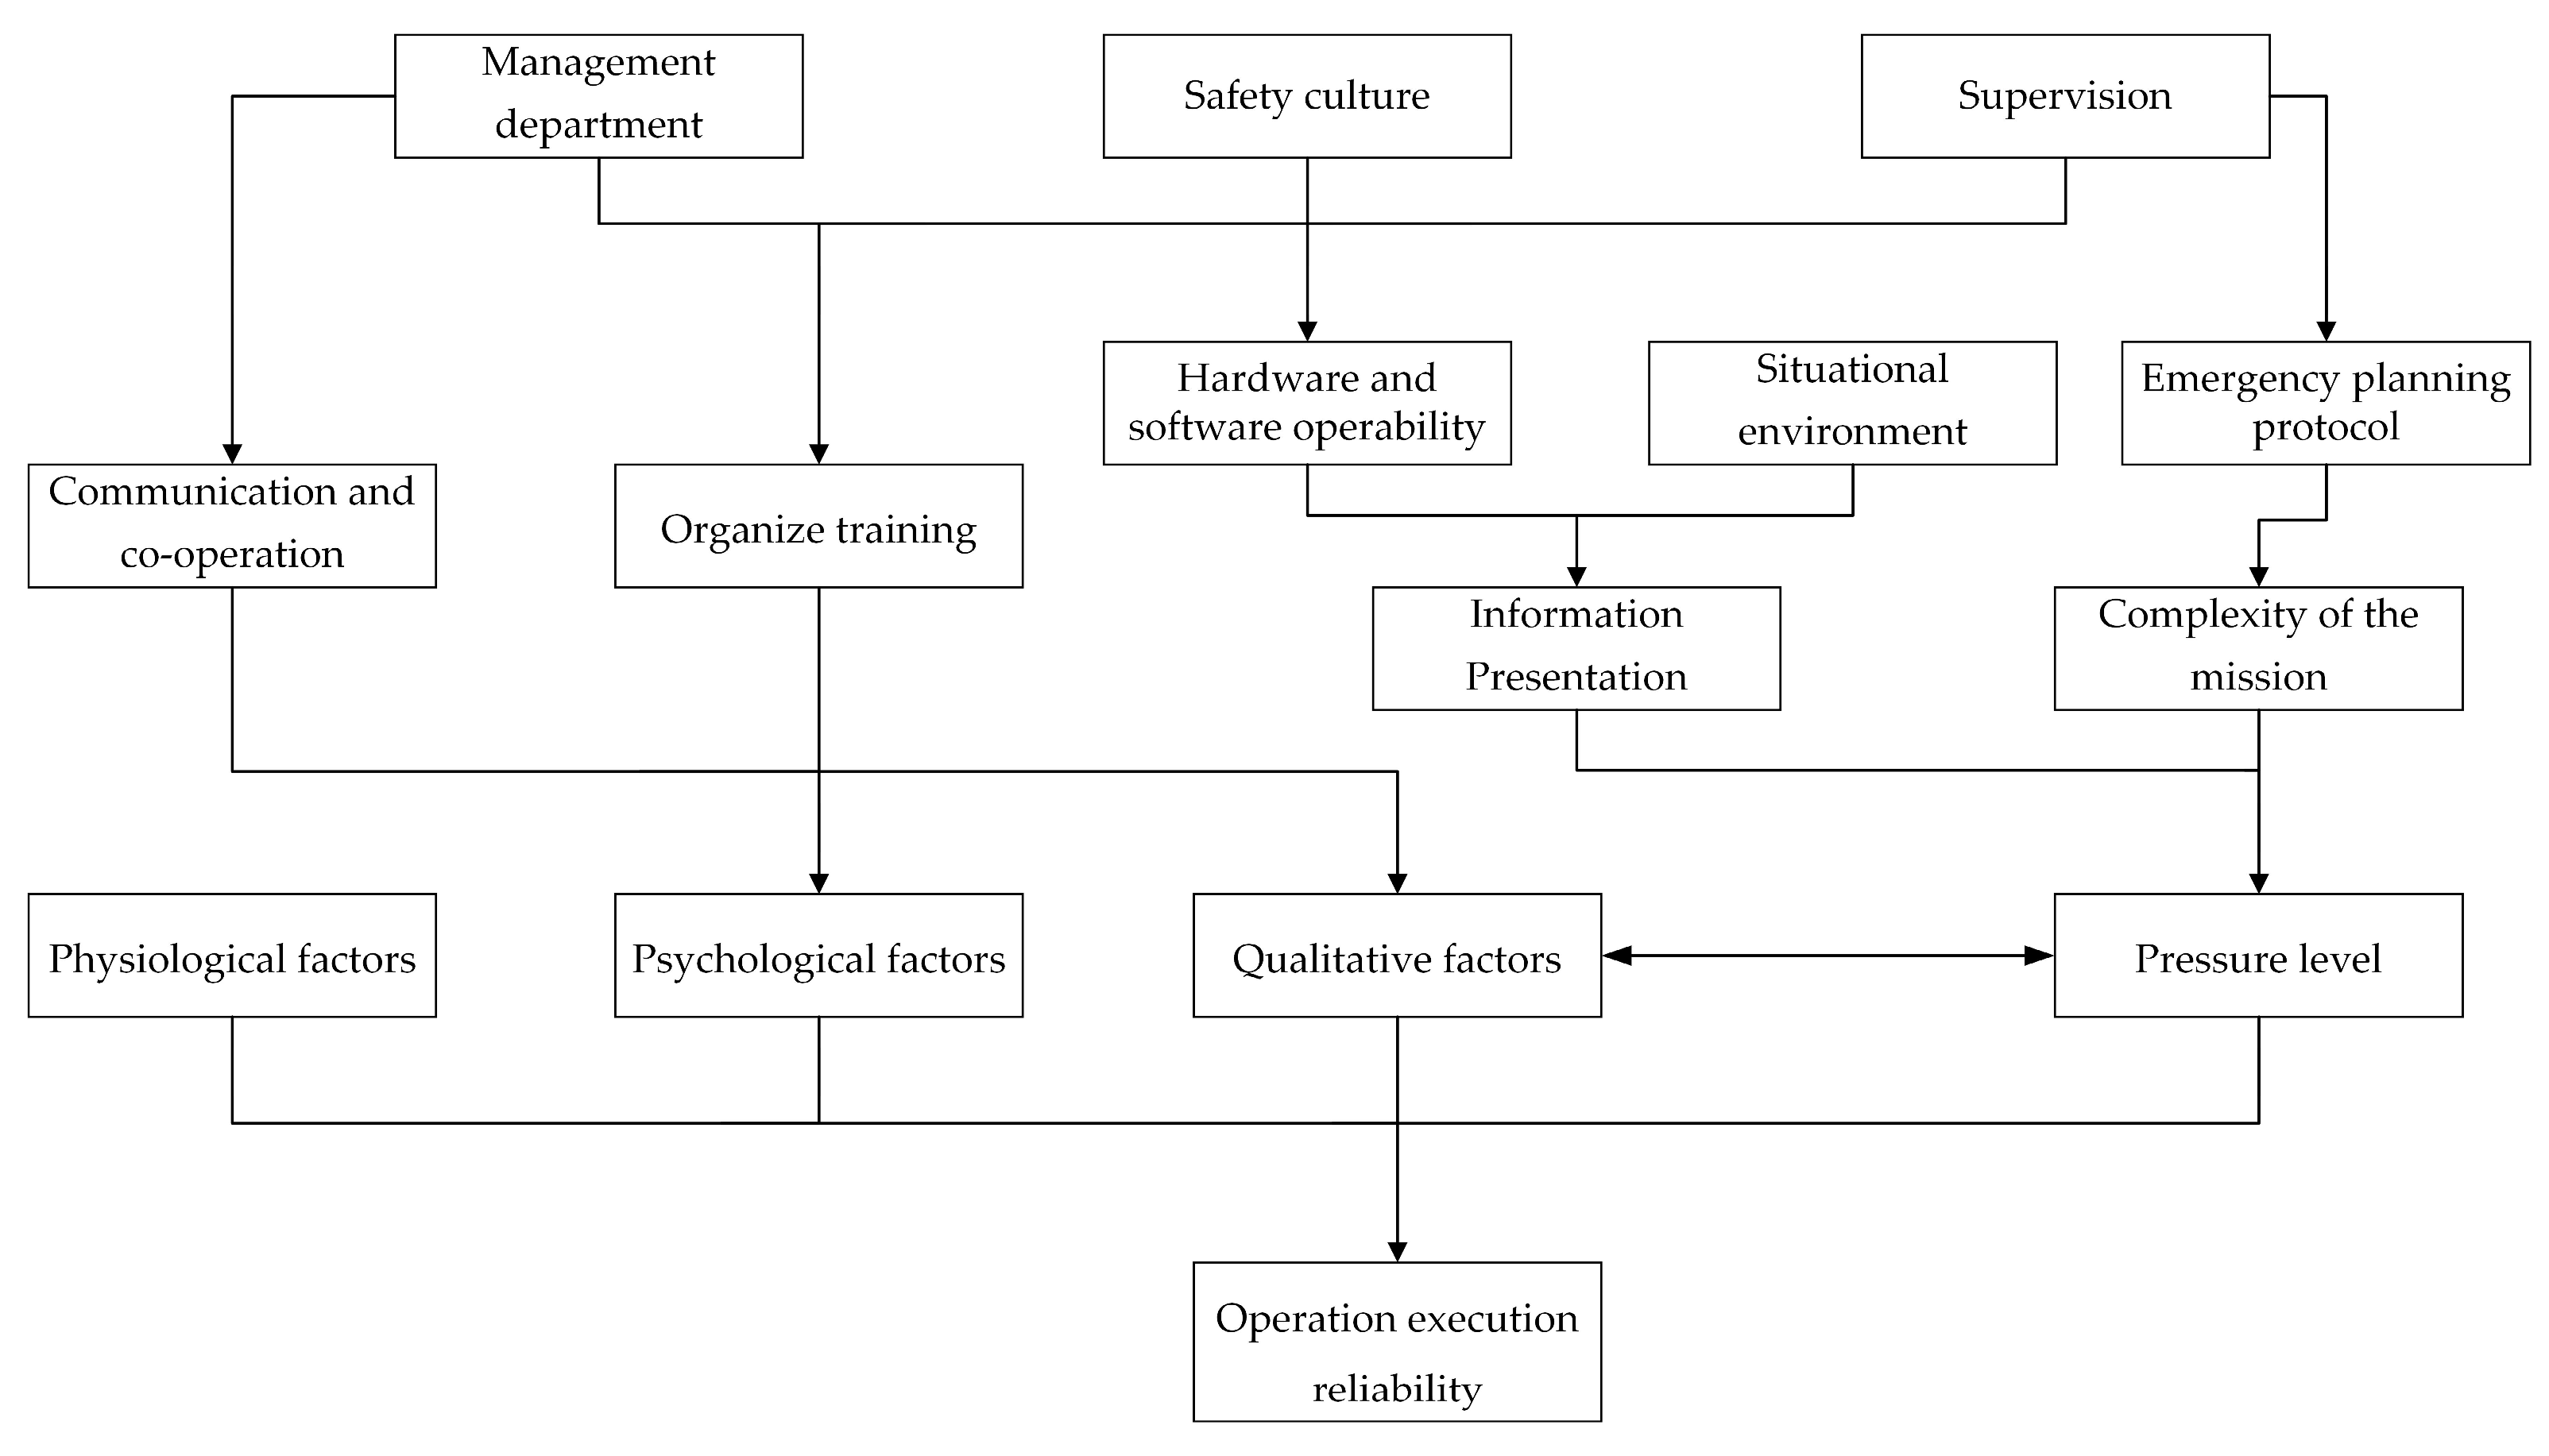
3.3. Performance Shaping Factors (PSFs) in Dam Failure Accidents

The concept of PSF, Performance Shaping Factor, was first introduced by Swain [35] in the construction of THERP. With the profound study of human reliability, it was realized that human error is not only caused by the person’s own reasons but is triggered by all the factors in the situational environment in which the person is located, which means that the situational environmental factors are the root causes of human error. PSF is a characterization of situational environmental factors, like PIF (Performance Influencing Factor), CPC (Common Performance Condition), EPC (Error Producing Condition), etc., the essence of which is the same. Successful inter-combination of PSFs decreases the probability of human error and increases human reliability, and vice versa.
Swain categorized PSFs into three groups, namely external PSFs, outside of personal factors; internal PSFs, personnel’s own factors; and stress levels. The traditional THERP method does not consider task characteristics when considering PSFs, the HCR (Human Cognitive Reliability) method removes available task time, and the ATHEANA (A Technique for Human Error Analysis) method includes all factors except power plant conditions as PSFs. Some scholars argued that all three should fall under the category of PSFs since they belong to situational environmental factors that would have an impact on people [36]. Combining the set of influences above and the effect of each on the pattern of errors, the following PSF categorization was established, as shown in Table 2.
The PSFs are divided into five main categories, considering the five factors of operator, technology, organization, environment, and task, and contain a total of 49 specific elements in 13 subcategories, which in general cover the situational environmental factors affecting people during operations. The main separate considerations in software facilities are water condition measurement, safety monitoring facilities and Intelligent decision-making technology, due to the fact that the completeness of these three has a great impact on operator reliability in the case of extreme weather-driven dam failures.
From the four nodes on the basic path in the previous section, combined with the relationships identified in the causality diagram and the model of human error in complex organizational accidents, the model of human error in dam failure accidents is obtained, and is shown in Figure 8.
The main human factors that influence the dam failure events caused by overtopping are hardware like gates, engineering, professional skills, internal atmosphere, and risk awareness. When leakage problems lead to dam failure, human factors are mainly daily management, software such as monitoring systems, professional skills, responsibility, and supervision efforts. In the case of dam failure due to defects in engineering quality, the main human factors of influence are software such as monitoring systems, supervision efforts, risk awareness, daily management, and experience.
Dam failures in China are divided into three main periods: 1950 to 1980, 1980 to 2000, and after 2000. The high rate of dam failures in the first phase after the establishment was due to the poor quality of the works and lack of scientific technological, supervisory, and management awareness. After the 1980s, dam management regulations and systems were promulgated one after another, the construction and management of reservoir dams tended to be scientific, and the number of dam failures significantly reduced. After entering the 21st century, with the development of science and technology, digital equipment and emergency plans have greatly reduced the rate of dam failure. According to the historical characteristics of dam failure in China, based on the classification by the damage causes, the typical mapping of human error in dam failure is classified by time; see Figure 9.
The typical chart of human error in dam failures is shown above, and the main differences between the eras and causes are:
  • Before the 21st century, plans were developed at a slow pace, with a high probability of human error, mainly owing to the absence of contingency plans and a poor sense of safety management. After entering the 21st century, with the popularization of emergency protocols and digital operating systems, the reasonableness of the information presented in the display interface, reliability of the software facilities, completeness of emergency plans, and popularization of new hydrologic technology also have an impact on the human reliability;
  • Overtopping is mainly generated during heavy rainfall, so the harsh physical environment can affect human operation. In contrast, most of the infiltration damage and engineering quality problems are incidents that occur out of flood season, and the physical environment has less impact on people;
  • In the case of excessive flooding caused by extreme weather, the monitoring awareness phase focuses more on the perceptual observations of operators during short-term high-water levels. At the technical level, the most important causes are failure to open gates, defects in engineering facilities leading to landslides, and so on. Deficiencies in software, such as monitoring systems, can also affect the time to awareness.
  • With the development of science and technology—for example, rain prediction forecasts—perspective perception technology, smart diagnostic technology, intelligent decision-making technology, potential danger detection technology, and other modern dam safety management technology is also used, and its perfection and degree of informatization also affects the reliability of operators. In general, the application of new technology increases human reliability and makes diagnosis-decision-making-operation rule-based. On the other hand, due to technological improvements, managers may be less knowledgeable about the system, leading to reduced human reliability.

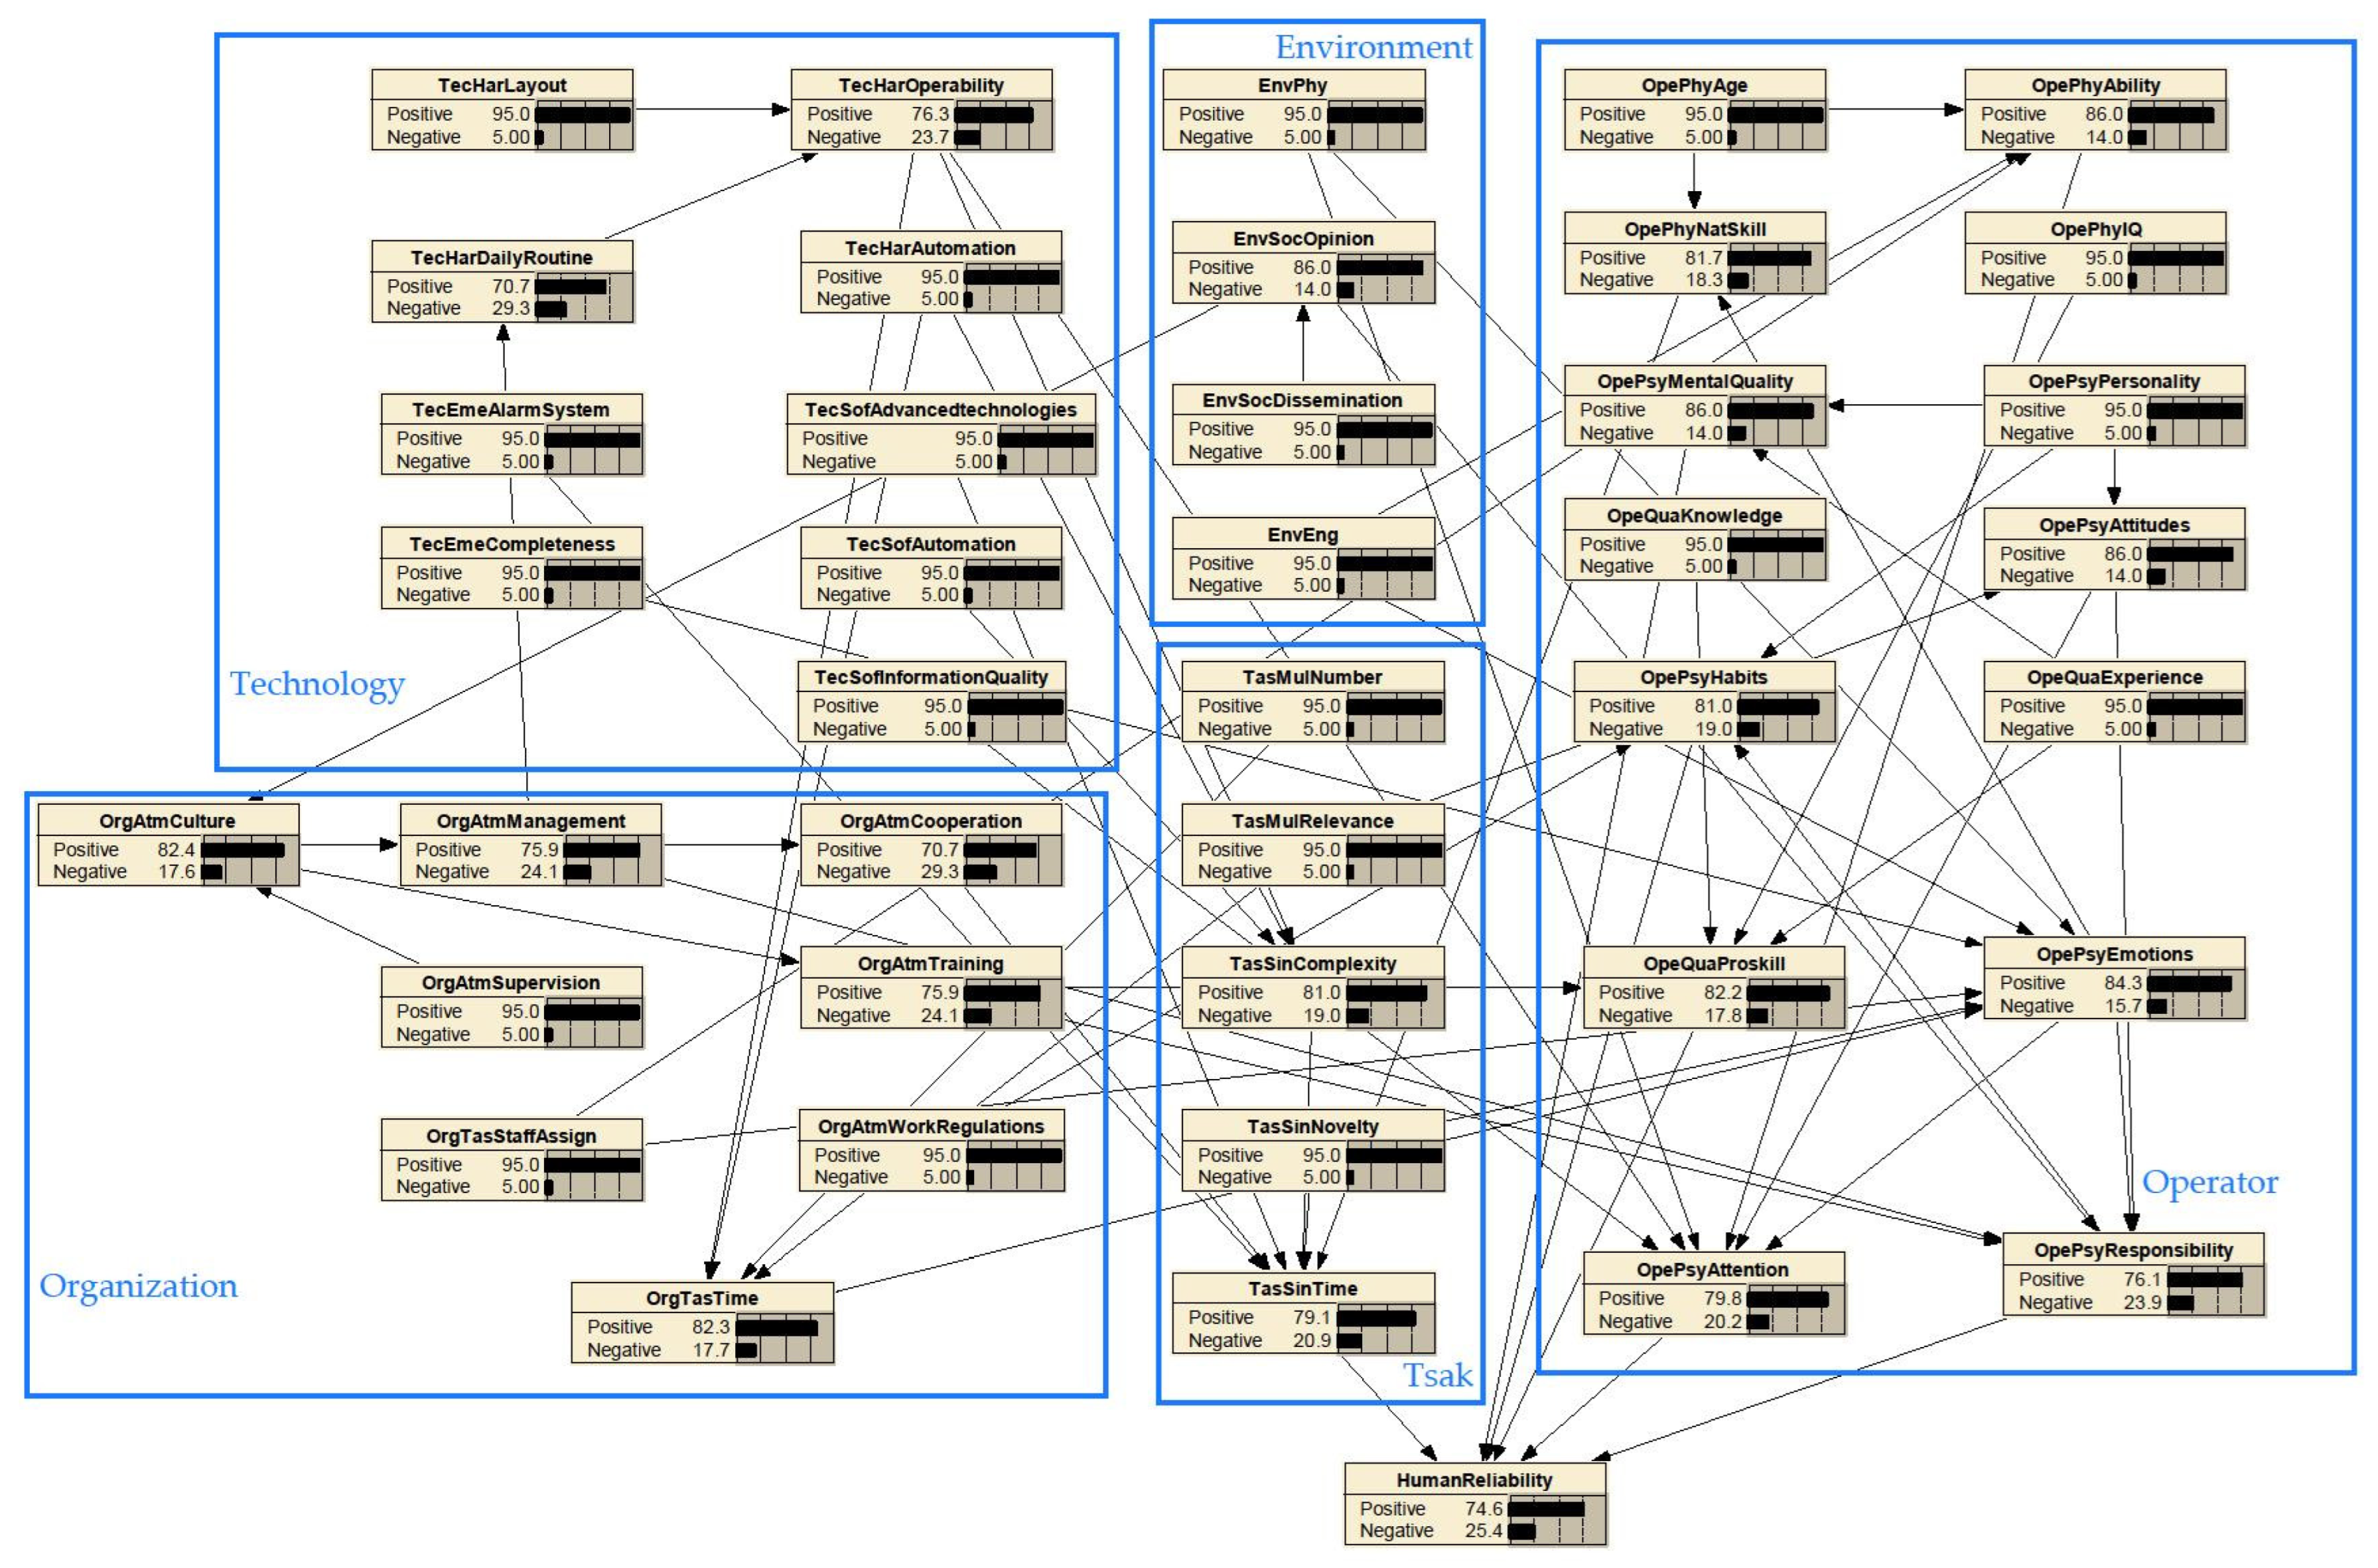
4. Bayesian Network Construction

To verify the reliability of the model, it was applied to a situation where a dam was experiencing excessive flooding due to extreme weather. The focus of this application is to quantitatively analyze the conditional probability table (CPT) and failure probability for this scenario and to find the main influencing factors with the highest sensitivity. This section is based on the historical dam failure database, human failure paths, and PSFs obtained above, combined with Bayesian networks. First, a suitable Bayesian network structure is constructed, later the correlations in it are determined for computation, and the results obtained are finally analyzed.

4.1. Introduction to Bayesian Networks

Nowadays, in other fields of human factors research at home and abroad, scholars have already chosen Bayesian networks to construct probabilistic causal models of human behaviors [37,38], which can draw some useful conclusions based on certain reasonableness criteria in the case of incomplete, uncertain, or even contradictory premise knowledge. Meanwhile, the following characteristics of the Bayesian Network are also suitable for the analysis of human behavior:
  • Bayesian networks are similar to the natural representation of knowledge structures in the human brain, which is more reasonable and convenient to represent and explain knowledge, and therefore more suitable for modeling human behavior;
  • With simple and clear representation, it can efficiently save storage space, simplify knowledge acquisition and domain modeling process, and reduce inference process and computational complexity;
  • The structure of Bayesian networks allows for both forward predictive inference and backward implementation of retrospection, which is in line with the requirements of behavioral prediction and root cause analysis in human reliability analysis.
Bayes’ theorem describes the inference method for conditional probability and is the core of the Bayesian approach, formulated as follows [39]:
P A B = P A   P B A P ( B ) ,
where P A B is the probability of event A occurring under the condition of event B. It is the posterior probability. P(A) is the prior probability of event A. Bayes’ theorem can be used iteratively to keep updating the data by using the posterior probability as the prior probability of the next item.
The Bayesian Network contains both qualitative and quantitative components, a directed acyclic graph to represent the structure, and a conditional probability table to represent the degree of probabilistic dependence between nodes, providing a solid foundation in mathematical theory. A directed acyclic graph consists of N nodes and directed edges connecting them, where nodes represent random variables and directed edges represent interconnections between nodes. The conditional probability table can be described by P x i π i , which represents the correlation between a node and its parent, and the probability of a node with no parent is the priori probability.
The Bayesian Network based on Bayesian theory is the process of probability calculation, which mainly includes the joint probability P X 1 , , X n , and the edge probability P ( X i ) , with the following formula [40].
P X 1 , X 2 , , X n = P U = i = 1 n   P X i π i ,
P X i = e x c e p t   X i   P U ,
Then, there is:
P U e = P ( U , e ) P ( e ) = P ( U , e ) U P ( U , e ) ,
In the Formula (4), e is known evidence, π i is the set of parents of variable X i , and X i denotes the i t h ( i = 1 , , n ) variable.

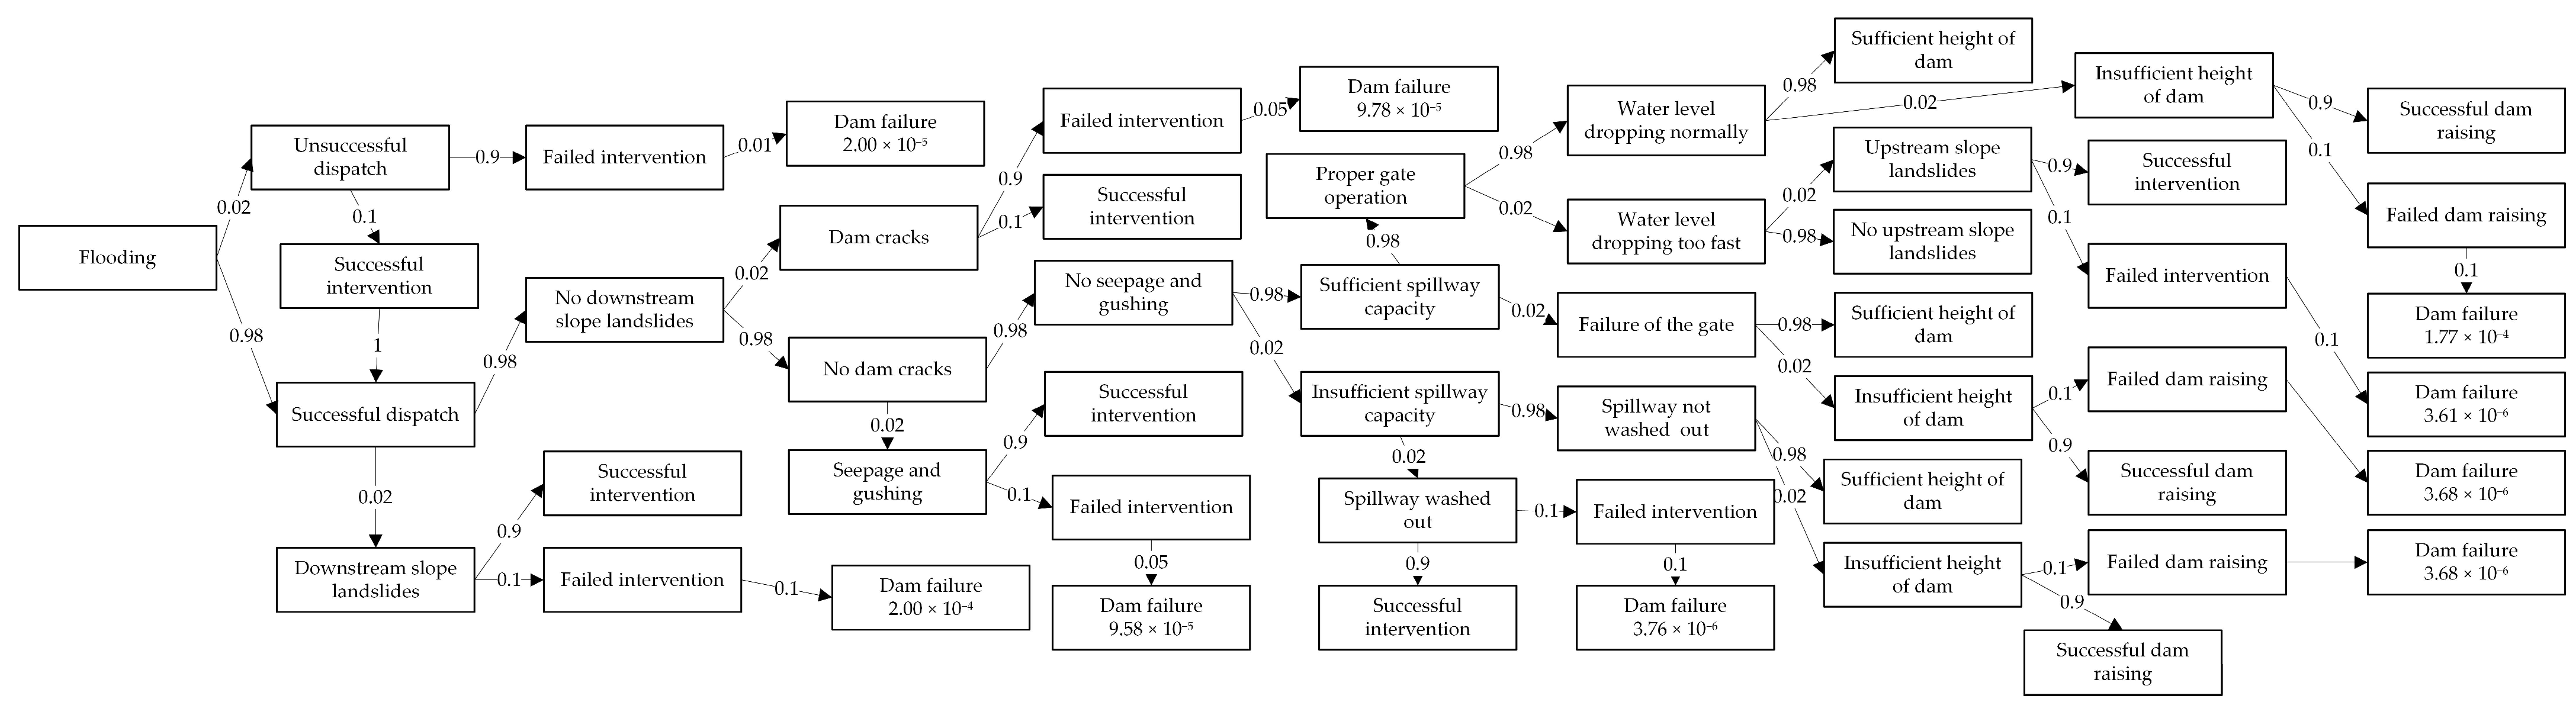
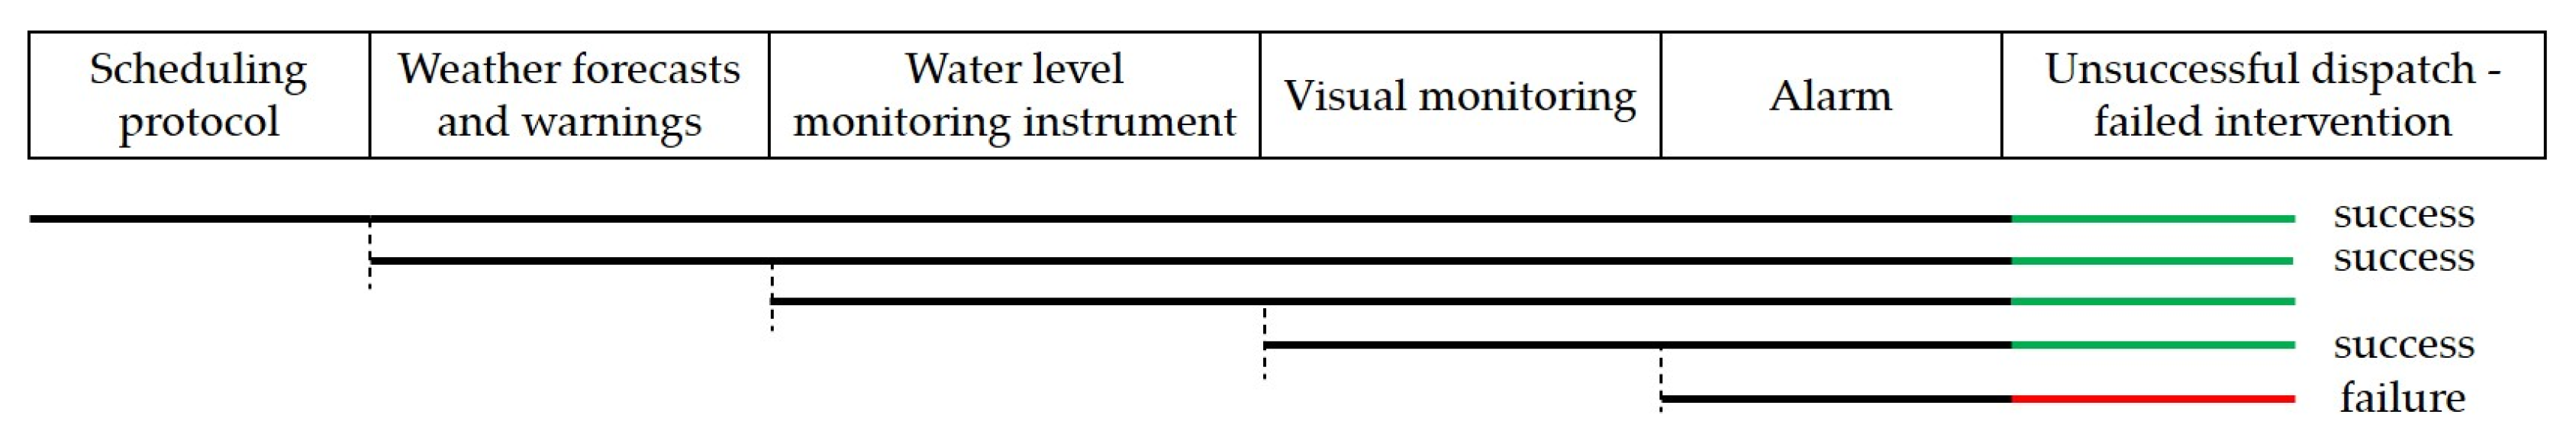
4.2. Accident Event Tree

When studying dam failure accidents caused by extreme weather, it is first necessary to study the path of dam failure in this context and then consider the human error in each step. The idea of tracing in the CREAM method [41] is used to find the root cause of it and trace to obtain the PSFs.
Flood overtopping is the most important cause of dam failure in China, accounting for about half of all historical breaches. From the historical dam-break database of Nanjing Hydraulic Research Institute, after entering the 21st century the proportion of dam failures caused by insufficient flood relief capacity has decreased significantly, mainly due to emphasis on the safety management of reservoirs and extensive removal and reinforcement projects. At the same time, the proportion of dam failures due to excessive flooding has increased, from 12.26% of the total number of dam failures from 1954 to 1999 and 39.22% from 2000 to 2021, which is three times as much as before. This is attributed to the high incidence of extreme weather, the increased frequency of excessive flooding, and sometimes droughts that lead authorities to violate the rules of overstocking to alleviate drought conditions, which makes them prone to dam failures after heavy rainfalls.
The overtopping of a dam is often the result of a combination of causes that can lead to and develop into a dam collapse. Through the study of dam failure path and mechanism, it can be obtained that under the over-standard flood, if the reservoir exists in the current situation of insufficient flood resistance, a gate that cannot be opened, scheduling and utilization errors and other problems, it is more likely to develop into a dangerous situation. The event tree for dam failures due to over-standard flooding during extreme weather is shown in Figure 10.
Dam failure occurs as a result of a combination of internal weaknesses and external loads in a number of possible ways. Since more than 90% of the dams in China are earth-rock dams [42], the event tree is drawn mainly based on their failure patterns and paths. For a particular reservoir, the dam characteristics and internal weaknesses are different, with different failure modes and damage paths; therefore, analysis is still needed when applied to specific reservoirs.
For reservoir distresses under excessive flooding, the distresses are first categorized into whether or not they have been successfully dealt with. If they are not properly dealt with before a flood arrives, instead of meeting the flood with a higher storage level, the probability of a dangerous situation is extremely high, and there is a high probability of dam failure. The causes of dam failure in reservoirs were categorized as downstream slope landslide, upstream slope landslide caused by rapid decline in water level after opening the gates, normal decline but insufficient elevation of the dam, gate breakdown resulting in the inability to properly lower the flood water through insufficient gate height, a rise in water level after inadequate discharge via the spillway, destruction of the spillway by washout, cracks, and seepage and pipe surges. Intervention success/failure branches were added to all dam failure pathways, which is an important component of human reliability, but as it is not the focus of this thesis, it will be explored with further details in future studies.
In using the event tree to determine the probability of dam failure due to each factor, there are three issues that need to be addressed.
  • It is necessary to identify the possible routes of dam failure, without missing the main routes, often requiring the help of dam experts who are familiar with dam conditions;
  • It is necessary to determine the various possible loads and their frequencies, often requiring more detailed information on reservoir utilization and water levels;
  • It is necessary to determine the probability of occurrence for each collapse development process, which is often evaluated and assigned by an expert, with a high degree of uncertainty.
In general, the more detailed the dam information is and the more experience the experts have, the more accurate the determination of the occurrence probability will be.
In determining the occurrence probability of each branch event in Figure 10, the main method used is expert experience combined with historical information statistics, which belongs to the level of screening and preliminary analysis in risk analysis. Statistical analysis of historical data is used to determine the likelihood of a similar event occurring in the future based on the probability that the event has occurred in history. However, because the internal and external conditions of the dam when the event occurred historically were often different from the conditions under the scenarios are analyzed, it is likely that they are not comparable with each other. Therefore, the application of historical data statistics should be applied with attention to applicability and used cautiously in conjunction with expert experience. The use of expert experience in order to determine the occurrence probability of the various components of the dam failure process is an internationally accepted methodology today, which translates the qualitative judgment by experts on how an event is likely to occur into quantitative probabilities. Those commonly used internationally include the conversion table between qualitative description and quantitative probability proposed by Barneich and Vick [43], the conversion table proposed by the U.S. Bureau of Reclamation [44], the conversion between qualitative description and event occurrence probability used by the Australian Risk Evaluation Guidelines, and the qualitative description and probabilistic correspondence table of dam destruction event used in China [7]. Drawing on the above table, the selection of the probability of each node in the event tree is based on the THERP manual, the literature, and the estimation table of the dam failure probability; see Appendix A for a qualitative–quantitative table presenting human error probability judgments. The table categorizes the qualitative evaluation into five levels: very likely (very reliable), likely (reliable), fair, unlikely (unreliable), and very unlikely (very unreliable), with the probability of each level varying within a certain range, and the experts can assign scores based on their own experience. Taking the two cases in Appendix A as examples, a similar evaluation can be made for each node in the dam failure event tree in Figure 10. Since this model mainly focuses on the causes of excessive flooding triggered by extreme weather, it plays a fundamental role as a framework and should be adjusted to its probability after being applied to specific reservoirs. And when specific reservoirs are studied, the corresponding failure probabilities are obtained based on each specific qualitative description in the qualitative–quantitative table.
In this model, the failure probability of each node is mainly selected in the intermediate state, that is, “general”, “the event is basically unlikely to occur”, with the corresponding probability of 0.01 to 0.1. If the probability of failure is taken to be 0.02, then the corresponding probability of success is 0.98. Because the probability of the intervention being completed is reduced due to the difficulty of human movement in extreme weather condition, i.e., the operational behavior of the managers, “intervention”, “raising the top of the dam“, the error probability is taken as 0.1, the probability of success 0.9.
The dam failure tree is based on the dam failure paths, where the event nodes are associated with the behaviors taken by the operational managers and are analyzed to obtain the human error paths under various nodes to determine the probability of each event occurring. Taking the example of “unsuccessful dispatch–failed intervention”, first, due to the possibility of taking a chance, drought, and other reasons, the reservoir authorities ignored the scheduling protocols for the flood season and did not empty the reservoir in time. The lack of weather forecasts and warnings, the failure to monitor the occurrence of extreme weather in the basin, the absence of water level monitoring instrumentation or visual monitoring, resulting in the failure to open the gates in time, and the failure of the alarms to work correctly, resulting in the failure to detect the danger, are a series of reasons, as shown in Figure 11.
The event of “unsuccessful dispatch–failed intervention” includes five steps: scheduling protocol, weather forecasts and warnings, water level monitoring instrument, visual monitoring, and alarm, which are listed in chronological order. Scheduling protocols are the first preventive step and are the foundation for reservoir safety through the flood season. According to the relevant regulations, reservoirs should be drained below the permissible water level in advance to ensure safe operation during the flood season. Since extreme weather is frequent nowadays, and droughts may even precede floods, reservoir authorities risk ignoring scheduling protocols by chance. The second step is weather forecasting and warning technology. If there are advanced and complete rainfall measurement and reporting technologies in the basin, they can grasp and dispatch in time before the occurrence of heavy rainfall. Failure to forecast ahead of time requires reservoir managers to keep an eye on the monitoring instrumentation during extreme weather events to keep abreast of the dam’s operational behavior. If the dam does not have an effective safety monitoring system, it can only rely on manual inspection and visual monitoring, which makes it more difficult to judge the engineering safety. Managers with experience and specialized skills can make crisis predictions based on rain conditions and the rate of water level rise for emergency response. If none of the above behaviors are successful, the alarm device is the last line of defense at this point.

4.3. Bayesian Network Construction

Based on the human error paths of Section 3, the PSFs ensemble and the error chain of Section 4.2, the relationship of the directed acyclic graph of the Bayesian network is constructed. Taking the PSF ensemble in Section 3.3 as each node, it is divided into five major categories of operator, technology, organization, environment, and task, and thirteen subcategories of physiological factors, psychological factors, qualitative factors, hardware facilities, software facilities, emergency plan, organizational atmosphere, task allocation, physical environment, social environment, engineering environment, single task and multi task, as shown in Figure 12.
In Figure 12, OpePhyAge stands for operator physical age, OpePsyPersonality is operator psychological character, and OpeQuaKnowledge is short for operator quality knowledge level. Other abbreviations are the same, taking the first three letters of the classification and the name of the specific element. For ease of reading and clarification, the full title is still used in the paper. In the selection of nodes, layout of display equipment, mode of displaying information, shape and color of display instruments are the factors that affect quality of information, thus affecting the operator’s attention and monitoring awareness time, which influence the task time, and therefore merge with the quality of information in simplifying the network. Factors in the physical environment, including sound, light, temperature, humidity, vibration, and air quality, can affect the operator’s emotions and attention, and are hence combined to form the physical environment. The same is true for the comfort and safety of the engineering environment, consolidated as the engineering environment.
In the network, the final target node is the human reliability, which is influenced by a combination of six nodes: Operator Psychological Mental Quality, Operator Psychological Attention, Operator Psychological Habits, Operator Quality Professional Skill, Task Single Time and Operator Psychological Responsibility. Other nodes influence the result by affecting these six nodes or their parent nodes.
In the interconnection of nodes, a child node with n parents will have 2n states, and when n is large, the child node states grow exponentially. Therefore, when a directed acyclic graph is made, less influential dependencies or indirect connections are deleted. For example, with “Organization Task Duration–Operator Psychological Emotions–Operator Quality Responsibility” nodes, the duration of tasks assigned by the field team directly affects the operator’s mood; a shorter task time, for example, will make the operator nervous, affecting his or her reliability. The operator’s mentality also affects their responsibility; operators who have a suitable emotion in the management process will improve their responsibility. The effect of organizational task time on accountability is mainly through the influence of mindset, and at the same time the effect is small, so the dependence of “Organization Task Duration–Operator Quality Responsibility“ is not considered.
This is not the case for the three nodes “Physical Environment–Operator Psychological Emotions–Operator Psychological Attention”. On the one hand, the harsh physical environment directly affects the operator’s attention level; in particular, noise and light under extreme weather will reduce their attention and increase the difficulty of obtaining information and will also affect the operator’s mentality, leading to nervousness and fear.
On the other hand, the operator’s mindset directly affects attention, so if the operator has a bad mindset, which leads to taking risks or neglecting his duties, it will definitely reduce his concentration level. However, since the effects of extreme weather on mindset and attention are not of the same cause or negligible, they cannot be deleted. By such screening, the stereotyped dependencies of the directed acyclic graph of a Bayesian network are derived.
By consulting with experts and dam site managers, the conditional probabilities were populated using interpolation rules and assuming prior probabilities for the root node. Using binary nodes, where nodes have two possible states, “success” and “failure”, the corresponding impact factor nodes are defined as “positive” and “negative”. Positive states improve correlation performance, improve human reliability, and reduce the probability of human error, while negative states do the opposite. Ref. [45] suggests that the positive and negative states take values of 0.95 and 0.05, respectively, and the remaining non-root nodes are quantified using the interpolation principle in BN. The interpolation rule uses two parameters to populate the CPT, the probability that the child node is in a positive state when all parents are positive and when all parents are negative, which are taken as 0.90 and 0.10, respectively. The intermediate states are given by the following equations.
Pr m a x = M I N + M A X M I N × k N ,
Pr m i n = 1 Pr m a x ,
where Pr(max) represents the probability that the child node is in a positive state and Pr(min) represents the probability that the child node is in a negative state. MAX denotes the probability that the child node is in a positive state when all parents are positive, and MIN denotes the probability when all parents are negative. k is the number of parent nodes with positive states, and N is the total number of parent nodes.
Taking the Operator Quality Professional Skills node as an example, there are four parent nodes: Operator Physical IQ, Operator Quality Knowledge, Operator Quality Experience, Organization Atmosphere Training. So, it has 24 = 16 states, and the results obtained using the interpolation principle are shown in Table 3.
Using this approach, where the idea considered is that the negative state of each parent node will affect and have the same effect on the child nodes, since the impact of a change in the parent on the child nodes is not directly measurable in many cases, such an assumption of parity is used. Under this assumption, the more parents are in a negative state, the more human reliability decreases.
The probability of each child node can be obtained by reasoning from Equation (3). If there is a child node a and its parent nodes are b and c, the probability that it is in a positive state is:
P a = a m a x = P a = a m a x b = b m a x , c = c m a x × P b = b m a x × P c = c m a x + P a = a m e d b = b m a x , c = c m i n × P b = b m a x × P c = c m i n + P a = a m e d b = b m i n , c = c m a x × P b = b m i n × P c = c m a x + P a = a m i n b = b m i n , c = c m i n × P b = b m i n × P c = c m i n
then,
P a = a m i n = 1 P a = a m a x ,
The sequential calculation yields the probability of human factor reliability, as in the initial setting when the parent nodes are all taken to be 95%, to be 74.6%, and the probability of human error to be 25.4%. Since no initial event is considered, the root nodes should actually depend on the management level of each reservoir, operator expertise and the occurrence probability of extreme weather in different watersheds. This result is a probability for research purposes and reference only, not a final crash probability.

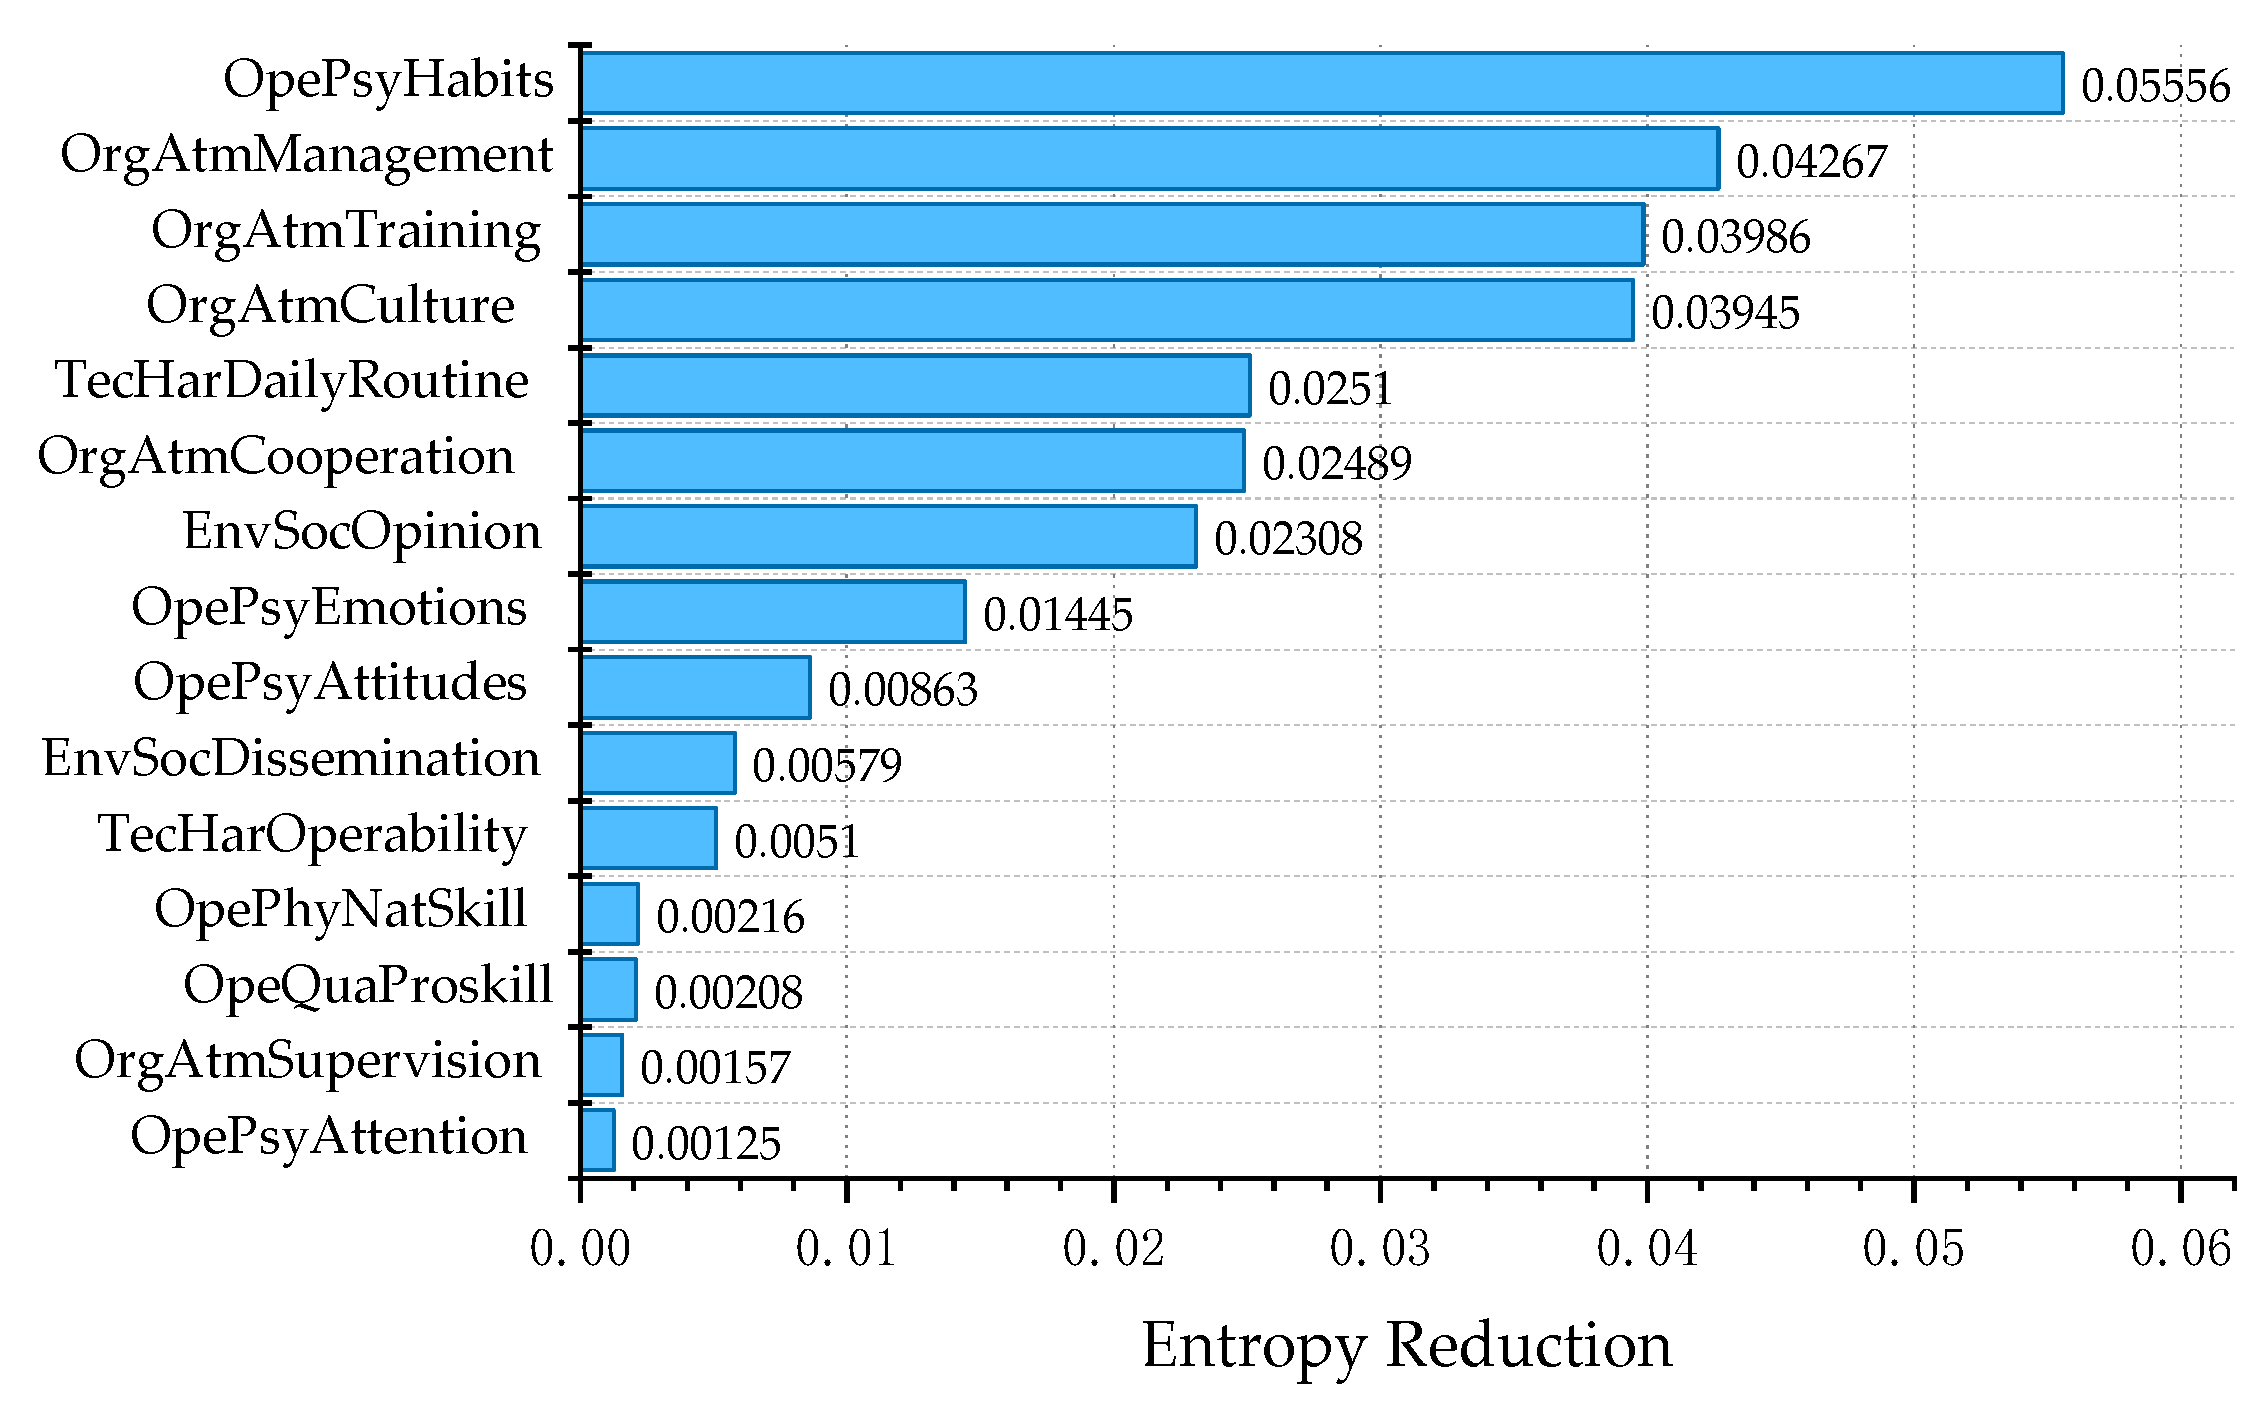
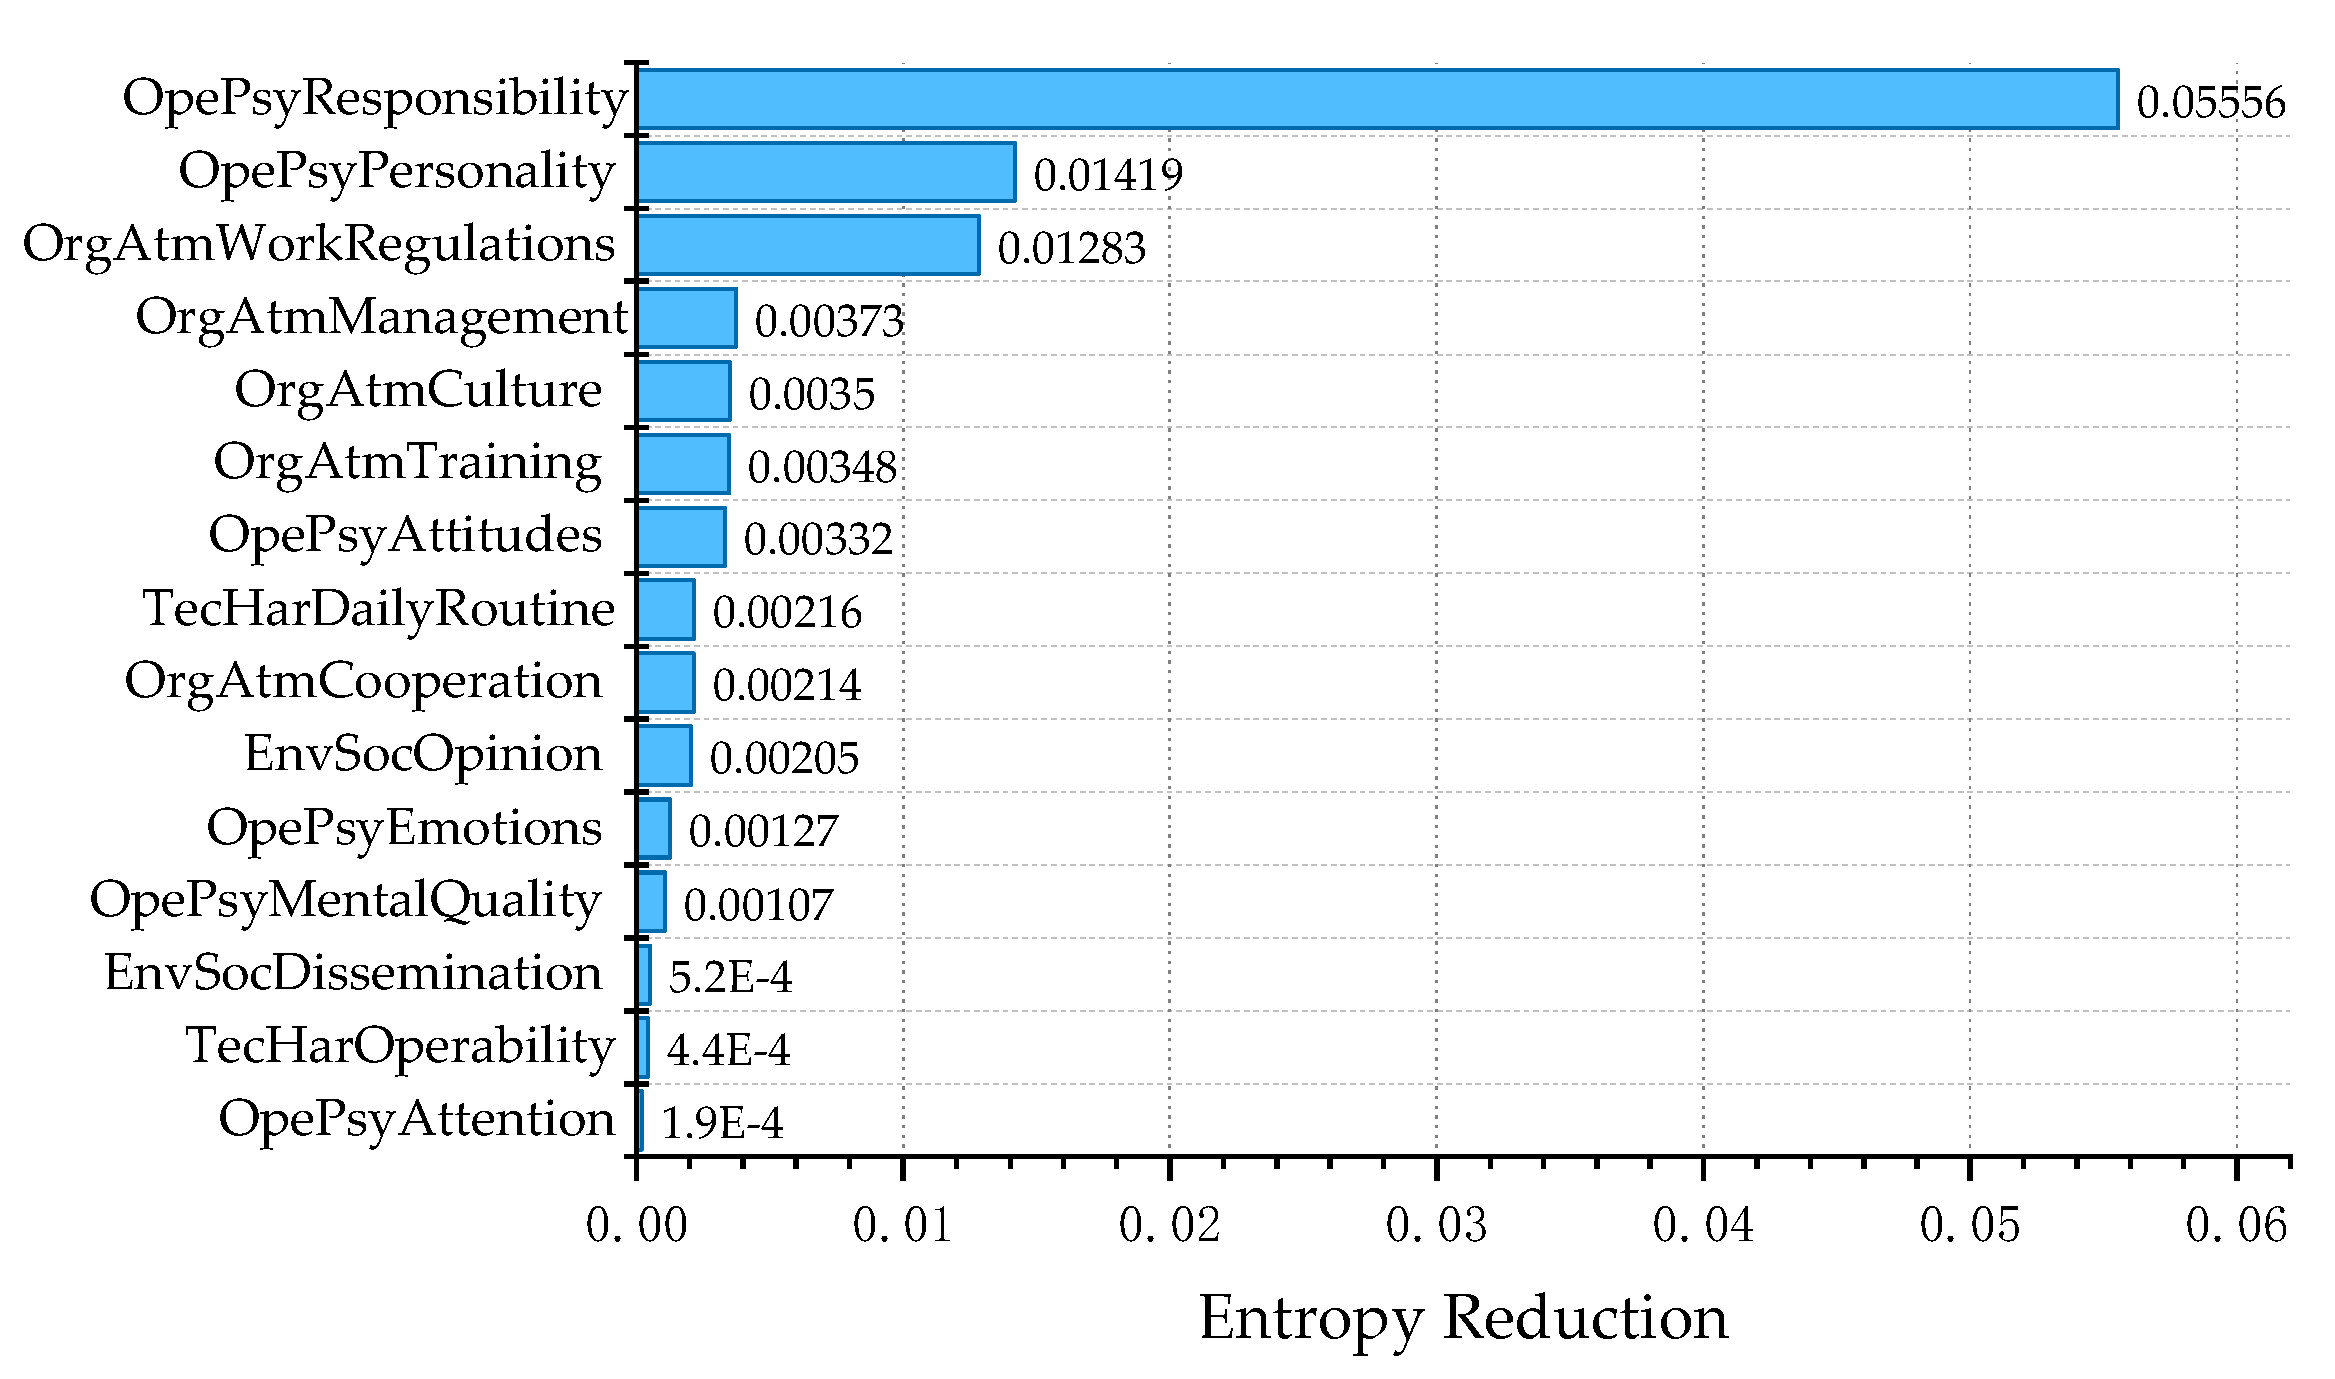
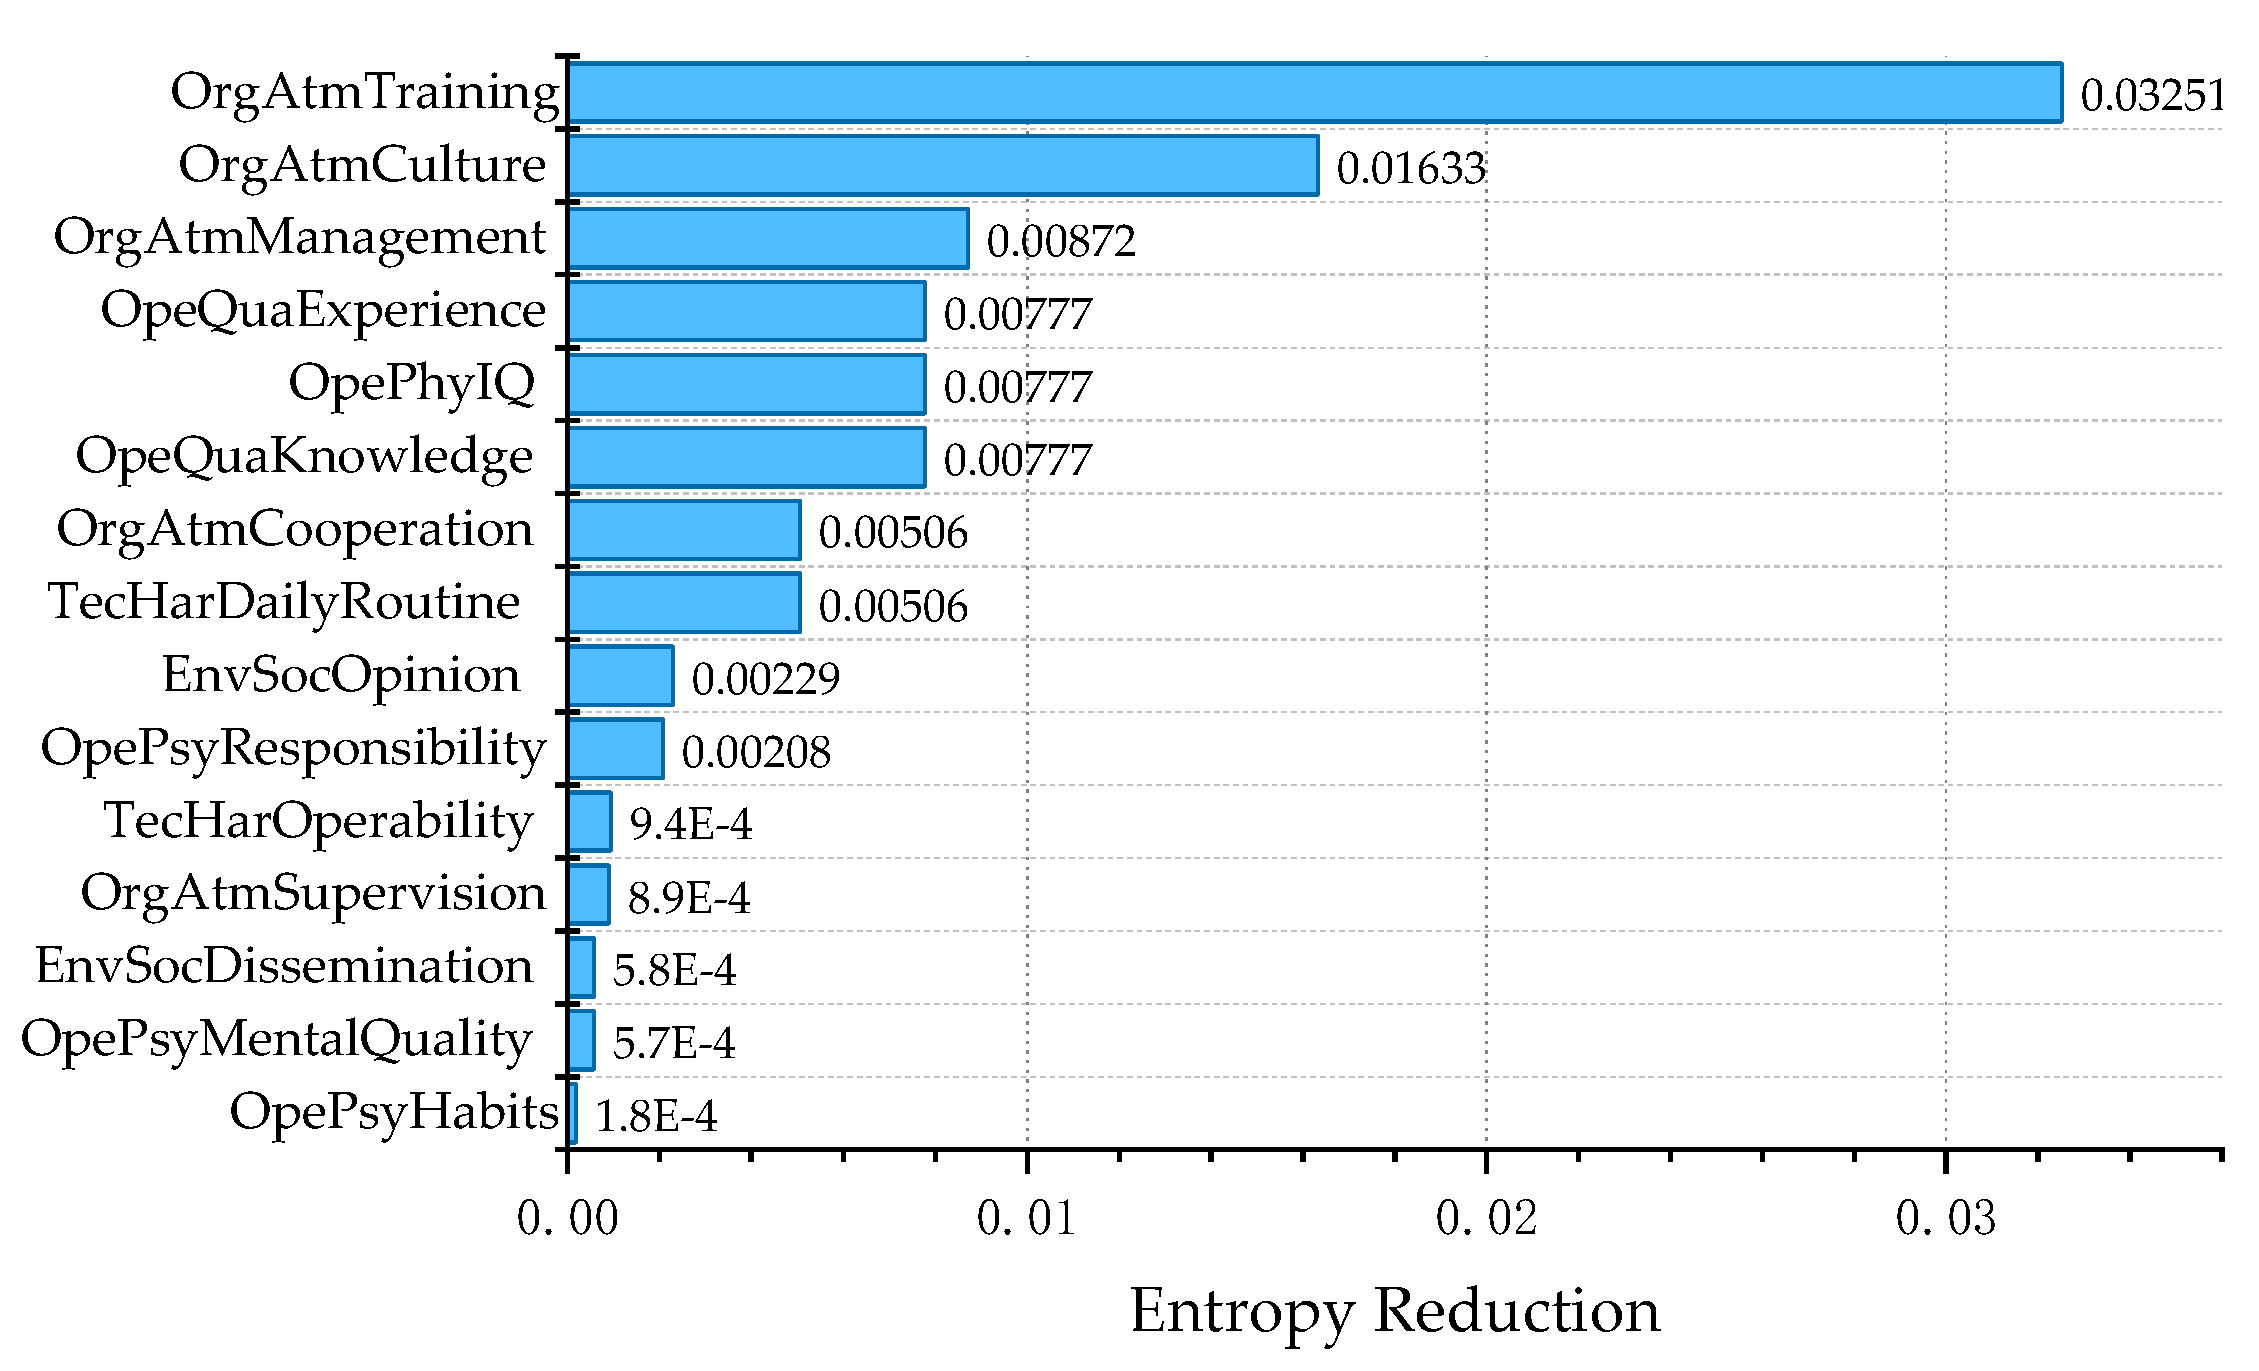
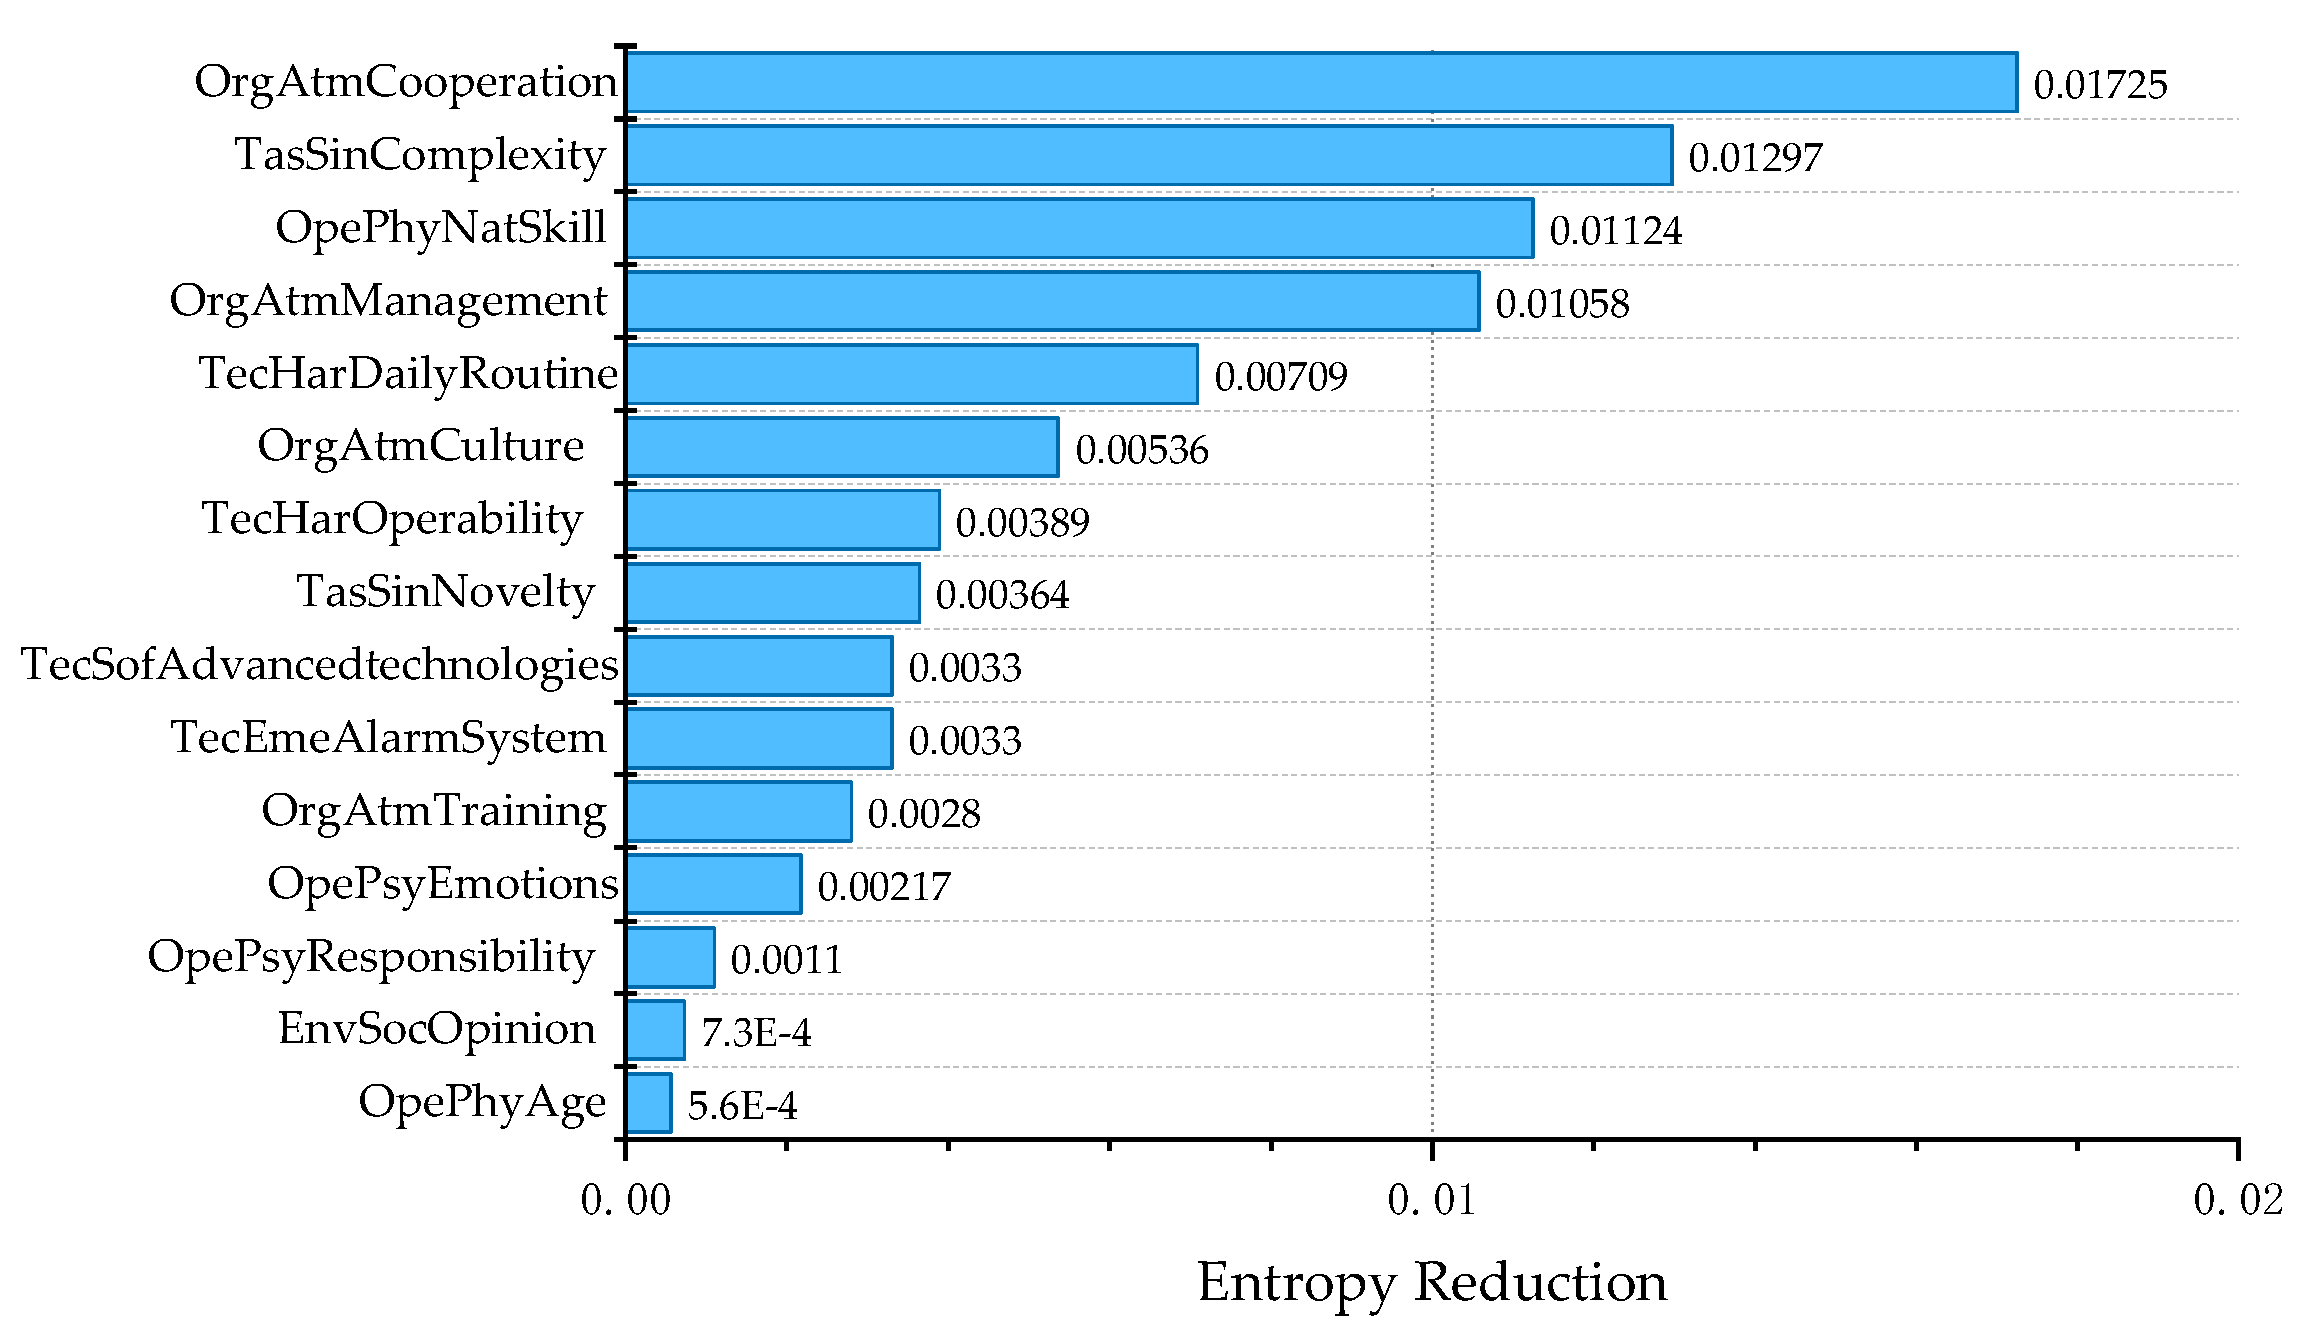
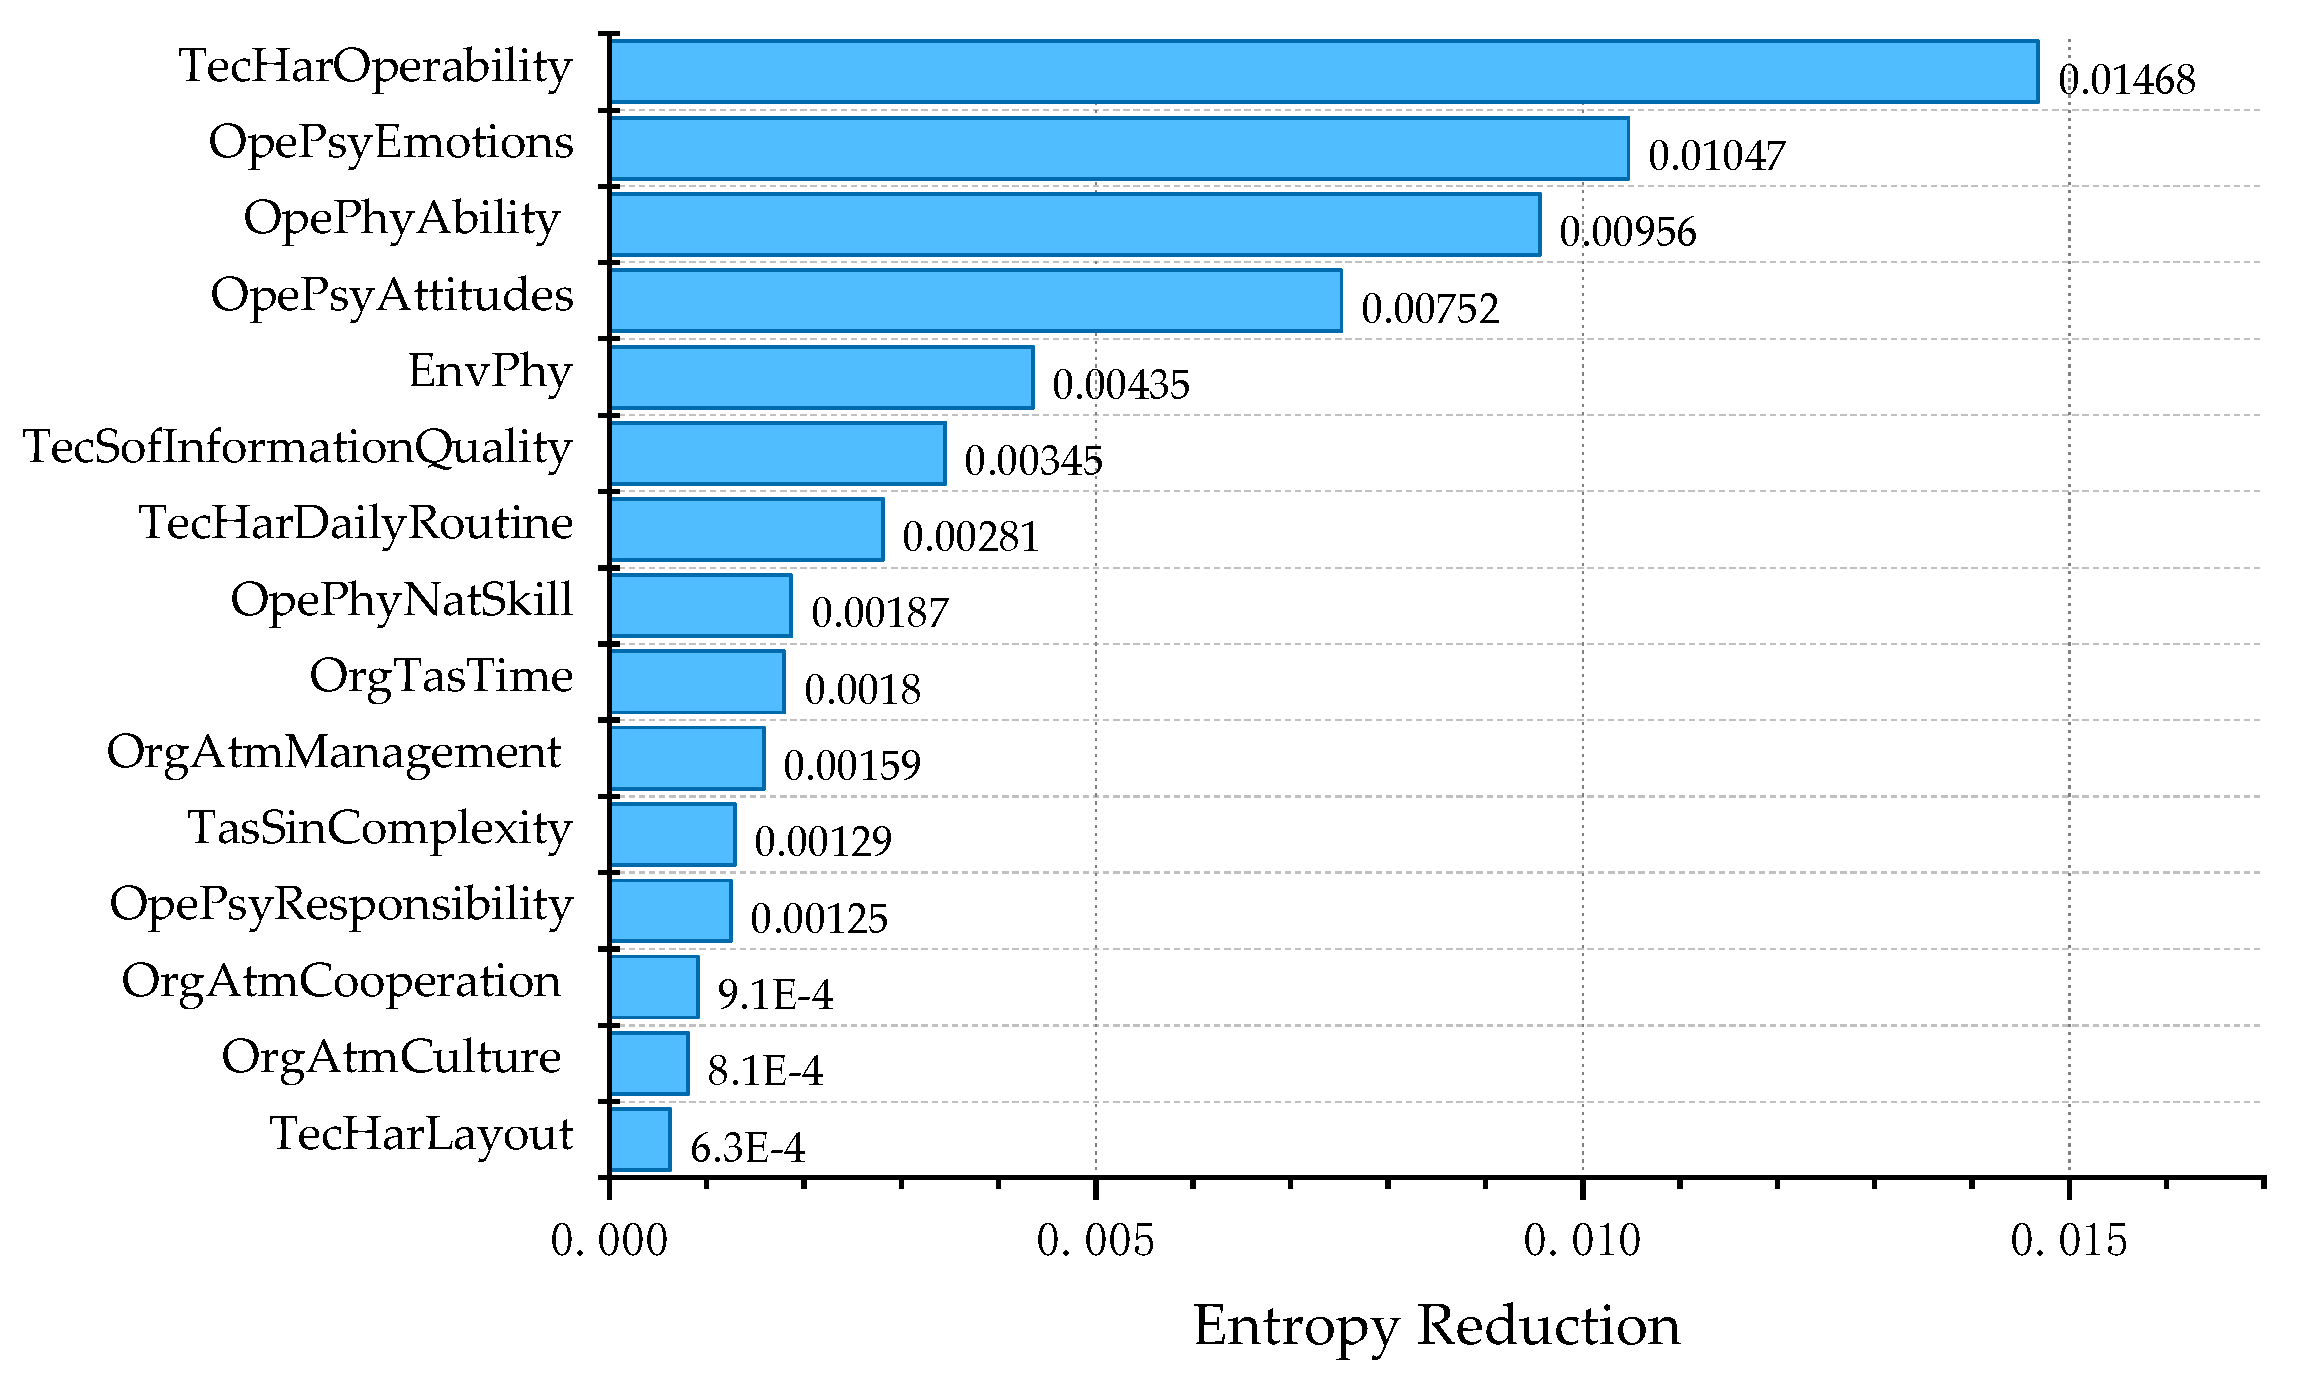
4.4. Sensitivity Analysis

The model is validated and analyzed, and its results can help us to identify the main root causes of failures in dam engineering, to reduce the risk and prevent accidents. Validation models can use sensitivity analysis, response analysis, external validation, and other methods. In the Bayesian network approach employed in reliability analysis, the validation methods for hardware and structure reliability are based on real data, simulated data and comparative modeling, while the validation methods for software reliability are based on real data and based on contrastive modeling. In contrast, when studying human reliability, since obtaining real or even simulated data is very difficult, validation is performed only using contrast-based modeling [45]. Since the dam safety field does not have as many pre-existing HRA analysis models as the nuclear power plant and maritime fields, the three principles proposed in the literature [38] are considered, which are:
  • a small increase/decrease in the a priori subjective probability of each parent node should be matched by a corresponding increase/decrease in the posterior probability of the child nodes;
  • the impact of subjective probability changes of each parent node on the child nodes should remain the same;
  • the total magnitude of the impact of changes in the probability of x needs to be always larger than the ensemble x − y (y∈x).
It is verified that the model satisfies these three axioms. Taking the node “Operator Physiological Ability”, for example, when the positive status of its parent node “Operator Physiological Age” changes from 95% to 100%, the positive status of the child node changes from 86.0% to 87.3%. When the positive state of “Organization Task allocation Staff assign” also changes from 95% to 100%, the positive state of the child node changes to 88.7%. Also, when the positive state of “Environment Engineering” becomes 100%, it increases to 90%. By increasing each influence node, the posterior probability of the corresponding child node also appears to grow. The impact of each parent node remains consistent and meets the requirement. Through this approach, the model was validated.
Sensitivity analysis is the process of assuming inaccurate node data, introducing changes into each node, and observing changes in the remaining nodes to understand the importance and interdependence of each node. In the process of risk evaluation and analysis, it is important to focus on preventing and controlling the obtained critical nodes in order to efficiently improve the reliability and reduce the probability of failure.
The Entropy Reduction in the Shannon’s Mutual Information measure [46] is used for sensitivity analysis. Also known as mutual information between two variables, it is the decrease in the expectation of its child node Q due to a change in the node F. The entropy reduction takes values in the interval [0, H(Q)], and is 0 when Q is independent of F. The calculation formula is as follows, and the result is “bits”:
I Q , F = H Q H Q F = f D o m F   q D o m Q Pr q , f   ·   log 2 Pr q , f Pr q · Pr f ,
In Equation (9), Q is the query variable; F is the varying variable; q, f is a particular state of Q and F, respectively; H Q = q D o m ( Q ) P r ( q ) · log 2 P r ( q ) is the entropy of variable Q; H Q F is the entropy reduction in Q given the state of F; I Q , F is the entropy reduction in Q relative to F.
The idea implied in the formula is that the greater the entropy reduction in a child node caused by a change in the parent node, the greater the contribution of the parent node to it, for modeling Bayesian networks for dam failure accidents; that is, the PSF nodes with the greater influence on the final probability.
For the final result node, the Human Reliability node, the entropy reduction is performed using Equation (9) and the results are shown in Figure 13. Observation of the results obtained from the sensitivity analyses reveals that the factors with the greatest impact are Operator Psychological Responsibility, Operator Psychological Habits, Operator Quality Professional Skills, Task Single Time, Operator Psychological Attention. It can be observed that the higher-sensitivity ones are mainly related to the quality attributes of field operators, such as responsibility, habit, professional skill, attention, and mental quality. Due to the fact that operators are the main body of the monitoring and operation execution, the human behaviors are inevitably the most important factors affecting the human reliability. Also, Task Time has a direct impact on reliability. The Human Cognitive Reliability (HCR) methodology founded by the American Electric Power Research Institute EPRI is to quantify shift operations for a finite period of time, mainly considering the probability of operator error under time-critical emergency conditions [47]. This method utilizes the allowable time Td and execution time T1/2 for calculation, considering only the time factor. After the operator factors, there are the related factors of the organization, including training, management, culture, cooperation and so on. Organizational factors are the deeper factors affecting the accidents and have an impact on the final results by acting on the operators.
A further sensitivity analysis of the five factors with higher sensitivity lists the top fifteen ones with the greatest entropy reduction, as shown in Figure 14, Figure 15, Figure 16, Figure 17 and Figure 18.
For the node Operator Psychological Responsibility, the factor with greater entropy reduction is firstly the Operator Psychological Habits, the personal habitat of the operator, which is not only inherent, but can be cultivated later on. This emphasizes the importance of the organization’s selection and development of operators. Organization Atmosphere Management, Organization Atmosphere Training, Organization Atmosphere Culture, Organization Atmosphere Cooperation, and Technology Hardware Daily Management all have a significant impact on accountability after this.
For Operator Psychological Habits, the main factor with higher entropy reduction is Operator Psychological Responsibility; the two directly reinforce and influence each other and are important reflections of the quality factor of the operator. The Operator Psychological Character is much less sensitive. This is followed by organizational factors related to Work Regulations, Management, Culture, and Training.
For the factor Operator Quality Professional Skills, the factor with the highest sensitivity is Organizational Training, with an entropy reduction about twice that of the second-place Organization Culture, and its entropy reduction value is also about twice that of the third-place Organization Management. After that, the personal factors of Experience, IQ, and Knowledge are the same. This can lead us to think about how to reduce the error rate more efficiently and economically. For example, it is often difficult, even impossible, to improve the intelligence of operators, yet it is relatively easy to train them on the subject.
For the factor Task Single Time, the nodes with large entropy reduction are Organization Atmosphere Cooperation, Task Single Complexity, Operator Physiological Natural Skills, Organization Atmosphere Management, Technology Hardware Daily Routine. And for Operator Psychological Attention, it is Technology Hardware Operability, Operator Psychological Emotions, Operator Physiological Ability, Operator Psychological Attitudes, and Environment Physical factors.
Through the study of these influencing factors, it can be found that for the final human reliability, the first and foremost influence lies in the quality and psychological factors of the front-line operators themselves. This is owing to the fact that the operator is the main body in the management of dams and is the implementer of the act to carry out surveillance and observation and to operate the hardware and software facilities. The operator’s physical and psychological quality factors will directly affect the reliability of the person, resulting in the error probability being affected. However, behind the subject operator, the deeper causes are the organization’s culture, management, training and other institutional elements, which are the system’s deep defense mechanisms and the root causes.
Through the sensitivity analysis, it can be seen that the management personnel are directly related to the dam project, so it is particularly important for their training and education, physiological and psychological quality maintenance. At the same time, it is necessary to pay attention to the cultivation of organizational safety culture, highly emphasize the importance of safety, refine the management mechanism, increase the number of safety training courses, constantly update the maintenance of the hardware and software, and enhance the operating environment of the management engineers.

5. Conclusions

This study introduces human reliability analysis into dam risk assessment, focusing on accidents associated with dam failure pathways under extreme weather conditions. The models obtained from the discussion are generic and are not set to a specific reservoir. The database analysis is based on typical domestic and international historical dam failure accidents and is somewhat generalized. Therefore, this work can shed light on the human factors that need to be taken care of in extreme weather and provide assistance in decision making for risk analysis and management. The main findings are as follows:
(1)
The paper firstly proposes a HRA analysis framework for dams incorporating Bayesian networks in the premise of existing methods from other domains, including four parts: familiarization, qualitative analysis, quantitative analysis and incorporation. The research methodology and process were systematically defined. Qualitative and quantitative analyses of human factors were conducted for the dam failure accidents.
(2)
By studying the path of human errors in the operation process of the dam failure accident, a cognitive model of the operator is proposed, which divides human actions into four processes, namely, “monitoring and awareness–state diagnosis–plan formulation–operation execution”. The human behavior model at each stage was analyzed and combined with the node failure model to obtain the performance shaping factors, or PSFs, in the dam failure incidents. PSFs are an important characterization of human influences, and their successful combination contributes greatly to the improvement of human reliability.
(3)
Using Bayesian networks to characterize the resulting PSFs and the interdependencies between each other and using entropy reduction information for sensitivity analysis. The results show that the operator directly affects human reliability and is the subject of the accident. In contrast, its deep root cause is the ineffectiveness of the management organization, and the system.
The model proposed in this study mainly accomplishes the conditional probabilities table, or CPT, using expert judgment methods. Due to the lack of data records for many human error accidents and the subjective nature of the expert judgment, the required precision in Bayesian probability calculations cannot be accomplished with a certain degree of uncertainty. Therefore, expert opinion can be combined with historical data by introducing fuzzy reasoning to improve the model. Furthermore, in Bayesian networks, due to the lack of relevant data, when the interpolation principle is used to calculate node dependencies, it is assumed that all parent nodes have the same weight value, which should be improved by introducing the relevant records in the dam failure database and using the assignment method to judge the weights of each node. Organizational factors are an essential part of human reliability analysis as well as a difficult issue that requires deeper consideration in future research.

Author Contributions

H.W. proposed methodology, ran the software and wrote the original draft preparation. D.L. conceived, reviewed and edited this paper, and administrated the project. T.S. and P.J. validated. J.S. conceived and supervised. D.Z. investigated and acquired funding. All authors have read and agreed to the published version of the manuscript.

Funding

This research was funded by the National Key R&D Program of China (2022YFC3005402), Central Public-Interest Scientific Institution Basal Research Fund (Y722004, Y723001).

Institutional Review Board Statement

Not applicable.

Informed Consent Statement

Not applicable.

Data Availability Statement

The data presented in this study are available on request from the corresponding author. The data are not publicly available due to privacy.

Conflicts of Interest

The authors declare no conflict of interest.

Appendix A

Examples of gate failure probability estimation tables and operator responsibility estimation tables are used to demonstrate qualitative and quantitative judgments of engineering and human factors in the dam failure event tree. When particular reservoirs and accidents are analyzed, qualitative evaluations can be obtained by drawing on the specific judgments in the descriptions to calculate the probability of failure at each node.
Table A1. Estimated table of gate failure probability.
Qualitative AssessmentDescriptionsFailure
Probability
The gate system is very reliable.
  • Multiple sets of power supplies with back-up power and reliable manual opening;
  • Through the review and inspection, the gate strength, stiffness, stability, opening and closing capacity of the opener can meet the requirements, and there is a certain margin;
  • There are careful inspections before and after the flood season to detect problems and report, maintain and overhaul them in a timely manner;
  • There was never a failure of gates opening during the inspection, and none in the operating records;
  • Highly strict gate management system with highly compliant operating procedures.
0.000001~0.0001 (Selected by experts on the basis of experience)
The gate system is reliable.
  • Multiple sets of power supplies with back-up power and reliable manual opening;
  • Through the review and inspection, the gate strength, stiffness, stability, opening and closing capacity of the opener can meet the requirements;
  • There are careful inspections before and after the flood season to detect problems and maintain and overhaul them in a timely manner;
  • There were occasional failures of gates opening during the inspection, and none in the operating records;
  • Strict gate management system with compliant operating procedures.
0.0001~0.01
The gate system is generally reliable.
  • Power supply available, with back-up power and reliable manual opening;
  • Through the review and inspection, the gate strength, stiffness, stability, opening and closing capacity of the opener can basically meet the requirements, and there is a certain margin;
  • There are inspections before and after the flood season to detect problems and maintain and overhaul them;
  • There were failures of gates opening during the inspection, and several in the operating records;
  • Generally strict gate management system with generally compliant operating procedures.
0.01~0.1
The gate system is unreliable.
  • Power supply available, without back-up power and manual opening;
  • Through the review and inspection, the gate strength, stiffness, stability, opening and closing capacity of the opener can barely meet the requirements, and there is a certain margin, metal corrosion, unprotected opener;
  • Although there are inspections before and after the flood season, maintenance and overhaul cannot be carried out in a timely manner;
  • There were several failures of gates opening during the inspection, and several in the operating records;
  • Management system in place but not very operational.
0.1~0.5
The gate system is very unreliable.
  • Power supply available, without back-up power and unreliable manual opening;
  • Through the review and inspection, the gate strength, stiffness, stability, opening and closing capacity of the opener cannot meet the requirements, and there is a certain margin, metal corrosion, unprotected opener;
  • There are only rough inspections before and after the flood season, which cannot be used to maintain and overhaul the problem;
  • There were a number of failures of gates opening during the inspection, and also in the operating records;
  • Absence of management systems and poor operationalization.
0.5~0.99
Table A2. Estimated table of operator responsibility.
Qualitative AssessmentDescriptionsFailure
Probability
The operator is very responsible.
  • Has never made a mistake in his/her work and is highly regarded by his/her leaders and colleagues;
  • Daily rounds of inspection and scheduling are carried out very carefully, and operations are performed in very strict accordance with the requirements;
  • Records the problems found during the inspection in detail and is able to report to the higher authorities and deal with them seriously in a timely manner;
  • Is able to carry out timely and correct repairs and maintenance on safety monitoring facilities, power distribution and opening and closing equipment in very strict accordance with requirements;
  • Multiple reservoir abnormalities have been identified, reported and addressed in a timely manner during past management.
0.000001~0.0001(Selected by experts on the basis of experience)
The operator is responsible
  • Has never made a mistake in his/her work in recent years and is well regarded by his/her leaders and colleagues;
  • Daily rounds of inspection and scheduling are carried out carefully, and operations are performed in strict accordance with the requirements;
  • Records the problems found during the inspection in detail and is able to report to the higher authorities and deal with them seriously;
  • Is able to carry out timely and correct repairs and maintenance on safety monitoring facilities, power distribution and opening and closing equipment in strict accordance with requirements;
  • Reservoir abnormalities have been identified, reported and addressed in a timely manner during past management.
0.0001~0.01
The operator is generally responsible
  • Has basically made no mistakes in his/her work in recent years, and is generally recognized by his/her leaders and colleagues;
  • Daily rounds of inspection and scheduling attitude is fair, and operations are basically carried out in accordance with the requirements
  • Records the problems found during the inspection and is able to report to the higher authorities and deal with them partly;
  • Is able to carry out repairs and maintenance on safety monitoring facilities, power distribution and opening and closing equipment in general accordance with requirements;
  • Significant reservoir abnormalities have been identified and reported in a timely manner during past management.
0.01~0.1
The operator is less responsible
  • Has made mistakes in his/her work in recent years and is not well recognized by his/her leaders and colleagues;
  • Daily rounds of inspection and scheduling attitude is not too serious and sometimes the operation cannot be executed in accordance with the requirements;
  • Barely records the problems found during the inspection and is unable to report to the higher authorities and deal with them in a timely manner;
  • Is seldom able to carry out repairs and maintenance on safety monitoring facilities, power distribution and opening and closing equipment in accordance with requirements;
  • Few significant reservoir abnormalities have been identified and reported in a timely manner during past management.
0.1~0.5
The operator is poorly responsible
  • Has made many mistakes in his/her work in recent years and is not recognized by his/her leaders and colleagues;
  • Daily rounds of inspection and scheduling attitude is very careless and the operation cannot be executed in accordance with the requirements;
  • Is unable to record the problems found during the inspection and report to the higher authorities and deal with them;
  • Is unable to carry out repairs and maintenance on safety monitoring facilities, power distribution and opening and closing equipment in general accordance with requirements;
  • No significant reservoir abnormalities have been identified and reported in a timely manner during past management.
0.5~0.99

References

  1. Xie, J.B.; Sun, D.Y. Statistics of dam failures in China and analysis on failure causations. Water Resour. Hydropower Eng. 2009, 40, 124–128. [Google Scholar]
  2. Hariri-Ardebili, M.A. Risk, reliability, resilience (R3) and beyond in dam engineering: A State-of-the-Art review. Int. J. Disaster Risk Reduct. 2018, 31, 806–831. [Google Scholar] [CrossRef]
  3. Zeng, X.; Lund, J.R.; Cai, X.M. Linear Versus Nonlinear (Convex and Concave) Hedging Rules for Reservoir Optimization Operation. Water Resour. Res. 2021, 57, 29160. [Google Scholar] [CrossRef]
  4. Ministry of Water Resources of the People’s Republic of China. General Office of the Ministry of Water Resources on Effectively Working on the Safety of Reservoirs in 2023 Flood; Ministry of Water Resources of the People’s Republic of China: Beijing, China, 2023.
  5. Li, H.E.; Ma, G.Z.; Wang, F.; Rong, W.J.; He, Y.J. Analysis of dam failure trend of China from 2000 to 2018 and improvement suggestions. Hydro-Sci. Eng. 2021, 101–111. [Google Scholar]
  6. Zhang, J.Y.; Yang, Z.H.; Jiang, J.P. Analyzing the risk and failure patterns of dams in China. Sci. Sin. Technol. 2017, 47, 1313–1320. [Google Scholar] [CrossRef]
  7. Li, L.; Wang, R.Z.; Sheng, J.B. Dam Risk Evaluation and Risk Management; China Water Conservancy and Hydropower Press: Beijing, China, 2006. [Google Scholar]
  8. Zhang, J.Y.; Sheng, J.B.; Cai, Y.B.; Li, Y. Key technologies for safety guarantee of reservoir dam. Water Resour. Hydropower Eng. 2015, 46, 1–10. [Google Scholar]
  9. Cai, Q. Research on Real-Time Risk Assessment and Dynamic Regulation Method of Earth and Rock Dams. Ph.D. Thesis, Nanjing Hydraulic Research Institute, Nanjing, China, 2018. [Google Scholar]
  10. Pei, L.; Chen, C.; He, K.; Lu, X. System Reliability of a Gravity Dam-Foundation System Using Bayesian Networks. Reliab. Eng. Syst. Saf. 2022, 218, 108178. [Google Scholar] [CrossRef]
  11. Chen, B.; Gu, C.S.; Bao, T.F.; Wu, B.B.; Su, H.Z. Failure Analysis Method of Concrete Arch Dam Based on Elastic Strain Energy Criterion. Eng. Fail. Anal. 2016, 60, 363–373. [Google Scholar] [CrossRef]
  12. Wu, Z.; Xu, B.; Gu, C.; Li, Z. Comprehensive Evaluation Methods for Dam Service Status. Sci. China Technol. Sci. 2012, 55, 2300–2312. [Google Scholar] [CrossRef]
  13. Peng, M.; Zhang, L.M. Analysis of Human Risks Due to Dam-Break Floods—Part 1: A New Model Based on Bayesian Networks. Nat. Hazards 2012, 64, 903–933. [Google Scholar] [CrossRef]
  14. Alvi, I. Human Factors in Dam Failures; ASDSO Dam Failure & Incidents Committee (DFIC): Lexington, KY, USA, 2013. [Google Scholar]
  15. UNE-EN 62508-2011; Guidance on Human Aspects of Dependability. ES-AENOR: Madrid, Spain, 2011.
  16. Zhang, L. Human Factors Reliability Analysis Techniques in Probabilistic Safety Evaluation; The Atomic Energy Press: Beijing, China, 2006. [Google Scholar]
  17. Lee, H.C.; Seong, P.H. A Computational Model for Evaluating the Effects of Attention, Memory, and Mental Models on Situation Assessment of Nuclear Power Plant Operators. Reliab. Eng. Syst. Saf. 2009, 94, 1796–1805. [Google Scholar] [CrossRef]
  18. Groth, K.M.; Swiler, L.P. Bridging the Gap between HRA Research and HRA Practice: A Bayesian Network Version of SPAR-H. Reliab. Eng. Syst. Saf. 2013, 115, 33–42. [Google Scholar] [CrossRef]
  19. Kirwan, B. The Development of a Nuclear Chemical Plant Human Reliability Management Approach: HRMS and JHEDI. Reliab. Eng. Syst. Saf. 1997, 56, 107–133. [Google Scholar] [CrossRef]
  20. Liu, Z.; Liu, Y.; Cai, B.; Zhang, D.; Zheng, C. Dynamic Bayesian Network Modeling of Reliability of Subsea Blowout Preventer Stack in Presence of Common Cause Failures. J. Loss Prev. Process Ind. 2015, 38, 58–66. [Google Scholar] [CrossRef]
  21. Martins, M.R.; Maturana, M.C. Human Error Contribution in Collision and Grounding of Oil Tankers. Risk Anal. 2010, 30, 674–698. [Google Scholar] [CrossRef]
  22. Yang, K.; Tao, L.Q.; Bai, J. Assessment of Flight Crew Errors Based on THERP. Procedia Eng. 2014, 80, 49–58. [Google Scholar] [CrossRef]
  23. Sheng, J.B.; Liu, J.X.; Zhang, S.C.; Xiang, Y.; Yang, Z.H. Investigation and analysis of failure mechanism of reinforced dams. Chin. J. Geotech. Eng. 2008, 30, 1620–1625. [Google Scholar]
  24. Li, D.D. Human Factors Reliability Studies in Dam Risks. Ph.D. Thesis, Nanjing Hydraulic Research Institute, Nanjing, China, 2012. [Google Scholar]
  25. Su, X.; Mahadevan, S.; Xu, P.; Deng, Y. Dependence Assessment in Human Reliability Analysis Using Evidence Theory and AHP: Dependence Assessment in Human Reliability Analysis Using Evidence Theory and AHP. Risk Anal. 2015, 35, 1296–1316. [Google Scholar] [CrossRef] [PubMed]
  26. Martins, M.R.; Maturana, M.C. Application of Bayesian Belief Networks to the Human Reliability Analysis of an Oil Tanker Operation Focusing on Collision Accidents. Reliab. Eng. Syst. Saf. 2013, 110, 89–109. [Google Scholar] [CrossRef]
  27. Christine, C.; Salim, L.; Gaël, M.; Jean-Pierre, C.; Benoît, L. Human and Organisational Factors in Maritime Accidents: Analysis of Collisions at Sea Using the HFACS. Accid. Anal. Prev. 2013, 59, 26–37. [Google Scholar]
  28. Liu, P.; Li, Z. Human Error Data Collection and Comparison with Predictions by SPAR-H: Human Error Data Collection and Comparison. Risk Anal. 2014, 34, 1706–1719. [Google Scholar] [CrossRef] [PubMed]
  29. Wen, D.S.; Bao, Y.K.; Zhang, Y.; Guo, C.X.; Fu, H.J.; Wang, J.G. Analysis of human reliability in power system operation and research on its database system. Power Syst. Prot. Control 2017, 45, 8. [Google Scholar]
  30. Basra, G.; Kirwan, B. Collection of Offshore Human Error Probability Data. Reliab. Eng. Syst. Saf. 1998, 61, 77–93. [Google Scholar] [CrossRef]
  31. O’Hara, J.M.; Brown, W.S.; Lewis, P.M.; Persensky, J.J. The Effects of Interface Management Tasks on Crew Performance and Safety in Complex Computer-Based Systems; U.S. Nuclear Regulatory Commission: Washington, DC, USA, 2002.
  32. Reason, J. Human Error; Cambridge University Press: New York, NY, USA, 1990. [Google Scholar]
  33. Li, P.C.; Wang, Y.Q.; Zhang, L. Analysis of human error modes and causal factors. Ind. Eng. Manag. 2006, 11, 6. [Google Scholar]
  34. Yang, Z.L.; Bonsall, S.; Wall, A.; Wang, J.; Usman, M. A Modified CREAM to Human Reliability Quantification in Marine Engineering. Ocean Eng. 2013, 58, 293–303. [Google Scholar] [CrossRef]
  35. Groth, K.M.; Mosleh, A. A Data-Informed PIF Hierarchy for Model-Based Human Reliability Analysis. Reliab. Eng. Syst. Saf. 2012, 108, 154–174. [Google Scholar] [CrossRef]
  36. Jiang, Y.J.; Sun, Z.Q. A systematic taxonomy for performance shaping factor. China Saf. Sci. J. 2010, 20, 6. [Google Scholar]
  37. Podofillini, L.; Dang, V.N. A Bayesian Approach to Treat Expert-Elicited Probabilities in Human Reliability Analysis Model Construction. Reliab. Eng. Syst. Saf. 2013, 117, 52–64. [Google Scholar] [CrossRef]
  38. Cai, B.; Liu, Y.; Zhang, Y.; Fan, Q.; Liu, Z.; Tian, X. A Dynamic Bayesian Networks Modeling of Human Factors on Offshore Blowouts. J. Loss Prev. Process Ind. 2013, 26, 639–649. [Google Scholar] [CrossRef]
  39. Groth, K.M.; Smith, C.L.; Swiler, L.P. A Bayesian Method for Using Simulator Data to Enhance Human Error Probabilities Assigned by Existing HRA Methods. Reliab. Eng. Syst. Saf. 2014, 128, 32–40. [Google Scholar] [CrossRef]
  40. Li, P.C.; Chen, G.H.; Zhang, L.; Xiao, D.S. A human factors reliability analysis method integrating organizational Factors. Nucl. Power Eng. 2010, 31, 82–86. [Google Scholar]
  41. Zhou, Q.; Wong, Y.D.; Loh, H.S.; Yuen, K.F. A Fuzzy and Bayesian Network CREAM Model for Human Reliability Analysis—The Case of Tanker Shipping. Saf. Sci. 2018, 105, 149–157. [Google Scholar] [CrossRef]
  42. Chen, S. Simulation of Earth-Rock Dam Failure Mechanism and Failure Process; China Water Resources and Hydropower Press: Beijing, China, 2012. [Google Scholar]
  43. Steven, G.V. Degrees of Belief: Subject Probability and Engineering Judgement; ASCE Press: Reston, VA, USA, 2002. [Google Scholar]
  44. USBR. Dam Safety Risk Analysis Methodology; Version 3.3; Technical Service Center: Washington, DC, USA, 1999.
  45. Cai, B.; Kong, X.; Liu, Y.; Lin, J.; Yuan, X.; Xu, H.; Ji, R. Application of Bayesian Networks in Reliability Evaluation. IEEE Trans. Ind. Inf. 2019, 15, 2146–2157. [Google Scholar] [CrossRef]
  46. Pearl, J. Chapter 3—Markov and Bayesian Networks: Two Graphical Representations of Probabilistic Knowledge. In Probabilistic Reasoning in Intelligent Systems; Pearl, J., Ed.; Morgan Kaufmann: San Francisco, CA, USA, 1988; pp. 77–141. [Google Scholar]
  47. Nakayasu, H.; Nakagawa, M.; Miyoshi, T.; Patterson, P. Human Cognitive Reliability Analysis on Drivers Using Simulator Experiments (Theory and Methodology, The 40th International Conference on Computers and Industrial Engineering (CIE 40)). J. Jpn. Ind. Manag. Assoc. 2012, 62, 278–285. [Google Scholar]
Figure 1. HRA analysis path.
Applsci 13 12968 g001
Figure 2. Basic path of operator behavior.
Applsci 13 12968 g002
Figure 3. The factors affecting reliability of monitoring and awareness phase.
Applsci 13 12968 g003
Figure 4. The factors affecting reliability of state diagnosis phase.
Applsci 13 12968 g004
Figure 5. The factors affecting reliability of plan formulation phase.
Applsci 13 12968 g005
Figure 6. The factors affecting reliability of operation execution phase.
Applsci 13 12968 g006
Figure 7. Causality diagram for the basic path of human error.
Applsci 13 12968 g007
Figure 8. Model of Human Error in Dam Failure Accidents. (Note: Black boxes indicate multiple levels of defense in depth).
Applsci 13 12968 g008
Figure 9. Typical chart of human error in dam failures.
Applsci 13 12968 g009
Figure 10. The event tree for dam failures due to over-standard flooding during extreme weather.
Applsci 13 12968 g010
Figure 11. The event tree of “unsuccessful dispatch–failed intervention”. Different colors represent different states. Green represents successful behavior, and red represents unsuccessful behavior.
Applsci 13 12968 g011
Figure 12. The Bayesian networks.
Applsci 13 12968 g012
Figure 13. Sensitivity analysis of the factors affecting human reliability.
Applsci 13 12968 g013
Figure 14. Sensitivity analysis of the factors affecting Operator Psychological Responsibility.
Applsci 13 12968 g014
Figure 15. Sensitivity analysis of the factors affecting Operator Psychological Habits.
Applsci 13 12968 g015
Figure 16. Sensitivity analysis of the factors affecting Operator Quality Professional Skills.
Applsci 13 12968 g016
Figure 17. Sensitivity analysis of the factors affecting Task Single Time.
Applsci 13 12968 g017
Figure 18. Sensitivity analysis of the factors affecting Operator Psychological Attention.
Applsci 13 12968 g018
Table 1. Causes of human errors.
Work ProcessReasons for ErrorsFailure Mode
Monitoring and awarenessObservation of targeting errorTarget error
Failure to detect in timeTime error
State diagnosisDelayed diagnosisTime error
Wrong diagnosisTarget error
Plan formulationIrrational distribution of tasksBehavior error
Unreasonable planningSequence/target error
Excessive decision timeTime error
Operation executionFailure of operationBehavior/Sequence/target error
Insufficient teamworkBehavior error
Table 2. Performance shaping factors (PSFs) in dam failure accidents.
Main CategorySubcategoriesSpecific Elements
OperatorPhysiological factorsAge; Physical ability; Natural skills; Intelligence level
Psychological factorsPersonality; Emotions; Attitudes; Mental Qualities; Attention; Habits; Responsibility
Quality factorsKnowledge level; Experience; Professional skills
TechnologyHardware facilitiesHardware operability; Layout of control equipment; Automation level of control equipment; Equipment routine maintenance
Software facilitiesLevel of software automation; Advanced technologies; Layout of display equipment; Mode of displaying information; Shape and color of display instruments; Quality of information
Emergency planCompleteness; Alarm system
OrganizationOrganizational atmosphereCommunication and cooperation; Training quality; Operating procedures; Management system; Safety culture; Level of supervision
Task allocationPersonnel assignments; Duration of tasks
EnvironmentPhysical environmentSound; Light; Temperature; Humidity; Vibration; Air Quality
Social environmentSocial opinion; Publicity
Engineering environmentComfort; Safety
TaskSingle taskAvailable time; Complexity; Novelty
MultitaskNumber of tasks; Relevance
Table 3. CPT for Operator Quality Professional Skills node.
Operator Physical IQOperator Quality KnowledgeOperator Quality
Experience
Organization
Atmosphere
Training
kPositiveNegative
PositivePositivePositivePositive40.900.10
PositivePositivePositiveNegative30.700.30
PositivePositiveNegativePositive30.700.30
PositivePositiveNegativeNegative20.500.50
PositiveNegativePositivePositive30.700.30
PositiveNegativePositiveNegative20.500.50
PositiveNegativeNegativePositive20.500.50
PositiveNegativeNegativeNegative10.300.70
NegativePositivePositivePositive30.700.30
NegativePositivePositiveNegative20.500.50
NegativePositiveNegativePositive20.500.50
NegativePositiveNegativeNegative10.300.70
NegativeNegativePositivePositive20.500.50
NegativeNegativePositiveNegative10.300.70
NegativeNegativeNegativePositive10.300.70
NegativeNegativeNegativeNegative00.100.90
Disclaimer/Publisher’s Note: The statements, opinions and data contained in all publications are solely those of the individual author(s) and contributor(s) and not of MDPI and/or the editor(s). MDPI and/or the editor(s) disclaim responsibility for any injury to people or property resulting from any ideas, methods, instructions or products referred to in the content.

