Article

Polarization Transmission of Visible Light in Inhomogeneous Sea Fog Particle Environment

1
Jilin Provincial Key Laboratory of Space Optoelectronics Technology, Changchun University of Science and Technology, Changchun 130022, China
2
School of Optoelectronic Engineering, Changchun University of Science and Technology, Changchun 130022, China
*
Authors to whom correspondence should be addressed.
Appl. Sci. 2023, 13(2), 905; https://doi.org/10.3390/app13020905
Submission received: 4 November 2022 / Revised: 9 December 2022 / Accepted: 5 January 2023 / Published: 9 January 2023

Abstract

:
Sea fog is a weather phenomenon suspended in the ocean-atmosphere boundary layer. This phenomenon makes the horizontal visibility of the sea atmosphere less than 1 km. Sea fog reduces sea surface visibility. Moreover, the inhomogeneous sea fog particles in the transmission channel result in the absorption and scattering of photons, which seriously affect the performance of optical detection instruments. Polarization imaging detection can solve this problem. However, the evolution law of transmission characteristics between polarized light and inhomogeneous sea fog particles remains unclear. Therefore, we use the equivalent analysis method to improve Monte Carlo, and finally construct the inhomogeneous particle scattering model. The influence of wavelength and relative humidity on DOP (Degree of Polarization) was calculated by the model. The simulated sea fog was created using brine with a preset concentration, and then established an experimental system close to the actual sea fog environment. Indoor polarized light transmission experiments verified the inhomogeneous particle scattering model. Results showed that the accuracy of the inhomogeneous particle scattering model can reach more than 75%. In the visible band, the DOP decreases with the wavelength increase. DOP450 (Degree of Polarization at 450nm wavelength) is approximately 3–10% higher than DOP532, and DOP532 is approximately 5% higher than DOP671. The relative humidity increases from 45% to 85%, and DOP increases by 10–15%. Therefore, in the visible band, the wavelength and relative humidity are inversely proportional to DOP.

1. Introduction

Given the changes in the environment and the range of human activities, the detection of marine environmental targets has become a new research hotspot. Polarization devices are widely used in detecting and identifying marine environmental targets [1,2,3]. However, sea fog particles are complex and changeable. Lewis pointed out that the increase in relative humidity condenses the water vapor on the sea salt to form sea fog aerosol. The refractive index of sea fog particles changes with the change in relative humidity. They change from homogeneous particles to inhomogeneous particles [4]. In the polarized light transmission channel, inhomogeneous sea fog particles’ scattering effect changes polarized light’s information, directly reducing the working efficiency of marine activities [5]. Therefore, we must study the effect of inhomogeneous sea fog particles on laser polarization transmission.
With regard to the research on inhomogeneous particles, Tetsu Sakai used an atomizer to simulate inhomogeneous sea fog particles in the laboratory. The researcher also used polarized lidar to measure the depolarization rate of inhomogeneous sea fog particles. The measured results were compared with the calculated results of Mie scattering, and the obtained depolarization rate of inhomogeneous sea fog particles is 0.08 ± 0.01 [6]. Bi Lei used an inhomogeneous superellipsoid model to represent sea salt aerosols. The variation of the scattering coefficient with the wavelength when the incident wavelength is 0.2–5 μm was also discussed. The results showed that when the wavelength is between 0.2 and 0.4 μm, the scattering coefficient is proportional to the wavelength. Moreover, the scattering coefficient is inversely proportional to the wavelength when the wavelength is between 0.4 and 5 μm [7]. In China, Huang Honglian and Zhang Xiaolin used the equivalent analysis method to calculate the equivalent refractive index of the layered spherical particles. She selected the four mixing ratios (mixing ratio is the ratio of water particles and sea salt particles in the double-layer particle system) of 0.99, 0.9, 0.5, and 0.1 and the scale parameter range of 0.1–100. She also used the extinction efficiency factor to analyze the equivalence of the particles: only when the scale parameter x < 1 or x > 20, the equivalence of particles under different mixing ratios is good [8,9]. Jiang Huifen used Lorenz–Mie theory to calculate the scattering matrix elements after the photons were scattered by inhomogeneous particles. Moreover, she selected four groups of the imaginary parts of the environmental refractive index, 0, 0.001, 0.01, and 0.05, and also presented the element variation of the scattering matrix and the imaginary part of the environmental refractive index. The results showed that the smaller the imaginary part of the ambient refractive index is, the larger the elements of the scattering matrix are [10]. Li Yan used a turbidimeter to measure the scattering ability of inhomogeneous inorganic particles to light at 450, 550, and 700 nm. The author also calculated the scattering coefficient using the double-layer Mie scattering theory. The results showed that the scattering coefficient decreases with the increase in wavelength [11]. Zhang Yanhong used the Fresnel–Huygens principle to conduct simulation calculations. Then researchers discussed the DOP distribution of inhomogeneous polarized beams traveling in ocean turbulence. They found that the power exponent and proportionality coefficient of inhomogeneous polarized beams affected the DOP [12].
Most researchers used simulation calculations in the above citations. The simulation results are parameters that can characterize polarization characteristics, such as depolarization ratio, scattering coefficient, and scattering cross-section. However, to simulate the complete process of polarized light passing through the medium, it is not enough to only calculate the polarization characteristic parameters. Moreover, the simulation calculation and experimental verification of the subsequent polarization characteristic parameters of the outgoing light are lacking.
Given the above problems, we improved the Monte Carlo method, and established an inhomogeneous particle scattering model. It is based on the equivalent analysis method [8] and the relative humidity formula [7]. This research simulated the complete process of polarization transmission under different wavelengths and relative humidity conditions. Then we seriously analysed the trends and causes of DOP when wavelength and relative humidity changed. Compared with the accuracy of LowTran, ModTran, 6S, RT3, and other models at approximately 60% [13,14,15,16], the accuracy of the inhomogeneous particle scattering model in this research can reach more than 75%. We also use the preset concentration of salt water as the generating liquid to create simulated sea fog. Moreover, we established an experimental system close to the actual sea fog environment. Finally, we verify the inhomogeneous particle scattering model through laboratory experiments and replenish the solution to polarized transmission in inhomogeneous sea fog particle environments. We also provide theoretical support for polarization imaging and target detection.

2. Establishment of an Inhomogeneous Particle Scattering Model

2.1. Equivalent Analysis Method

Inhomogeneous aerosol particles have two mixing states: outer mixing state and inner mixing state. An inner mixed state means that a single particle in the system is a mixture of multiple aerosol components, and each particle exhibits the common physical and chemical properties of multiple components. The homogeneous sphere model or the layered sphere model is generally used for the particles in the mixed state. The sea fog aerosol in this research adopts the layered sphere model. In particular, the sea fog aerosol is composed of sea salt and water, the sea salt particles are used as condensation nuclei, and the sea salt is wrapped with a homogeneous water shell to form inhomogeneous sea fog particles.
The aerosol particles in the actual sea fog are mostly complex mixtures composed of different components, and no fixed complex refractive index exists because of different components. Therefore, we use the equivalence analysis of light scattering parameters to obtain the complex refractive index of complex mixtures.
The specific steps of the equivalence analysis method are as follows:
(1) The double-layer spherical particle model is shown in Figure 1. First, the water particles’ refractive index is m 1 = n 1 + i k 1 , and the sea salt particles’ refractive index is m 2 = n 2 + i k 2 . Water particles are determined as the outer shell, and sea salt particles are determined as the inner core. The corresponding scale parameters x 1 = 2 π a / λ , x 2 = 2 π b / λ are calculated according to the radius a of the water particle and the radius b of the sea salt particle. f = b / a is set as the mixing ratio, which is the ratio of water particles and sea salt particles in the whole double-layer particle system. The above parameters are substituted into the double-layer Mie scattering program to calculate the following optical parameters of inhomogeneous sea fog particles: extinction efficiency k e x t , scattering efficiency k s c a , and absorption efficiency k a b s .
(2) The inhomogeneous sea fog particles are equivalently regarded as homogeneous spherical particles with a radius of a and refractive index of m = n + i k [8]. The scale parameter is x = 2 π a / λ . The optical parameters of the equivalent particles: extinction efficiency Q e x t , scattering efficiency Q s c a , and absorption efficiency Q a b s , are calculated by Mie scattering theory.
(3) The relative difference ε between the optical parameters of inhomogeneous sea fog particles and equivalent particles are as follows [8]:
ε e x t = k e x t Q e x t k e x t
ε s c a = k s c a Q s c a k s c a s
ε a b s = k a b s Q a b s k a b s
Then, the relative difference between inhomogeneous sea fog particles and equivalent spherical particles is:
ε = ( ε e x t 2 + ε s c a 2 + ε a b s 2 ) / 3
When the relative difference between the double-layer spherical particles and the equivalent spherical particles is the smallest, the refractive index of the equivalent particles m is considered the equivalent refractive index of the inhomogeneous sea fog particles.
The refractive indices of water particles and sea salt particles in the visible band are m 1 = 1.33 + i 0.000196 , m 2 = 1.5 + i 0.0001 [17]. We used the equivalent analysis method to calculate the equivalent refractive index at seven mixing ratios: 0.1, 0.3, 0.4, 0.5, 0.7, 0.9, and 0.99. Table 1 shows the equivalent refractive indices corresponding to different mixing ratios. Figure 2 shows the relative differences corresponding to different mixing ratios.
Table 1 shows that when the mixing ratio is 0.3 < f < 0.4 , the equivalent refractive index is close to water particles’ refractive index. However, when the mixing ratio is 0.5 < f < 1 , the equivalent refractive index is close to of sea salt particles’ refractive index. That means the mixing ratio affects the inhomogeneous sea fog particles’ refractive index. Figure 2 shows that when the mixing ratio is 0.5, the relative difference is the smallest, and the calculated equivalent refractive index is closest to the actual situation. Therefore, the proposed method would be only valid for the mixing ratio of ~0.5.
The radius of the sea salt particles selected is b = 0.3   μ m [17]. Thus, the corresponding water particles’ radius is a = 0.6   μ m . The equivalent refractive index at different wavelengths can be calculated using the equivalent analysis method in the present section, as shown in Table 2.

2.2. Relative Humidity Formula

Given the hygroscopicity of sea fog particles, relative humidity becomes another factor which affects the equivalent refractive index of inhomogeneous particles. The relative humidity is defined as the ratio of water content to particle content in the medium environment. It can be calculated using the following formula [7]:
m = n w + ( n s n w ) [ r s r ( a w ) ] 3
r ( a w ) = r s [ 1 + ρ m w m s ( a w ) ] 1 3
a w = R H exp ( 0.001056 r a )
where n w is the refractive index of water particles, n s is the refractive index of sea salt particles, ρ is the concentration, m w / m s is the mass ratio of water particles to sea salt particles in the inhomogeneous sea fog particles, R H is the relative humidity, r s is the radius of the sea salt particles, and r a is the radius of the inhomogeneous sea fog particles, r ( a w ) can be solved from Equations (6) and (7) iteratively.
The relationship between relative humidity and refractive index can be obtained by combining Equations (5)–(7):
m = n w + ( n s n w ) ( 1 1 + ρ m w m s R H exp ( 0.001056 r a ) )
In an environment with high relative humidity (e.g., 99%), the particles of pure NaCl solution are spherical and homogeneous. As the relative humidity drops below 85%, the particle shape and refractive index changes because of deliquescence. Moreover, the particles are spherical and inhomogeneous at this time. When the relative humidity is lower than 45%, NaCl begins to crystallize, and the particles become nonspherical [7]. Therefore, we selected the relative humidity range: 45–85%, and a step size of 10% to study the inhomogeneous sea fog particles. The equivalent refractive index of the inhomogeneous particles is calculated according to Equation (8). The results are shown in Table 3.

2.3. Model Building Based on Polarization Monte Carlo Method

The radius a of the inhomogeneous sea fog particles is close to the incident wavelength λ . Thus, Mie scattering theory is used to solve the optical parameters that can characterize the optical properties [18]. According to Mie scattering theory, the calculation formulas of extinction efficiency Q e x t , scattering efficiency Q s c a , and absorption efficiency Q a b s are as follows:
Q e x t = 2 x 2 n = 1 ( 2 n + 1 ) Re ( a n ( ψ n , m , ξ n ) + b n ( ψ n , m , ξ n ) )
Q s c a = 2 x 2 n = 1 ( 2 n + 1 ) ( a n ( ψ n , m , ξ n ) 2 + b n ( ψ n , m , ξ n ) 2 )
Q a b s = Q e x t Q s c a
where m is the refractive index of inhomogeneous particle, x is the scale parameter of the equivalent particle. Given that ψ n and ξ n are Bessel functions, the calculation formulas of a n and b n in Equations (9) and (10) are as follows:
a n ( ψ n , m , ξ n ) = ψ n ( m x ) ψ n ( x ) m ψ n ( m x ) ψ n ( x ) ψ n ( m x ) ξ n ( x ) m ψ n ( m x ) ξ n ( x )
b n ( ψ n , m , ξ n ) = m ψ n ( m x ) ψ n ( x ) ψ n ( m x ) ψ n ( x ) m ψ n ( m x ) ξ n ( x ) ψ n ( m x ) ξ n ( x )
The magnitude of the scattering amplitude can be calculated using the obtained a n , b n and associated Legendre functions π n , τ n :
S 1 = n 2 n + 1 n ( n + 1 ) ( a n ( ψ n , m , ξ n ) π n + b n ( ψ n , m , ξ n ) τ n )
S 2 = n 2 n + 1 n ( n + 1 ) ( a n ( ψ n , m , ξ n ) τ n + b n ( ψ n , m , ξ n ) π n )
The Mueller matrix is used to relate the magnitude of the scattering amplitude to the Stokes vector:
S = M S , M = m 11 m 12 0 0 m 12 m 11 0 0 0 0 m 33 m 34 0 0 m 34 m 33
where:
m 11 = 1 2 ( S 1 2 + S 2 2 ) , m 12 = 1 2 ( S 1 2 S 2 2 ) m 33 = 1 2 ( S 1 S 2 S 1 S 2 ) , m 34 = i 2 ( S 1 S 2 S 2 S 1 )
Finally, the Stokes vector is used to calculate the DOP of the polarized light after the action of sea fog particles:
DOP = Q 2 + U 2 + V 2 I
Monte Carlo is a simulation method based on Mie scattering. This method uses repeated statistical experiments to simulate the scattering of photons during transmission. This method is chosen as the problem-solving tool, because it has fast convergence speed, high precision and the ability to simulate the original problem directly. However, the classical Monte Carlo method is only suitable for homogeneous particles. It cannot simulate the photon scattering in the transmission medium composed of inhomogeneous particles. Because this method does not consider the nonuniqueness of the particles’ refractive index; that is, the refractive index setting is just a simple input module. In response to this problem, we change the previous simple input module of refractive index to the input module of refractive index calculation. First, we set incident wavelength and relative humidity. Then, we use the equivalent analysis method and relative humidity formula in Section 2.1 and Section 2.2 to calculate the equivalent refractive index of inhomogeneous particles. The results are used as the simulation parameters for the next step of photon scattering. After the inhomogeneous particles scatter a large number of photons, the photons leave the transmission medium with polarization information. Finally, the transmission simulation of inhomogeneous particles is completed. The inhomogeneous particle scattering model based on Monte Carlo is constructed. Figure 3 shows the schematic diagram of the inhomogeneous particle scattering simulation.
The workflow of the inhomogeneous particle scattering model is as follows: First, the wavelength or relative humidity is set. The refractive index calculation input module calculates the corresponding equivalent refractive index through the equivalent analysis method or relative humidity formula. Parameters such as particle size, optical thickness, and photon number are also set. Then, photons are emitted. The sampling of the free path by photon scattering is performed. The scattering angle and azimuth angle are sampled by the rejection method, and the Stokes vector is updated after scattering. Finally, the photons pass through the boundary and leave the transmission medium. Figure 4 shows the flowchart of an inhomogeneous particle scattering model.

3. Indoor Simulation Experiment under Inhomogeneous Sea Fog Particle Environment

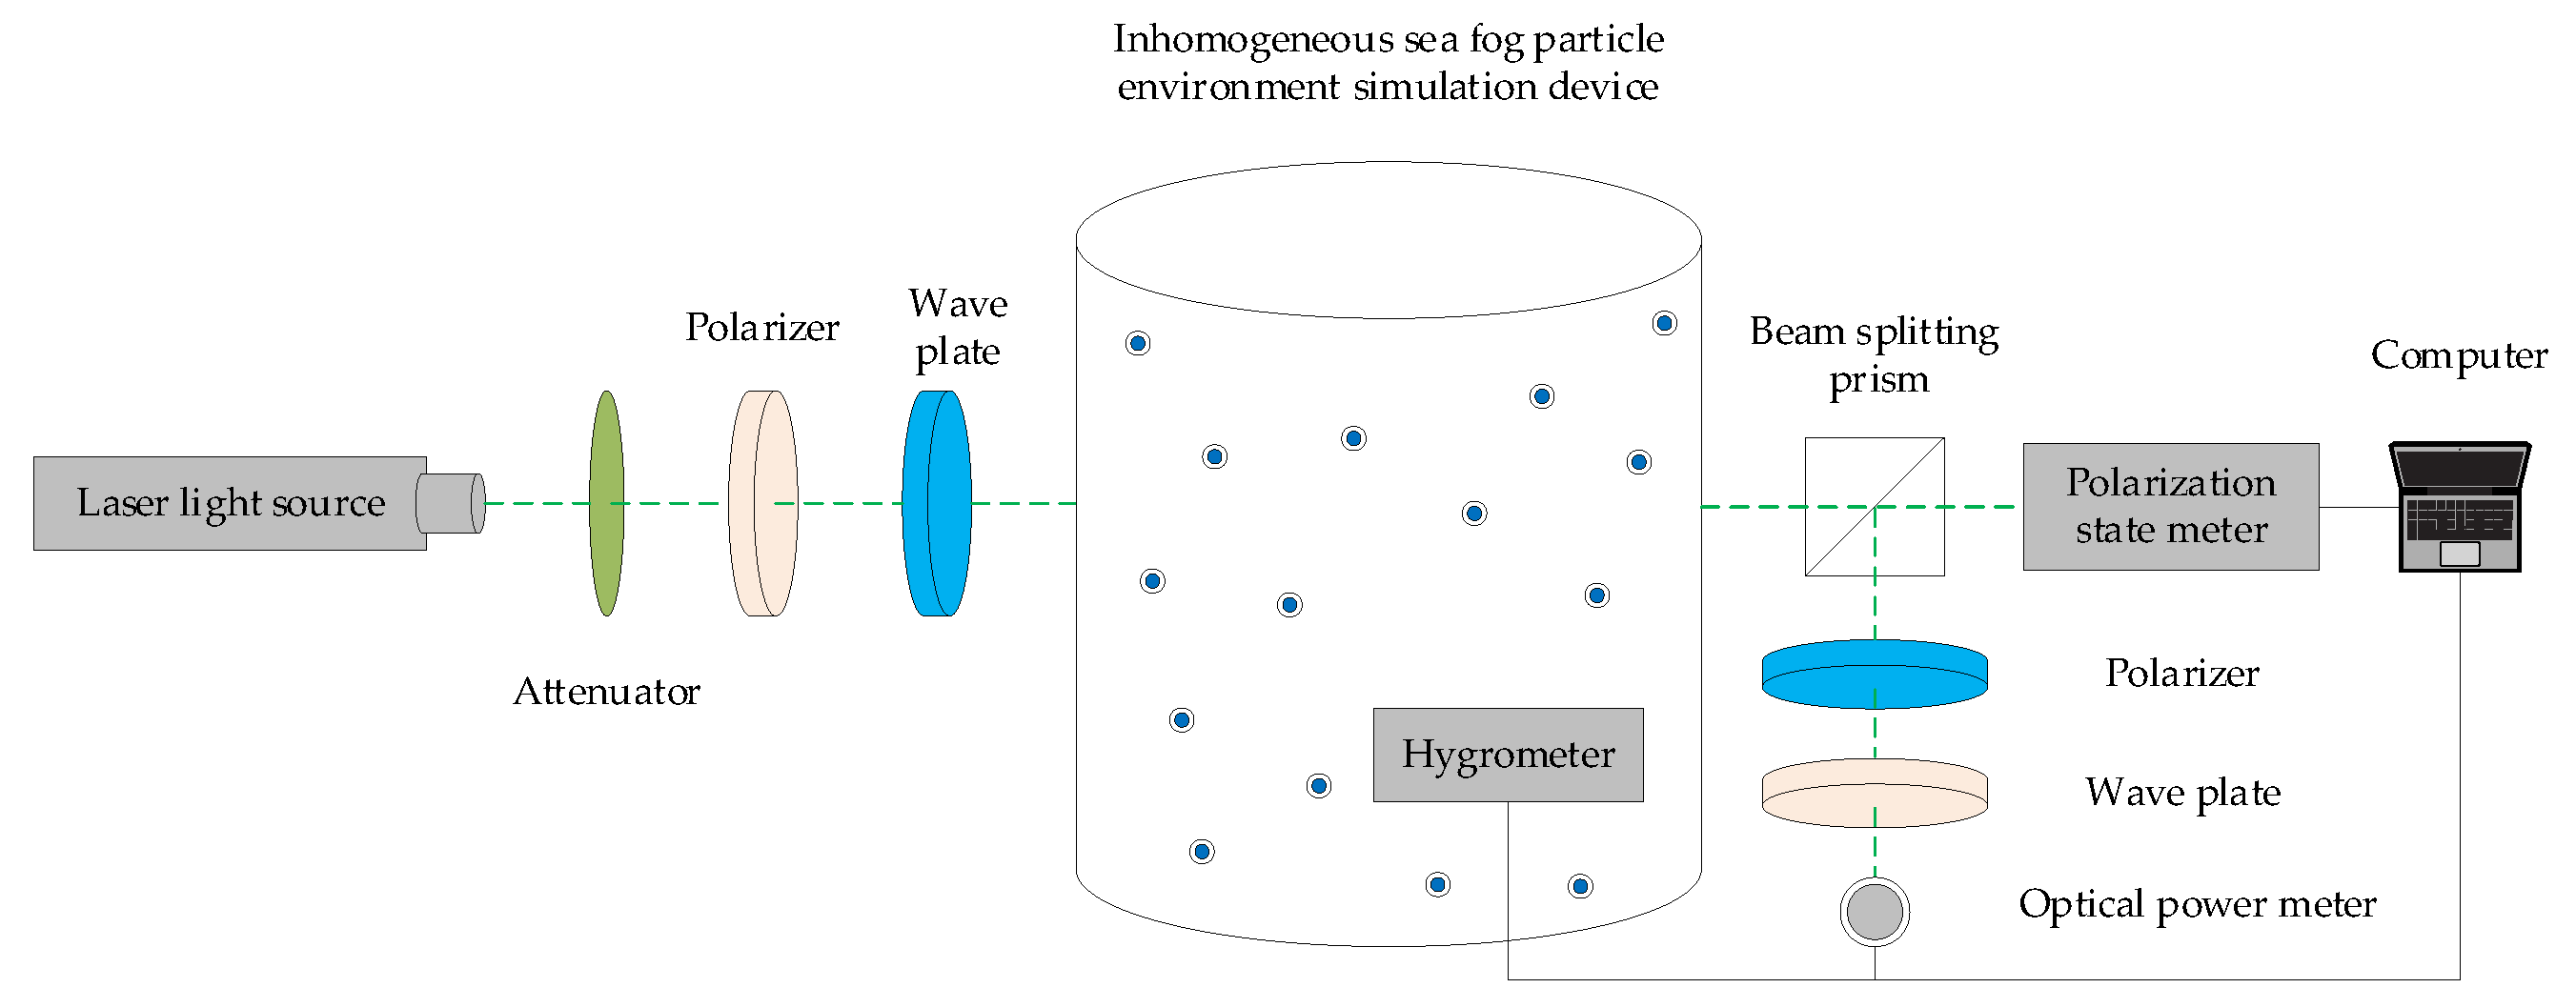
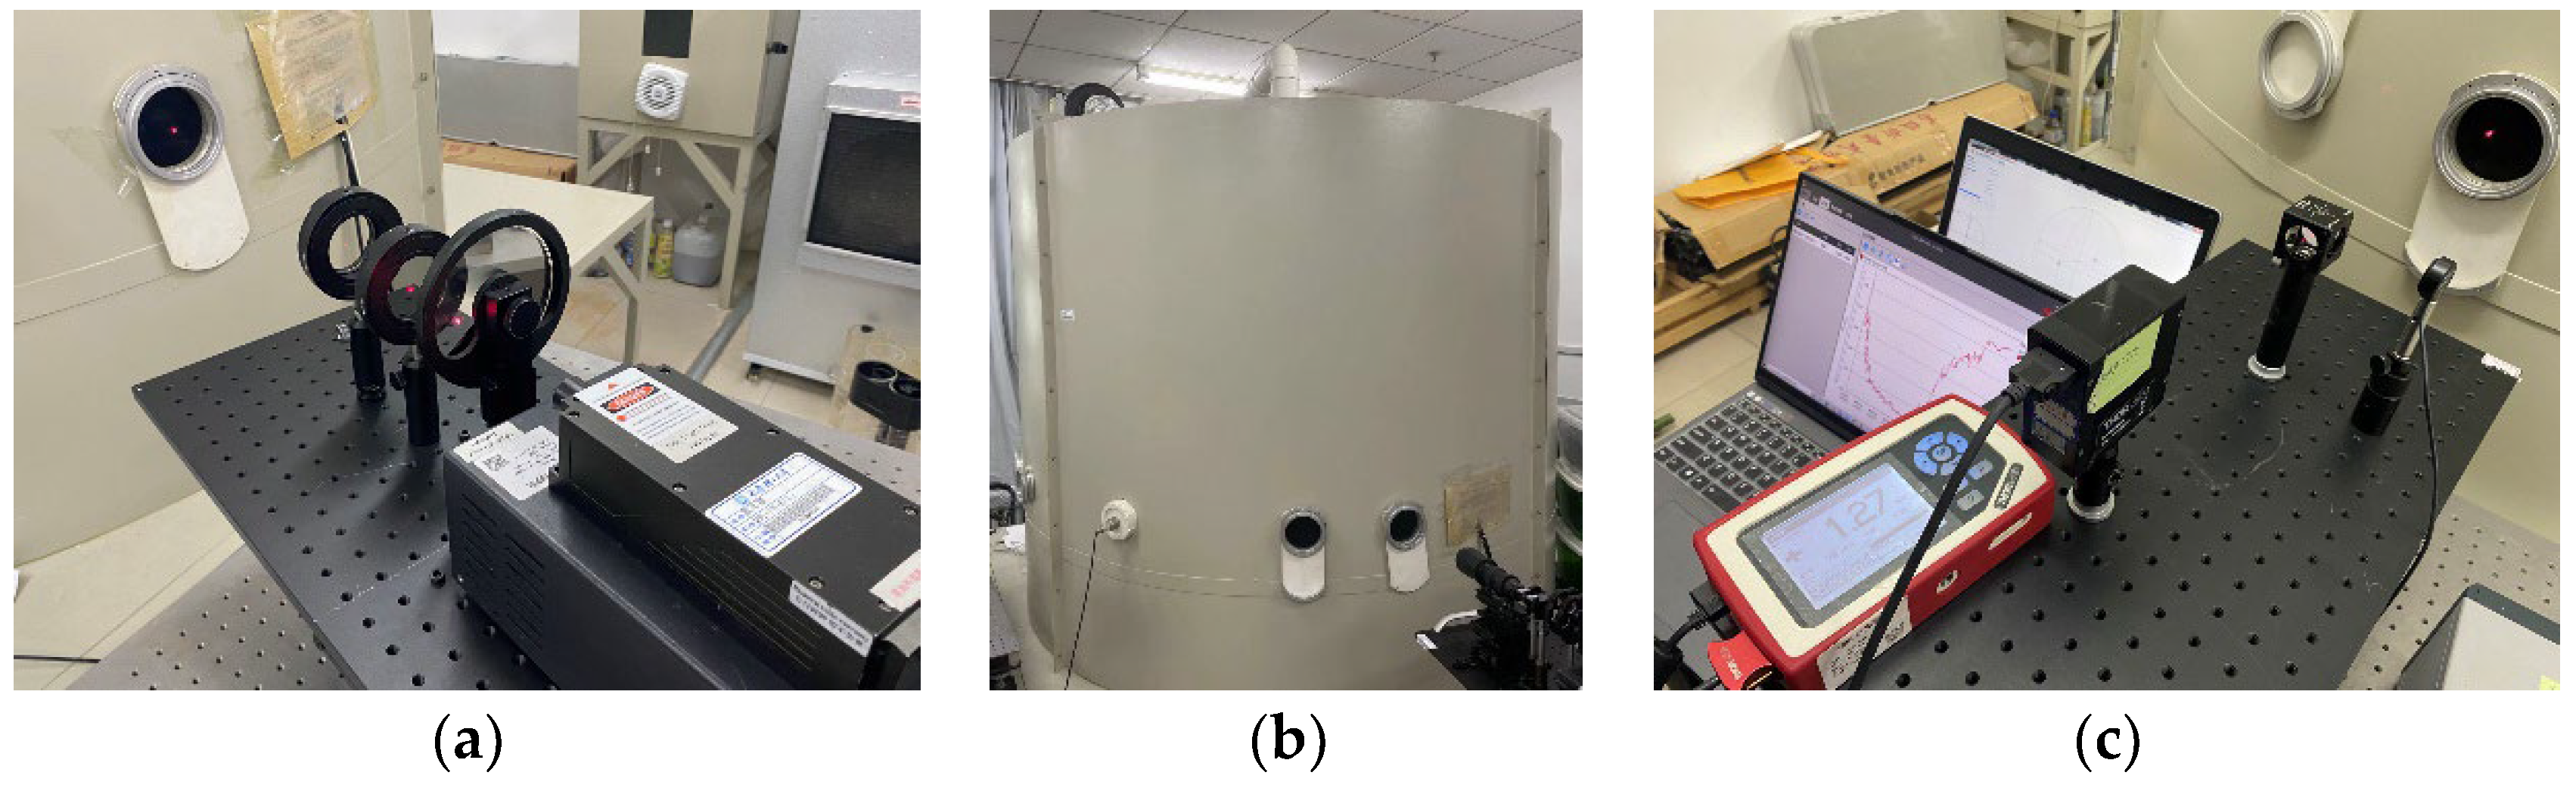
3.1. Experimental Setup

Figure 5 shows the diagram of an indoor simulation experiment device which can create an inhomogeneous sea fog particle environment. Figure 6 is a physical diagram of the device. The laser is used as a light source to emit laser light, and the attenuator is used to adjust the power of the incident light. The polarizer and 1/4 wave plate are used as a lens group to generate linearly the polarized light and circularly polarized light. The inhomogeneous sea fog particle environment simulation device is connected to an ultrasonic atomizer to generate salt fog. It can achieve the effect of simulating sea fog. The hygrometer in the simulation unit is used to measure and record the humidity of the simulated sea fog. The beam-splitting prism divides the outgoing light into two ways. One way is received by the polarization state meter, and the other is received by the optical power meter. The DOP and light intensity of the emitted light is measured. The computer is used for real-time monitoring and data processing.

3.2. Experiment Procedure

In this experiment, we would set eight groups of fog filling time, namely, eight salt fog concentrations. As well, we use optical thickness to characterize the salt fog concentration. According to the Beer–Lambert law, the incident light with a light intensity value of I 0 passes through the transmission medium and exits, and the outgoing light with a light intensity value of I is obtained. I and I 0 have the following relationship:
I = I 0 exp ( μ e L )
The calculation formula of the known optical thickness is τ = μ e L , and L is the thickness of the medium. The transmittance has the following calculation formula: T = I / I 0 . The relationship between the transmittance and optical thickness is as follows:
T = I I 0 = exp ( τ )
The relationship between fog filling time and optical thickness is shown in Table 4.
The test experiment is divided into two stages. In the first stage, the polarization transmission experiment is conducted with three wavelengths (450, 532, and 671 nm) as variables. In the second stage, the polarization transmission experiment is conducted with these five relative humidity conditions (45%, 55%, 65%, 75%, and 85%) as variables. Turning on the laser, and the experiment starts under eight different fog-filling time conditions. The incident polarized light is scattered, absorbed in the salt fog, and then exits the salt fog environment. The outgoing polarized light is divided into two by the beam splitter. One way is received by the optical power meter to obtain the light intensity value of the outgoing light, which is used to calculate the optical thickness. The other way is received by the polarization state measuring instrument to obtain the DOP of the outgoing light.

4. Results and Discussion

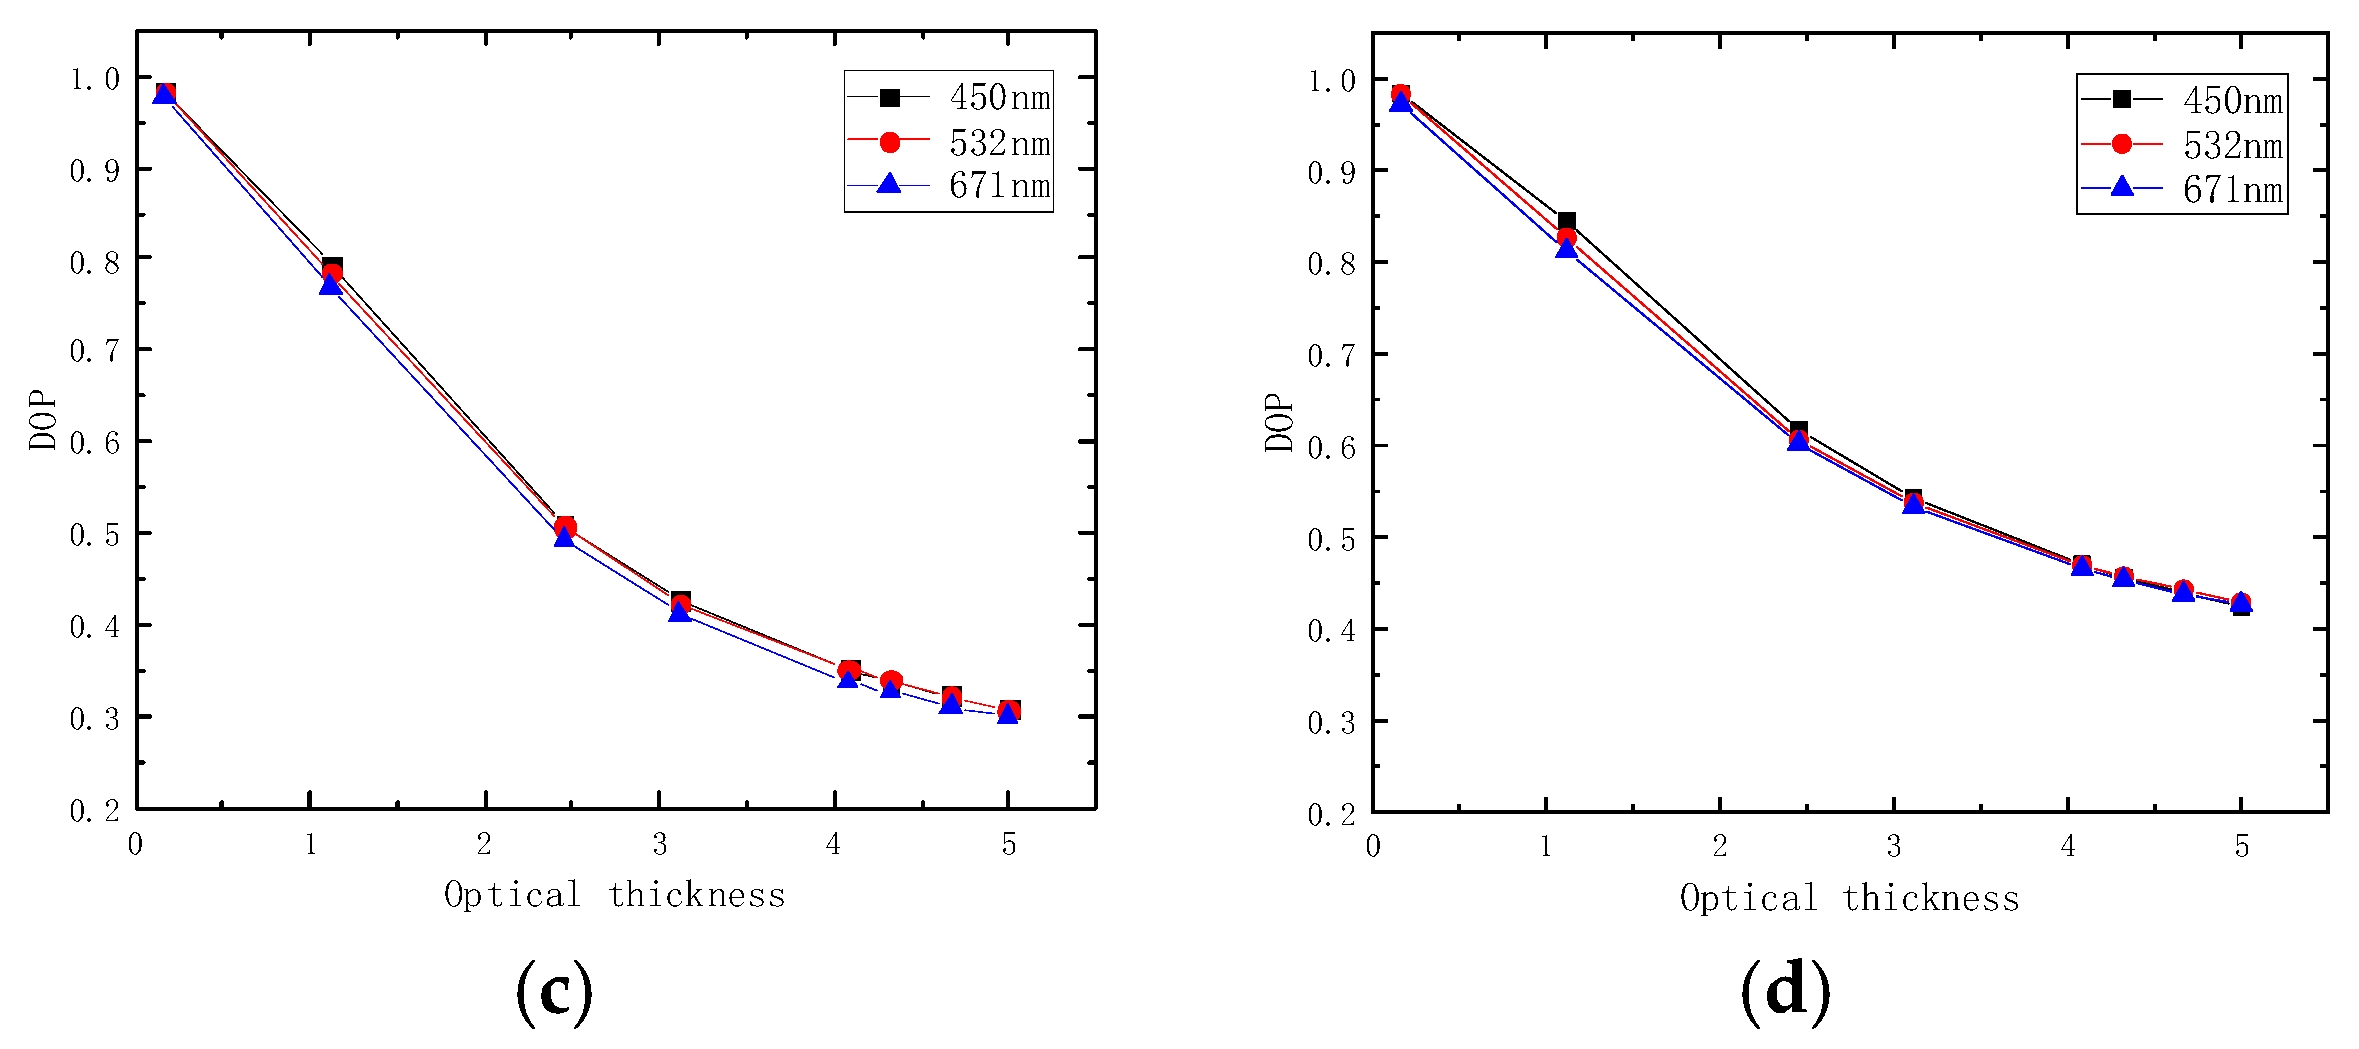
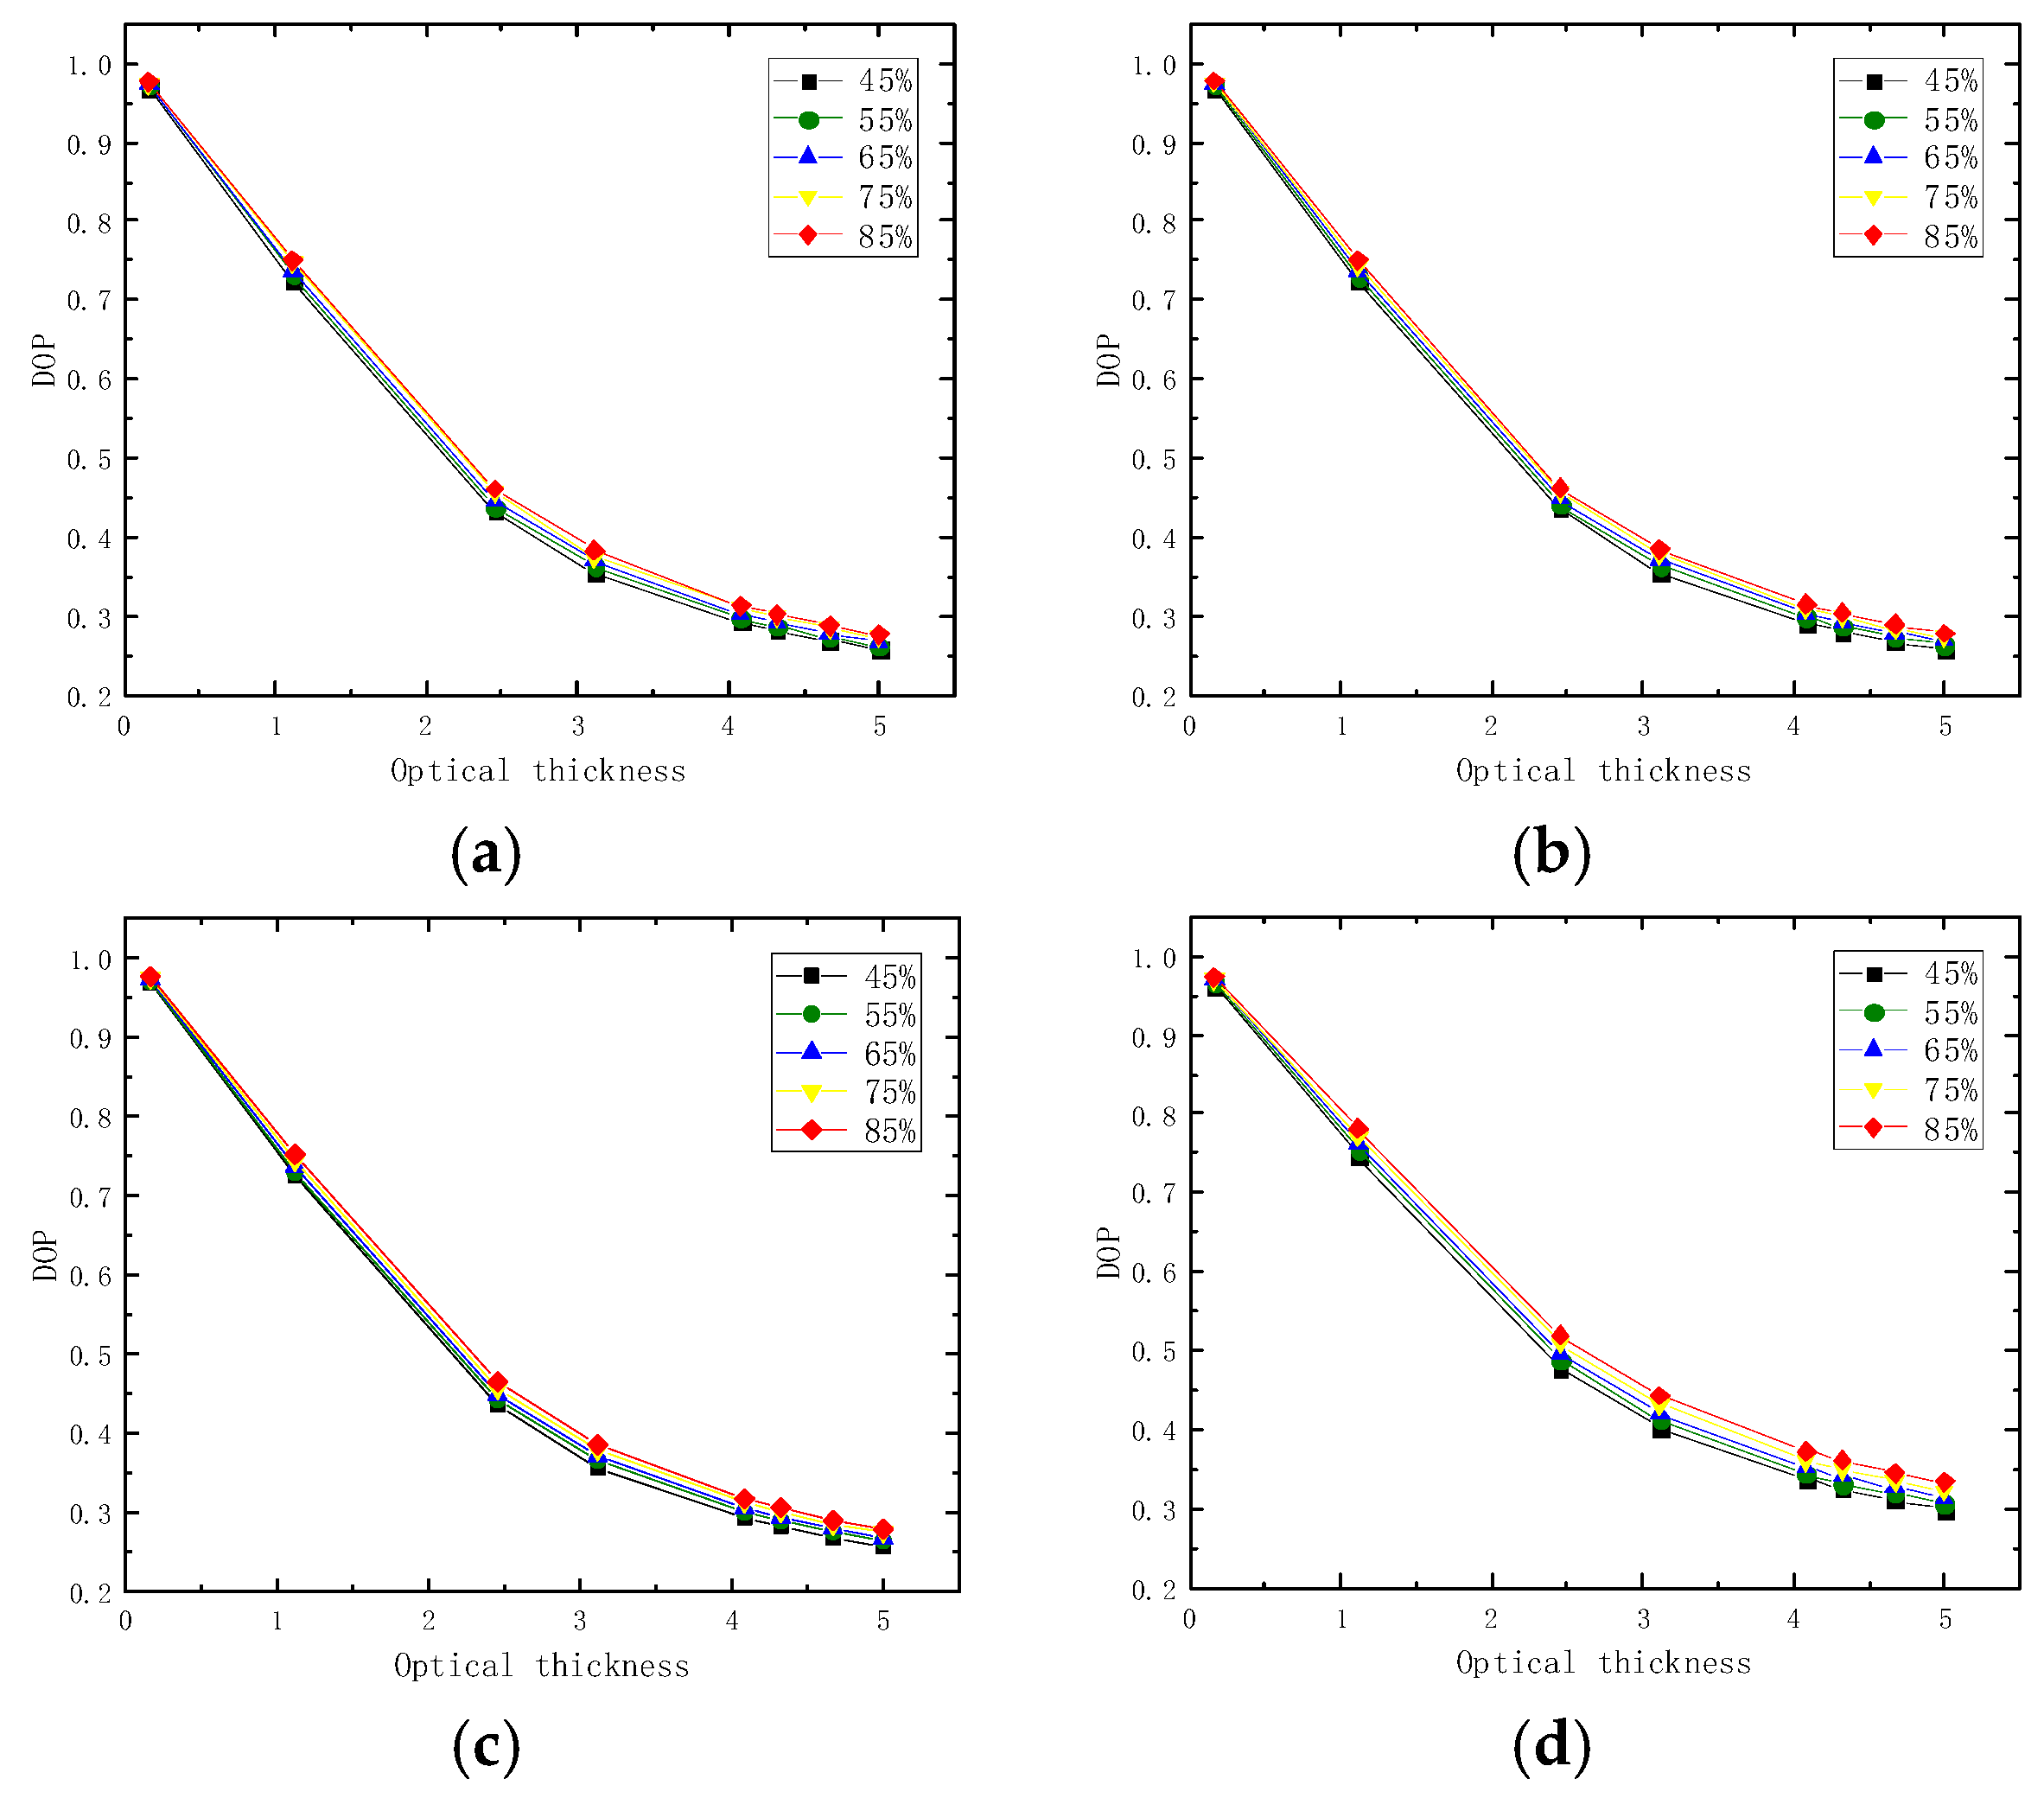
4.1. Simulation Results and Analysis

To study the effect of wavelength, we input the following parameters to simulate DOP: three incident wavelengths (450, 532, and 671 nm), four polarization states (0°, 45°, and 90° linearly polarized lights and right-handed circularly polarized light), and particle radius 0.6 μm. The values of the refractive index at different wavelengths are shown in Table 2, and the values of the optical thickness are shown in Table 4. The number of particles is 106. The curves are drawn according to the three groups of DOP values and optical thickness output by the simulation, as shown in Figure 7.
Figure 7 shows the simulation results of the inhomogeneous particle scattering model. The three DOP curves overlap because of the DOP difference of less than 1% for 0°, 45°, and 90° linearly polarized lights. For the three wavelengths of the polarized lights, the DOP of both circularly polarized light and linearly polarized light decreases with the increase of optical thickness. In particular, the concentration of inhomogeneous sea fog particle environment increases, thereby increasing the number of collisions of photons in the transmission medium. That will decrease DOP. The DOP difference between the circularly polarized light and linearly polarized light is approximately 30%, which is different from the difference in the beginning. Because the overall scattering effect of the sea fog environment is forward scattering, circularly polarized light’s polarization-maintaining ability is better than linearly polarized light. The linearly polarized light scatters to other states when the polarized light is transmitted in the forward scattering environment; however, this phenomenon does not occur with circularly polarized light [19].
The simulation data of 0°, 45°, and 90° linearly polarized lights and right-handed circularly polarized light of the three wavelengths are known. We use them to draw Figure 8 to compare the change of DOP under different wavelengths. In the visible band, the DOP decreases as the wavelength increases. DOP450 is approximately 3% higher than DOP532, and DOP532 is approximately 5% higher than DOP671. According to the scale parameter formula in Section 2.1, when the incident wavelength is smaller, the scale parameter is larger, and the equivalent refractive index of the particle is smaller. While the refractive index of the particles is smaller, the extinction effect of the particles is smaller. The photons carry more polarization information through the medium. Thus, DOP is inversely proportional to the wavelength at this time.
To study the effect of relative humidity on DOP, we input parameters such as: wavelength 532 nm, four polarization states (0°, 45°, and 90° linearly polarized lights and right-handed circularly polarized light), and particle radius 0.6 μm. The refractive index corresponding to relative humidity is shown in Table 3, and the optical thickness value is shown in Table 4. The number of particles is 106. The curve as shown in Figure 9 is drawn according to the DOP by the simulation. DOP shows an upward trend with an increase in relative humidity. The relative humidity increases from 45% to 85%, and DOP increases by approximately 10%. The relative humidity is defined as the ratio of the water content to the particle content of the medium; that is, when the relative humidity increases, the refractive index of inhomogeneous sea fog particles calculated from Equation (8) decreases. While the refractive index of the particles is smaller in the transmission medium, the extinction effect of the particles is smaller. The photons carry more polarization information through the medium. Thus, the DOP is proportional to relative humidity.

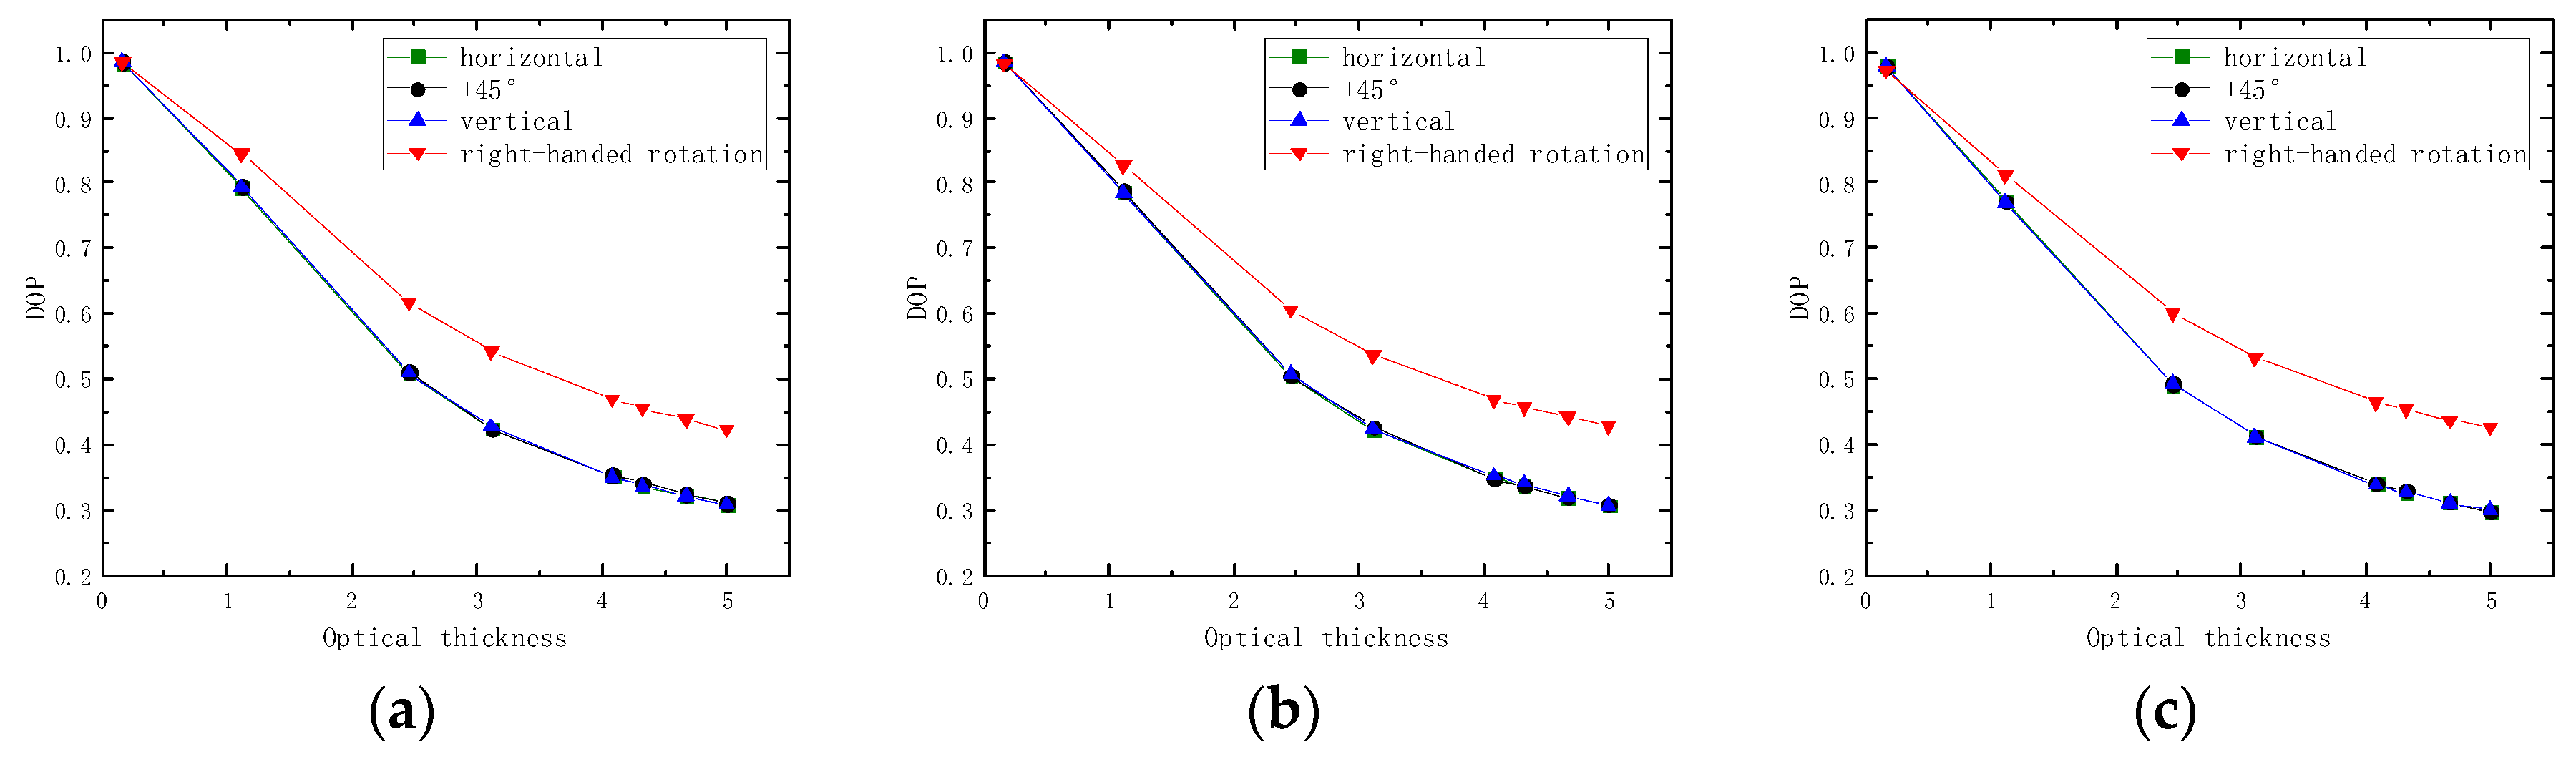
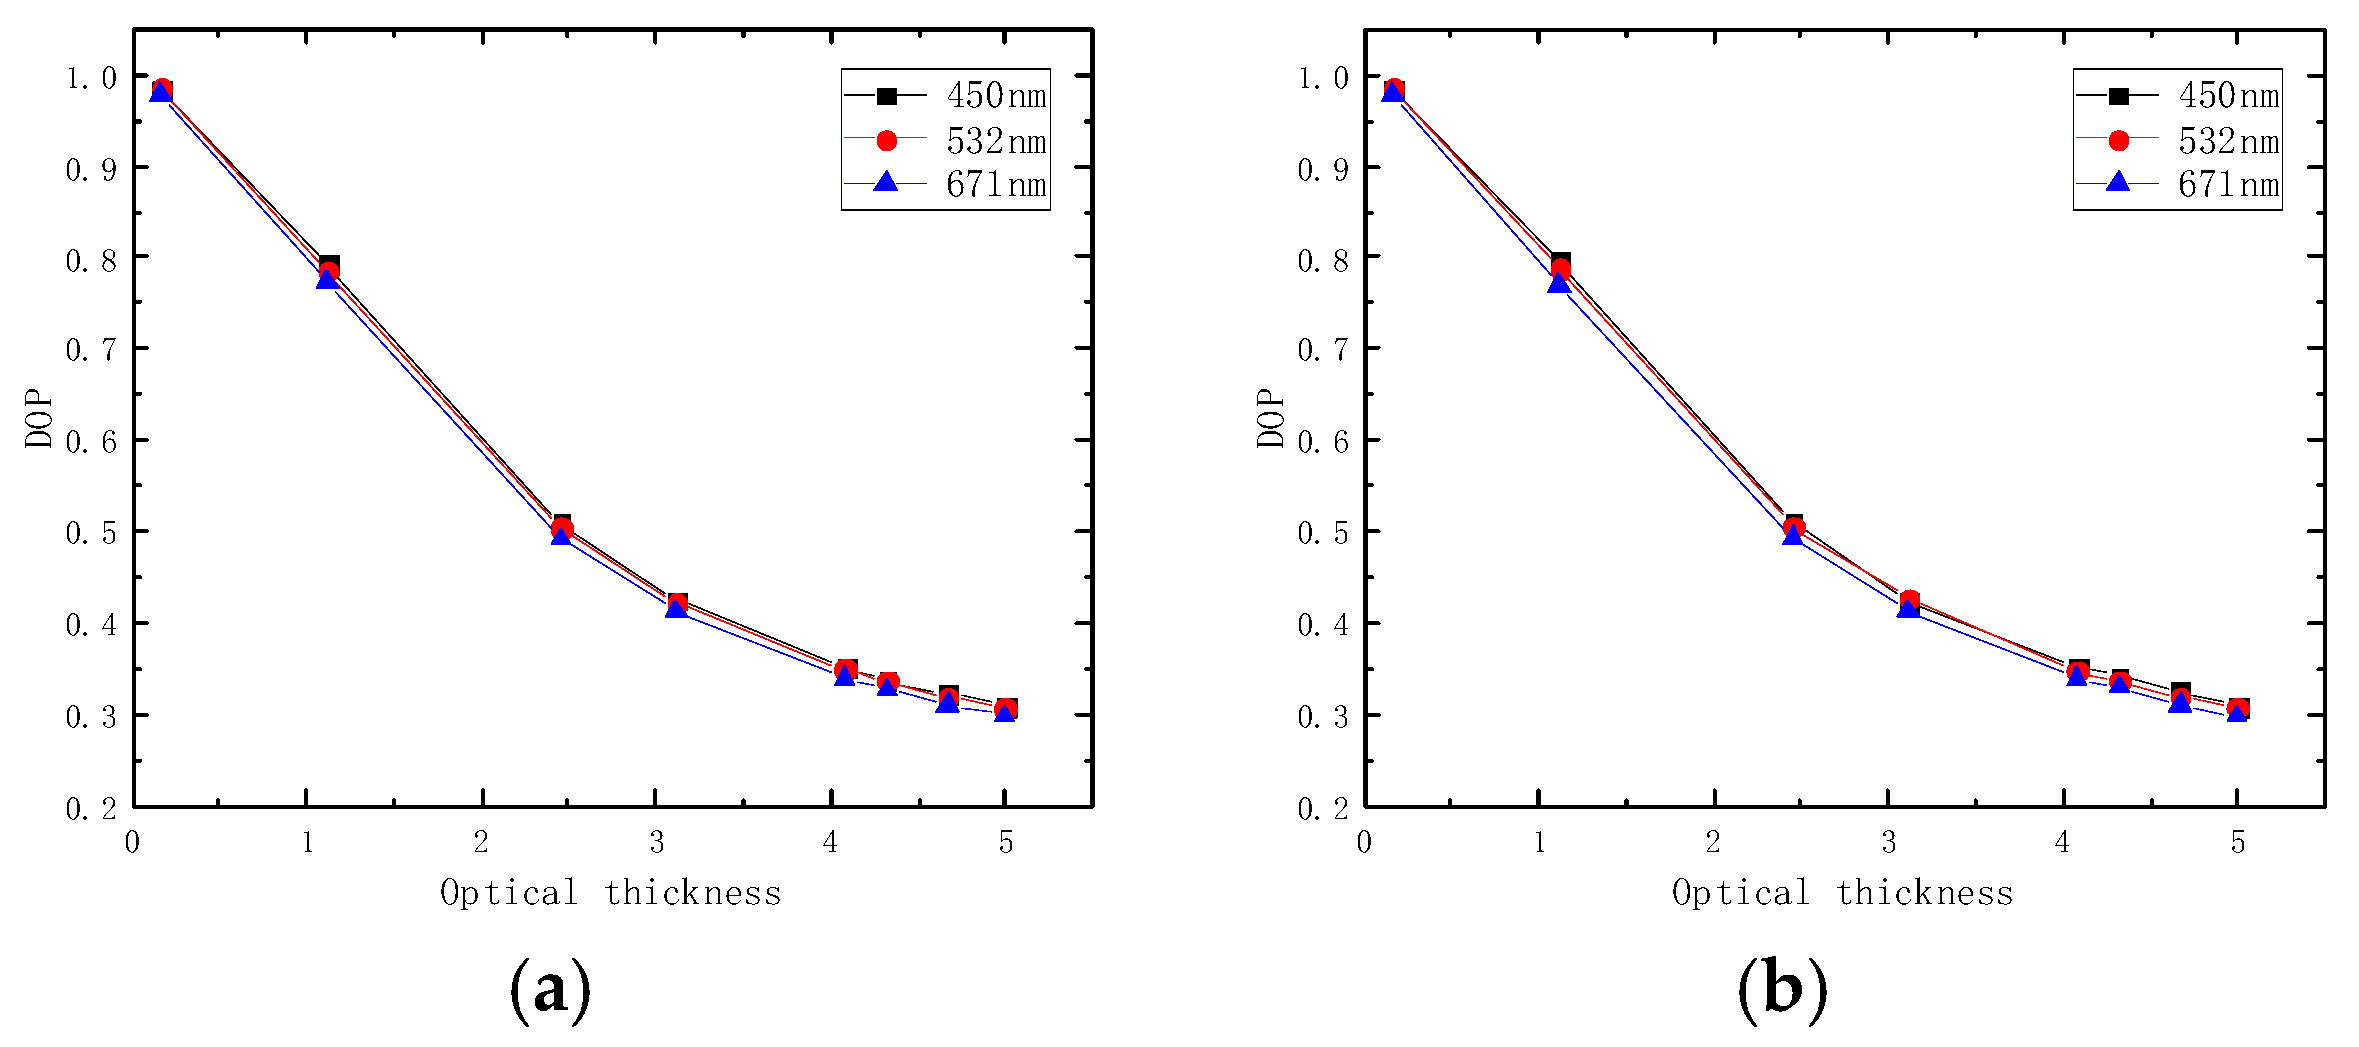
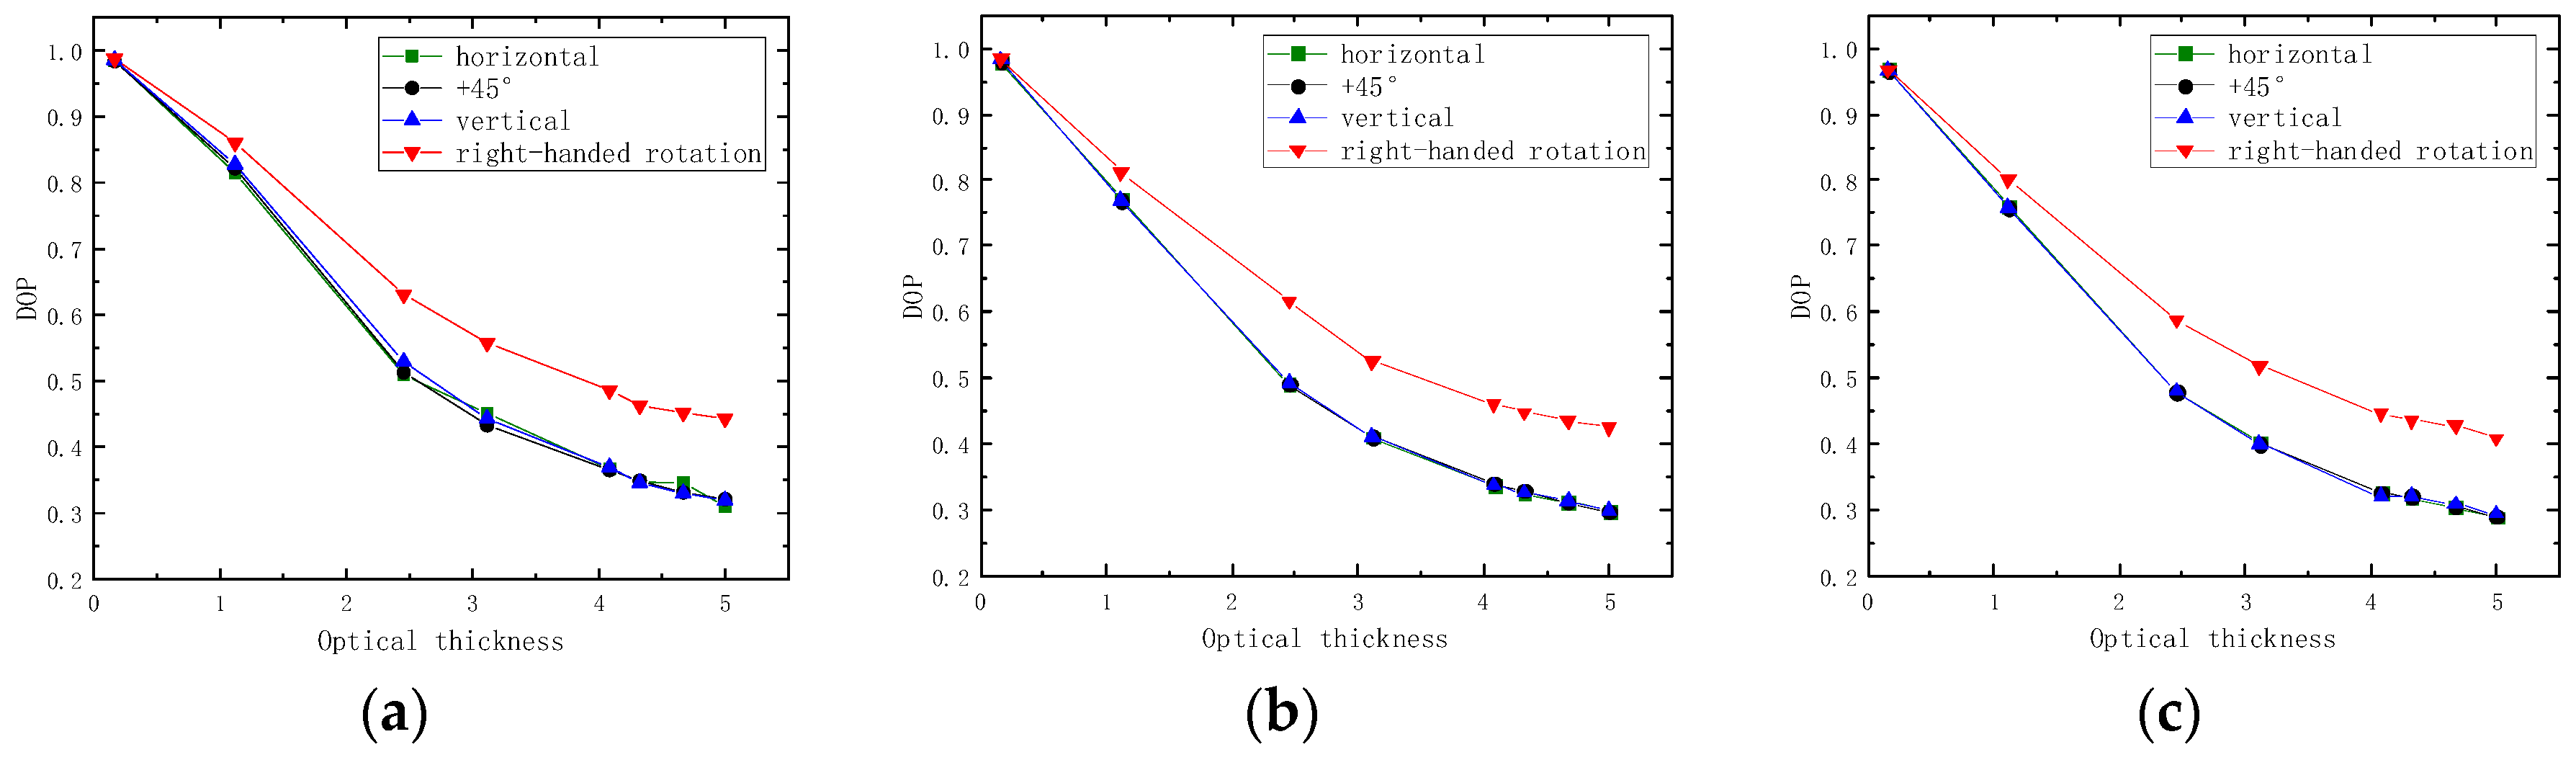
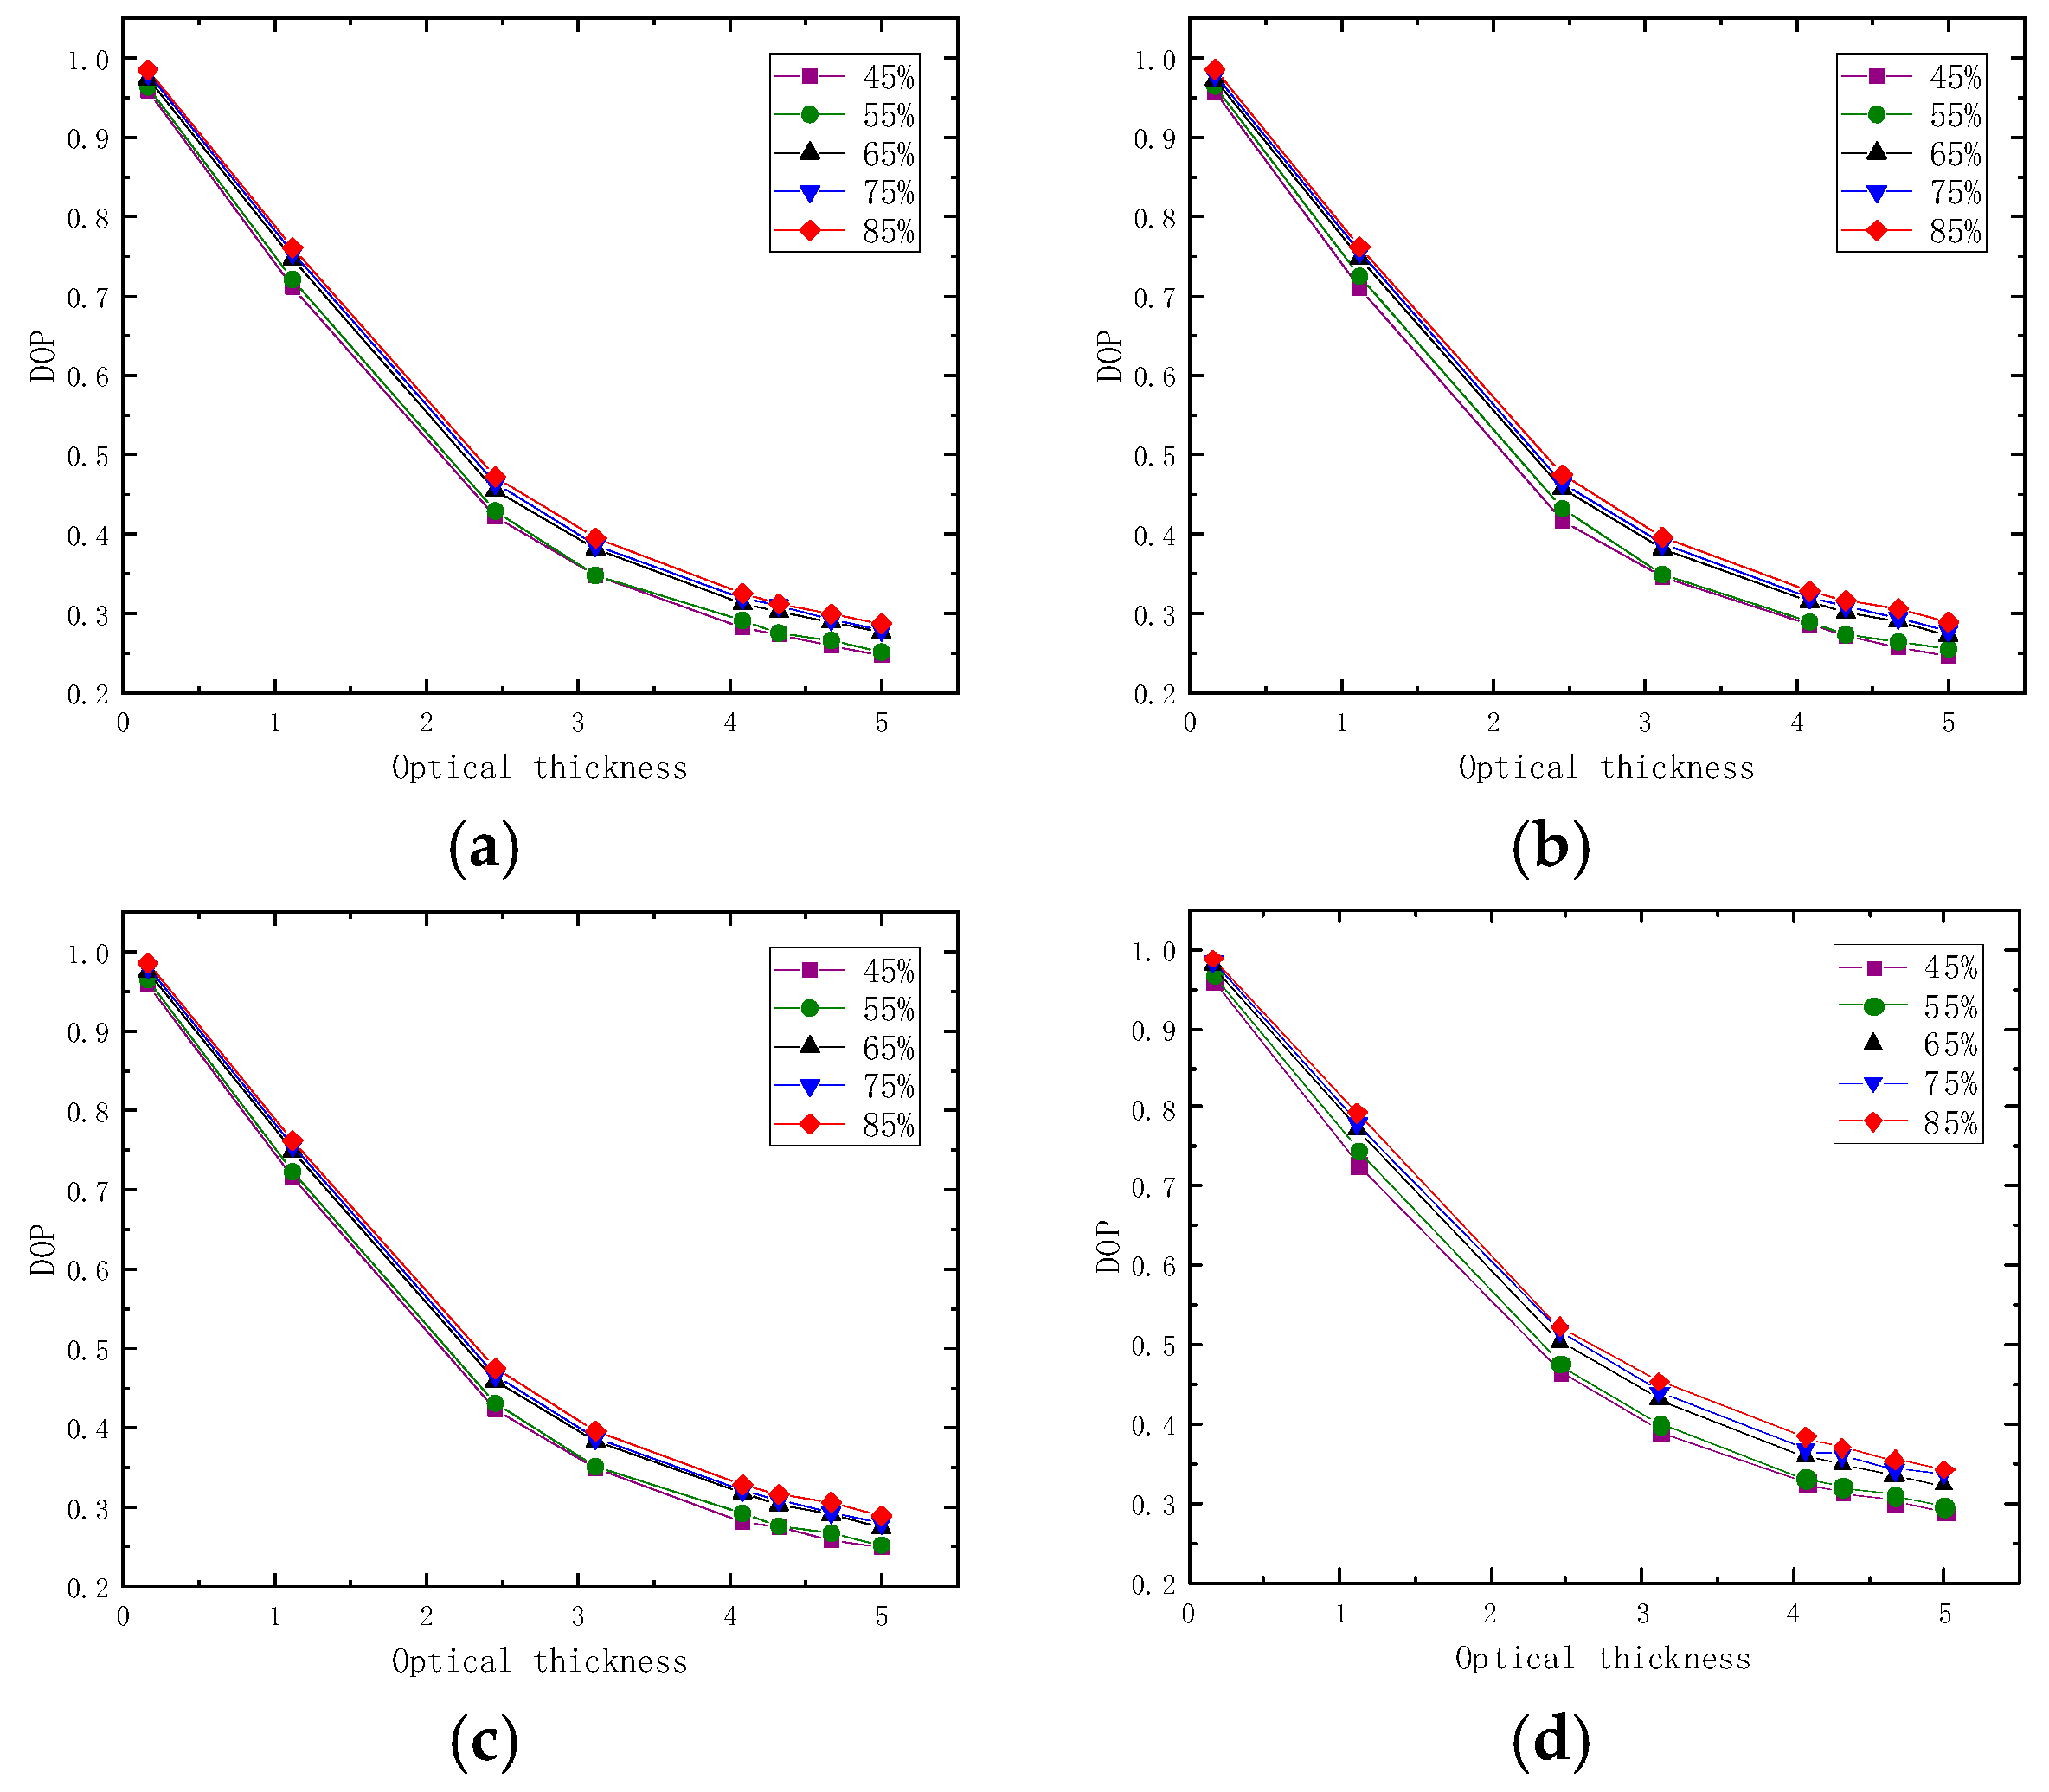
4.2. Experimental Results and Discussion

The indoor simulation experiment results of the three wavelengths are shown in Figure 10. The three DOP curves overlap because the DOP difference of 0°, 45°, and 90° linearly polarized lights is less than 1%. For the polarized light of the three wavelengths, the DOP of the circularly polarized light and the linearly polarized light decreases with the increase of the optical thickness. Moreover, the difference between the DOP of circularly polarized light and that of linearly polarized light is approximately 30%. These DOP values are initially close. Circularly polarized light has better polarization-maintaining ability than linearly polarized light [20].
The measured data of 0°, 45°, and 90° linearly polarized lights and right-handed circularly polarized light of the three wavelengths are used to draw Figure 11. We can compare the change law of polarization characteristics under different wavelengths. In the visible band, the DOP decreases with the increase of the wavelength. DOP450 is higher than DOP532 by approximately 10%, and DOP532 is higher than DOP671 by approximately 15%. The measured results are close to the simulation results, and the change trend is consistent.
The indoor simulation experiment results of the five relative humidity conditions are shown in Figure 12. DOP shows an upward trend with an increase in relative humidity. The relative humidity increases from 45% to 85%, and DOP increases by approximately 15%. The results are close to the simulation results, and the change trend is consistent.
The accuracy of the inhomogeneous particle scattering model should be calculated. According to the following formula, we can calculate the accuracy [21]:
M = 1 ( 1 n R R m R m ) / n × 100 %
R and R m are the polarization degree values obtained by the simulation and measurement at a certain sampling point, respectively. The accuracy calculation results of the inhomogeneous particle scattering model under different wavelength bands and relative humidity conditions are shown in Table 5 and Table 6.
Table 5 and Table 6 show that under three visible light bands and five relative humidity conditions, the inhomogeneous particle scattering model has the lowest accuracy of 75.29% and the highest accuracy of 88.62%. Therefore, the actual measurement and simulation results have consistent laws. This finding indicates the accuracy of the inhomogeneous particle scattering model.

4.3. Comparative Analysis of the Polarization Characteristics of Inhomogeneous Particles and Homogeneous Particles

In past research about sea fog particle polarization transmission, most of the inhomogeneous particles were considered homogeneous particles for analysis. Compared with homogeneous particles, the actual inhomogeneous particles have a layered structure, and the particles’ refractive index is complex and changeable because of the influence of many factors. In a few cases, the inhomogeneous particles can be ideally homogenized, and most of the ideal homogenization is often accompanied by nonnegligible errors.
We define the difference in polarization transmission characteristics between inhomogeneous sea fog particles and homogeneous sea fog particles as C:
C = P U P N
P U is the simulation result of homogeneous sea fog particles’ DOP, and P N is the simulation result of homogeneous sea fog particles’ DOP. Figure 13 shows the relationship between C and the optical thickness under the same wavelength and the same relative humidity. When the optical thickness is 0–1, the linearly polarized light and the circularly polarized light have an upward trend of C, and the rising rate of the circularly polarized light and the linearly polarized light is close. The C of the linearly polarized light stabilizes when the optical thickness is 1–5, and then it gradually decreases. However, the C of circularly polarized light continues to rise with a difference of 20–50%. This finding indicates that the ideal homogenization processing method is used to solve the problem of inhomogeneous particle transmission for linearly polarized light. Although the calculation results have small errors, the variation law close to the actual situation can be obtained. For circularly polarized light, if use ideal homogenization method to solve the transmission problem of inhomogeneous particles, it will acquire big errors. Even the final polarization characteristic variation law deviates from the actual situation.

5. Conclusions

In conclusion, we show the polarization transmission characteristics’ variation law under the environment of inhomogeneous sea fog particles using theory and experimental methods. We first calculated the equivalent refractive index of the inhomogeneous sea fog particles through the equivalent analysis method and the relative humidity formula. Then we improved the Monte Carlo method to construct an inhomogeneous particle scattering model. After that, we set indoor simulation experiments, and we recorded the DOP of polarized light under different wavelengths and relative humidity conditions. Finally, we calculate the conformity of the simulation and experiment to verify the feasibility.
Both the simulated and experimental results show that in the visible band, the DOP decreases with the increase of the wavelength. DOP450 is approximately 3–10% higher than DOP532, and DOP532 is approximately 5% higher than DOP671. The relative humidity increases from 45% to 85%, and the DOP increases by 10–15%. Therefore, the wavelength is inversely proportional to DOP; relative humidity is proportional to DOP. This will provide theoretical support for polarization imaging and polarization detection.
In the follow-up research, external field experiments must be conducted to verify further the inhomogeneous particle scattering model. We will replenish the influence of the actual outdoor environment on polarization characteristics.

Author Contributions

Methodology, S.Z.; Formal analysis, W.Z.; Writing—original draft, S.B.; Writing—review & editing, J.Z.; Supervision, Y.L., Q.F. and J.D. All authors have read and agreed to the published version of the manuscript.

Funding

This research was funded by National Natural Science Foundation of China (No. 61890963); National Natural Science Foundation of China (No. 62127813); Key Projects of Jilin Provincial Department of Education (No. JJKH20220738KJ, JJKH20220737KJ); Project of Science and Technology Department of Jilin Province (No. 20210201093GX, 20200201261JC).

Institutional Review Board Statement

Not applicable.

Informed Consent Statement

Not applicable.

Data Availability Statement

Not applicable.

Conflicts of Interest

The authors declare no conflict of interest.

References

  1. Wang, X.B.; Zhao, H.K.; Zhou, Y.D.; Zhang, F.; Xu, P.T.; Liu, Q.; Liu, C.; Liu, D. Characteristics of jellyfish in the Yellow Sea detected by polarized oceanic lidar. Infrared Laser Eng. 2021, 50, 122–128. [Google Scholar]
  2. Taylor, J.S.; Davis, P.S.; Wolff, L.B. Underwater partial polarization signatures from the shallow water real-time imaging polarimeter (SHRIMP). Phys. A 2003, 5089, 296–311. [Google Scholar]
  3. Zhang, C.; Zhang, J.Q.; Wu, X.; Huang, M.L. Numerical analysis of light reflection and transmission in poly-disperse sea fog. Opt. Express 2020, 28, 25410–25430. [Google Scholar] [CrossRef] [PubMed]
  4. Lewis, J.M.; Korain, D.; Redmond, K.T. Sea Fog Research in the United Kingdom and United States: A Historical Essay Including Outlook. Bull. Am. Meteorol. Soc. 2004, 85, 395–408. [Google Scholar] [CrossRef] [Green Version]
  5. Ni, X.Y.; Yu, S.T.; Tang, Y.J.; Chen, F.S. The research on polarimetric detection capability of ship targets in the sea fog. J. Infrared Millim. Waves 2021, 40, 96–101. [Google Scholar]
  6. Sakai, T.; Nagai, T.; Zaizen, Y. Backscattering linear depolarization ratio measurements of mineral, sea-salt, and ammonium sulfate particles simulated in a laboratory chamber. Appl. Opt. 2010, 49, 4441–4449. [Google Scholar] [CrossRef] [PubMed]
  7. Bi, L.; Lin, W.S.; Wang, Z.; Tang, X.Y.; Zhang, X.Y.; Yi, B.Q. Optical Modeling of Sea Salt Aerosols: The Effects of Nonsphericity and Inhomogeneity. J. Geophys. 2018, 123, 543–558. [Google Scholar] [CrossRef]
  8. Huang, H.L.; Huang, Y.B.; Han, Y.; Rao, R.Z. Light Extinction Properties of Marine Aerosol Particles in Internal Mixing State. J. Atmos. Environ. Opt. 2007, 3, 180–184. [Google Scholar]
  9. Zhang, X.L.; Huang, Y.B.; Rao, R.Z. Equivalence of light scattering in an intermixed aerosol particle model. Acta Opt. Sin. 2012, 32, 260–266. [Google Scholar]
  10. Jiang, H.F. Study on Light Scattering Properties and Refractive Index Distribution Measurement of Inhomogeneous Particles. Ph.D. Thesis, Xidian University, Xi’an, China, 2007. [Google Scholar]
  11. Li, Y.; Xue, R.; Michael, J.E.; Barbara, J.F. Theoretical and Experimental Investigation of Scattering Property of Airborne Sea Salt Particle. J. Atmos. Environ. Opt. 2014, 3, 215–222. [Google Scholar]
  12. Zhang, Y.H.; Lu, T.F.; Liu, Y.X.; Chen, Z.Y.; Sun, S.H. Intensities of non-uniformly polarized beams in the oceanic turbulence. Laser Technol. 2020, 3, 310–314. [Google Scholar]
  13. Vermote, E.F.; Tanre, D. Second Simulation of the Satellite Signal in the Solar Spectrum, 6S: An overview. IEEE Trans. Geosci. Remote Sens. 1997, 35, 675–686. [Google Scholar] [CrossRef] [Green Version]
  14. Sun, Y.H.; Dong, H.; Bi, C.H.; Li, Z.P. Inter-comparison of models for radiative transfer in the atmosphere. High Power Laser Part Beams 2004, 2, 149–153. [Google Scholar]
  15. Wang, W.T.; Wang, S.X.; Wang, L.X. Study on the Streetlight Transmissivity in Fog Based on MODTRAN Model. China Illum. Eng. J. 2018, 2, 95–99. [Google Scholar]
  16. Li, S.; Sun, X.B.; Ti, R.F.; Huang, H.L.; Chen, Z.T.; Qiao, Y.L. Influence of Scattering Model and Effective Particle Radius on Cirrus Cloud Optical Thickness Retrieval. Acta Opt. Sin. 2018, 7, 1–10. [Google Scholar]
  17. Zhang, X.H.; Dai, C.M.; Zhang, X.; Wei, H.L.; Zhu, X.J.; Ma, J. Effect of relative humidity and particle shape on the scattering properties of sea salt aerosols. Infrared Laser Eng. 2019, 8, 245–252. [Google Scholar]
  18. Liao, Y.B. Polarization Optics; China Science Press: Beijing, China, 2003. [Google Scholar]
  19. Van der Laan, J.D.; Wright, J.B.; Scrymgeour, D.A.; Kemme, S.A.; Dereniak, E.L. Evolution of circular and linear polarization in scattering environments. Opt. Express 2015, 23, 31874–31888. [Google Scholar] [CrossRef] [PubMed]
  20. Van der Laan, J.D.; Wright, J.B.; Kemme, S.A.; Scrymgeour, D.A. Superior signal persistence of circularly polarized light in polydisperse, real-world fog environments. Appl. Opt. 2018, 57, 5464–5473. [Google Scholar] [CrossRef] [PubMed]
  21. Zhang, S.; Zhan, J.T.; Fu, Q.; Duan, J.; Li, Y.C.; Jiang, H.L. Propagation of linear and circular polarization in a settling smoke environment: Theory and experiment. Appl. Opt. 2019, 58, 4687–4694. [Google Scholar] [CrossRef] [PubMed]
Figure 1. Schematic diagram of the double-layer spherical particle model.
Applsci 13 00905 g001
Figure 2. Relative differences under different mixing ratios.
Applsci 13 00905 g002
Figure 3. Schematic diagram of inhomogeneous particle scattering simulation.
Applsci 13 00905 g003
Figure 4. Flowchart of inhomogeneous particle scattering model.
Applsci 13 00905 g004
Figure 5. Diagram of the indoor simulation experiment setup under an inhomogeneous sea fog particle environment.
Applsci 13 00905 g005
Figure 6. Physical map of the device: (a) transmitting ends; (b) box; (c) receiving ends.
Applsci 13 00905 g006
Figure 7. Simulation curves of DOP and optical thickness under different wavelengths: (a) λ = 450   nm ; (b) λ = 532   nm ; (c) λ = 671   nm .
Applsci 13 00905 g007
Figure 8. Simulation curves of DOP and optical thickness under different polarization states: (a) horizontal; (b) +45°; (c) vertical; (d) right-handed rotation.
Applsci 13 00905 g008aApplsci 13 00905 g008b
Figure 9. Relationship between DOP and optical thickness under different polarization states: (a) horizontal; (b) +45°; (c) vertical; (d) right-handed rotation.
Applsci 13 00905 g009
Figure 10. Measured curves of DOP and optical thickness under different wavelengths: (a) λ = 450   nm ; (b) λ = 532   nm ; (c) λ = 671   nm .
Applsci 13 00905 g010
Figure 11. Measured curves of DOP and optical thickness for three wavelengths under different polarization states: (a) horizontal; (b) +45°; (c) vertical; (d) right-handed rotation.
Applsci 13 00905 g011
Figure 12. Measured curves of DOP and optical thickness for five relative humidity conditions under different polarization state conditions: (a) horizontal; (b) +45°; (c) vertical; (d) right-handed rotation.
Applsci 13 00905 g012
Figure 13. Comparison of polarization transmission characteristics between homogeneous sea fog particles and inhomogeneous sea fog particles: (a) same wavelength; (b) same relative humidity.
Applsci 13 00905 g013
Table 1. Equivalent refractive index corresponding to different mixing ratios.
Mixing ratio0.10.30.40.50.70.90.99
Equivalent refractive index1.492+
i0.00214
1.37+
i0.00034
1.345+
i0.000178
1.421+
i0.00024
1.494+
i0.000236
1.44+
i0.00154
1.49+
i0.00138
Table 2. Equivalent refractive index at different wavelengths.
Wavelength/nm450532671
Equivalent refractive index1.358 + i0.0002681.405 + i0.001671.455 + i0.001699
Table 3. Equivalent refractive index under different relative humidity conditions.
Relative humidity45%55%65%75%85%
Equivalent Refractive Index1.4585+
i0.0001
1.4518+
i0.0001
1.4459+
i0.0001
1.4405+
i0.0001
1.4355+
i0.0001
Table 4. Relationship between fog filling time and optical thickness.
Fog filling time/min12345678
Optical thickness0.161.122.453.124.084.324.675
Table 5. Accuracy calculation results of inhomogeneous particle scattering model under three wavelength conditions.
Wavelength/nmPolarization StateM/%
Horizontal77.95
450Vertical84.39
45°75.9
Right-hand rotation80.71
Horizontal80.61
532Vertical80.68
45°79.01
Right-hand rotation88.62
Horizontal80.12
671Vertical81.36
45°82.35
Right-hand rotation79.42
Table 6. Accuracy calculation results of inhomogeneous particle scattering models under five relative humidity conditions.
Relative Humidity/%Polarization StateM/%
Horizontal77.75
45Vertical75.29
45°79.47
Right-hand rotation79.15
Horizontal76.69
55Vertical75.45
45°76.21
Right-hand rotation79.62
Horizontal81.12
65Vertical84.6
45°79.29
Right-hand rotation83.01
Horizontal84.84
75Vertical82.89
45°83.66
Right-hand rotation82.45
Horizontal79.78
85Vertical79.97
45°77.47
Right-hand rotation83.56
Disclaimer/Publisher’s Note: The statements, opinions and data contained in all publications are solely those of the individual author(s) and contributor(s) and not of MDPI and/or the editor(s). MDPI and/or the editor(s) disclaim responsibility for any injury to people or property resulting from any ideas, methods, instructions or products referred to in the content.

