Abstract
High-precision laser spot center detection occupies an important position in optical measurement technology. In this paper, we propose a laser spot centering method to improve positioning accuracy. This method is an iterative double-area shrinkage approach based on the baseline method. The background noise baseline is calculated from the noise statistics of multiple background image frames acquired, and then the background noise is subtracted during the calculation while retaining the effective information of the spot region. The real spot area is located in the end by double-area shrinkage iteration to calculate the position of the spot center. Simulation and experimental results showed that our proposed method has strong anti-background noise interference ability, as well as higher positioning accuracy in locating the spot center than commonly used approaches; the maximum localization accuracy could reach 0.05 pixels, meeting the real-time requirements of the algorithm. The fluctuation range of measurement results was small when continuously detecting the center of the same laser spot, which could reach 0.04 and 0.03 pixels in the x- and y-directions, respectively. The result indicates that the method can meet the requirements of laser high-precision positioning.
1. Introduction
With the development of industrial manufacturing and other industries, the process level has been improving, and measurement and positioning work as a guarantee of product quality has become more and more important, while the realization of high-precision automatic positioning has become a difficult research point. Compared with manual positioning, laser positioning has the advantages of high detection accuracy, good safety, and convenient operation, but the traditional laser center position detection algorithm does not meet the demand of high accuracy, and the calculation results may have large errors in a noisy environment. Therefore, there is a need to improve the accuracy of laser spot center detection in complex situations to ensure the smooth completion of the measurement work. Laser spot center location, which is widely applied in various measurement systems, including optical communication systems, optical path auto-collimation systems, and optical displacement angle measurement systems, is an important topic in the field of photoelectric detection and image processing [1,2,3,4]. The possible accurate positioning of the laser spot center directly determines the level of measurement accuracy.
Pixel-level centering was commonly used to locate the center to an image element early on, but the system could not achieve the required accuracy in some demanding situations. Therefore, a higher-accuracy center sub-pixel positioning algorithm is needed, which can position the result to sub-pixel level and, thus, greatly improve the measurement accuracy of the system. At present, algorithms that determine the laser spot center are divided into two categories: those based on edge detection and those based on gray values. The edge detection-based algorithm assumes that the ideal spot geometry is a circle or an ellipse and largely adopts approaches, such as circle fitting [5,6,7,8]. The gray value-based algorithm mainly analyzes the surface characteristics of image intensity function to determine the laser spot center, which largely includes the centroid algorithm and the Gaussian fitting algorithm [9,10,11]. The aforementioned algorithms have some shortcomings in terms of positioning accuracy and computational complexity. The shape of the laser spot in practical measurements is often unpredictable. However, the circle fitting algorithm has high requirements for spot integrity, as well as poor interference resistance; the accuracy of the center operation is significantly reduced when in a noisy environment, and the obtained circle center may even produce obvious errors when encountering very strong external interference, representing serious limitations [12]. The Gaussian fitting method is computationally intensive, has high computational complexity, and exhibits poor real-time performance. In comparison, the gray centroid method, which does not require any prior knowledge about the spot shape, is widely used in various measurement systems because of its simplicity and robustness [13,14,15,16,17]. Based on the gray centroid method, many scholars have proposed improved methods, such as the square-weighted centroid method.
It is inevitable that the result is affected by the noise of the CCD and the environmental background noise in the process of laser spot center positioning, which has a certain impact on the spot image and results in relatively low positioning accuracy. The impact of CCD noise mainly comes from the discrete and incomplete sampling error of CCD, photon noise error, readout noise error, CCD background noise error, etc. Therefore, it is necessary to operate the image algorithm on the CCD acquired spot image before the measurement to reduce the influence of noise as much as possible. Image denoising is commonly used to improve the accuracy of spot center location [18]. Existing image denoising methods primarily include the threshold method, matching window method, and image interpolation method. Although these methods reduce the influence of noise to a certain extent, some limitations cannot be ignored. The threshold method is commonly used to reduce the effect of uniform noise, but it has the problem of manual parameter selection. The matching window method can eliminate the influence outside the matching window, but cannot reduce the noise inside the matching window. Processing with the image interpolation method can improve the signal-to-noise ratio of the image to a certain extent, but the measurement algorithm consumes more and more time and cannot meet the requirements of real-time detection as the interpolation accuracy increases [19,20,21].
An iterative double-area shrinkage method based on the baseline method, which can determine the exact location of the laser spot center, is presented in this paper. The proposed method eliminates the effect of noise by calculating the background noise baseline from multiple background images. Subsequently, the real spot area is located using double-area shrinkage iteration to calculate the spot center. Section 2 describes the traditional center positioning method. Section 3 introduces the realization principle of this approach. Section 4 conducts simulations, experiments, and comparisons with typical algorithms to verify the effectiveness of the proposed method. Lastly, Section 5 summarizes the conclusion.
2. Traditional Central Positioning Method
2.1. Circle Fitting Algorithm
The laser spot can be regarded as a circle under ideal conditions, and the center of laser spot is the circle’s center. However, it will cause the asymmetry of the laser spot distribution, and the obtained spot is often not a standard circle due to the presence of scatter, uneven reflection from the measured object surface, and the influence of the optical system in the actual optical measurement. The laser spot center detection algorithm based on circle fitting uses a circle to approximate the contour of the laser spot according to the principle of least squares, such that the center of the spot, as well as the radius, can be calculated.
The least squares circle fitting curve is
It can be expanded to obtain
where R is the radius of the circle; and are constants. Another expression for the circle is
Let ; then, only the parameters a, b, and c are needed to find the center and radius of the circle.
2.2. Gray Centroid Method
The gray centroid method is a sub-pixel algorithm commonly used for high-precision localization of regular or irregular targets in images. In optical measurement systems, the gray centroid method is commonly used to calculate the laser spot center position. Suppose that the size of the spot image is , and the gray value of each pixel point is . The centroid of the laser spot is calculated using the following formula:
The processing of the gray centroid method is simple and requires only a small amount of calculation. However, it is susceptible to the influence of noise, leading to large errors. The gray centroid algorithm can produce high localization accuracy for images with uniform distribution and a high signal-to-noise ratio.
2.3. Gaussian Fitting Method
The energy of the laser spot imaged by the CCD is dispersed from the center of the spot to the surrounding area under ideal conditions, which is expressed as a two-dimensional Gaussian surface distribution of gray values. The Gaussian fitting method can be used to locate the center of the spot accurately for Gaussian-shaped spots. The formula is as follows:
where is the intensity value when the coordinates of the image element are , A is the amplitude of the spot, and are the center coordinates of the laser spot, and and are the standard deviations in the x- and y-directions, respectively.
Taking the logarithm of both sides of Equation (5) and simplifying it to a polynomial, we obtain
The coefficients corresponding to the polynomial can be calculated using the least squares method, and then the coordinates of the center of the laser spot can be calculated as follows:
Although the overall accuracy of this method is high, some uncertainty bias occurs after the background noise is removed due to the CCD having a certain degree of background noise and a complicated calculation.
3. Realization Principle of Proposed Approach
An optical system that consists of a laser, laser attenuator, lens, and CCD camera was built to collect the laser spot image (Figure 1). The realization of spot center detection is shown in Figure 2. To eliminate the influence of noise on the laser spot, the method is divided into two steps. The first step is to calculate the background noise baseline using multi-frame background images acquired by the CCD, and the other locates the center of the laser spot after removing noise.
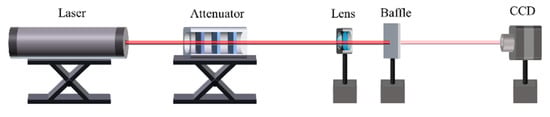
Figure 1.
Image acquisition.

Figure 2.
Realization of spot center detection.
3.1. Statistics of Background Noise Baseline
The laser spot is not disturbed by noise when collected under ideal conditions. However, it is inevitably affected by various noises in actual laser spot collection. The traditional method is setting a fixed threshold to remove the influence of background noise. Thus, the purpose of eliminating noise effectively is not achieved. In this paper, the baseline method based on the statistical characteristics of noise can be used to calculate the noise distribution from multiple background image frames to obtain the background noise baseline adaptively. The specific process is shown in Figure 3.
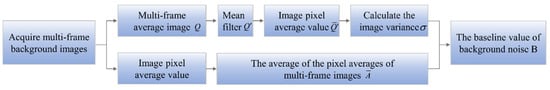
Figure 3.
Calculation of the background noise baseline.
After collecting multiple background image frames using a camera, the image gray average and the image gray variance can be calculated using Equations (10) and (11), respectively; subsequently, the background noise baseline can be computed according to Equation (8).
where B is the calculation result of the background noise baseline, is the overall average pixel value of multiple image frames, and mask_x and mask_y are the sizes of the filter template, set to 0.05 times of the image. If the size of the image is M N and the pixel value of the k-th background image at the pixel (i, j) is fk (i, j), then
where n is the background image frame, is the mean filtering result on the average image , in which multi-frame background images are superimposed, and is the average pixel value of .
3.2. Spot Center Locating Method
In accordance with the definition of ISO standards, the laser spot centroid and beam width can be calculated using the first-order moment and the second-order moment, respectively [22]. Our method makes improvements on this basis to search for the effective spot area iteratively under the premise of eliminating background noise effectively to enable a more precise computation of spot center.
The approach uses the background noise baseline and the OTSU method to binarize the collected laser spot image. Then, the eight-neighbor connectivity algorithm is used to process the binary image and define the connected domain with the largest area as the first spot area I1 and the second spot area I2. Dx and Dy are the spot area diameters in the x- and y-directions, respectively. The result is shown in Figure 4.
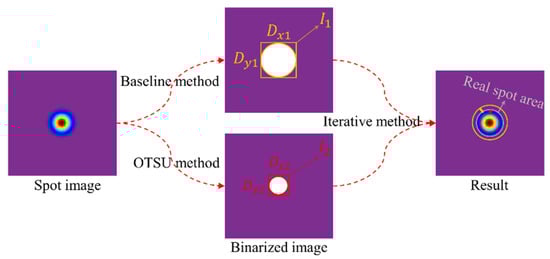
Figure 4.
Center location method of laser spot area shrinking iteration.
The initial spot center and radius can be obtained by calculating the pixels in the spot area according to Equations (12) and (13) after determining the initial spot area.
where k = 1 represents the first spot area, and k = 2 represents the second spot area. (Cxk, Cyk) represents the center coordinates. Rxk is the spot radius in the x-axis direction, and Ryk is the spot radius in the y-axis direction. Sk is the spot noise baseline. The first spot noise baseline is the background noise baseline (i.e., S1 = B). The second spot noise baseline is the average value of all the pixel values that are lower than the background noise baseline in the effective area obtained after doubling the second spot area, and, if no pixel value exists below the background noise baseline in the effective area of the light spot, then S2 = B.
Given an initial value ξ, if Rx1 − Rx2 > ξ, Ry1 − Ry2 > ξ, then the x-axis direction of the first spot area is reduced by , and the y-axis direction of the first spot area is reduced by , the x-axis direction of the second spot area is extended by , and the y-axis direction of the second spot area is extended by . When the spot area is changed, the spot center and radius are recalculated iteratively until the radius difference between the two spots is less than ξ, then the iterative convergence condition is met, and the final real spot center is obtained. The real spot center takes the mean value that corresponds to the center of the two spot areas. The same result can be obtained, and, if Rx2 − Rx1 > ξ, Ry2 − Ry1 > ξ, then the principle is the same.
4. Results and Discussion
4.1. Simulation
The human eye can recognize gray images much less well than color due to the special structure of the human eye; thus, it is necessary to make some pseudo-color processing of gray images to improve people’s ability to distinguish the details of images. A certain pseudo-color image processing process is needed for the gray image for a Gaussian distribution of the spot in order to display the details of the spot image in a gradient, in which each gray level of the image is mapped one by one according to a linear or nonlinear function, and different gray levels correspond to different pseudo-colors, so as to achieve the purpose of image enhancement to some extent.
As shown in Figure 5, MATLAB was used for simulation to generate ideal laser spot images with the radius of 20 pixels on the center of a size of 256 × 256 pixels. The central position was (128, 128). The CCD camera’s own noise has a large impact on the image of the laser spot. In order to simulate a noisy environment, random noise was added to the laser spot image using a given signal-to-noise ratio (SNR) according to the random noise characteristics of the CCD. As shown in Figure 6, to imitate the real environment and to verify the feasibility of the method in this paper, we added random noise with different SNRs to the laser spot images, which reflect the changes in the images from low to high SNRs. We generate 10 background noise images for each of the different SNRs, and then an optimal baseline value is calculated using the statistical method of background noise baseline proposed in this paper, which makes it possible to effectively filter out the background noise in the spot image while retaining the true spot information of the laser as much as possible. After the effective elimination of background noise, the threshold value of the difference between the radii of the two spot areas is set , iterative area shrinkage is performed based on the difference between the radii of the two newly obtained spot areas, and the real spot area is located until the end-of-iteration condition is satisfied, allowing the center of the spot to be calculated.
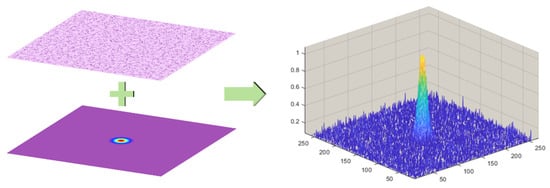
Figure 5.
Simulation of noise generation in laser spot image.
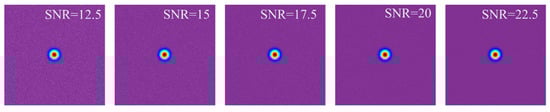
Figure 6.
Laser spot after adding noise with different SNRs.
As shown in Figure 7, the method proposed in this paper and some popular algorithms were used to compare the deviation of the detected spot center from the true spot center after the corresponding denoising of the spot image. With the gradual increase in image SNR, the deviation between the detected spot center and the real spot center determined using the Gaussian fitting algorithm, traditional centroid method, and square-weighted centroid method decreases rapidly, and the center localization accuracy improves. However, these methods are easily affected by background noise. The deviation between the center positioning results of x-axis and y-axis and the true center is more than 0.2 pixels when the interference from background noise is large (SNR = 12.5), and the fluctuation range of the center positioning results is larger as the SNR of the image increases. In contrast, the method proposed in this paper could find the center of the laser spot accurately under the interference of background noise, with the maximum centering accuracy reaching 0.05 pixels, and the deviation of the spot centering results fluctuated slightly.
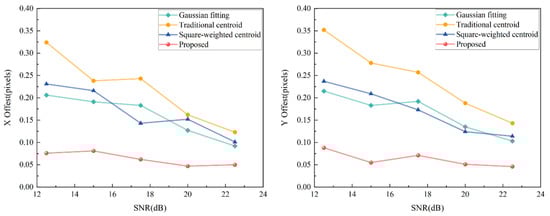
Figure 7.
Deviation of the center locating results of several algorithms from the true center in the x- and y-directions.
The iterative convergence of the spot area in this paper is shown in Figure 8. The spot area stabilized at the third–fourth iterations, and the final spot center was calculated. Figure 9 shows the comparison of the running time of different algorithms. Although the computational complexity of this paper’s algorithm is higher than that of the traditional and square-weighted centroid methods, our algorithm was less complex than that of the Gaussian fitting algorithm, and our average running time was 0.061 s, thus meeting the real-time requirement. Therefore, the positioning accuracy and running efficiency of the spot center localization method in this paper could obtain better results.
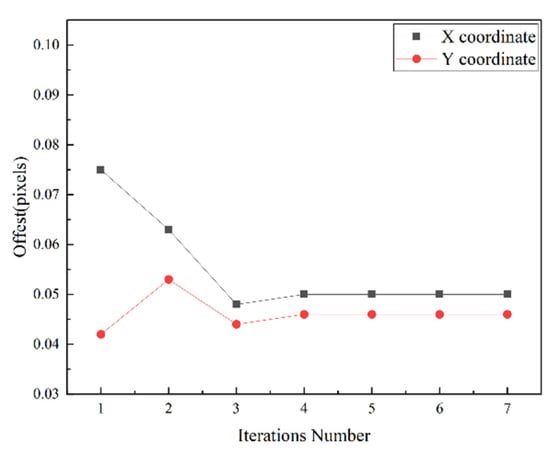
Figure 8.
Iterative convergence process of spot area.
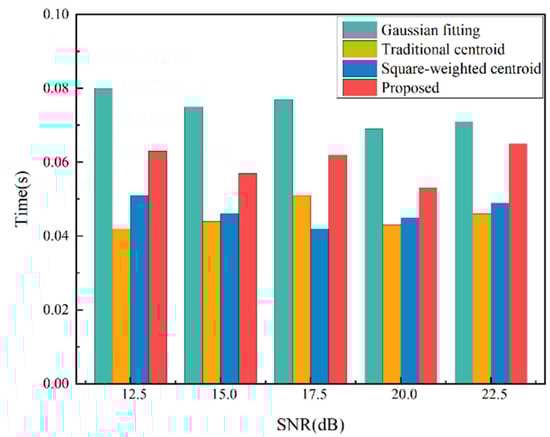
Figure 9.
Running time of different algorithms.
4.2. Experiment
We performed a specific practical experiment to further testify the validity of our proposed method. Figure 10a shows the experimental platform of the CCD-based laser beam measurement system built to acquire the laser spot. First, the laser light is generated by the GY-10 He–Ne laser which has better stability and reliability. Then, the attenuator is added to attenuate the laser beam energy incident on the photosensitive surface of the CCD camera in order for the CCD to receive energy without oversaturation to protect the CCD camera, considering that the energy of the laser beam may far exceed the saturation energy value of the CCD detector or even exceed the damage threshold of the CCD image element, which may damage the CCD device. The laser beam enters the lens after attenuation, which is used to ensure that the laser beam is within the measurable range. Finally, the beam is passed into the CCD camera, which completes the acquisition of the laser spot image.
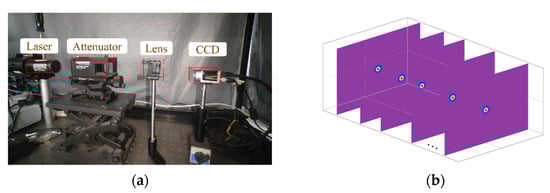
Figure 10.
Laser spot images are collected by CCD: (a) experimental platform; (b) continuous image acquisition.
Table 1 presents the device parameters used for the experiment. We used a masking plate to mask the laser so that 10 consecutive background images were acquired for background noise baseline statistics. Then, we acquired the laser spot to obtain a 1626 × 1236 pixel gray image. Since we cannot know the exact true spot center of the real acquired laser spot, multiple frames of spot images were acquired continuously for centering to perform stability analysis of the algorithm. Figure 10b shows that we continuously collected 10 frames of laser spot images displayed in pseudo-color in the same location. Table 2 displays the center positioning results of different algorithms for 10 consecutive laser spot image frames. Table 2 depicts that the location accuracy of several methods for comparison could reach the sub-pixel level.

Table 1.
Device parameters used for the experiment.
Table 2.
Laser spot center located by different algorithms.
After the corresponding denoising of the spot images, Table 3 shows the accuracy analysis and comparison of different center positioning algorithms in the x- and y-directions. The difference between the maximum positioning result and the minimum positioning result in the x and y directions was compared when centering 10 frames of spot images in succession. The results show that 0.204 and 0.189 pixels were reached for the Gaussian fitting method, 0.338 and 0.276 pixels were reached for the traditional centroid method, and 0.254 and 0.2 pixels were reached for the square-weighted centroid method, respectively. This shows that the fluctuation range of the center location results of these three methods exceeded 0.1 pixels. In comparison, the proposed method had the best results among other methods, regardless of whether it was the fluctuation range of the center positioning coordinates in the x-direction or y-direction, reaching 0.044 and 0.026 pixels, respectively, and the average standard deviation (SD) was even lower at 0.015 pixels on x and 0.01 pixels on y (Table 3), proving good stability.
Table 3.
Analysis and comparison of different algorithm results.
The experimental findings show that the fluctuation range of the center positioning result of the proposed method was small when the center of the same laser spot was detected continuously. The locating stability for laser spot using the proposed method was improved sevenfold compared with the traditional centroid method and improved five-fold compared with the Gaussian fitting algorithm. It should be noted that this study had some shortcomings. We only focused on cases where the intensity distribution of the laser beam was Gaussian, while ignoring the beam distortion, top-hat beam, etc. Theoretically, the method is not affected by the spot morphology, which we will verify in future experiments.
5. Conclusions
The gray centroid method is usually used in laser spot center positioning systems. However, it cannot achieve satisfying accuracy because of its susceptibility to background noise. Thus, on the basis of gray centroid method, we proposed an iterative double-area shrinkage method based on the baseline method to improve the spot center localization performance. The laser spot image acquired by CCD is mixed with many random noise components, the influence of noise can be effectively suppressed through the noise baseline statistics, and then the real spot area can be located so as to calculate the spot center through the double area iteration. In this paper, the effectiveness of the method was verified from two perspectives: simulation and real experiments. The simulation experiments were mainly used to verify the detection accuracy and robustness of the algorithm to noise and analyze the time complexity of the algorithm. The real experiments were mainly used to verify the usability of the algorithm and the stability of continuous measurement under a real environment. The experimental results on simulated and real laser spot images show that our proposed method could achieve more accurate center localization than the commonly used methods. In the simulation experiments, the maximum localization accuracy of the proposed method could reach 0.05 pixels, while meeting the real-time requirements of the algorithm. The fluctuation range of the measurement results could reach 0.04 and 0.03 pixels in the x- and y-directions, respectively, with excellent stability when the center of the same laser spot was detected continuously. Therefore, this method can meet the requirements of laser high-precision positioning.
Author Contributions
Conceptualization and methodology, H.Z., W.S. and W.J.; software and validation, L.L., X.F. and W.Z.; formal analysis and writing, S.W. All authors have read and agreed to the published version of the manuscript.
Funding
This research was funded through the financial support provided by the Science and Technology Research Project of Jilin Provincial Science and Technology Department (No. 20210201092GX) and the XXX plan project (No. kyc-xz-xm-2018-013).
Conflicts of Interest
The authors declare no conflict of interest.
References
- Timchenko, L.I.; Kokryatskaya, N.I.; Melnikov, V.V.; Kosenko, G.L. Method of Forecasting Energy Center Positions of Laser Beam Spot Images Using a Parallel Hierarchical Network for Optical Communication Systems. Opt. Eng. 2013, 52, 055003. [Google Scholar] [CrossRef]
- Cheng, Z.; Rui, Z.; Xu, B.; Zheng, Z. Design of Multi Axis Parallel Detection System for Laser Aiming. In Proceedings of the 2020 12th International Conference on Measuring Technology and Mechatronics Automation (ICMTMA), Phuket, Thailand, 28–29 February 2020; pp. 62–64. [Google Scholar] [CrossRef]
- Jing, X.; Cheng, H.; Xu, C.; Feng, Y. Method to Measure the Position Offset of Multiple Light Spots in a Distributed Aperture Laser Angle Measurement System. Appl. Opt. 2017, 56, 1740. [Google Scholar] [CrossRef] [PubMed]
- Li, Q.; Xu, S.; Xu, Y.; Guo, H.; Wang, Q.; He, D.; Peng, Z.; Huang, Y. Method to Measure Light Spot Position in Beacon-Less Inter-Satellite Communication System. Appl. Sci. 2019, 9, 3032. [Google Scholar] [CrossRef]
- Zhou, P.; Wang, X.; Huang, Q.; Ma, C. Laser Spot Center Detection Based on Improved Circled Fitting Algorithm. In Proceedings of the 2018 2nd IEEE Advanced Information Management, Communicates, Electronic and Automation Control Conference (IMCEC), Xi’an, China , 25–27 May 2018; pp. 316–319. [Google Scholar] [CrossRef]
- Zhu, J.; Xu, Z.; Fu, D.; Hu, C. Laser Spot Center Detection and Comparison Test. Photonic Sens. 2019, 9, 49–52. [Google Scholar] [CrossRef]
- Wang, X.; Zhao, Q.C.; Ling, Q.H. Robust Image Processing Method of Laser Spot Center Location in Complex Industrial Environment. In Proceedings of the 2017 International Symposium on Intelligent Signal Processing and Communication Systems (ISPACS), Xiamen, China, 6–9 November 2017; pp. 651–656. [Google Scholar] [CrossRef]
- Krstinić, D.; Kuzmanić Skelin, A.; Milatić, I. Laser Spot Tracking Based on Modified Circular Hough Transform and Motion Pattern Analysis. Sensors 2014, 14, 20112–20133. [Google Scholar] [CrossRef] [PubMed]
- Vázquez-Otero, A.; Khikhlukha, D.; Solano-Altamirano, J.M.; Dormido, R.; Duro, N. Laser Spot Detection Based on Reaction Diffusion. Sensors 2016, 16, 315. [Google Scholar] [CrossRef] [PubMed]
- Gao, R.; Liu, H.; Zhao, Y.; Luo, Z.; Jin, G. High-Precision Laser Spot Center Positioning Method for Weak Light Conditions. Appl. Opt. 2020, 59, 1763. [Google Scholar] [CrossRef] [PubMed]
- Dong, H.; Wang, L. Non-Iterative Spot Center Location Algorithm Based on Gaussian for Fish-Eye Imaging Laser Warning System. Optik 2012, 123, 2148–2153. [Google Scholar] [CrossRef]
- Zhu, Y.; Huang, Y.; Li, H.; Ma, Y. Research on APT Spot Detection Algorithm in Space Optical Communication. IOP Conf. Ser. Mater. Sci. Eng. 2018, 452, 042184. [Google Scholar] [CrossRef]
- Xie, J.; Liu, R.; Mo, F.; Tang, H.; Jiao, H.; Mei, Y.; Yang, C. Pointing Bias Calibration of Gaofen-7 Laser Altimeter Based on Single Laser Footprint Image. ISPRS Ann. Photogramm. Remote Sens. Spat. Inf. Sci. 2020, 5, 113–119. [Google Scholar] [CrossRef]
- Wang, Q.; Tong, L.; Yu, S.; Tan, L.; Ma, J. Accurate Beacon Positioning Method for Satellite-to-Ground Optical Communication. Opt. Express 2017, 25, 30996. [Google Scholar] [CrossRef] [PubMed]
- Jiang, Z.; Gong, S.; Dai, Y. Monte-Carlo Analysis of Centroid Detected Accuracy for Wavefront Sensor. Opt. Laser Technol. 2005, 37, 541–546. [Google Scholar] [CrossRef]
- Wang, Q.; Yang, Z.; Wei, P. Research on Laser Ranging Method Based on CMOS Image Sensor. In Proceedings of the 3rd International Conference on Mechatronics, Robotics and Automation, Shenzhen, China, 20–21 April 2015; Volume 15, pp. 1357–1360. [Google Scholar] [CrossRef]
- Lin, C.S.; Huang, Y.C.; Chen, S.H.; Hsu, Y.L.; Lin, Y.C. The Application of Deep Learning and Image Processing Technology in Laser Positioning. Appl. Sci. 2018, 8, 1542. [Google Scholar] [CrossRef]
- Cui, J.W.; Tan, J.B.; Ao, L.; Kang, W.J. Optimized Algorithm of Laser Spot Center Location in Strong Noise. J. Phys. Conf. Ser. 2005, 13, 312–315. [Google Scholar] [CrossRef]
- Biswas, M.; Om, H. An Image Denoising Threshold Estimation Method. Adv. Comput. Sci. Its Appl. 2013, 377, 2166–2924. [Google Scholar]
- Chen, M.; Yang, P. An Adaptive Non-Local Means Image Denoising Model. In Proceedings of the 2013 6th International Congress on Image and Signal Processing (CISP), Hangzhou, China, 16–18 December 2013; Volume 1, pp. 245–249. [Google Scholar] [CrossRef]
- He, C.; Guo, K.; Chen, H. An Improved Image Filtering Algorithm for Mixed Noise. Appl. Sci. 2021, 11, 358. [Google Scholar] [CrossRef]
- BS PD ISO/TR 11146-3-2004; Lasers and Laser-Related Equipment. Test Methods for Laser Beam Widths, Divergence Angles and Beam Propagation Ratios. Intrinsic and Geometrical Laser Beam Classification, Propagation and Details of Test Methods. ISO: Geneva, Switzerland, 2004.


Publisher’s Note: MDPI stays neutral with regard to jurisdictional claims in published maps and institutional affiliations. |
© 2022 by the authors. Licensee MDPI, Basel, Switzerland. This article is an open access article distributed under the terms and conditions of the Creative Commons Attribution (CC BY) license (https://creativecommons.org/licenses/by/4.0/).