Article

Capability Enhancing of CO2 Laser Cutting for PMMA Sheet Using Statistical Modeling and Optimization

1
Faculty of Arts, Science and Technology, University of Northampton, Northampton NN1 5PH, UK
2
CIEFMA, Department of Materials Science and Engineering, EEBE, Universitat Politècnica de Catalunya, UPC, C/Eduard Maristany, 16, 08019 Barcelona, Spain
3
Barcelona Research Center in Multiscale Science and Engineering, Universitat Politècnica de Catalunya-Barcelona TECH, UPC, C/Eduard Maristany, 16, 08019 Barcelona, Spain
4
Department of Mechanical Engineering, École de Technologie Supérieure, 1100 Notre-Dame West, Montreal, QC H3C 1K3, Canada
5
Department of Mechanics, Mathematics and Management, Polytechnic University of Bari, Via Orabona 4, 70125 Bari, Italy
6
School of Mechanical, Aerospace and Automotive Engineering, Faculty of Engineering, Environment and Computing, Coventry University, Gulson Road, Coventry CV1 2JH, UK
*
Authors to whom correspondence should be addressed.
Appl. Sci. 2023, 13(23), 12601; https://doi.org/10.3390/app132312601
Submission received: 27 October 2023 / Revised: 15 November 2023 / Accepted: 21 November 2023 / Published: 22 November 2023

Abstract

:
Laser cutting is a widely used manufacturing process, and the quality of the resulting cuts plays a crucial role in its success. This research employed the Design of Experiments (DOE) to investigate the impact of input process parameters on kerf quality during the laser cutting of 5 mm polymethyl methacrylate (PMMA) sheets. Response surface methodology (RSM) was utilized to model the relationship between the input parameters and the kerf quality, with regression equations developed for each response using the Design Expert software. A statistical analysis revealed the significant effects of high laser power, cutting speed, and focal plane position on kerf quality. Optimization, guided by the desirability function, identified optimal parameter combinations that offered the most favorable tradeoff among various responses. Optimal conditions were found to involve a high laser power, a cutting speed ranging from 4 to 7 mm/s, and a focal plane position at the center. Experiments indicated the suitability of the models for practical applications. An overlay plot analysis revealed a weak negative correlation between the laser power and the cutting speed, while the focal plane’s position could be adjusted independently.

1. Introduction

In recent years, laser processing techniques have gained significant attention in various industrial applications, including laser cutting, welding, drilling, brazing, and surface modification [1,2,3,4]. Laser cutting, which is a “subtractive” digital manufacturing method, employs a laser to focus a considerable amount of energy onto an extremely small region in order to cut or engrave a material [5,6]. Laser cutting can be used on a wide range of materials, such as cardboard, wood, plastic, and textiles [7], and it uses optics to concentrate the output of a powerful laser on a small portion of the workpiece. As a result, the material is melted, burned, vaporized, impressed using a jet of gas, or otherwise removed, leaving behind a superior surface polish. Laser cutting can cut through materials up to 20 mm thick, depending on the laser’s power [7,8,9].
One polymer that has recently received considerable attention due to its superior chemical, physical, and mechanical properties is polymethyl methacrylate (PMMA), a synthetic thermoplastic polymer that is reasonably priced [10]. PMMA has been widely used in various applications, such as automotive, dental equipment, bone tissue, sensors, electronics, solar cells, and photodetectors [11]. The laser cutting of polymers, including PMMA, has attracted a lot of interest due to its high product quality, fast cutting speed, and high reliability [12]. The three main process variables in laser cutting are laser beam power, transverse laser speed, and supporting gas pressure. PMMA sheets have been previously sliced with a CO2 laser (with a wavelength of 10.64 μm) [13,14], as the molecular structure of PMMA works as an opaque medium with a high absorption of laser energy.
The low thermal diffusivity (7 × 10⁻⁷ m2/s) and low sublimation point (300 °C) of PMMA, in addition to its superior absorptivity, improve the cutting process’s precision and shorten the cutting time. A PMMA sheet absorbs energy, which is transformed into heat, causing the material to sublimate instantly. The material then evaporates and is evacuated using an aiding gas. Due to the short heating cycle and limited thermal diffusivity of PMMA during the laser cutting process, the temperature in the irradiated zone rises quickly, forming a heat-affected zone (HAZ) with altered mechanical characteristics in and around the cutting zone.
Laser technology has shown promise in various manufacturing processes, such as metal deposition, welding, and cutting [15,16,17]. Laser cutting offers several advantages over other conventional and unconventional cutting processes, such as turning, wire cutting, abrasive fluid jet, plasma, and ultrasonic, in cutting metallic and non-metallic materials [18,19]. These advantages include a high rate of speed, a good cut quality, a suitable kerf width and HAZ, and the absence of tool wear [20]. Laser cutting has even been successfully used to cut dangerous materials like the uranium dioxide pellets used in nuclear reactors [21].
Previous studies have explored the precision of the HAZ and kerf geometry when cutting different materials using laser cutting technology. For instance, Joshi et al. [22] studied the impact of pulse frequency and width, lamp current, cutting speed, and four other distinct laser cutting process parameters on the HAZ and kerf geometry when cutting 6061-T6 aluminum sheets using a Nd-YAG laser. The pulse frequency was found to have the greatest impact on the cutting process out of all the process variables studied. Nguyen et al. [23] examined the kerf width fluctuation in the CO2 laser cutting of steel 304 and found that the percentage of contribution of input parameters like laser power has more effects on the angle of the kerf.
Response surface methodology (RSM) serves as a powerful statistical and mathematical framework in the realm of experimental design and optimization [24,25]. Originating from the field of the design of experiments, RSM efficiently navigates complex parameter spaces, elucidating the intricate relationships between input variables and responses [26,27]. Widely adopted in diverse disciplines, RSM empowers researchers and engineers to systematically explore, model, and optimize processes, ensuring efficiency and precision. By providing a structured approach to experimentation, RSM significantly contributes to advancing scientific understanding and technological innovation, making it an indispensable tool for optimizing complex systems and processes. RSM facilitates a comprehensive understanding of the intricate relationships between FDM [28] and EDM [29,30] parameters, such as raster angle, air gap, raster width, current, pulse on time, and pulse off time, and critical performance measures like compressive stress, percentage deformation, breaking stress, material removal rate, tool wear rate, and surface roughness. The utilization of RSM not only aids researchers in uncovering the optimal combinations of parameters for enhanced outcomes but also contributes to advancing the efficiency and effectiveness of these advanced manufacturing techniques [31,32].
In this study, the authors employed response surface methodology (RSM), a well-established Design of Experiments (DOE) technique, to explore the impact of three input variables—laser power (LP), focal plane position (FPP), and cutting speed (CS)—on the kerf wall’s geometry and quality in 5 mm thick polymethyl methacrylate (PMMA) sheets. Utilizing the Design Expert v17 software, the study extensively measured and statistically analyzed top and bottom kerf width, the ratio of the upper kerf to the lower kerf, and the cut angle of the kerf wall. An optimization process was undertaken to identify optimal laser cutting parameters that yield the desired geometrical characteristics of the cut kerf. Seventeen cutting experiments were conducted at the optimal settings to validate the optimization results, comparing the outcomes with the software optimization results. The primary objectives were directed at enhancing kerf quality by determining the most effective combination of the input parameters—laser power, cutting speed, and focal plane position. The optimization method employed in this study was centered around the desirability approach, a well-established technique in the field of Design of Experiments (DOE). Desirability functions are utilized for the systematic and comprehensive evaluation of multiple responses simultaneously, enabling the determination of optimal process conditions. By assigning desirability values to different levels of each response, the approach facilitates the identification of parameter combinations that collectively meet the desired criteria [33]. This methodology is particularly advantageous in laser cutting processes, where multiple factors influence the quality and geometry of the kerf. Through the desirability approach, this research aims to not only enhance specific aspects of the kerf, such as width and angle, but also find a balance that maximizes the overall cutting performance. This investigation leveraged Design of Experiments (DOE) and response surface methodology (RSM) to model the intricate relationship between the input parameters and the kerf’s quality. The optimization process, guided by a desirability function, sought parameter values maximizing the desirable outcomes, such as a minimized kerf width, an improved cut angle, and a specific ratio of upper to lower kerf dimensions.

2. Experimental Design and Methodology

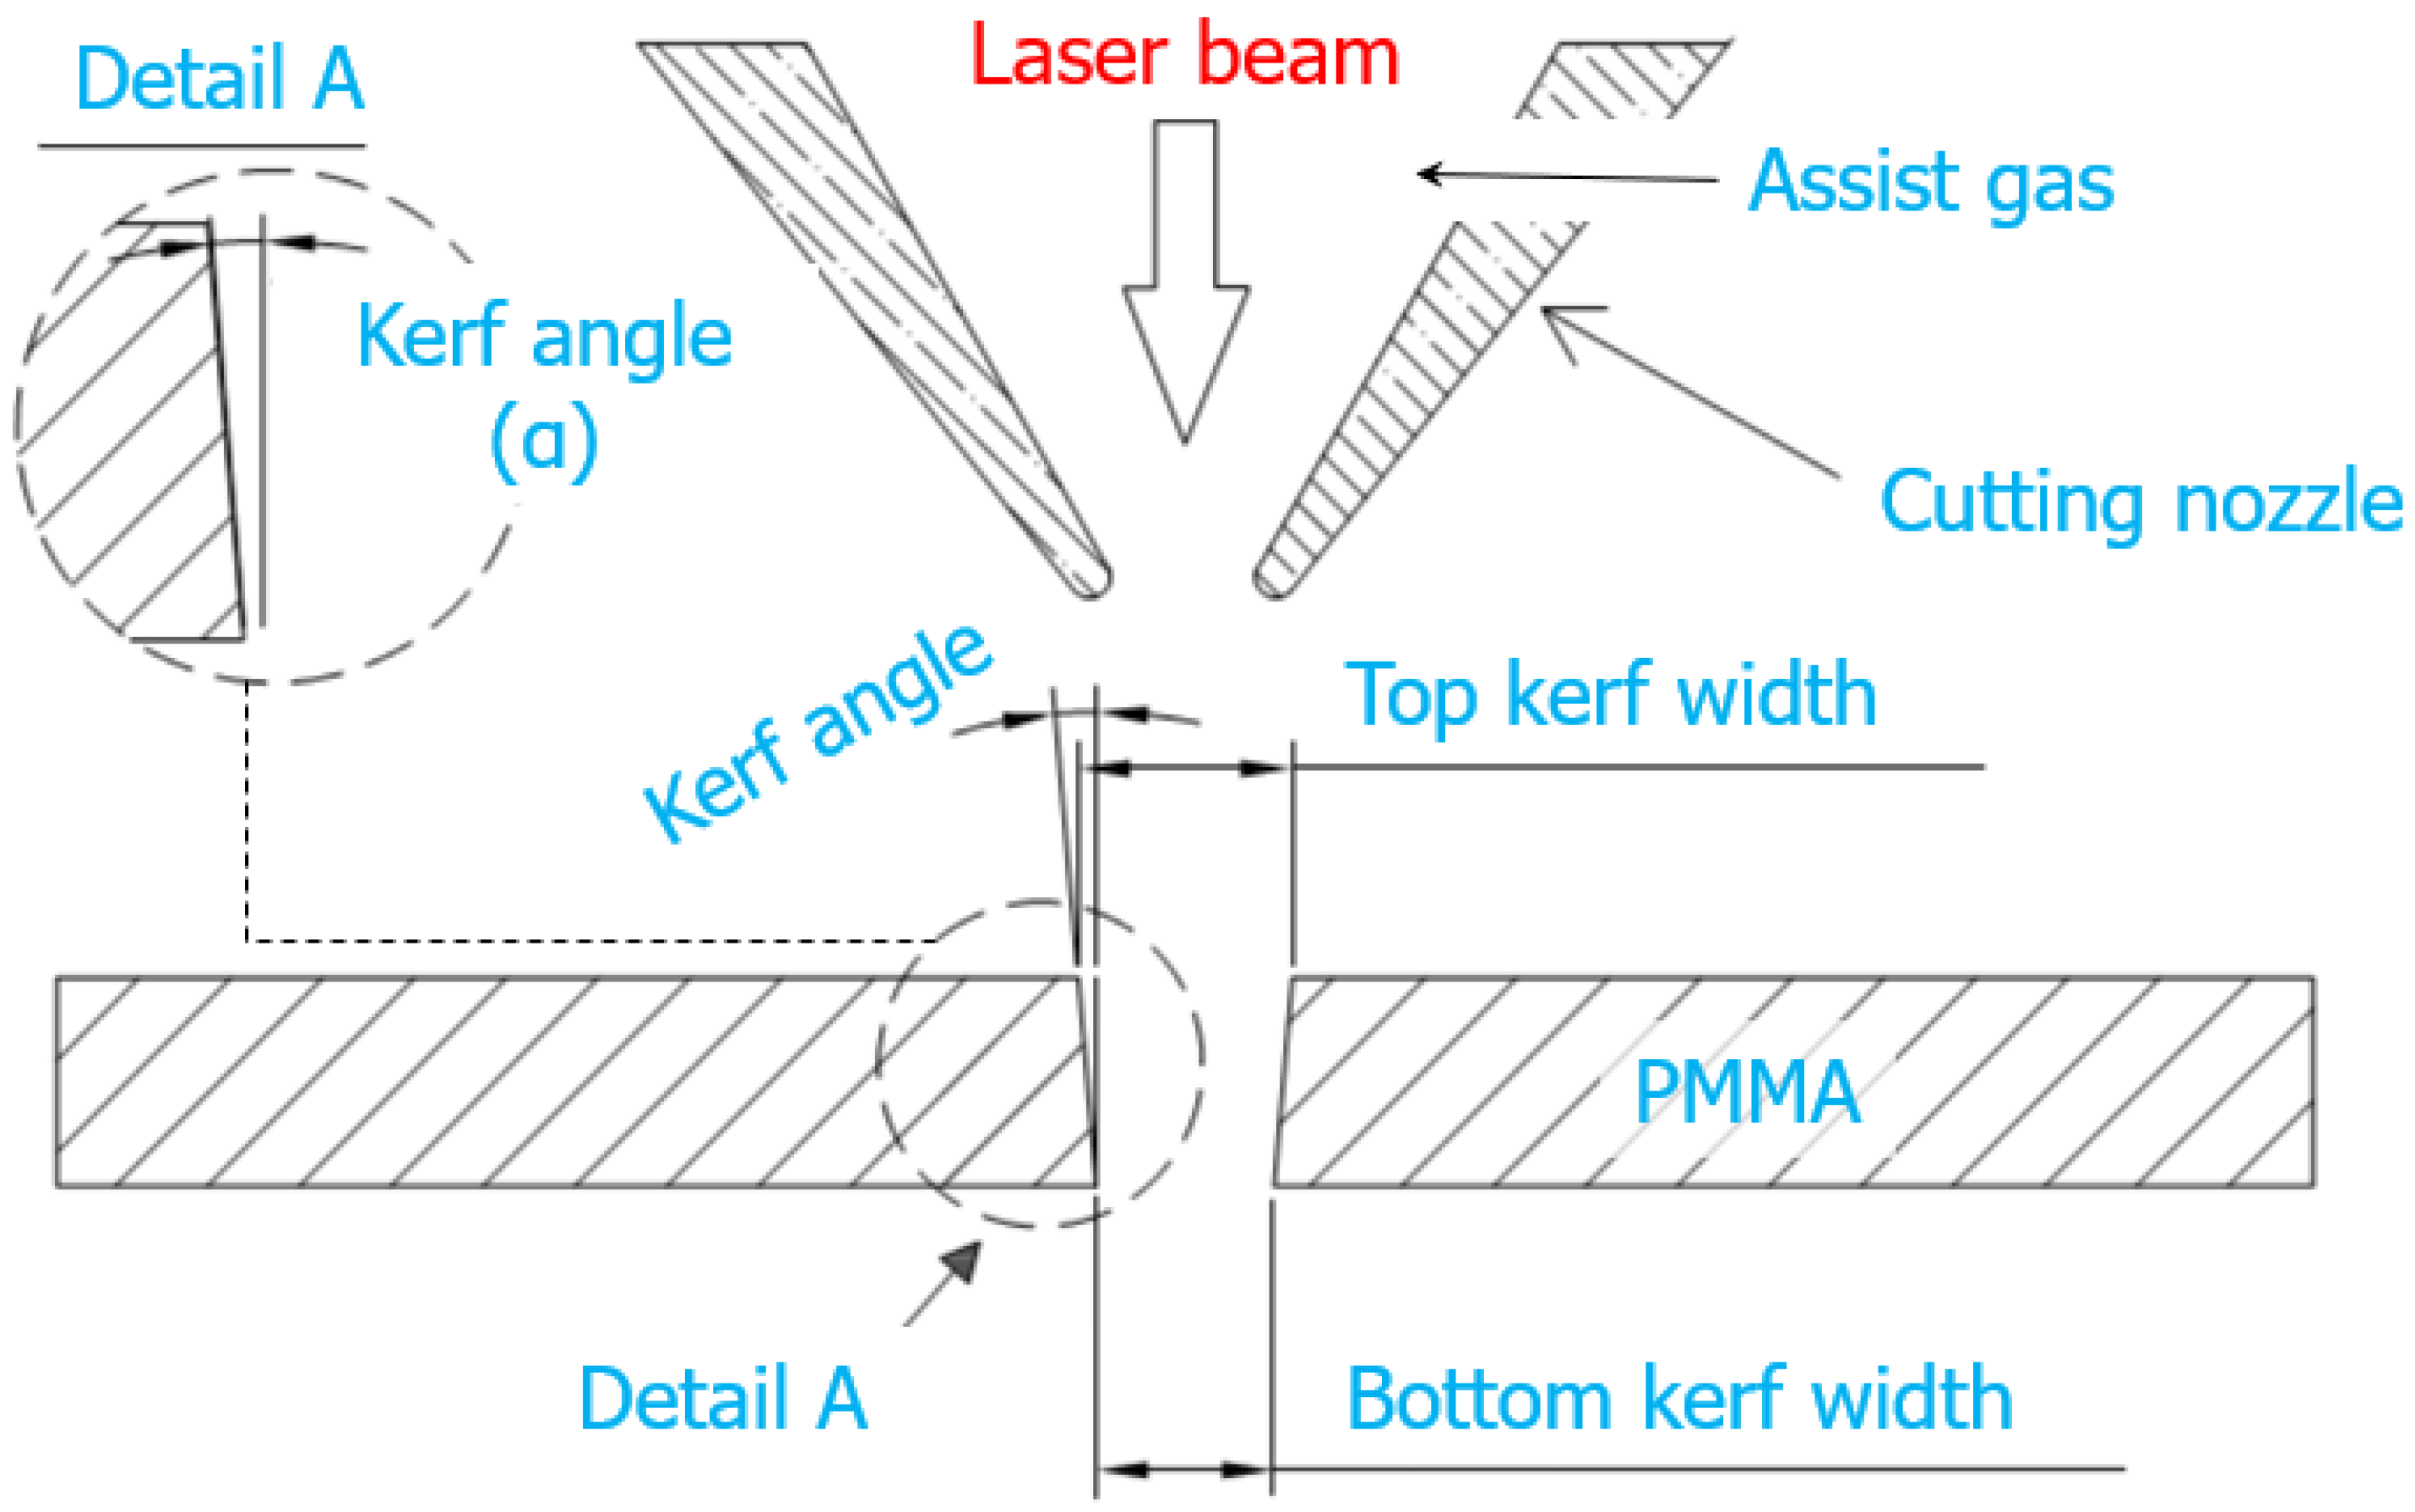
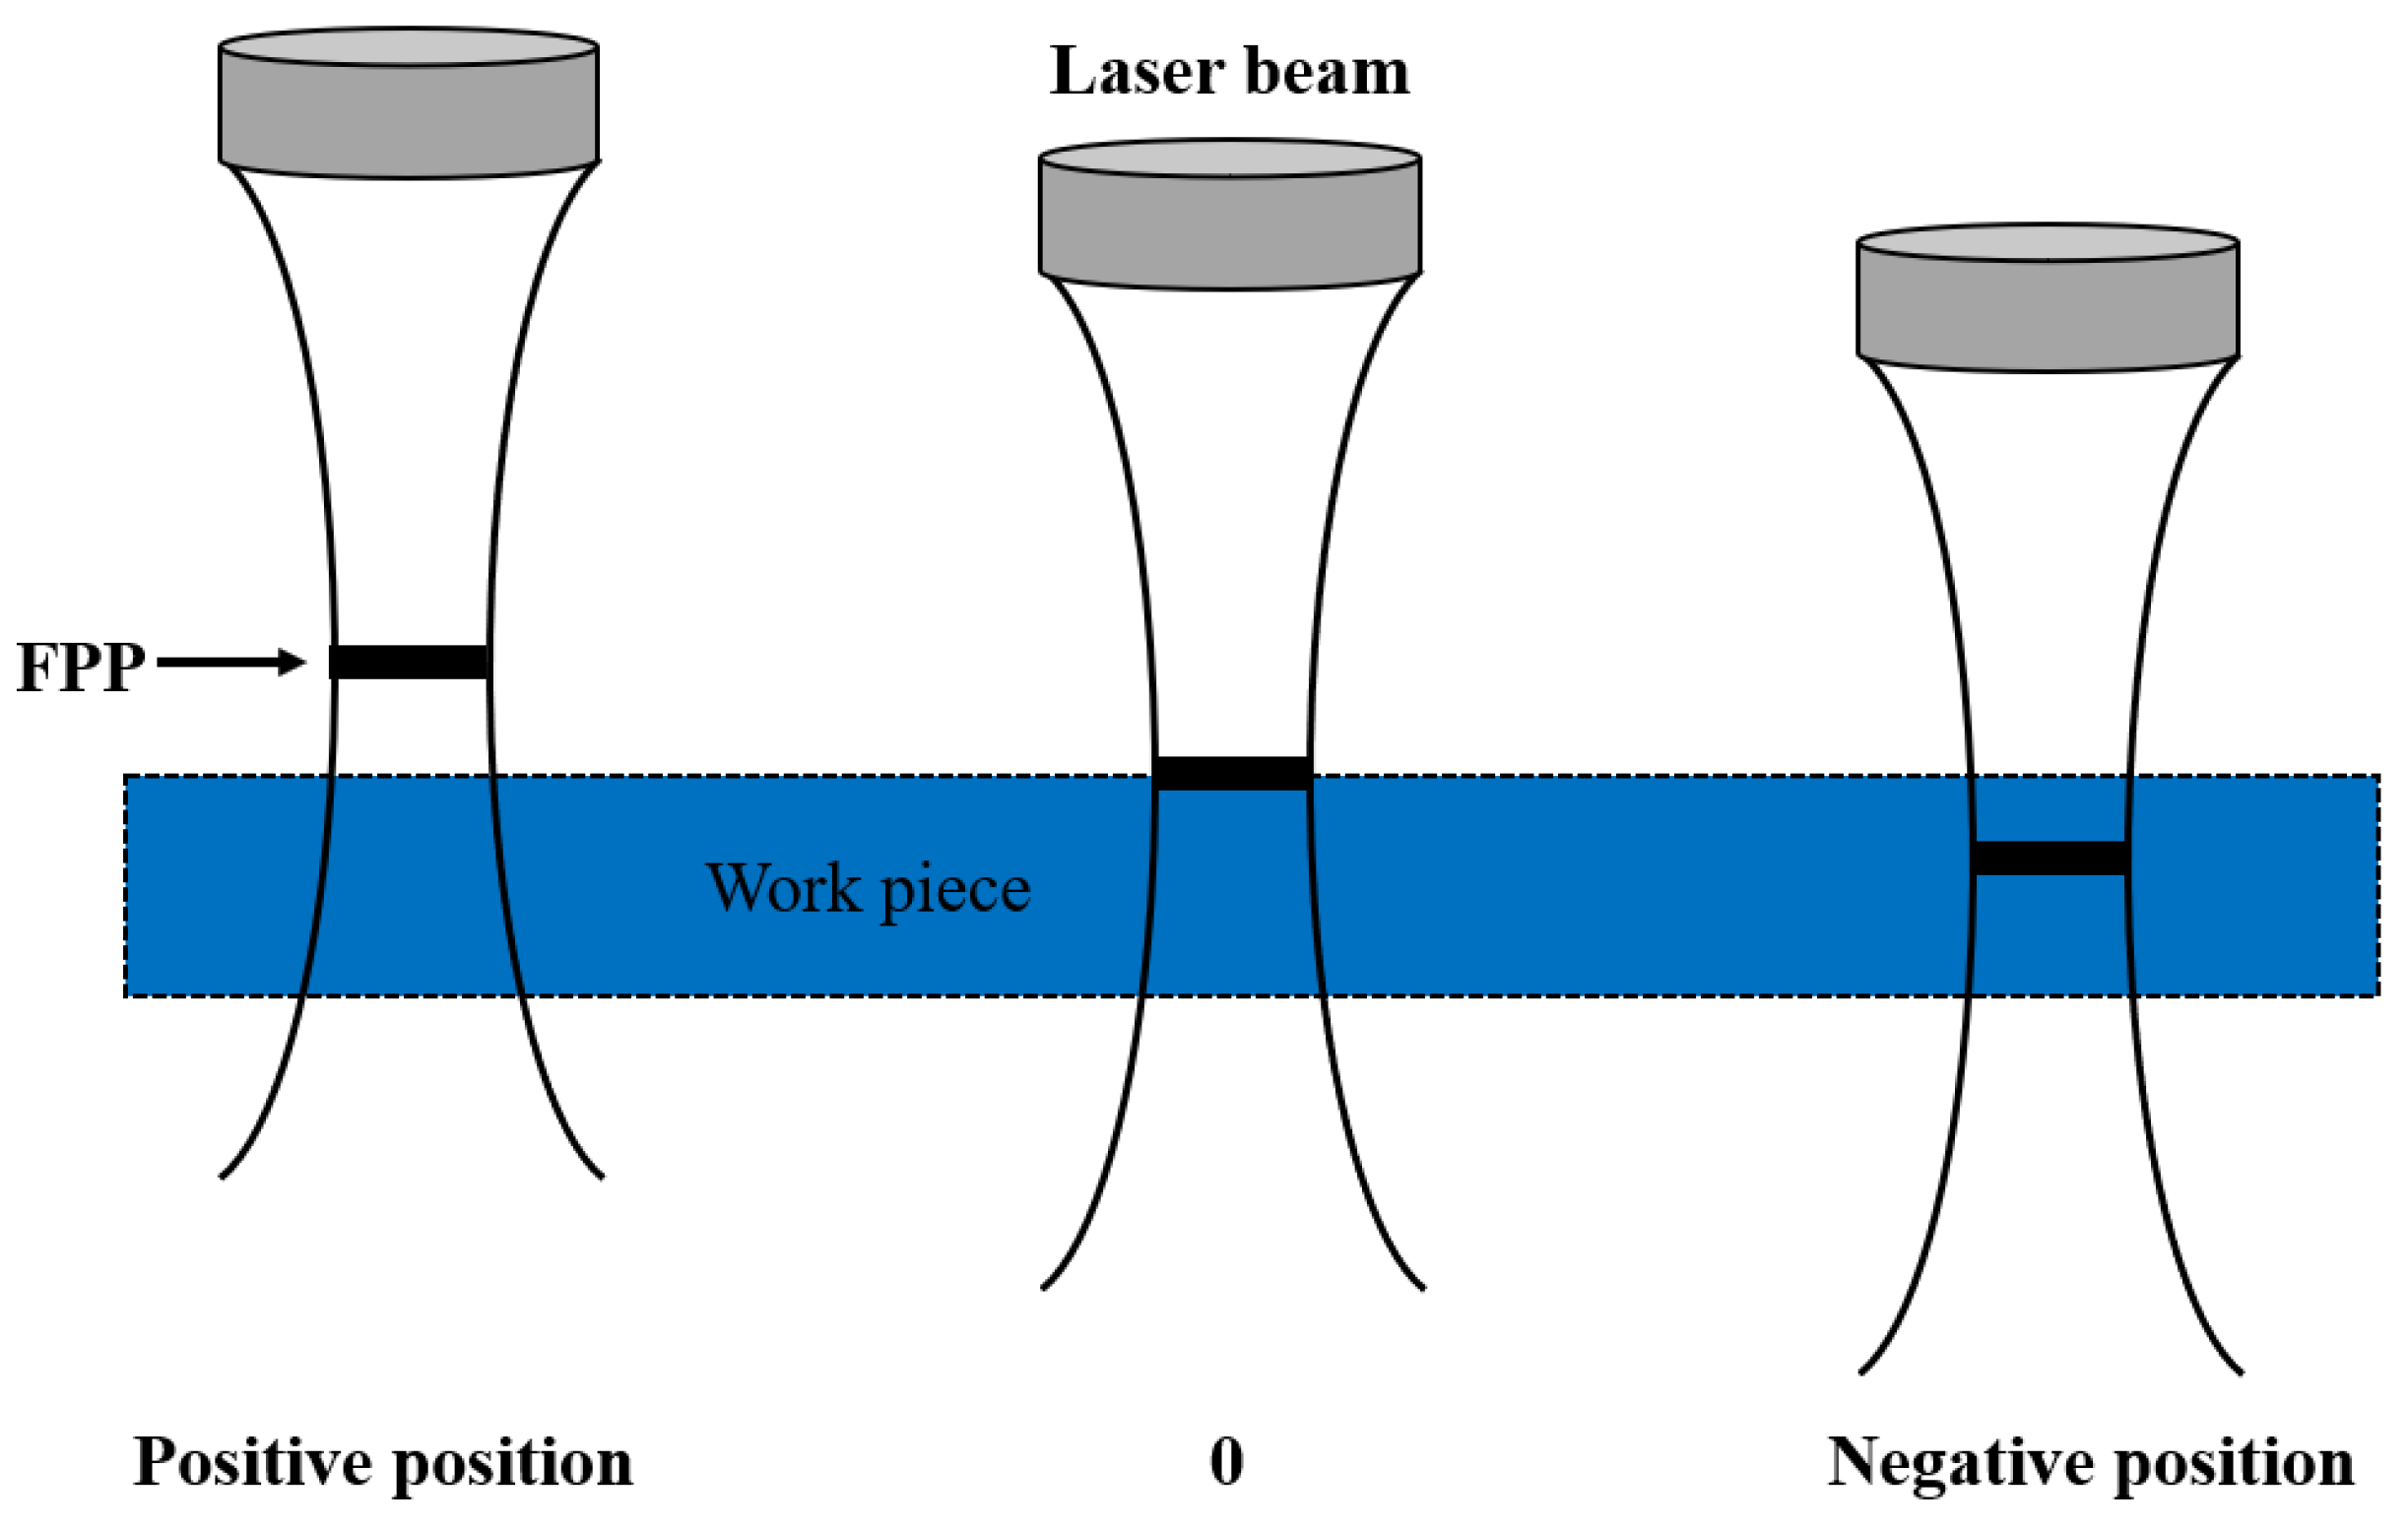
2.1. Laser Cutting Process

The material of interest for this investigation is polymethyl methacrylate (PMMA), which is a transparent thermoplastic with a high molecular weight and excellent optical properties. The PMMA utilized in this study was in the form of sheets with a thickness of 5 mm supplied by Perspex (Brønderslev, Denmark). The properties of the PAMM are listed in Table 1. The main objective of this research was to analyze the kerf properties of the 5 mm PMMA sheets during the CO2 laser cutting process. The study primarily focused on examining the width at the top and bottom of the kerf (mm), the ratio of the top to bottom, the cut kerf angle, and the potential correlations between these parameters and the process variables of laser power, cutting speed, and focal plane position.
During the experiment, a Carbon Dioxide (CO2) laser machine operating at a wavelength of 1060 nm was employed to cut the PMMA plastic material. The laser power was applied on the surface of the sheets, and the machine used a continuous CO2 laser to examine the thermophysical properties of the PMMA sheet’s surface. A continuous laser beam was selected to ensure a stable and uniform energy delivery, which was essential for assessing the cut quality reliably. The laser beam was focused through a lens with a specific focal length, and the laser cutter used had a nominal output laser power of 60 W, which was verified using a laser power probe for the laser cutting machine. Compressed air was supplied to the cutting zone via a 1 mm diameter nozzle, and the distance between the nozzle and the object was set to 4 mm (Figure 1). Each consecutive cut was 50 mm in length, spaced 20 mm apart.
Several methods exist for determining the focal position. In this study, a method involving an acrylic sheet placed at an 80-degree angle with respect to the horizontal plane was employed. By horizontally traversing the sheet across the vertical beam, the imprint of the beam on the sheet provided the location of the focal point (Figure 2) [35].

2.2. Response Surface Methodology (RSM)

In order to investigate the causes of changes in the response variable, the input variables were systematically altered in each experiment. The aim was to develop a mathematical model that accurately represented the relationship between the response and input variables with the least amount of error [25]. There are various Design of Experiments (DOE) methods available, depending on the type of input variable parameters studied [36]. The current study used Response Surface Methodology (RSM) as the design method, which combines statistical methods and applied mathematics to analyze output variables that are influenced by multiple independent input variables. The experiment was designed to determine the optimal values for three key parameters that initiate the cutting process: laser power, laser speed, and focal plane position (with a maximum laser power of 60 W). A test material made of acrylic in a rectangle shape with 17 different lines was used for the cutting test, using a fixed step between the lines. In Table 2, three independent parameters (laser power, cutting speed, and focal plane position) are considered for the laser cutting test, with variable values ranging from −2 to 2. For each parameter, five coded values are taken, with a laser power ranging from 40 W to 60 W with a 5 W interval, a laser speed ranging from 4 mm/s to 16 mm/s, and focal plane positions from −2 to 2 mm (Figure 3).
To establish the operational boundaries of each parameter for laser cutting, test samples were fabricated by altering one of the process variables while maintaining a narrow kerf width. The experimental design adopted was the matrix scheme of DOE, as shown in Table 3, with the gas pressure set at a fixed value of 3 bars. The geometrical properties of the kerf width at the top and bottom were measured using an optical microscope from Graticules Ltd. (Kent, UK) at a 70× magnification, and the acquired images were evaluated using the ImageJ v1.3 software.
Figure 4a displays the 17 experiments of laser cutting on a PMMA sheet with a thickness of 5 mm. The effect of the input parameter variations for the minimum and maximum kerf geometry of the chosen experiments mentioned in Table 3 is depicted in Figure 4b–e. The term “bulges” in Figure 4b refers to the sputters and materials flow-out from the cut kerf.

3. Results and Discussion
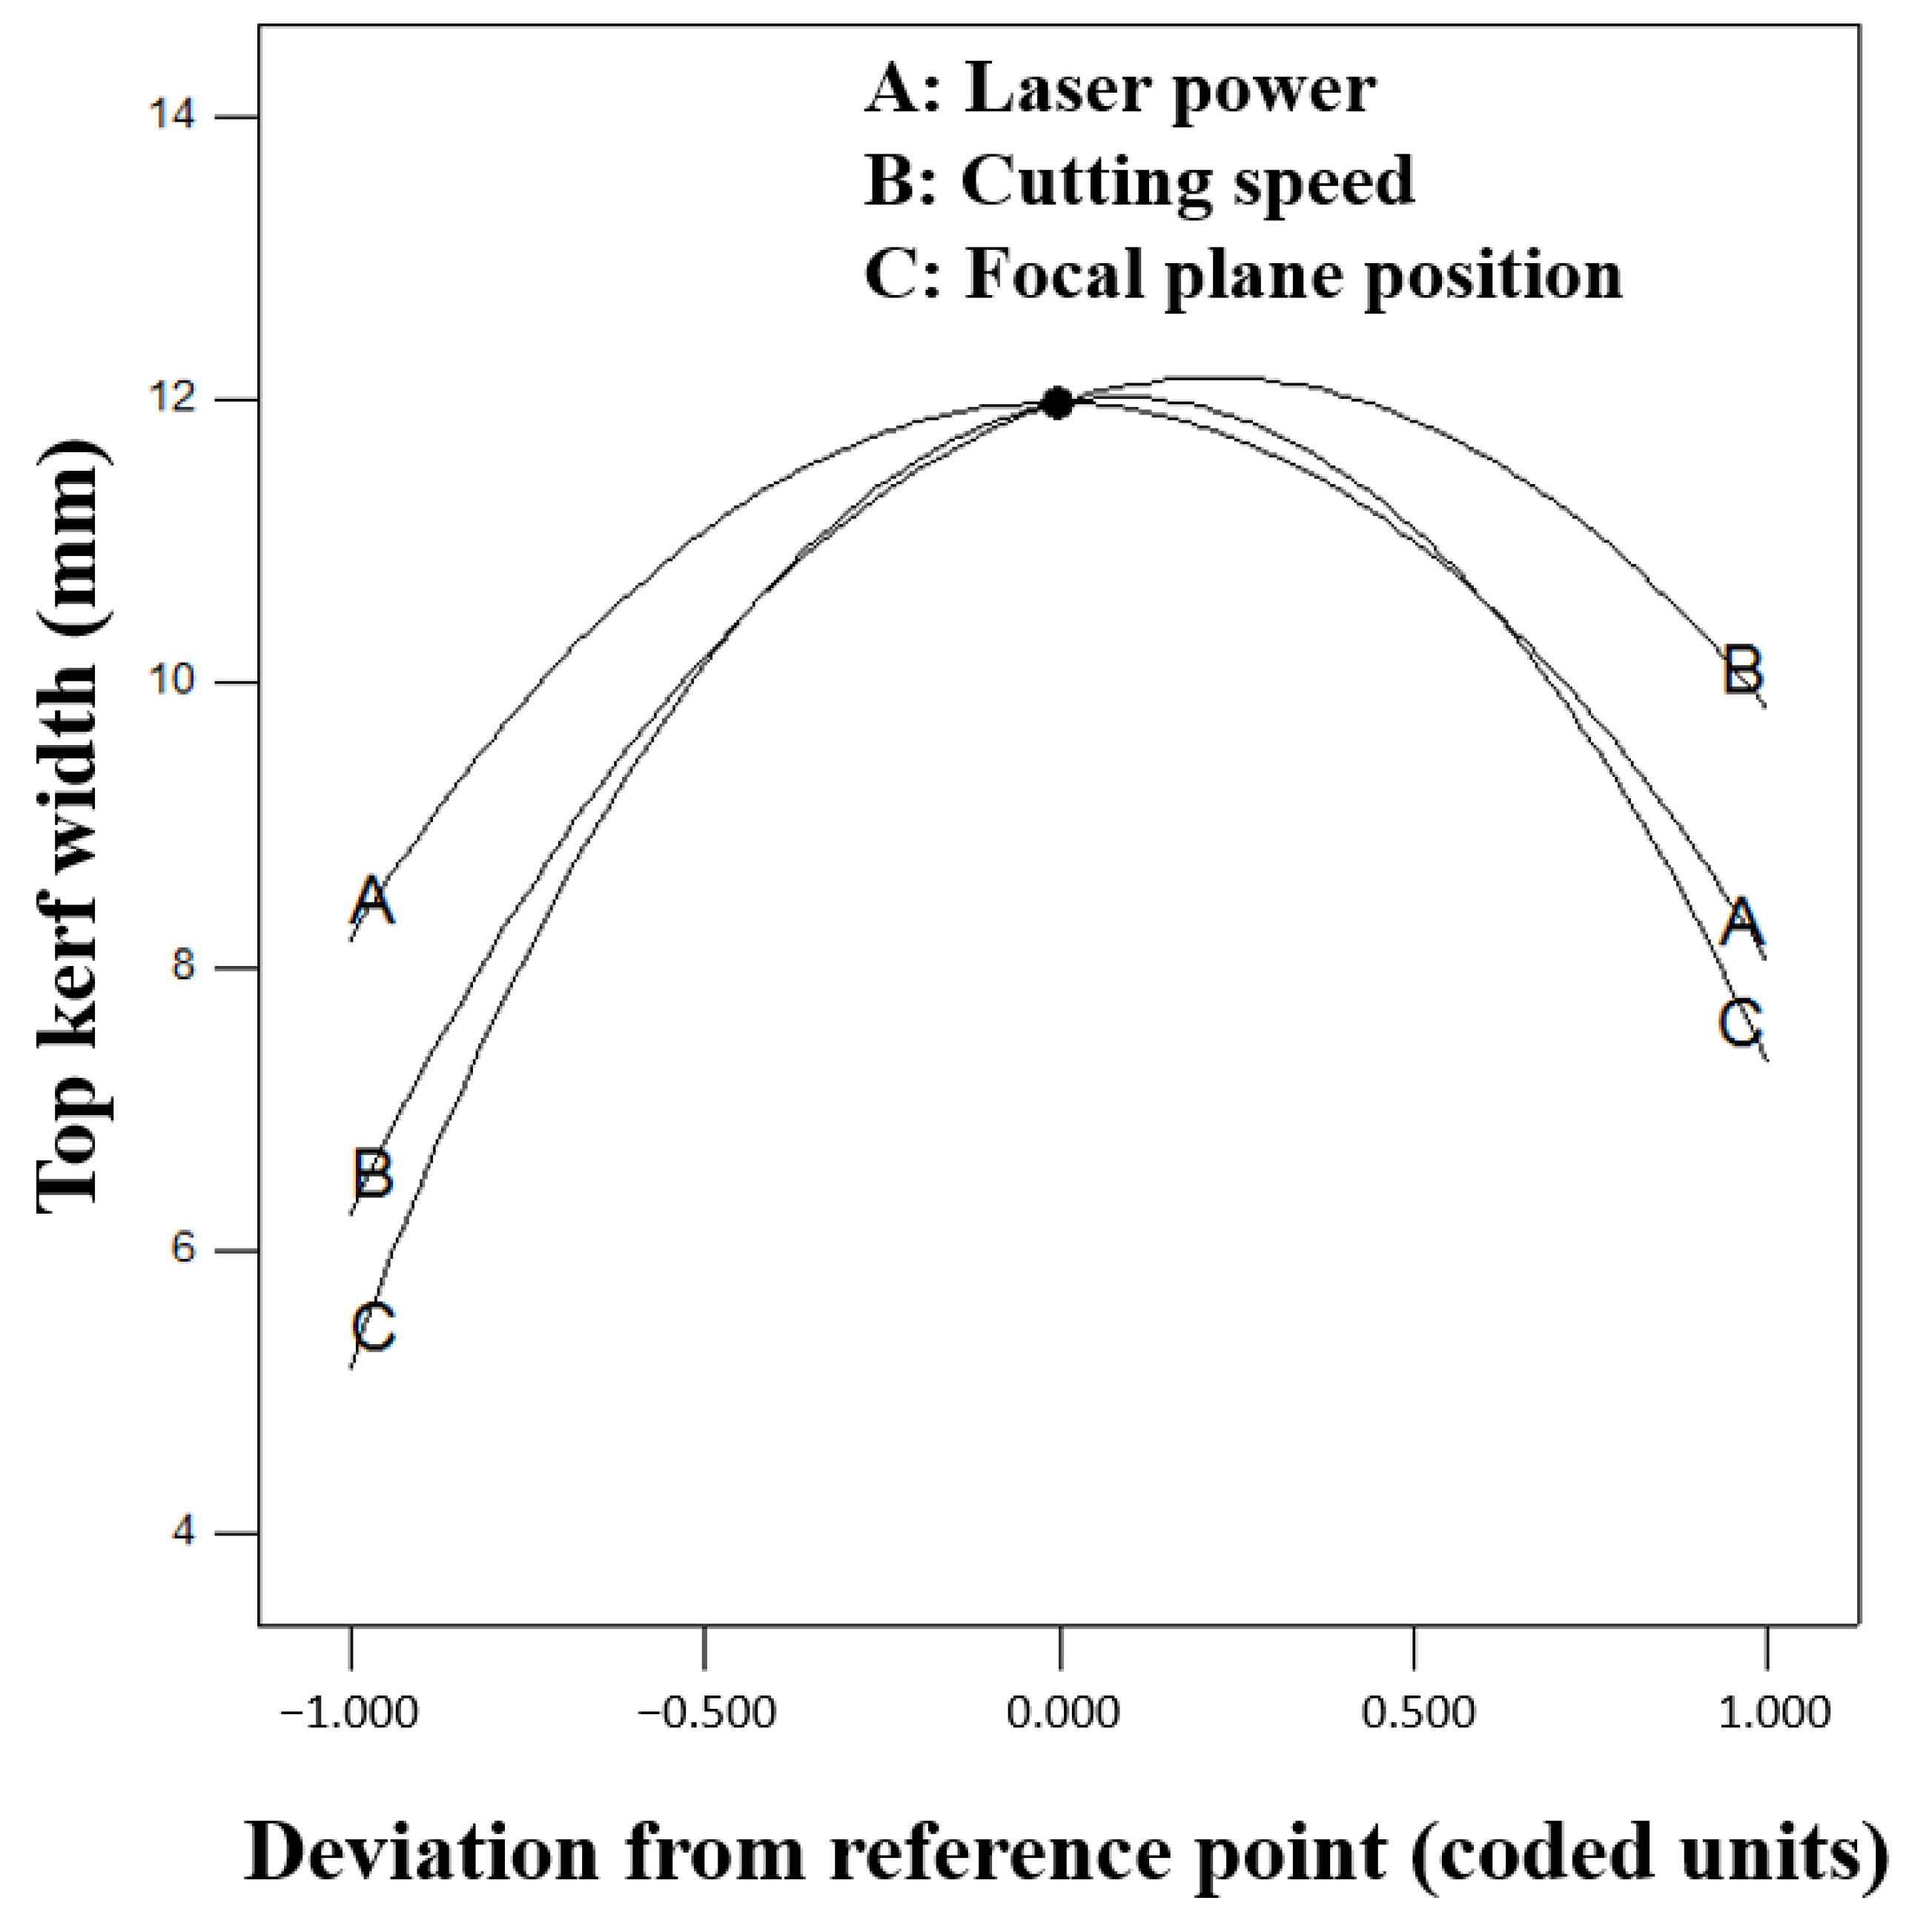
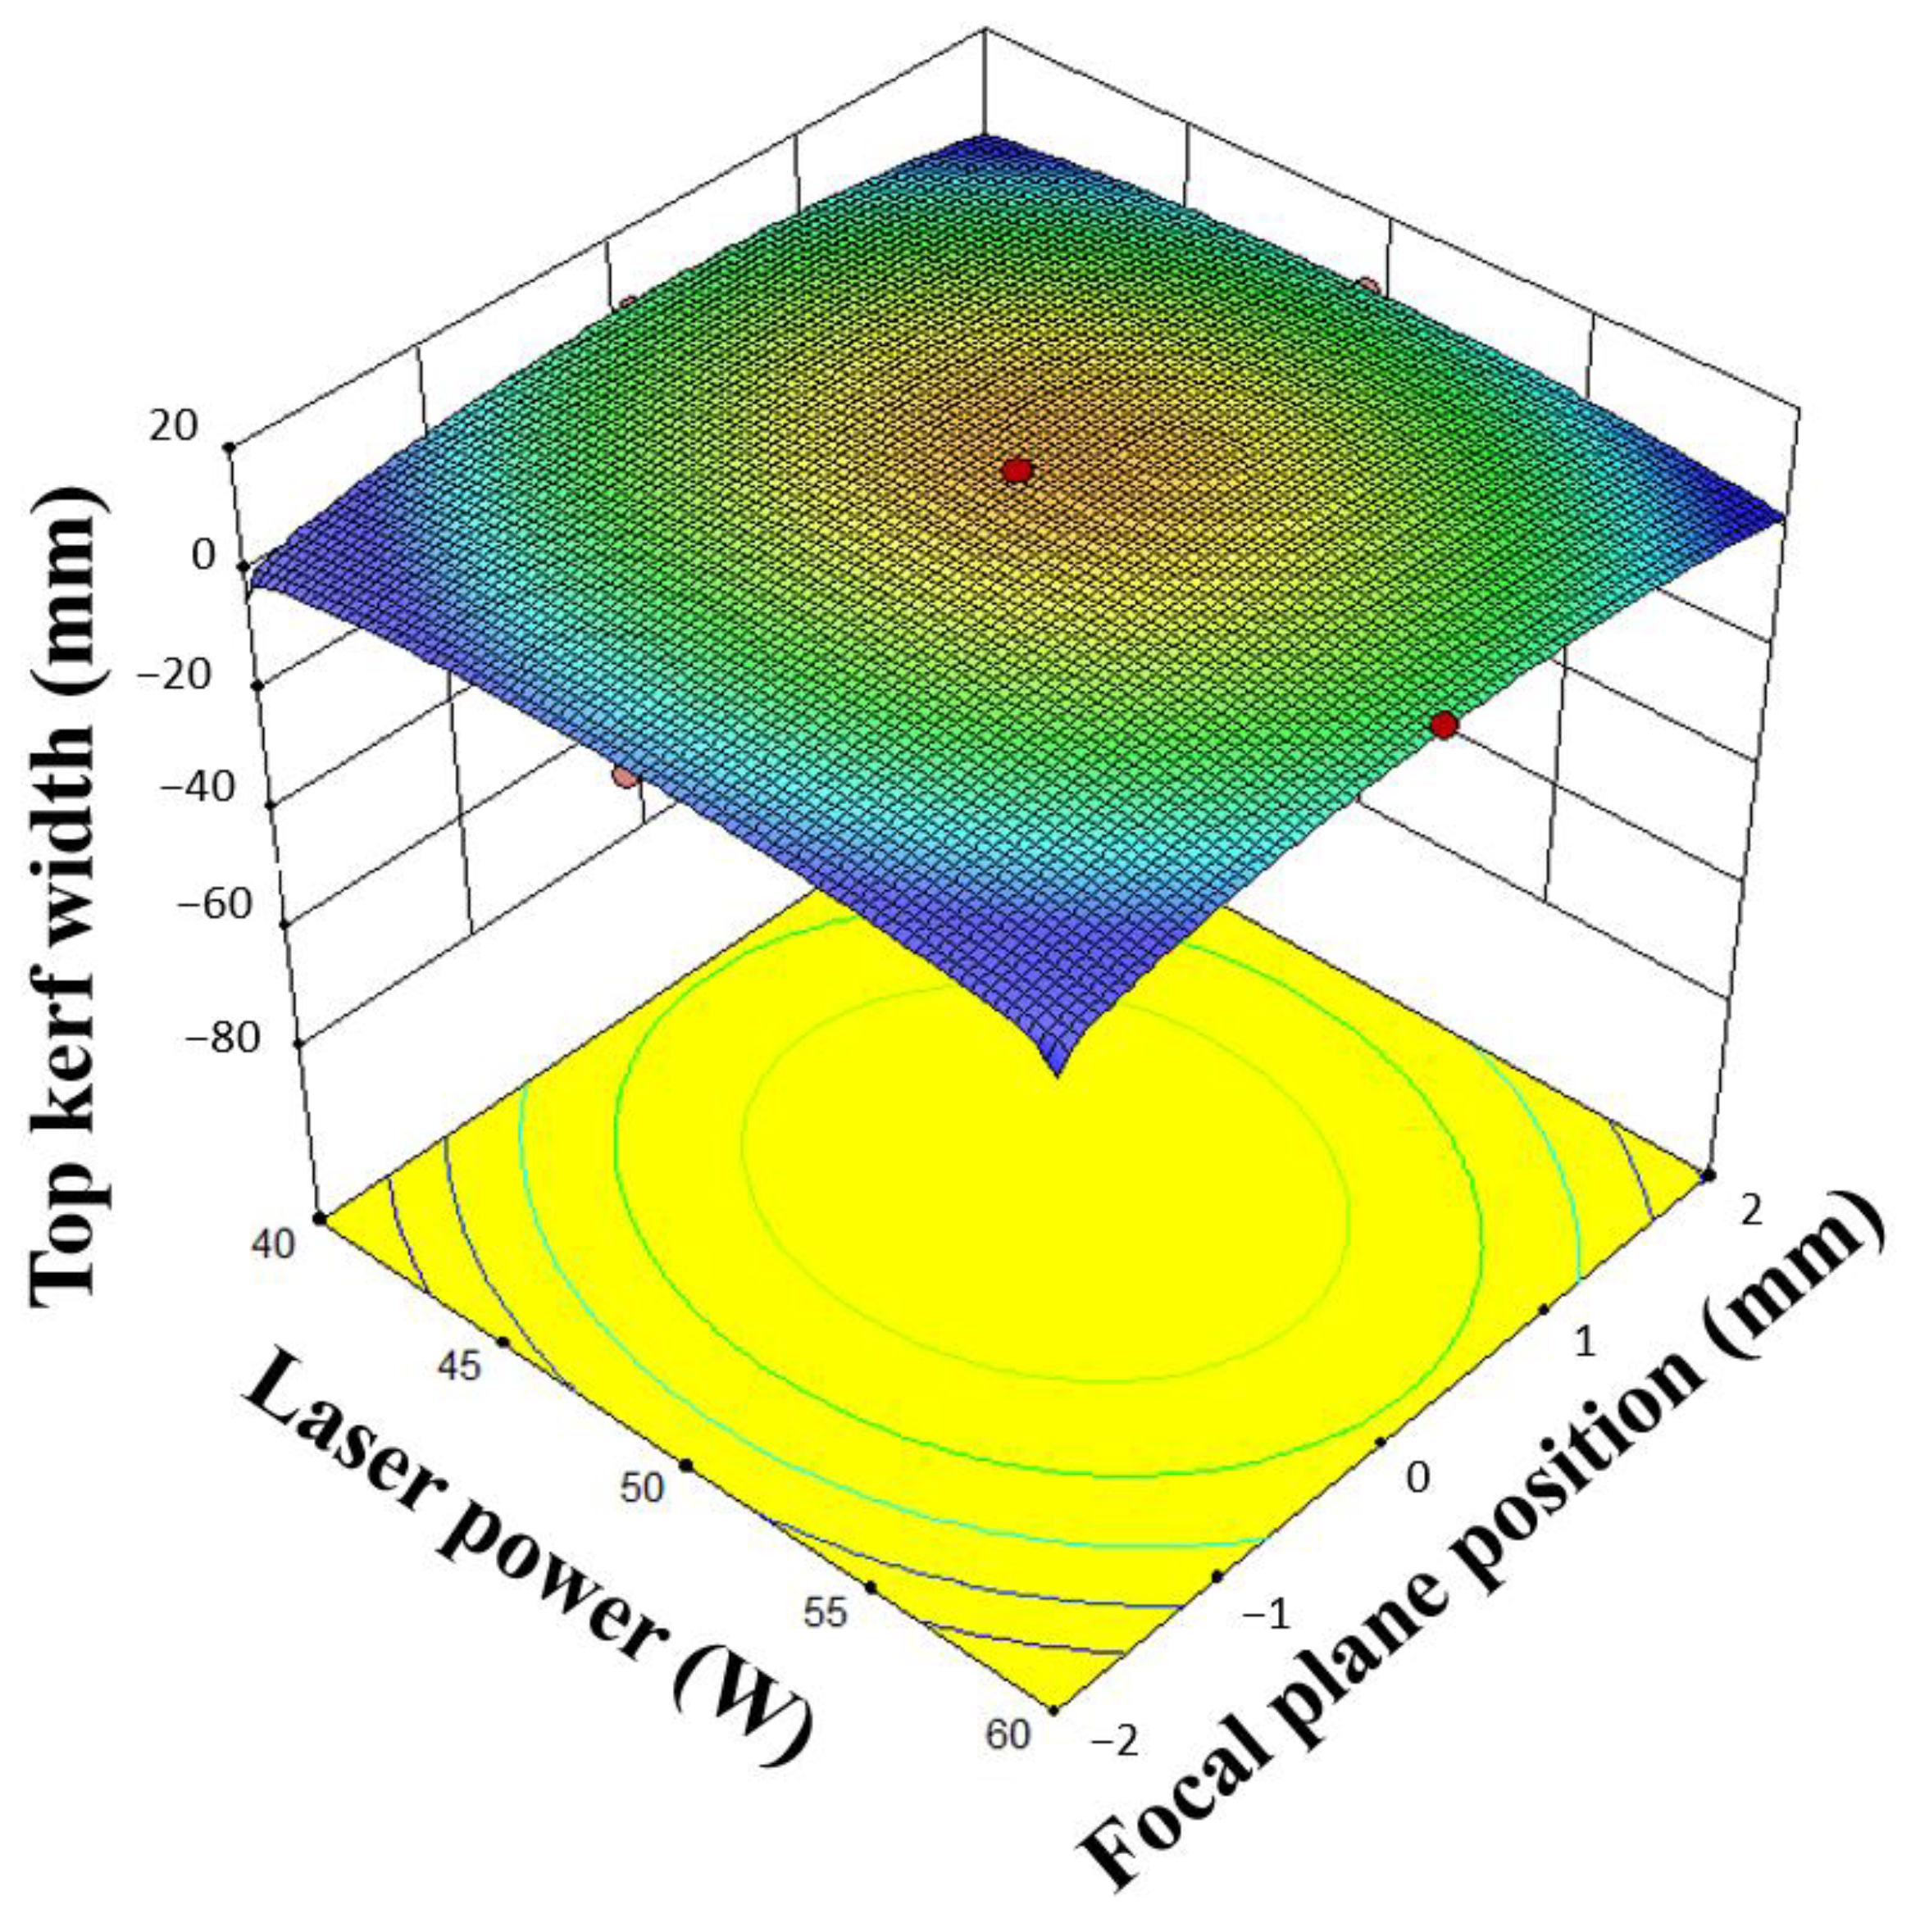
In this experiment, the responses measured were the top and bottom kerf width, the ratio of the upper kerf to lower kerf, and the cut kerf angle. The data obtained from the experiment were analyzed using an analysis of variance (ANOVA) to identify significant factors affecting the laser cutting process. The full quadratic polynomial function was employed in the analysis.

3.1. Top Kerf Width

Table 4 presents the results of the analysis of variance for the top kerf width, which revealed that the laser’s focal plane position (FPP) has a significant linear and quadratic effect on the response variable. Additionally, all parameter interactions are significant, as shown in Figure 5. The regression equation obtained is significant, while the lack of fit is not significant. A regression equation is considered good if it is significant and the lack of fit is insignificant. Hence, based on the analysis, the final regression equation in terms of the coded parameter values can be expressed as Equation (1).
( T o p   k e r f   w i d t h ) 1.19 = 182.25 + 7.06 × L P + 4.49 × C S + 0.89 × F P P 0.07 × L P 2 0.19 × C S 2 2.56 × F P P 2
In Figure 6, the response surface plot for the top kerf width is shown with respect to the input variables. In Figure 6, it can be observed that decreasing the laser focal plane position (FPP) leads to a decrease in the top kerf width. This indicates that, when the laser spot point is located deeper in the specimen, the upper kerf width is reduced. On the other hand, when the focused laser beam is used at the zero level of the FPP, the laser power spreads over a wider surface area, resulting in more heat energy interacting with the specimen and increasing the top kerf width. The figure clearly shows that the maximum top kerf width occurs in the middle (level 0) of the FPP and in the middle level of the cutting speed. The observation of the laser power and cutting speed can be explained with the heat input value mentioned in Equation (4) and Table 3, as follows:
H e a t   i n p u t = L a s e r   p o w e r / C u t t i n g   s p e e d
The increase in laser power and decrease in cutting speed lead to an increase in the heat input and a wider kerf width due to the larger area of material being melted and, also, more bulges. It is important to note that in samples NO. 1, 11, 7, and 17 complete cutting was not achieved, and, therefore, none of the responses could be measured (Table 3). This can be explained using the heat input concept in Equation (2). In these samples, the laser power was too low, the cutting speed too high, and the focal plane position was on or near the top surface, which resulted in insufficient energy from the laser beam for effective cutting. A comparison of the samples No. 11 and No. 14 indicates that, although the laser power and cutting speed were the same, the only difference was the focal plane position. In sample No. 14, the FPP was located 1 mm below the top surface, while, in sample No. 11, the FPP was located −1 mm below the top surface (Figure 6).
Figure 7 depicts the residual plot for the top kerf width, where the normal probability diagram shows that the response of the top kerf width is randomly scattered around the diagonal line and follows a normal distribution in comparison to the other responses. As a result, the final regression model obtained is a suitable model for predicting and investigating the effects of the parameters in proportion to the other responses. Therefore, the mathematical equation derived from the model is a desirable tool for predicting and investigating the effects of the experimental parameters.
From the residuals plot, it appears that there is a moderate negative correlation between the heat input and the top kerf width, as the points tend to cluster in a downward-sloping pattern. To confirm this, the Pearson correlation coefficient was calculated, which measured the strength and direction of the linear relationship between the two variables. The Pearson correlation coefficient for these data was −0.589, which indicated a moderate negative correlation. A simple linear regression analysis to create a mathematical model that predicts the top kerf width based on the heat input was performed. This indicated that, as the heat input increased, the top kerf width decreased. During the process of CO2 laser cutting through a 5 mm thick PMMA sheet, the intense heat generated by the focal point vaporizes the material, leading to the formation of a plasma plume that is expelled from the kerf. This technique induces a turbulent flow of gas that can eject some of the molten material, resulting in irregularities and deformations on the cut edges. Moreover, the high temperature of the laser generates thermal stress within the material, causing localized melting and the re-solidification of the PMMA. This phenomenon can lead to the formation of slight protrusions or bulges around the cut edges of the material’s surface. Consequently, the formation of bullet-like debris after cutting PMMA is a result of the molten material being expelled by the gas flow and the localized melting and re-solidification induced by the laser’s heat. The presence of these bullet pieces can have a significant impact on the precision and quality of the cut, especially when tight tolerances are necessary.
The expulsion of molten PMMA during laser cutting is a multifaceted phenomenon intricately linked to various factors. While laser parameters play a pivotal role, the hydrodynamic properties of the PMMA melt and the thickness of the sample are equally critical contributors. The interaction of these elements influences the dynamics of material ejection, shaping the characteristics of the cut. The hydrodynamic parameters, including viscosity and flow behavior of the molten PMMA, intricately intertwine with the laser-induced thermal effects. Furthermore, the thickness of the sample introduces additional complexities, influencing the distribution and dissipation of heat within the material.

3.2. Bottom Kerf Width

Table 5 displays the results of the analysis of variance (ANOVA) conducted on the bottom kerf width, revealing that the cutting speed (CS) is the primary significant factor. The quadratic term of the laser cutting speed (CS2) was found to have a significant effect among the quadratic terms, and the interaction effect of the laser power and cutting speed (LP × CS) was also significant. The lack-of-fit test indicated that the analysis performed was appropriate. The regression equation for the bottom kerf width, based on the significant parameters using coded values, can be represented using Equation (3).
( B o t t o m   k e r f   w i d t h ) 0.32 = + 13.31 0.27 × L P 0.89 × C S + 0.02 × L P × C S 0.02 × C S 2
Figure 8 illustrates the response surface analysis for the bottom kerf width as a function of the input parameters. Figure 8a reveals that the effect of the cutting speed changes direction based on the focal plane position. Specifically, the impact of the cutting speed on the bottom kerf width is more pronounced at the minimum level of the FPP than at the maximum level of the FPP, and vice versa. This phenomenon is attributed to the interaction effect of these two parameters. Additionally, Figure 8b demonstrates that decreasing the laser power and increasing the cutting speed leads to a reduction in the bottom kerf width. This observation can be explained with Equation (3), where a decrease in heat input results in less material being melted and heated, leading to a narrower kerf width.

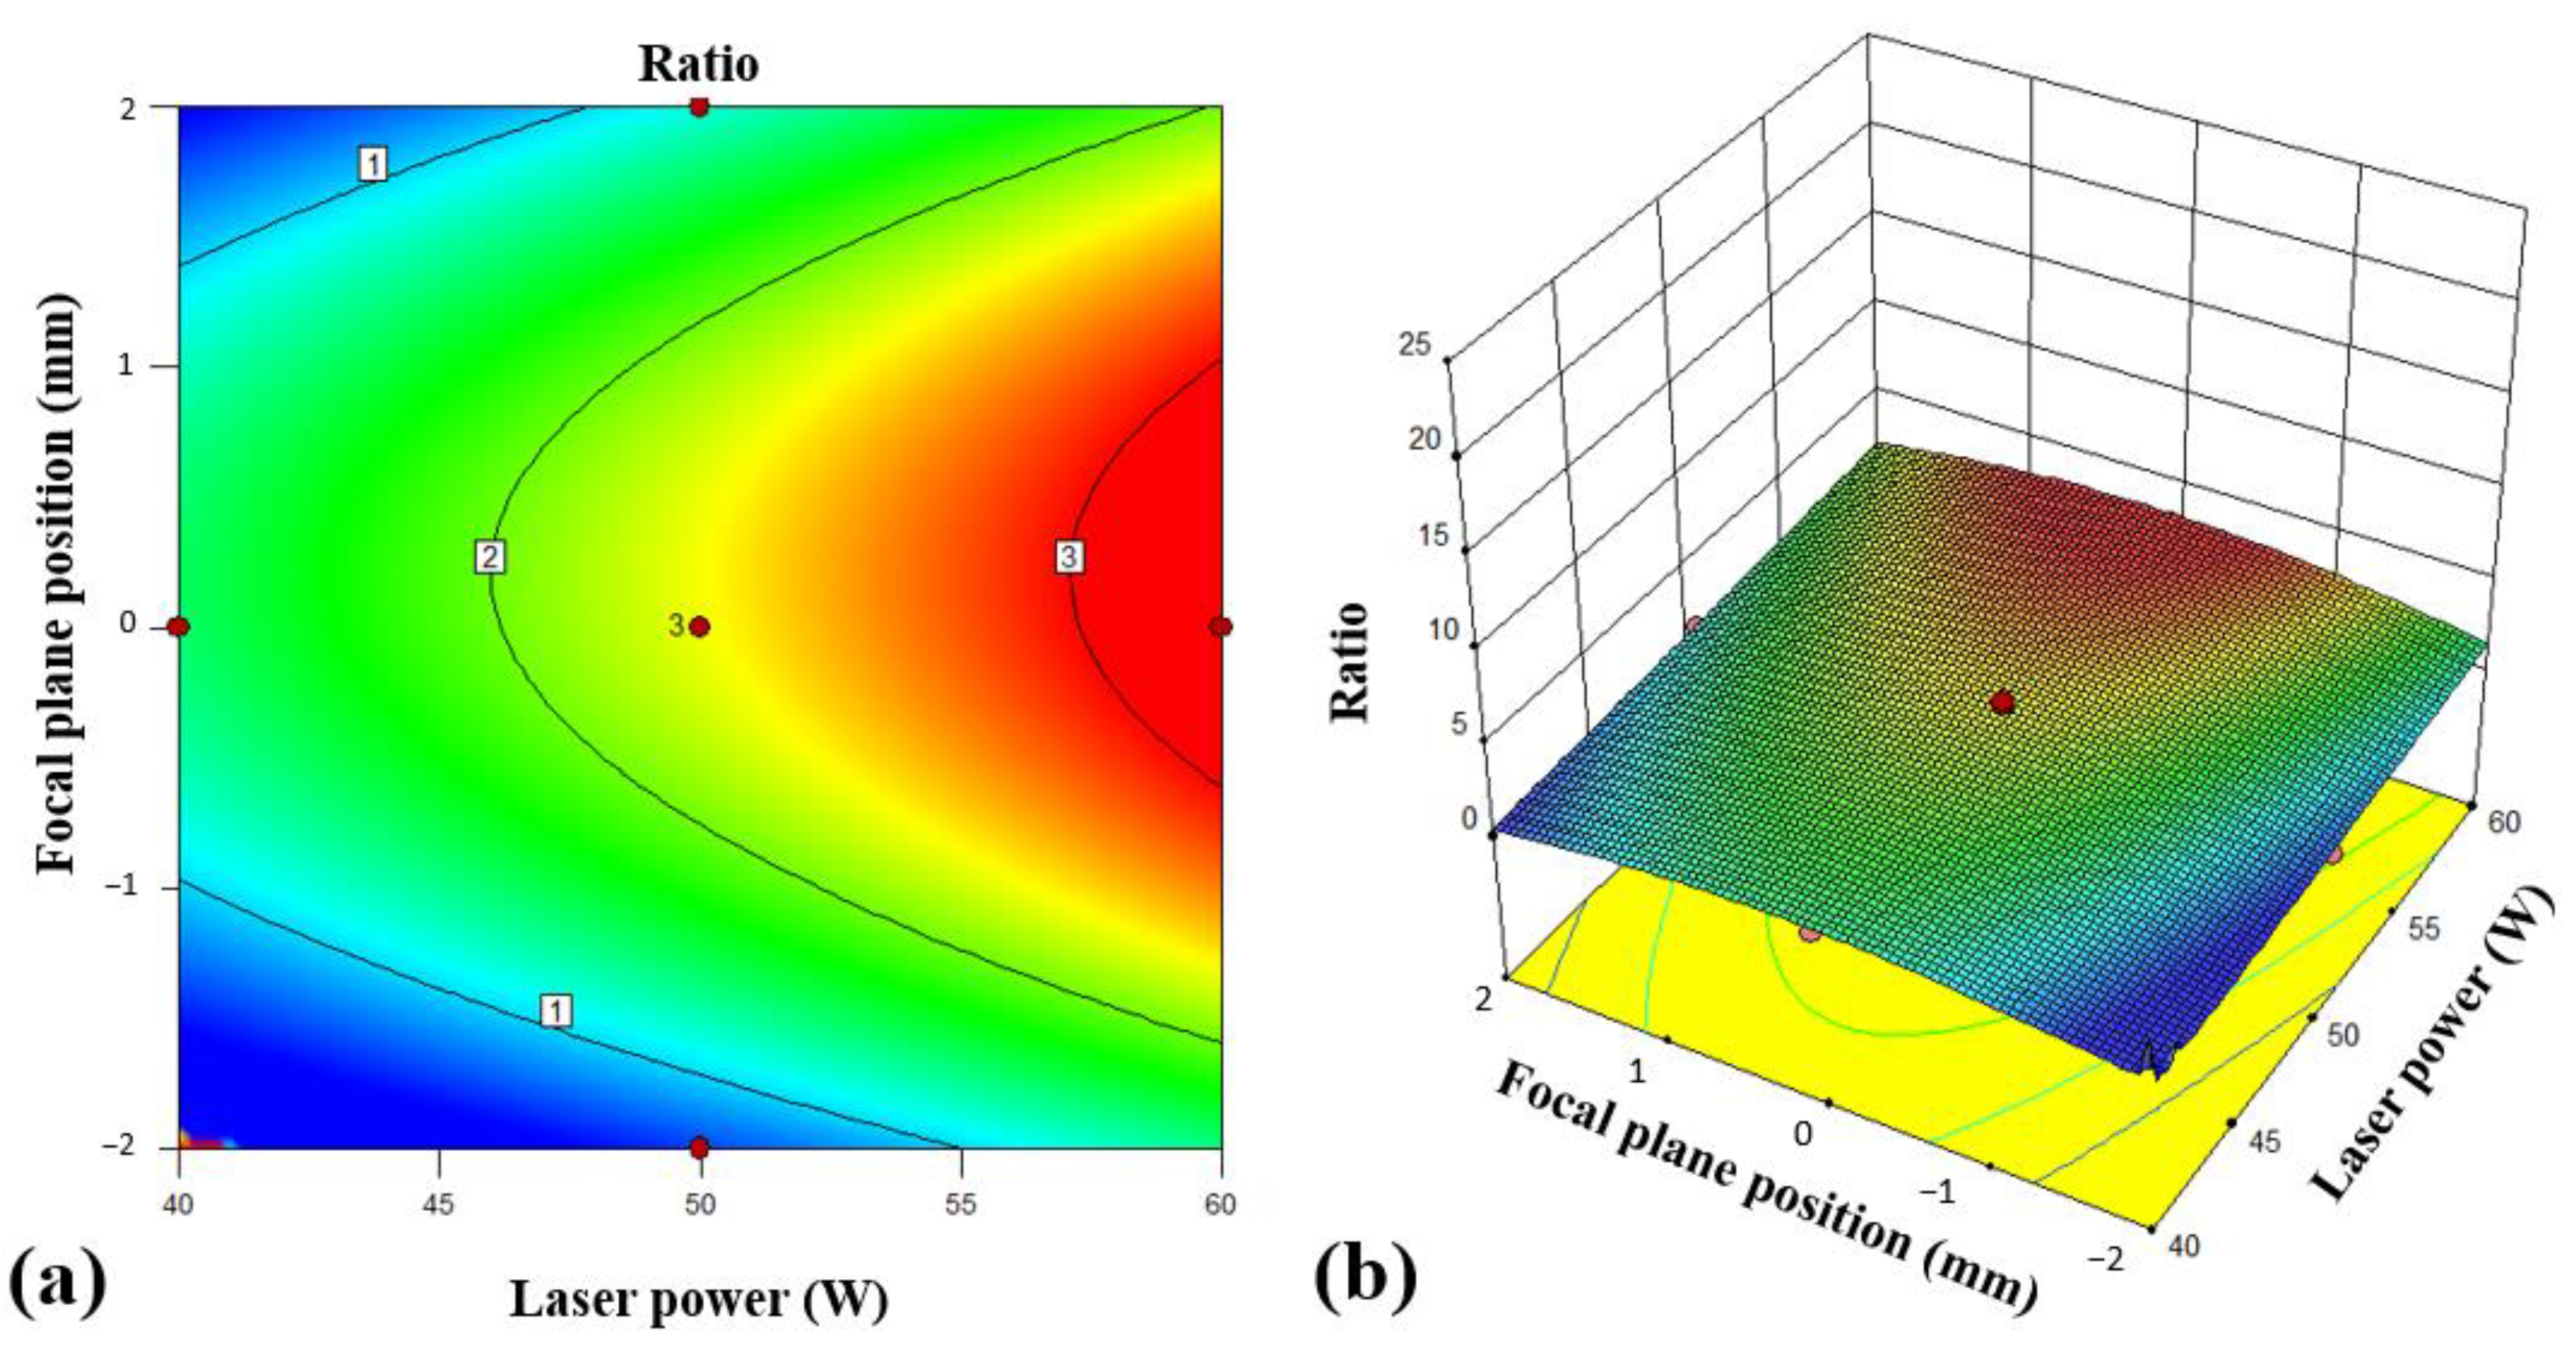
3.3. Ratio of the Upper Kerf to Lower Kerf

Table 6 presents the results of the variance analysis conducted on the ratio of the upper kerf to the lower kerf. The analysis indicated that the linear parameters of the laser power (LP) and the laser cutting speed (CS) were significant factors. Furthermore, the quadratic term of the cutting speed (CS2) and the focal plane position (FPP2) were also determined to have a significant effect. The final regression equation for the ratio of the upper kerf to the lower kerf, which considers the significant parameters and coded values, is given with Equation (4).
( R a t i o ) 0.87 = + 13.76 0.30 × L P 0.89 × C S + 0.12 × F P P + 0.03 × L P × C S 0.06 × C S 2 0.30 × F P P 2
Figure 9 displays the response surfaces for the ratio of the upper kerf to the lower kerf. As shown in Figure 9a, the focal plane position (FPP) has an effect on this response in the middle position at its maximum value. Moreover, both Figure 9a and 9b demonstrate that the minimum ratio is observed at the lowest laser power. It is worth noting that the linear effect of the laser power changes, which can be attributed to the interaction effect of the laser power and the focal plane position.

3.4. Cut Kerf Angle

Table 7 summarizes the results of the analysis of variance conducted on the cut kerf angle. The study revealed that both the linear effect of the laser power (LP) and the cutting speed (CS) had a significant impact on the response. Moreover, the interaction between the laser power and the cutting speed was also a significant term. Using the Design Expert software 12v, a regression equation (Equation (5)) was developed to establish the relationship between the cut kerf angle and the various process parameters.
C u t   k e r f   a n g l e = 13.72 + 0.27 × L P + 1.49 × C S 0.02 × L P × C S
Figure 10 illustrates the response surface plots for the cut kerf angle based on the process parameters. Consistent with the ANOVA in Table 6, Figure 10a demonstrates that the focal plane position (FPP) has a negligible impact on the cut kerf angle, while the cutting speed has a significant and direct proportional influence. By utilizing the regression equation (Equation (5)), the behavior of the cutting speed and laser power in Figure 10b can be explained. The maximum cut kerf angle occurs at the minimum laser power and at the maximum cutting speed. In this situation, the heat input decreases, as shown in Equation (5), and less laser energy interacts with the material. Conversely, when the laser power is high and the cutting speed low, the cut kerf angle decreases. The trend for the correlation between the laser power and the focal plane position is similar to Figure 10a: the focal plane position is insignificant, and the laser power in all conditions has a similar effect.
The correlation between the cut kerf angle and the heat input can be analyzed using a scatter plot and by calculating the correlation coefficient. The correlation coefficient between the cut kerf angle and the heat input is approximately −0.2, indicating a weak negative correlation. This suggests that, as the heat input increases, the cut kerf angle decreases slightly.
The surface morphologies before laser cutting significantly influence the kerf quality in the laser cutting processes. These morphologies impact factors like light absorption, heat distribution, and material removal, shaping the interaction between the laser beam and the material. Understanding the initial surface conditions is crucial, affecting the consistency of the laser–material interaction and the subsequent results. Variations in surface morphologies, such as roughness or impurities, may lead to heterogeneous energy absorption during laser cutting, causing non-uniformities in the kerf geometry. Surface irregularities can also affect heat dissipation and material ejection dynamics.

4. Optimization

The experimental data were analyzed statistically to develop regression equations that could explain the relationship between the input variables and the responses. The study utilized the response optimizer option, available within the DOE module of the statistical software package Design Expert v17, to optimize the input parameter combinations that yielded the most favorable tradeoff among the different responses. The optimization was carried out using the desirability function. The criteria for optimization, as outlined in Table 7, included achieving a minimum top kerf width, a minimum bottom kerf width, a minimum cut kerf angle, and a ratio of the top kerf width to the bottom kerf width equal to one.
The optimization process in Table 8 assigned weight and importance values to the responses, and the optimal input parameter combinations were determined using the desirability function. The experiments were conducted at the optimal settings to compare the actual responses with those obtained from the optimization. The results are shown in Table 9. The errors were low and indicated a good suitability for engineering applications.
The desirability plots of the input parameters are shown in Figure 11. The desirability plot for the laser power and the cutting speed showed that the optimal amount, with the highest desirability value, was 0.892. This indicated that the highest laser power values were preferred in the process to achieve the desired responses. Similarly, the desirability plot for the cutting speed and the focal plane position showed that the optimal range for the cutting speed was between 4 and 7 mm/s, with the highest desirability values located at the higher end of this range. This indicated that higher cutting speeds were preferred in the process to achieve the desired responses. On the other hand, the desirability plot for the focal plane position showed that the optimal range for the FPP was between −1 and 1 mm, with the highest desirability values located at the center of this range. This indicated that a neutral or central focal plane position was preferred in the process to achieve the desired responses.
To investigate the correlation between these input parameters, the overlay plots in Figure 12 were generated. The overlay plot for the laser power and the cutting speed showed a weak negative correlation, indicating that higher laser power values are associated with lower cutting speeds, and vice versa. However, the overlay plot for the FPP and the laser power showed a significant correlation, indicating that the FPP can be adjusted on the middle level.

5. Conclusions

In this study, laser cutting experiments were conducted on a 5 mm thick PMMA sheet using a CO2 laser. The input parameters considered were LP, CS, and FPP, while the output responses focused on the dimensions of the kerf geometry. The data obtained from the experiments were subjected to a DOE analysis, leading to the following conclusions:
  • A decrease in the FPP results in a notable reduction in the top kerf width, while an increase in the LP and a decrease in the CS contribute to a substantial widening of the kerf.
  • The bottom kerf width is significantly influenced by the quadratic term of the CS2 and the interaction effect between the CS and the FPP (CS × FPP).
  • CS, FPP, and the quadratic term of the laser LP2 are identified as significant factors affecting the ratio of the upper kerf to the lower kerf.
  • The cut kerf angle exhibits noteworthy linear effects of the LP and the FPP, accompanied by a significant quadratic effect of the LP2.
  • Optimal conditions for the LP, CS, and FPP fall within the ranges of 48–60 W, 4–7 mm/s, and −1 to 1 mm, respectively.

Author Contributions

All the authors contributed to this study’s conception and design. Material preparation, data collection, and analysis were performed by M.A.I., S.H., Z.T., O.R., M.A.M. and S.M. The first draft of the manuscript was written by M.R. and all the authors commented on previous versions of the manuscript. The editing and reviewing of the manuscript was carried out by M.M., A.M. and M.K. The conceptualization and administration of this project were performed under the supervision of M.M. and G.C. All authors have read and agreed to the published version of the manuscript.

Funding

M. Rezayat acknowledges the AGAUR Fellowship (FI-SDUR-2020) of the Generalitat de Catalunya for its financial support.

Acknowledgments

The authors respectfully acknowledge the technical support provided by the University of Northampton (UON), the Center for Structural Integrity, Micromechanics, and Reliability of Materials (CIEFMA), and the Materials Science department of the Polytechnic University of Catalunya (UPC).

Conflicts of Interest

The authors have no relevant financial or non-financial interests to disclose.

References

  1. Haddadi, E.; Moradi, M.; Karimzad Ghavidel, A.; Karimzad Ghavidel, A.; Meiabadi, S. Experimental and Parametric Evaluation of Cut Quality Characteristics in CO2 Laser Cutting of Polystyrene. Optik 2019, 184, 103–114. [Google Scholar] [CrossRef]
  2. Karimzad Ghavidel, A.; Zadshakoyan, M.; Kiani, G.; Lawrence, J.; Moradi, M. Innovative Approach Using Ultrasonic-Assisted Laser Beam Machining for the Fabrication of Ultrasensitive Carbon Nanotubes-Based Strain Gauges. Opt. Lasers Eng. 2023, 161, 107325. [Google Scholar] [CrossRef]
  3. Rezayat, M.; Roa, J.J.; Mateo, A. Phase Transformation and Residual Stresses after Laser Surface Modification of Metastable Austenitic Stainless Steel. In Proceedings of the AIP Conference Proceedings, Göttingen, Germany, 19 July 2023; p. 020005. [Google Scholar]
  4. Rezayat, M.; Karamimoghadam, M.; Moradi, M.; Casalino, G.; Roa Rovira, J.J.; Mateo, A. Overview of Surface Modification Strategies for Improving the Properties of Metastable Austenitic Stainless Steels. Metals 2023, 13, 1268. [Google Scholar] [CrossRef]
  5. Moradi, M.; Mehrabi, O.; Azdast, T.; Benyounis, K.Y. Enhancement of Low Power CO2 Laser Cutting Process for Injection Molded Polycarbonate. Opt. Laser Technol. 2017, 96, 208–218. [Google Scholar] [CrossRef]
  6. Eltawahni, H.A.; Olabi, A.G.; Basmage, O.M.; Benyounis, K.Y. CO2 Laser Cutting of Glass Fiber-Reinforced Plastics. In Encyclopedia of Renewable and Sustainable Materials; Elsevier: Amsterdam, The Netherlands, 2020; pp. 145–159. [Google Scholar]
  7. Nayak, R.; Padhye, R. The Use of Laser in Garment Manufacturing: An Overview. Fash. Text. 2016, 3, 5. [Google Scholar] [CrossRef]
  8. He, Y.; Xie, H.; Ge, Y.; Lin, Y.; Yao, Z.; Wang, B.; Jin, M.; Liu, J.; Chen, X.; Sun, Y. Laser Cutting Technologies and Corresponding Pollution Control Strategy. Processes 2022, 10, 732. [Google Scholar] [CrossRef]
  9. Choi, J.; Kim, R.; Song, D.; Cho, D.-W.; Suh, J.; Kim, S.; Ahn, S.-H. Analysis of Laser Cutting Process for Different Diagonal Material Shapes. Processes 2022, 10, 2743. [Google Scholar] [CrossRef]
  10. Zafar, M.S. Prosthodontic Applications of Polymethyl Methacrylate (PMMA): An Update. Polymers 2020, 12, 2299. [Google Scholar] [CrossRef]
  11. Khoshaim, A.B.; Elsheikh, A.H.; Moustafa, E.B.; Basha, M.; Showaib, E.A. Experimental Investigation on Laser Cutting of PMMA Sheets: Effects of Process Factors on Kerf Characteristics. J. Mater. Res. Technol. 2021, 11, 235–246. [Google Scholar] [CrossRef]
  12. Mushtaq, R.T.; Wang, Y.; Rehman, M.; Khan, A.M.; Mia, M. State-Of-The-Art and Trends in CO2 Laser Cutting of Polymeric Materials—A Review. Materials 2020, 13, 3839. [Google Scholar] [CrossRef]
  13. Kechagias, J.D.; Ninikas, K.; Stavropoulos, P.; Salonitis, K. A Generalised Approach on Kerf Geometry Prediction during CO2 Laser Cut of PMMA Thin Plates Using Neural Networks. Lasers Manuf. Mater. Process. 2021, 8, 372–393. [Google Scholar] [CrossRef]
  14. Khan, M.M.A.; Saha, S.; Romoli, L.; Kibria, M.H. Optimization of Laser Engraving of Acrylic Plastics from the Perspective of Energy Consumption, CO2 Emission and Removal Rate. J. Manuf. Mater. Process. 2021, 5, 78. [Google Scholar] [CrossRef]
  15. Hussein, N.I.S.; Segal, J.; McCartney, D.G.; Pashby, I.R. Microstructure Formation in Waspaloy Multilayer Builds Following Direct Metal Deposition with Laser and Wire. Mater. Sci. Eng. A 2008, 497, 260–269. [Google Scholar] [CrossRef]
  16. Armstrong, M.; Mehrabi, H.; Naveed, N. An Overview of Modern Metal Additive Manufacturing Technology. J. Manuf. Process 2022, 84, 1001–1029. [Google Scholar] [CrossRef]
  17. Rezayat, M.; Aboutorabi Sani, A.; Talafi Noghani, M.; Saghafi Yazdi, M. Effect of Lateral Laser-Cladding Process on the Corrosion Performance of Inconel 625. Metals 2023, 13, 367. [Google Scholar] [CrossRef]
  18. Krajcarz, D. Comparison Metal Water Jet Cutting with Laser and Plasma Cutting. Procedia Eng. 2014, 69, 838–843. [Google Scholar] [CrossRef]
  19. Bhattacharyya, B.; Doloi, B. Machining Processes Utilizing Thermal Energy. In Modern Machining Technology; Elsevier: Amsterdam, The Netherlands, 2020; pp. 161–363. [Google Scholar]
  20. Leone, C.; Mingione, E.; Genna, S. Laser Cutting of CFRP by Quasi-Continuous Wave (QCW) Fibre Laser: Effect of Process Parameters and Analysis of the HAZ Index. Compos. B Eng. 2021, 224, 109146. [Google Scholar] [CrossRef]
  21. Gupta, P.D. Laser Applications in Indian Nuclear Power Programme. Energy Procedia 2011, 7, 560–576. [Google Scholar] [CrossRef]
  22. Joshi, P.; Sharma, A. Simultaneous Optimization of Kerf Taper and Heat Affected Zone in Nd-YAG Laser Cutting of Al 6061-T6 Sheet Using Hybrid Approach of Grey Relational Analysis and Fuzzy Logic. Precis. Eng. 2018, 54, 302–313. [Google Scholar] [CrossRef]
  23. Nguyen, V.; Altarazi, F.; Tran, T. Optimization of Process Parameters for Laser Cutting Process of Stainless Steel 304: A Comparative Analysis and Estimation with Taguchi Method and Response Surface Methodology. Math. Probl. Eng. 2022, 2022, 6677586. [Google Scholar] [CrossRef]
  24. Moradi, M.; Rezayat, M.; Rozhbiany, F.A.R.; Meiabadi, S.; Casalino, G.; Shamsborhan, M.; Bijoy, A.; Chakkingal, S.; Lawrence, M.; Mohammed, N.; et al. Correlation between Infill Percentages, Layer Width, and Mechanical Properties in Fused Deposition Modelling of Poly-Lactic Acid 3D Printing. Machines 2023, 11, 950. [Google Scholar] [CrossRef]
  25. Moradi, M.; Karamimoghadam, M.; Meiabadi, S.; Casalino, G.; Ghaleeh, M.; Baby, B.; Ganapathi, H.; Jose, J.; Abdulla, M.S.; Tallon, P.; et al. Mathematical Modelling of Fused Deposition Modeling (FDM) 3D Printing of Poly Vinyl Alcohol Parts through Statistical Design of Experiments Approach. Mathematics 2023, 11, 3022. [Google Scholar] [CrossRef]
  26. Kubovský, I.; Krišťák, Ľ.; Suja, J.; Gajtanska, M.; Igaz, R.; Ružiak, I.; Réh, R. Optimization of Parameters for the Cutting of Wood-Based Materials by a CO2 Laser. Appl. Sci. 2020, 10, 8113. [Google Scholar] [CrossRef]
  27. Ashok, D.; Bahubalendruni, M.V.A.R.; Mhaskar, A.; Choudhary, V.; Balamurali, G.; Turaka, S. Experimental and Numerical Investigation on 2.5-Dimensional Nature-Inspired Infill Structures under out-Plane Quasi-Static Loading. Proc. Inst. Mech. Eng. Part E J. Process Mech. Eng. 2023, 11, 5308. [Google Scholar] [CrossRef]
  28. Moradi, M.; Karamimoghadam, M.; Meiabadi, S.; Rasool, S.; Casalino, G.; Shamsborhan, M.; Sebastian, P.K.; Poulose, A.; Shaiju, A.; Rezayat, M. Optimizing Layer Thickness and Width for Fused Filament Fabrication of Polyvinyl Alcohol in Three-Dimensional Printing and Support Structures. Machines 2023, 11, 844. [Google Scholar] [CrossRef]
  29. Equbal, A.; Equbal, M.I.; Sood, A.K. An Investigation on the Feasibility of Fused Deposition Modelling Process in EDM Electrode Manufacturing. CIRP J. Manuf. Sci. Technol. 2019, 26, 10–25. [Google Scholar] [CrossRef]
  30. Equbal, A.; Equbal, A.; Khan, Z.A.; Badruddin, I.A.; Bashir, M.B.A.; Alrobei, H. Investigating the Dimensional Accuracy of the Cavity Produced by ABS P400 Polymer-Based Novel EDM Electrode. Polymers 2021, 13, 4109. [Google Scholar] [CrossRef]
  31. Equbal, A.; Sood, A.K.; Equbal, M.I.; Badruddin, I.A.; Khan, Z.A. RSM Based Investigation of Compressive Properties of FDM Fabricated Part. CIRP J. Manuf. Sci. Technol. 2021, 35, 701–714. [Google Scholar] [CrossRef]
  32. Equbal, A.; Ahmad, S.; Badruddin, I.A.; Khan, Z.A.; Kamangar, S.; Javed, S. Evaluating Machining Performance of Acrylonitrile-Butadiene-Styrene (ABS) Based Electrical Discharge Machining (EDM) Electrodes Fabricated by Fused Deposition Modelling (FDM) Followed by a Novel Metallization Method. Proc. Inst. Mech. Eng. B J. Eng. Manuf. 2023, 7, 095440542211510. [Google Scholar] [CrossRef]
  33. Equbal, A.; Equbal, M.I.; Sood, A.K. PCA-Based Desirability Method for Dimensional Improvement of Part Extruded by Fused Deposition Modelling Technology. Prog. Addit. Manuf. 2019, 4, 269–280. [Google Scholar] [CrossRef]
  34. Vijay Kumar, V.; Narayanan, D.; Chandran, S.; Rajendran, S.; Ramakrishna, S. Lightweight and Sustainable Self-Reinforced Composites. In Lightweight and Sustainable Composite Materials; Elsevier: Amsterdam, The Netherlands, 2023; pp. 19–46. [Google Scholar]
  35. Moradi, M.; Karami Moghadam, M.; Shamsborhan, M.; Bodaghi, M.; Falavandi, H. Post-Processing of FDM 3D-Printed Polylactic Acid Parts by Laser Beam Cutting. Polymers 2020, 12, 550. [Google Scholar] [CrossRef] [PubMed]
  36. Rezayat, M.; Mateo, A.; Roa, J.J. Exploring the Effects of Laser Surface Modification on AISI 301LN Steel: A Micro-Mechanical Study. J. Manuf. Mater. Process. 2023, 7, 191. [Google Scholar] [CrossRef]
Figure 1. Schematic of the laser cutting process with all the parameters of this study.
Applsci 13 12601 g001
Figure 2. The focal point of the laser beam can be determined with the following steps: (a) analyzing its position before passing through the laser and (b) observing the impact of the laser beam on the acrylic sheet, which reveals the precise location of the focal point [35].
Applsci 13 12601 g002
Figure 3. Variation of the focal plane position on the work piece.
Applsci 13 12601 g003
Figure 4. (a) Actual photograph of the top kerf width for all the samples and the top kerf images with a further magnification of (b) #2, (c) #5, (d) #7, and (e) #9.
Applsci 13 12601 g004
Figure 5. The perturbation plot demonstrates the interaction among the input variables and the average top width as one of the output variables.
Applsci 13 12601 g005
Figure 6. Response surfaces of the top kerf width in terms of laser power and focal plane position (Red dots in the figures correspond to the top kerf width at that point, red color: more top kerf width and blue color: less top kerf width).
Applsci 13 12601 g006
Figure 7. The residual plot for the top kerf width (colorful squares in the figure are correspond to points of residuals normal percentage of top kerf width).
Applsci 13 12601 g007
Figure 8. Response surfaces of the bottom kerf width in terms of (a) the focal plane position and cutting speed, and the (b) laser cutting speed and laser power (Red dots in the figures correspond to bottom kerf width in that point, red color: more bottom kerf width and blue color: less bottom kerf width).
Applsci 13 12601 g008
Figure 9. (a) Contour plot for the focal plane position and the laser power, and (b) surface plot for the focal plane position and the laser power (numbers in the figure correspond to the ratio in that point, red color: more ratio and blue color: less ratio).
Applsci 13 12601 g009
Figure 10. Response surfaces of the cut kerf angle in terms of (a) FPP and CS, and (b) LP and CS.
Applsci 13 12601 g010
Figure 11. Desirability plots for all the input variables (numbers in the figure correspond to the desirability in different laser power, cutting speed and focal plane position. Red color: more desirability and blue color: less desirability).
Applsci 13 12601 g011
Figure 12. Overlay plots for the comparison of the correlation among all the input parameters.
Applsci 13 12601 g012
Table 1. PMMA thermal and physical properties. Extracted with permission from [34], Elsevier, 2023.
PropertyValue
Molecular Formula(C5O2H8)n
Molecular Weight (g/mol)~100,000–500,000
Melting Point (°C)105–160
Glass Transition Temperature (Tg) (°C)105–165
Density (g/cm3)1.17–1.20
Refractive Index (at 589 nm)1.49–1.50
Thermal Conductivity (W/(m·K))0.17–0.19
Specific Heat Capacity (J/(g·K))1.4–1.9
Coefficient of Thermal Expansion (°C)70–90 × 10−6
Tensile Strength (MPa)50–100
Young’s Modulus (GPa)2.7–3.3
Elongation at Break (%)2–6
TransparencyExcellent
Table 2. Independent process parameters with design levels.
VariableNotationUnit−2−1012
Laser powerLPW4045505560
Cutting speedCSmm/s47101316
Focal plane positionFPPmm−2−10+1+2
Table 3. Experimental layout and multi-performance results.
Experiment No.Input Variables (Coded Values)Output Responses
Laser Power (W)Cutting Speed (mm/s)Focal Plane Position (mm)Top Kerf Width
(mm)
Bottom Kerf Width
(mm)
RatioCut Kerf Angle
(Degree)
Heat Input (J/mm2)
#14513−110.916 ± 0.910-1.924 ± 0.233.461
#2601008.400 ± 0.613.056 ± 0.222.7480.591 ± 0.126.000
#35010010.946 ± 0.884.323 ± 0.322.5310.779 ± 0.185.000
#45010010.270 ± 0.985.710 ± 0.351.7980.490 ± 0.115.000
#55010−24.436 ± 0.359.653 ± 0.540.4590.574 ± 0.175.000
#6501026.696 ± 0.616.440 ± 0.781.0390.025 ± 0.035.000
#7557110.243 ± 0.750-1.644 ± 0.297.857
#8557−17.600 ± 0.473.086 ± 0.332.4620.484 ± 0.127.857
#945718.103 ± 0.582.696 ± 0.293.0040.600 ± 0.226.428
#10457−19.556 ± 0.793.926 ± 0.212.4330.631 ± 0.256.428
#115513−17.393 ± 0.540-0.911 ± 0.114.230
#125010013.453 ± 0.1.134.890 ± 0.422.7511.152 ± 0.325.000
#13501609.953 ± 0.940-1.541 ± 0.133.125
#145513110.023 ± 0.865.590 ± 0.561.7930.474 ± 0.284.230
#15401006.510 ± 0.665.066 ± 0.441.2840.145 ± 0.224.000
#1650404.720 ± 0.533.506 ± 0.631.3460.121 ± 0.1512.500
#174513110.910 ± 0.870-1.921 ± 0.163.461
Table 4. Revised analysis of variance of the top kerf width.
Source of VariationDegree of FreedomSum of SquaresMean SquaresF Valuep Value
Model200.63633.443.620.0357
A-LP0.07110.0717.667 × 10−30.9320
B-CS39.06139.064.230.0669
C-FPP12.78112.781.380.2668
AB60.73160.736.570.0282
BC61.93161.936.700.0270
C2127.751127.7513.820.0040
Residual92.43109.24
Lack of Fit72.0089.000.880.6318
Pure Error20.43210.22
Total293.0616
R-Sq = % 68.46 R-Sq (adj) = % 49.54
Table 5. Revised analysis of variance of the bottom kerf width.
Source of VariationDegree of FreedomSum of SquaresMean SquaresF Valuep Value
Model4.8941.222.980.0637
A-LP4.093 × 10−314.093 × 10−39.966 × 10−30.9221
B-CS1.9711.974.790.0491
AB1.3011.303.160.1007
B21.6211.623.950.0701
Residual4.93120.41
Lack of Fit4.92100.4988.350.0112
Pure Error0.01125.565 × 10−3
Total9.8216
R-Sq = % 49.82 R-Sq (adj) = % 33.10
Table 6. Revised analysis of the variance of the ratio of the top kerf to the bottom kerf.
Source of VariationDegree of FreedomSum of SquaresMean SquaresF Valuep Value
Model3.8760.653.750.0840
A-LP1.0411.046.030.0575
B-CS1.3811.388.040.0365
C-FPP0.1610.160.930.3787
AB0.7910.794.590.0851
B21.5111.518.760.0315
C22.0612.0612.000.0180
Residual0.8650.17
Lack of Fit0.5530.181.210.4831
Pure Error0.3120.15
Total4.7311
R-Sq = % 81.84 R-Sq (adj) = % 60.04
Table 7. Revised analysis of variance of the cut kerf angle.
Source of VariationDegree of FreedomSum of SquaresMean SquaresF Valuep Value
Model2.8230.944.030.0314
A-LP0.02810.0280.120.7347
B-CS1.3911.395.940.0300
AB1.4111.416.030.0290
Residual3.04130.23
Lack of Fit2.82110.262.320.3393
Pure Error0.2220.11
Total5.8616
R-Sq = % 48.17 R-Sq (adj) = % 36.21
Table 8. Constraints and criteria of the input parameters and responses.
Constraints
Parameters/
Responses
NameGoalLower
Limit
Upper
Limit
Lower
Weight
Upper
Weight
Importance
ParametersA: LPis in range4060113
B: CSis in range416113
C: FPPis in range−22113
ResponsesTop Average Widthminimize4.43613.453113
Bottom Average Widthminimize09.653113
Ratiois target = 10.4593.004113
Cut Kerf Angleminimize0.0251.924113
Table 9. Output responses’ solutions for finding the optimum laser cutting parameters ordered by desirability.
#LP
(W)
CS
(mm/s)
FPP
(mm)
DesirabilityTop Kerf Width (mm)Bottom Kerf Width (mm)RatioCut Kerf Angle (Degree)
150.6614.000−1.0160.8964.0122.2011.0000.341
251.0254.017−0.9500.8944.2691.9661.0000.400
349.9664.000−1.1550.8923.4302.7510.9980.230
Disclaimer/Publisher’s Note: The statements, opinions and data contained in all publications are solely those of the individual author(s) and contributor(s) and not of MDPI and/or the editor(s). MDPI and/or the editor(s) disclaim responsibility for any injury to people or property resulting from any ideas, methods, instructions or products referred to in the content.

