1. Introduction
A typhoon will cause water to increase or decrease. When a storm surge water increase superimposes an astronomical spring tide, an abnormal rise in seawater level caused by low-pressure systems, such as tropical cyclones, will cause seawater overflow, breakup of seawall, siltation of harbor basin, and obstruction of shipping, resulting in significant economic and human losses, as seen in the cases of Typhoon Katrina and Rita (2005), as well as Hurricanes Ike and Gustav (2008). Moreover, typhoons will also have a certain impact on the flow field of marine water bodies, resulting in the diffusion of marine pollutants.
Close to the Northwest Pacific Ocean, China’s coastline is frequently affected by storm surges and typhoon disasters. According to data from 1949 to 2018, 42 typhoons landed in Zhejiang Province, China. The super typhoon 0608 reached its maximum wind speed of 68 m/s [
1]. At the landing time, the minimum air pressure in the center was 920 HPA, resulting in a direct economic loss of nearly 12.7 billion yuan. Zhoushan City is located in the south of the Yangtze River Estuary and the southeast of Hangzhou Bay. It is a coastal city composed of islands. With the pace of global warming, the frequency and intensity of typhoons have been increasing. Therefore, research into storm surges is of great significance for coastal engineering disaster prevention and reduction. Sun et al. conducted a comprehensive flood risk assessment for wastewater treatment plants in New York City under extreme storm events. They found that the impact of storm surges, high-intensity rainfall, and sea level rise on wastewater treatment plants can be analyzed by considering the percentage of the submerged length of the buildings to the total perimeter of the buildings and the amount of damage [
2].
From the 1920s, the causes and manifestations of storm surges were preliminarily analyzed in the world, mainly by means of theoretical research, empirical statistics, and so on. With the continuous development of storm surge theory and prediction, research has entered a period at which the nonlinear coupling theory of edge wave, shelf wave, astronomical tide, and storm surge is proposed. The size of a storm surge depends on many factors, including the size, path, speed, and intensity of the storm system, local nearshore water depth, and the shape of the coastline. Nowadays, with the rapid development of detection and computer technology, research into the mechanism of a storm surge has entered a new era of the combination of numerical simulation and experiment, which makes the results more accurate. With global climate change, more and more evidence has accumulated that storm surge disasters will become more frequent and severe in the future.
Nowadays, the Slosh model, Delft3D model, ECOMSED model, and ROMs model based on a structured grid, and the ADCIRC model and FVCOM model based on an unstructured grid are widely used storm surge numerical models [
3]. The ADCIRC model, coupled with the nearshore wave model SWAN, was used to simulate hurricane-driven coastal circulation and land flooding. Dietrich et al. [
4] applied the ADCIRC + SWAN model to simulate hydrodynamic conditions, and the results indicated that the model accurately predicted wave and surge characteristics. Bilskie et al. [
5] used a real-time unstructured grid (NGO-RT) and the ADCIRC + SWAN model to simulate coastal inundation under the action of multiple hurricanes in the Gulf of Mexico, which improved its operation efficiency. The average absolute difference in the simulated water level ranged from 0.04 to 0.02 m, achieving high accuracy. Gayathri et al. [
6] used ADCIRC to simulate the Aila cyclone in the Bay of Bengal. The simulated water level was in good agreement with the overall statistical data of the four tide stations [
7].
ERA 5 is a kind of comprehensive reanalysis of data. Job C. M. Dullaart used the new ERA5 to analyze a storm surge simulation. The comparison showed that the root mean square error of tropical cyclone velocity from ERA5 was 58% lower than that of ERA-Interim and could better simulate the storm surge height of historical events by improving model resolution. [
8] Based on partial correlation, B. Zhang selected climate factors sensitive to extreme storm surge levels, extracted spatial gradient, precipitation, and other factors from ERA5 reanalysis data, and proposed a reliable, data-driven framework vine-copula simulation set to evaluate extreme events. Vousdoukas et al. (2016) [
9] used the hydrodynamic model Delft3D, which considers surface wind and the atmospheric pressure field, to evaluate the dynamic baseline (SSL) of storm surge levels along the European coastline from 1970 to 2000 affected by meteorological changes [
10]. The study of typhoon surges mainly pays more attention to the change in sea level under the action of a typhoon [
11,
12,
13]. From the perspective of calculation efficiency, the vertical average two-dimensional ocean model is of high accuracy in simulating water level changes. Mamnun et al. (2020) [
14] used the three-dimensional coupled surge model Polcoms to simulate the storm surge in the Bay of Bengal. Compared with the two-dimensional ocean model, the calculation efficiency of the three-dimensional model was significantly reduced, and the simulation results were less ideal. Song [
15] used the tide surge wave coupled Delft3D model to study the impact of port construction on the interaction of tide, storm surge, and wave in similar storms from 2003 to 2016. The wind data of the atmospheric reanalysis data of the global models ECMWF-Interim, CCMP, and ECMWF-ERA5 were linearly regressed and assimilated. It was shown that ECMWF-ERA5 with the highest time resolution performed best in observing the surface wind field. The Delft3D model can be used to simulate multidimensional unsteady flow. Based on a storm surge simulation of Delft3D flow, Camille [
16] simulated different typhoon paths and proposed a flood inundation map during the Haiyan typhoon. Dullaart [
8] found that recent advances in global climate modeling have significant implications for simulating storm surges. By comparing modeled and observed storm surges for eight historical events, they demonstrated that the new ERA5 climate reanalysis produces more accurate results than previous models. This has important implications for predicting and preparing for future storm events, as more accurate storm surge modeling can help to mitigate the impacts of extreme weather events. Jie Xiong [
17] discovered discrepancies between the ERA5 wind field and observed storm surge data in typhoon simulations. They proposed a hybrid wind field that combines ERA5 and observed wind data to improve the accuracy of storm surge predictions. The numerical simulation experiments showed that the hybrid wind field significantly reduced errors in storm surge predictions. This finding suggests that using a hybrid wind field could improve future typhoon storm surge predictions and preparations. Samiksha [
18] investigated the performance of ERA5 winds on computed storm surges and wave–current interactions during the Ockhi cyclone. They found that the ERA5-forced model produced more accurate results in generating waves during the cyclone compared with the standalone model. However, the study also identified the need for further improvements in the modeling of wave–current interactions and the representation of bottom friction.
This study aimed to evaluate the predictive power of the ERA5 reanalysis and Fujita–Takahashi models, analyzing their strengths and weaknesses. Additionally, the study examined Typhoon In-fa’s (2021) influence on the East China Sea, determining its effects on eastern coastal storm surges. The research offers valuable insights into protective strategies and resilience planning. Methodologically, meteorological data, including pre/post landfall wind fields and storm surge observations, were collected. The model evaluation compares both models’ predictive accuracy, considering statistical metrics. The analysis sheds light on storm surge dynamics, aiding coastal protection planning. By analyzing historical storm data, the study’s insights into the intensity of typhoons and tropical cyclones enable better anticipation of potential future weather-related challenges. This knowledge can guide disaster response strategies, aid in the assessment of vulnerabilities, and inform land-use planning in coastal regions.
2. Materials and Methods
2.1. Hydrodynamic Model
Based on the Delft-3D hydrodynamic model, the mathematical model of storm surge was established by comparing the Fujita–Takahashi model and the wind field model obtained by ERA5 reanalysis.
The Delft3D hydrodynamic simulation software developed by Deltares Research Institute in the Netherlands was adopted as the mathematical model. Delft3D model can be used to calculate and analyze two- and three-dimensional tidal current, flood, wave, sediment, salinity, temperature, oil spill, and pollutant concentration, and is suitable for rivers, lakes, and oceans. Delft3D adopts incompressible fluid N–S equation based on Boussinesq assumption and static pressure assumption.
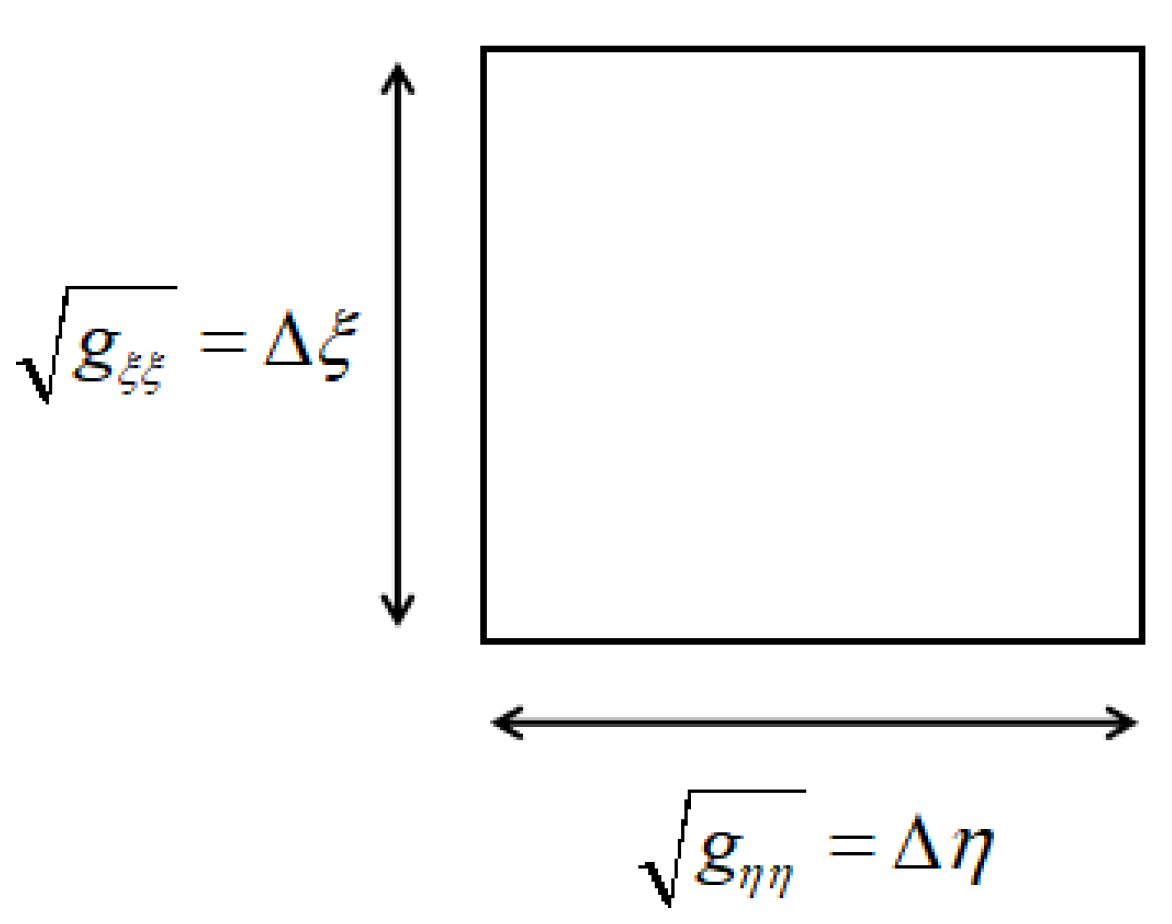
The orthogonal curvilinear coordinate system was adopted in the horizontal direction (
ξ,
η), and σ coordinates were introduced in the vertical introduction. The numerical grid transformation was inherently understood through the conversion of grid vertex coordinates from the physical domain to the computational domain, as depicted in
Figure 1. This discretization process facilitated the incorporation of the transformed equations into the computational framework, enabling the effective modeling and analysis of the system under consideration (Stelling and Van Kester, 1994) [
19].
The
σ coordinate system is defined as:
where
z is the vertical coordinate of physical space;
δ is the water level above the base level (
z = 0);
D is the water depth;
H is the total water depth.
The average continuity equation along water depth is:
For the two-dimensional model of averaging water depth, the momentum equations in the
ξ and
η directions are:
The vertical velocity
w in the
σ coordinate system can be obtained from the continuity equation:
where
and
are the coordinate conversion coefficients;
and
are the average velocities for
,
, and
directions;
and
are the average velocities along water depth;
is the vertical eddy viscosity coefficient;
and
are pressure gradients for
and
directions;
is the Coriolis force coefficient;
and
are Reynolds stress terms for
and
directions;
and
are the source of momentum for
and
directions. For storm surge simulation, the typhoon field was introduced.
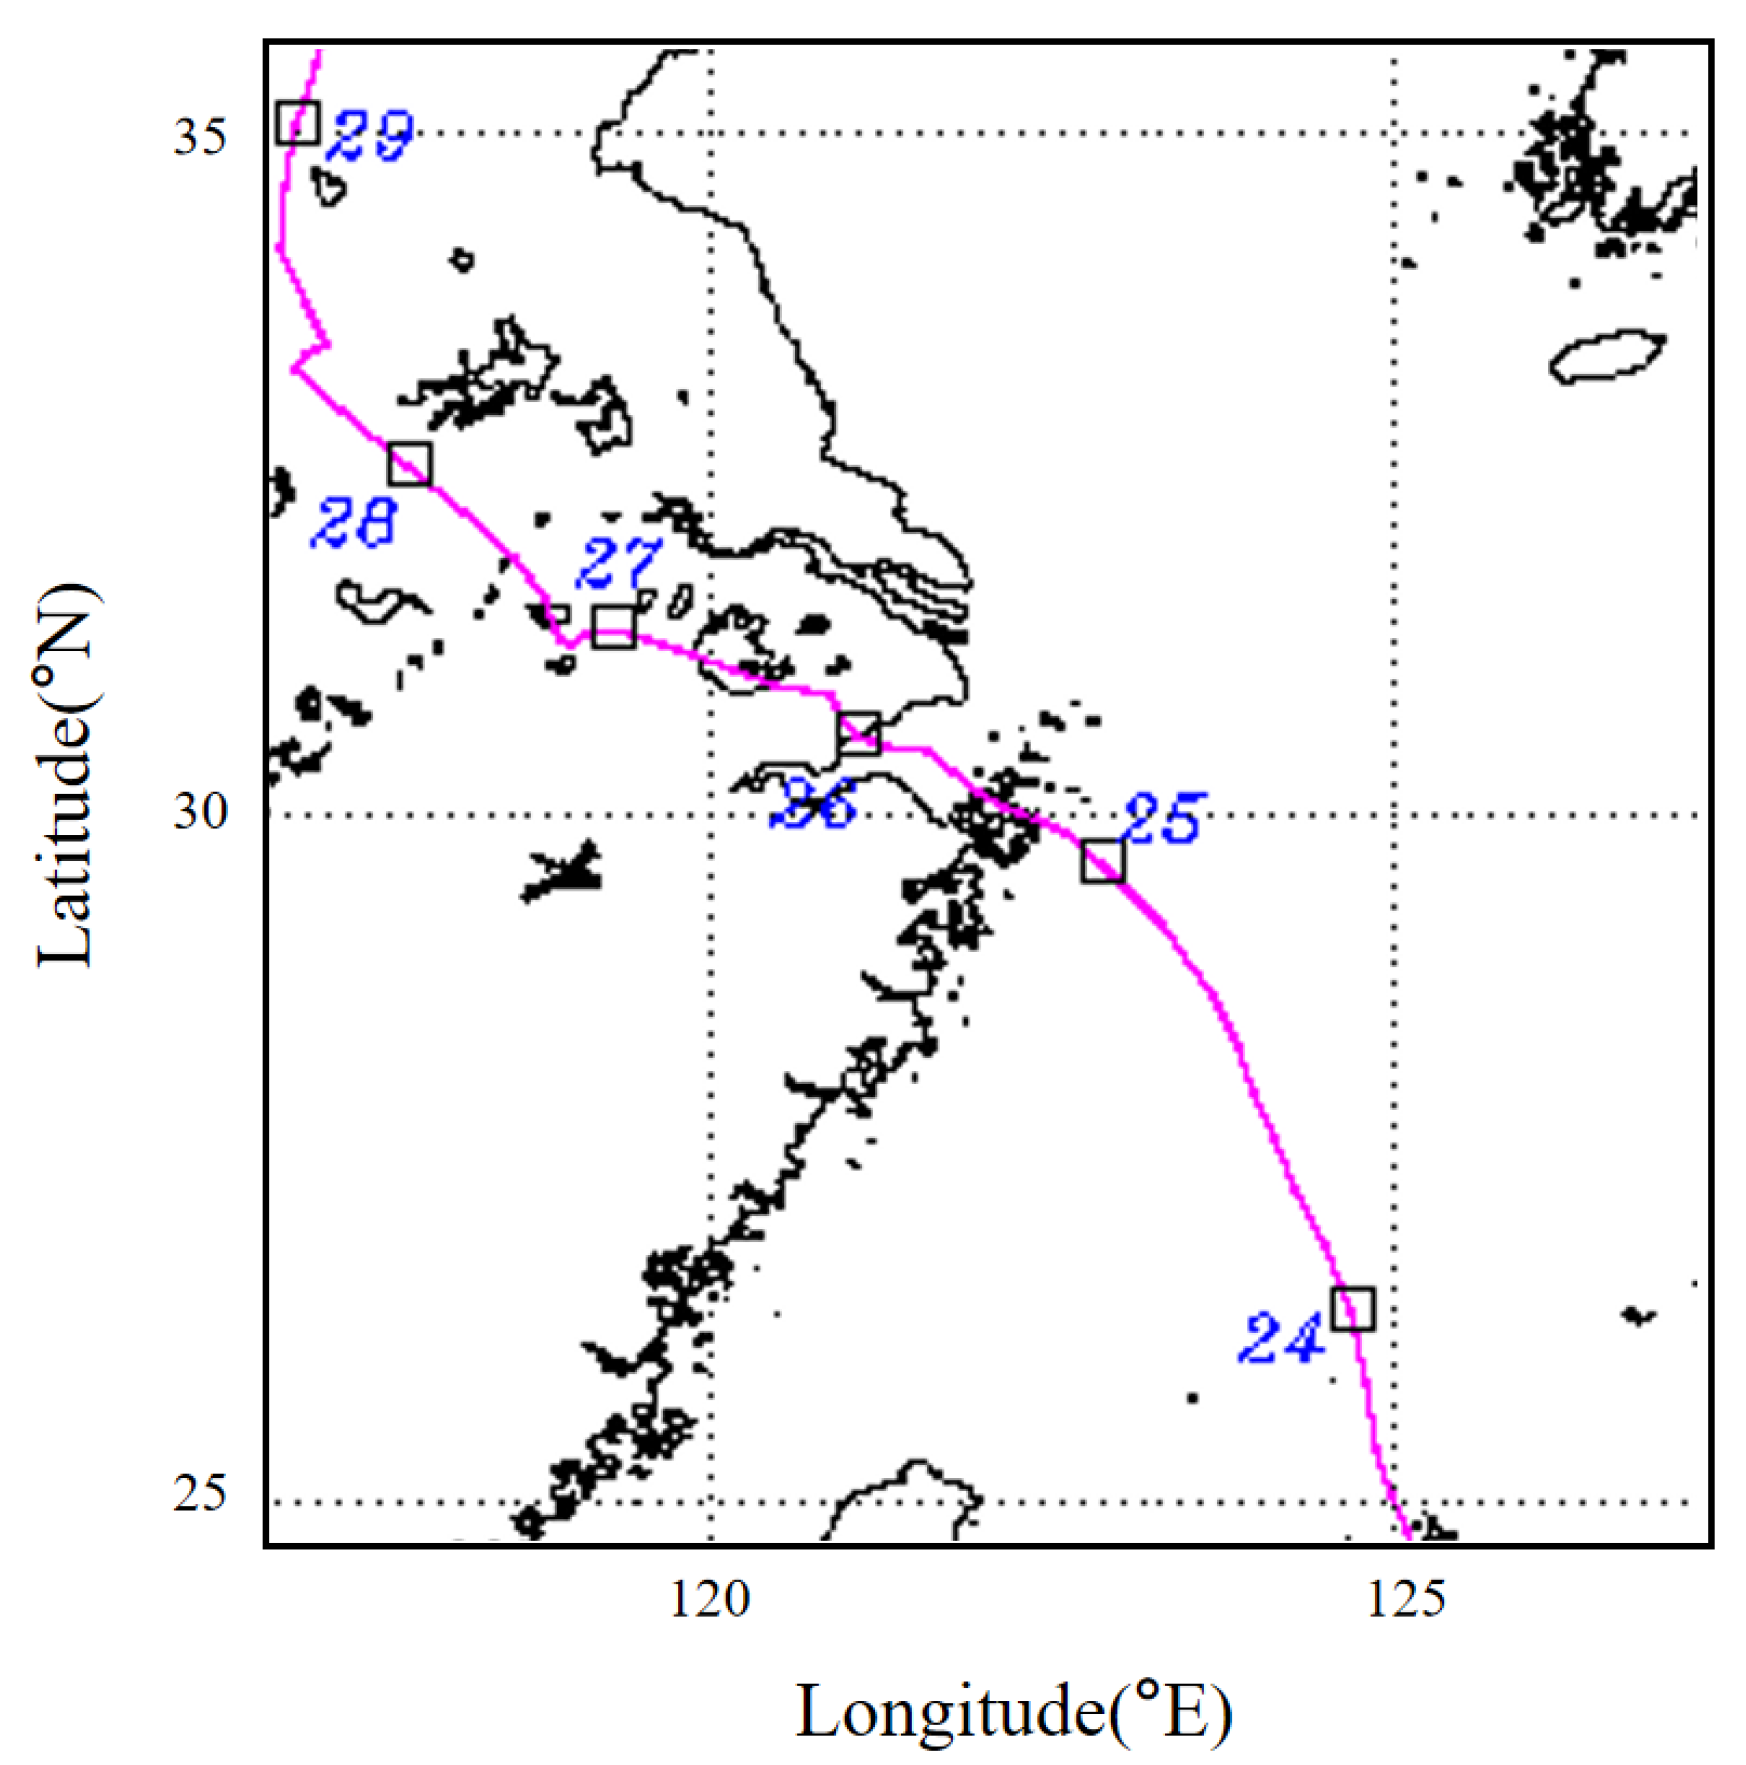
The model initiates through a cold-start regimen, taking into account the intricate interplay of astronomical tidal waves at the offshore open boundary, encompassing an ensemble of 13 subtidal waves (M2, S2, N2, K2, K1, O1, P1, Q1, MF, MM, M4, MS4, MN4). Extraction of tidal reconciliation constants at the boundary, a critical procedure, was meticulously conducted, employing the specialized Tidal Model Driver package. Rigorous validation of the model’s efficacy unfolded through meticulous comparisons with empirical data harnessed from a temporary tide level station (S1, 122°23.32′ E, 30°36.50′ N) and a strategically situated tide current station (L1, 122°18.27′ E, 30°33.80′ N). Elucidation of the geographical demarcation of the calculation area, featuring a distribution of water depths and a contiguous expanse of the open boundary, vividly illustrated in a vivid hue of red, is seamlessly gleaned from
Figure 2. Notably, this figure also serves to pinpoint the precise locations of the validation sites (S1, L1).
2.2. Fujita−Takahashi Model
The commonly used typhoon field models in the world are Fujita−Takahashi model and Holland model. For the parameterized wind field, the pressure formula is usually substituted into the cascade wind equation to obtain the wind speed field. In this paper, Fujita−Takahashi model was selected.
Formula of pressure field:
in which
is the peripheral air pressure,
is the pressure of the typhoon center,
is the peripheral pressure of typhoon, and
R is the maximum wind speed radius.
Formula of the gradient wind:
where
P(
r) is the pressure value of the sea surface
r from the typhoon center;
B is typhoon shape parameter;
(
r) is the tangential wind speed with distance
r from the typhoon center;
is the air density;
f is Coriolis parameter.
2.3. ERA5 Reanalysis Data
ERA5 reanalysis data are the latest generation of reanalysis data created by the Copernicus climate change service C3S, funded by the European Union and operated by the European Centre for Medium-Range Weather Forecasts (ECWMF). ECWMF is an organization that carried out data reanalysis research very early. Its reanalysis data have gone through four generations: FGGE, ERA-15, ERA-40, and ERA-Interim. ECMWF launched its 5th generation reanalysis product (ERA5) in November 2016.
ERA 5 has been greatly upgraded on the basis of its predecessor, ERA-Interim. Firstly, it has improved from the original ERA-Interim with spatial–temporal resolution of 80 km and 6 h to a horizontal resolution of 31 km and 3 h, respectively, and from 60 layers from the ground to 0.1 hPa in the vertical direction to 137 model layers from ground to 0.01 hPa (about 80 km from the ground). Secondly, ERA5 uses the data assimilation ensemble (EDA) system developed by ECMWF for the first time to adopt more historical observation data, especially satellite data, into the advanced data assimilation and model system to estimate more accurate atmospheric conditions and make the data more accurate at different times and locations.
The ERA5 wind field stands as a valuable repository of information for storm surge simulations, proffering a global perspective on wind speed and direction. The ERA5 wind field is conventionally harnessed as an influential force field to propel computational models, serving as a crucial driver for estimating wind stress at the ocean surface. This estimated wind stress subsequently fuels the computation of surface ocean currents and the ensuing genesis of storm surges. As a consequence, these surges are predictive of the height and spatial extent of storm surges incited by typhoons.
3. Results and Discussion
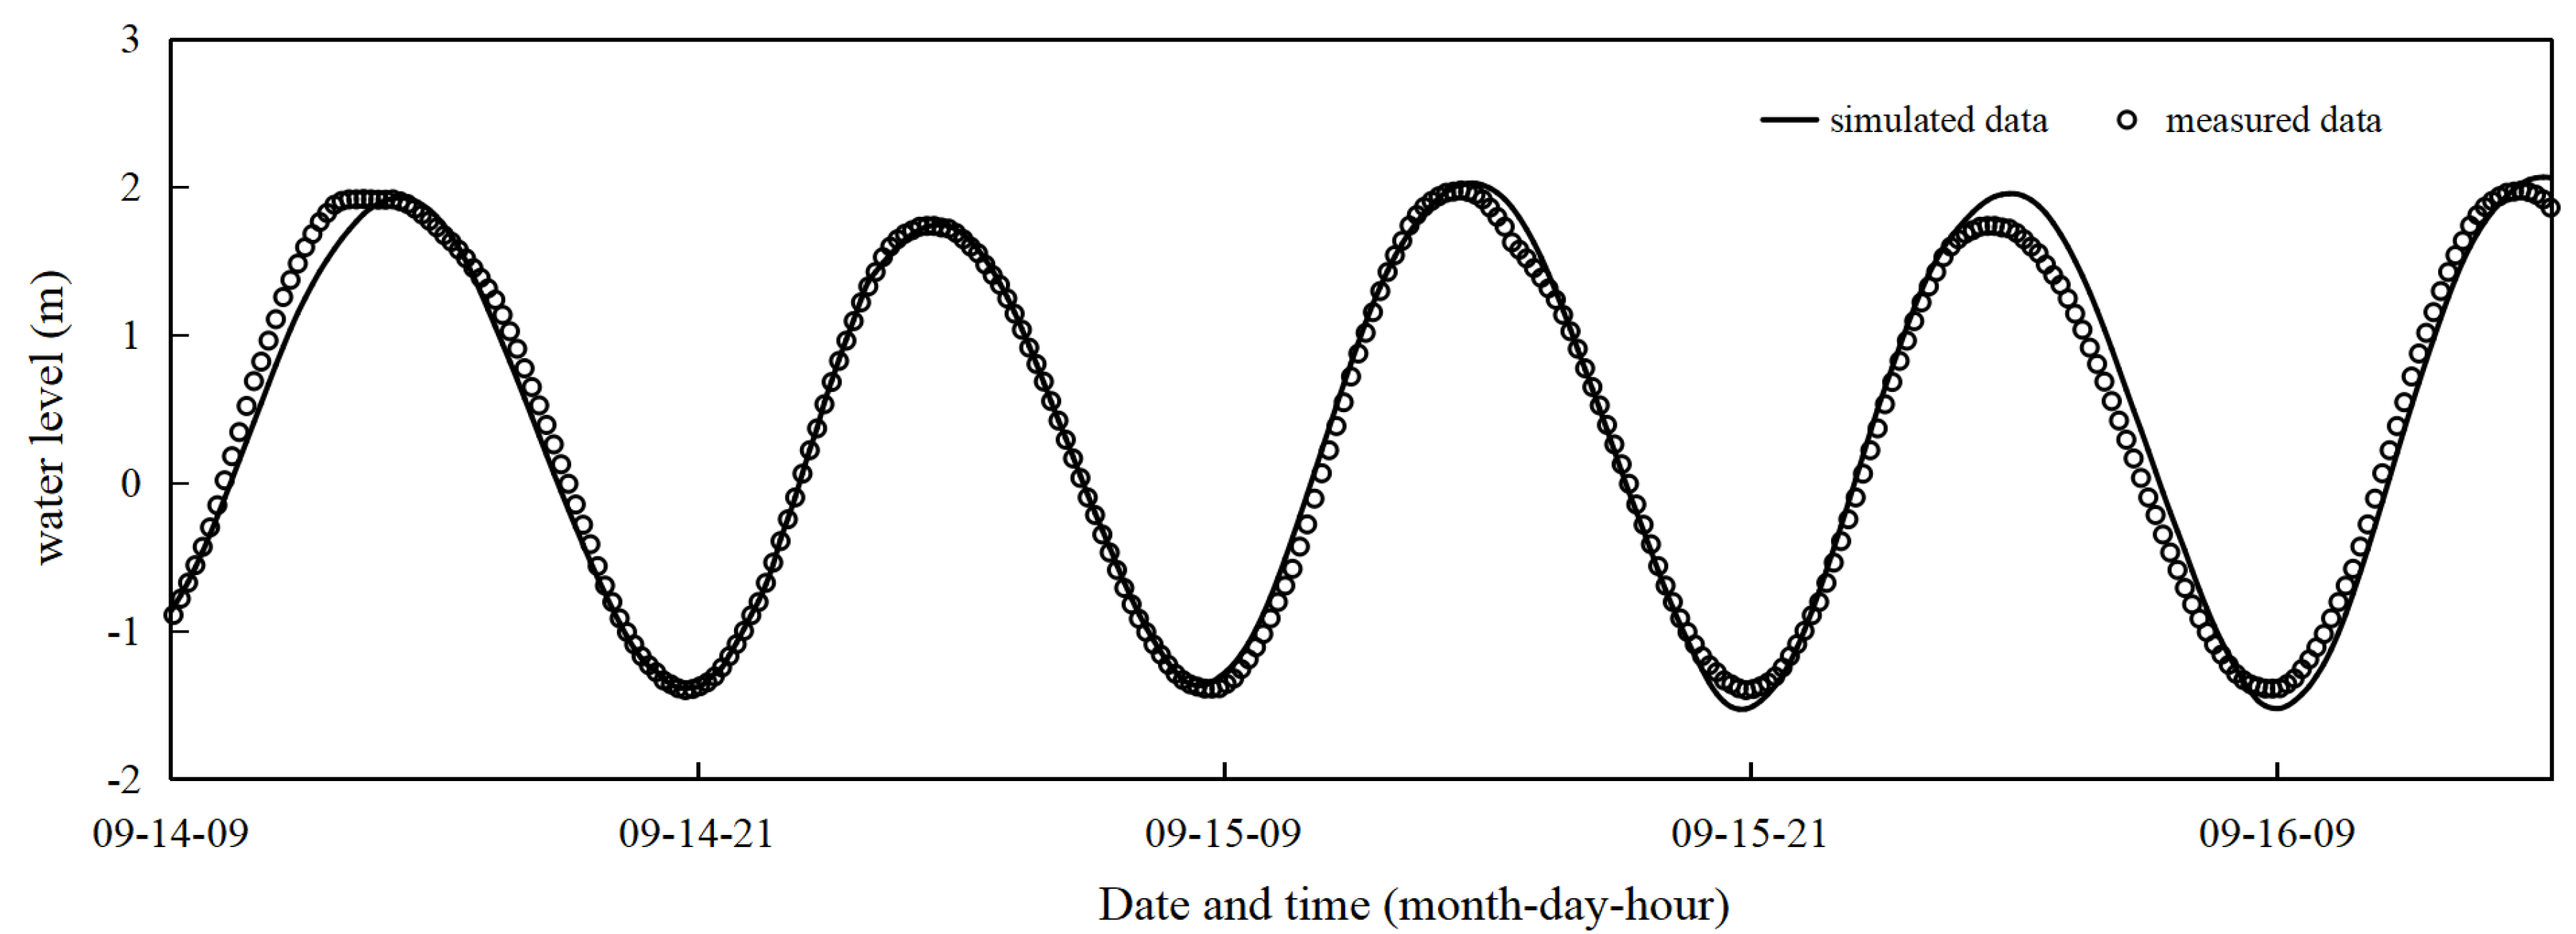
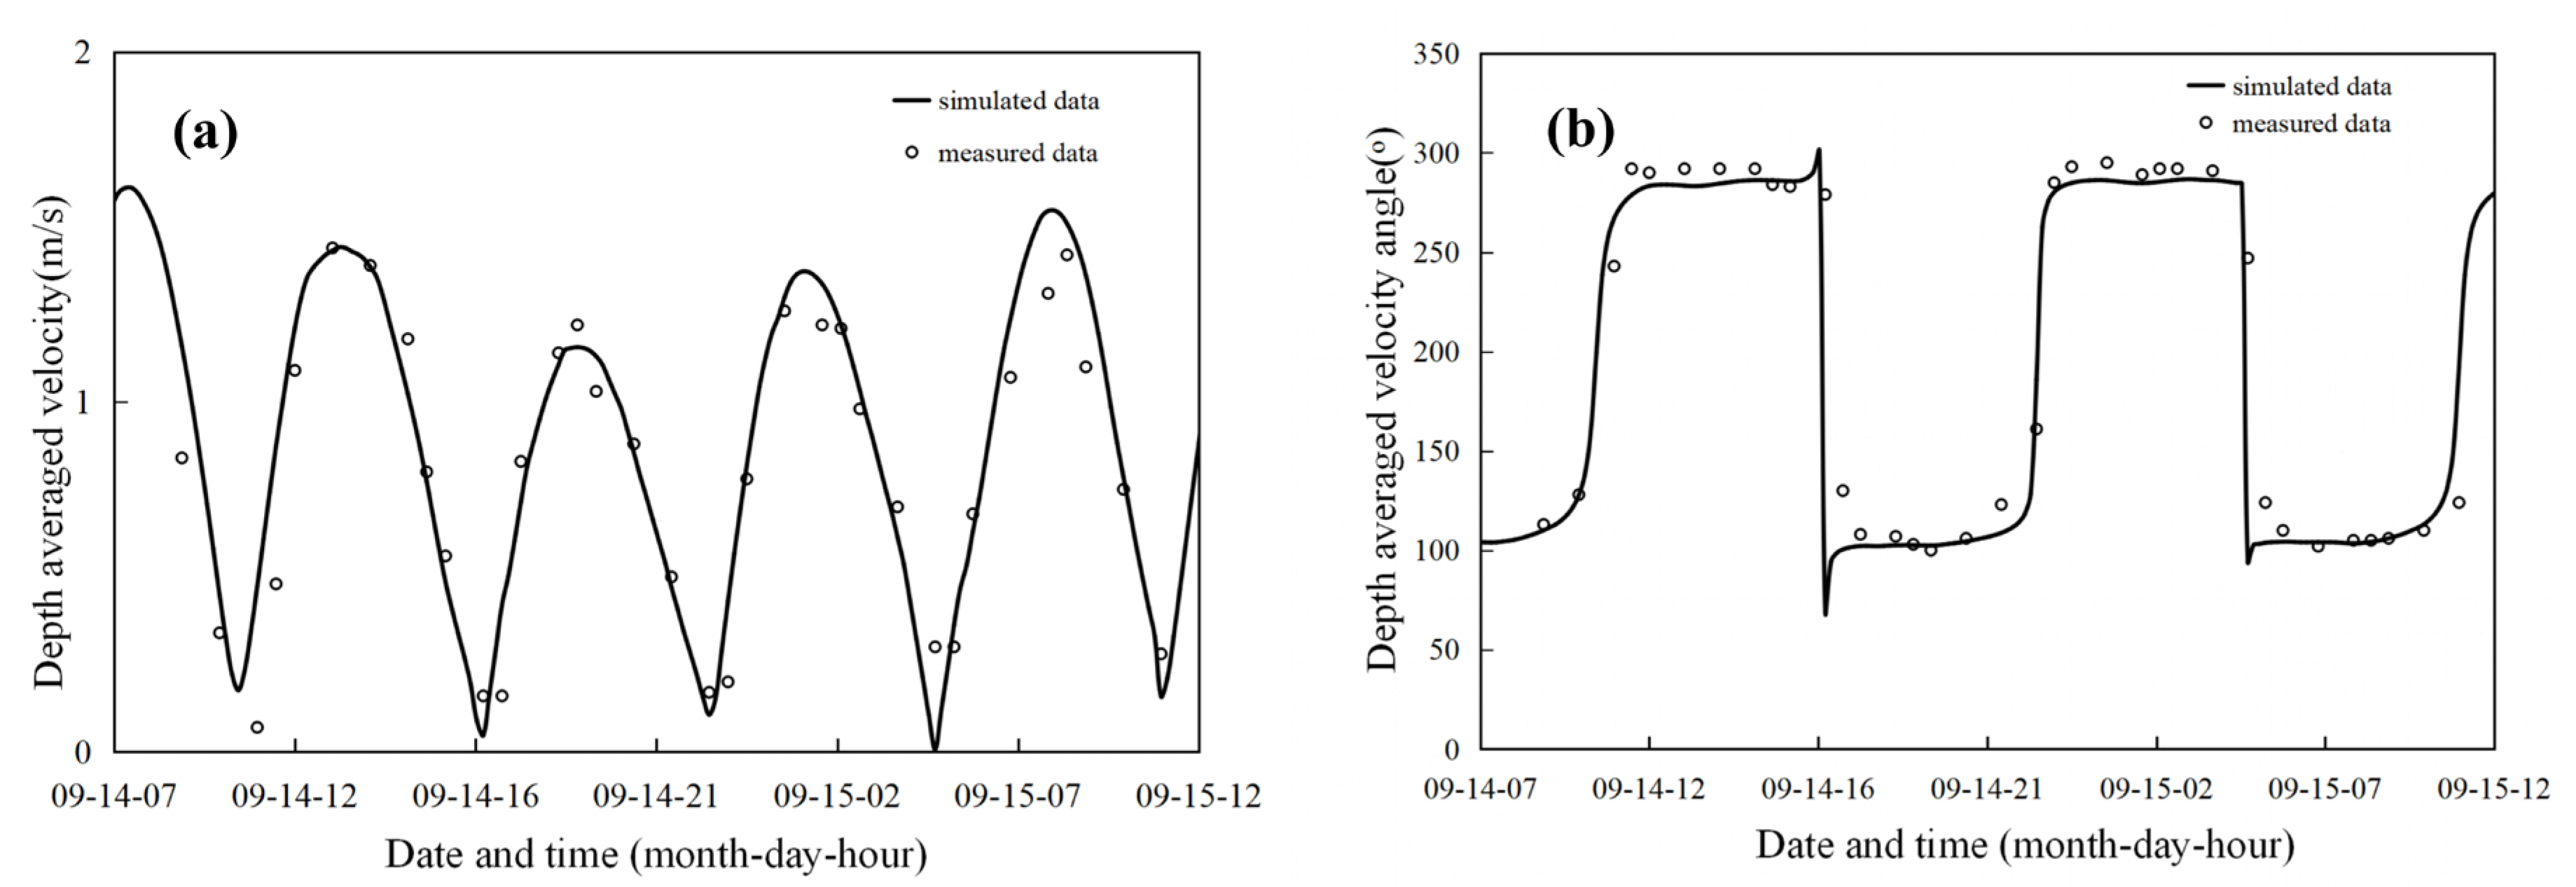
The tide calculation results are verified, as shown in
Figure 3; 91.7% of the astronomical tide level errors were within 20 cm. The current velocity and direction verification results are shown in
Figure 4. The calculated value of the vertical average current velocity was basically consistent with the measured value, and the simulation of the flow direction was also more consistent with the actual measurement, indicating that the astronomical tide model simulation accuracy is satisfactory and can be used as the basis for further storm surge simulation.
In this study, we employed data from Typhoon In-fa (2021) for model validation, sourced from NOAA. Typhoon In-fa, which formed in July 2021, emerged from a tropical disturbance in the western Pacific Ocean and rapidly intensified into a Category 4 typhoon. As shown in
Figure 5, its large wind field and well-defined eye posed threats to the East China Sea, with sustained winds exceeding 25 m/s.
The verification results are shown in
Figure 6 and
Figure 7. Firstly, sea level pressure, wind speed 10 m from the surface, wind direction from ERA5 reanalysis data, and the ground and high-altitude elements were extracted (the wind speed was calculated from the zonal and meridional wind speed), which were compared with the Fujita–Takahashi parameterized wind field model. The two models were substituted into the Delft3D-Flow module for calculation so as to obtain the storm surge verification model of Qushan station (122°17.17′ E, 30°26.35′ N) and Sijiao station (122°30.82′ E, 30°43.23′ N).
This paper applied bias degree (Bias) and root mean square error (RMSE) to determine the accuracy of the typhoon storm surge model. Bias represents the difference between the calculated value and the measured value:
in which
is the measured data of the
i th one;
is the calculated data of the
i th one; M is the total number of values. If Bias is near zero, it indicates that the error between the calculated and measured values of the results is low.
The RMSE represents the distribution of data points around the best-fit line. For a perfect match between calculated and measured values, the root mean square error is zero. The RMSE is obtained by the following relation:
The evaluation criteria presented in
Table 1 reveal that the Fujita-Takahashi model demonstrates higher accuracy during the typhoon migration phase, while the ERA5 model exhibits superior precision in the post-typhoon landfall period. By comparing the parameterized wind field model and ERA-5 in our analysis, we identified significant differences between the two before and after typhoon landfall. The morphology of the typhoon underwent drastic changes before and after landfall, deviating from its previously assumed symmetrical circular shape, as depicted in the parameterized typhoon field formula (Fujita 1952) [
20]. Consequently, the formula for the typhoon field was theoretically not applicable after landfall, which indirectly corroborates our findings that the postlandfall typhoon field model exhibited poorer performance in calculating water levels.
Drawing upon the validated structure outlined above, we present a novel approach for investigating typhoon storm surges. Specifically, we integrated a parameterization model with a background wind field to capture the mobile wind speed during the typhoon’s movement and the background wind speed during the typhoon impact phase, respectively. Based on the aforementioned ERA5 data and Fujita–Takahashi models, we selected the prelandfall period for the Fujita–Takahashi model’s typhoon field and the postlandfall period for the ERA5 data wind field to simulate the storm surge water level. This approach allowed us to capture the dynamic interactions between the wind fields during different phases of the typhoon event. By combining these datasets, we aimed to enhance the accuracy and reliability of our storm surge simulations and generate valuable insights into the behavior of storm surges in the study area. To evaluate the effectiveness of our approach, we applied it to analyze the extreme water level increase due to Typhoon In-fa (2021) in the Zhoushan Sea area. Our methodology provides a comprehensive framework for comprehending the intricate dynamics of typhoon storm surges, and our results offer valuable insights into the potential impacts of these surges on coastal and estuarine regions.
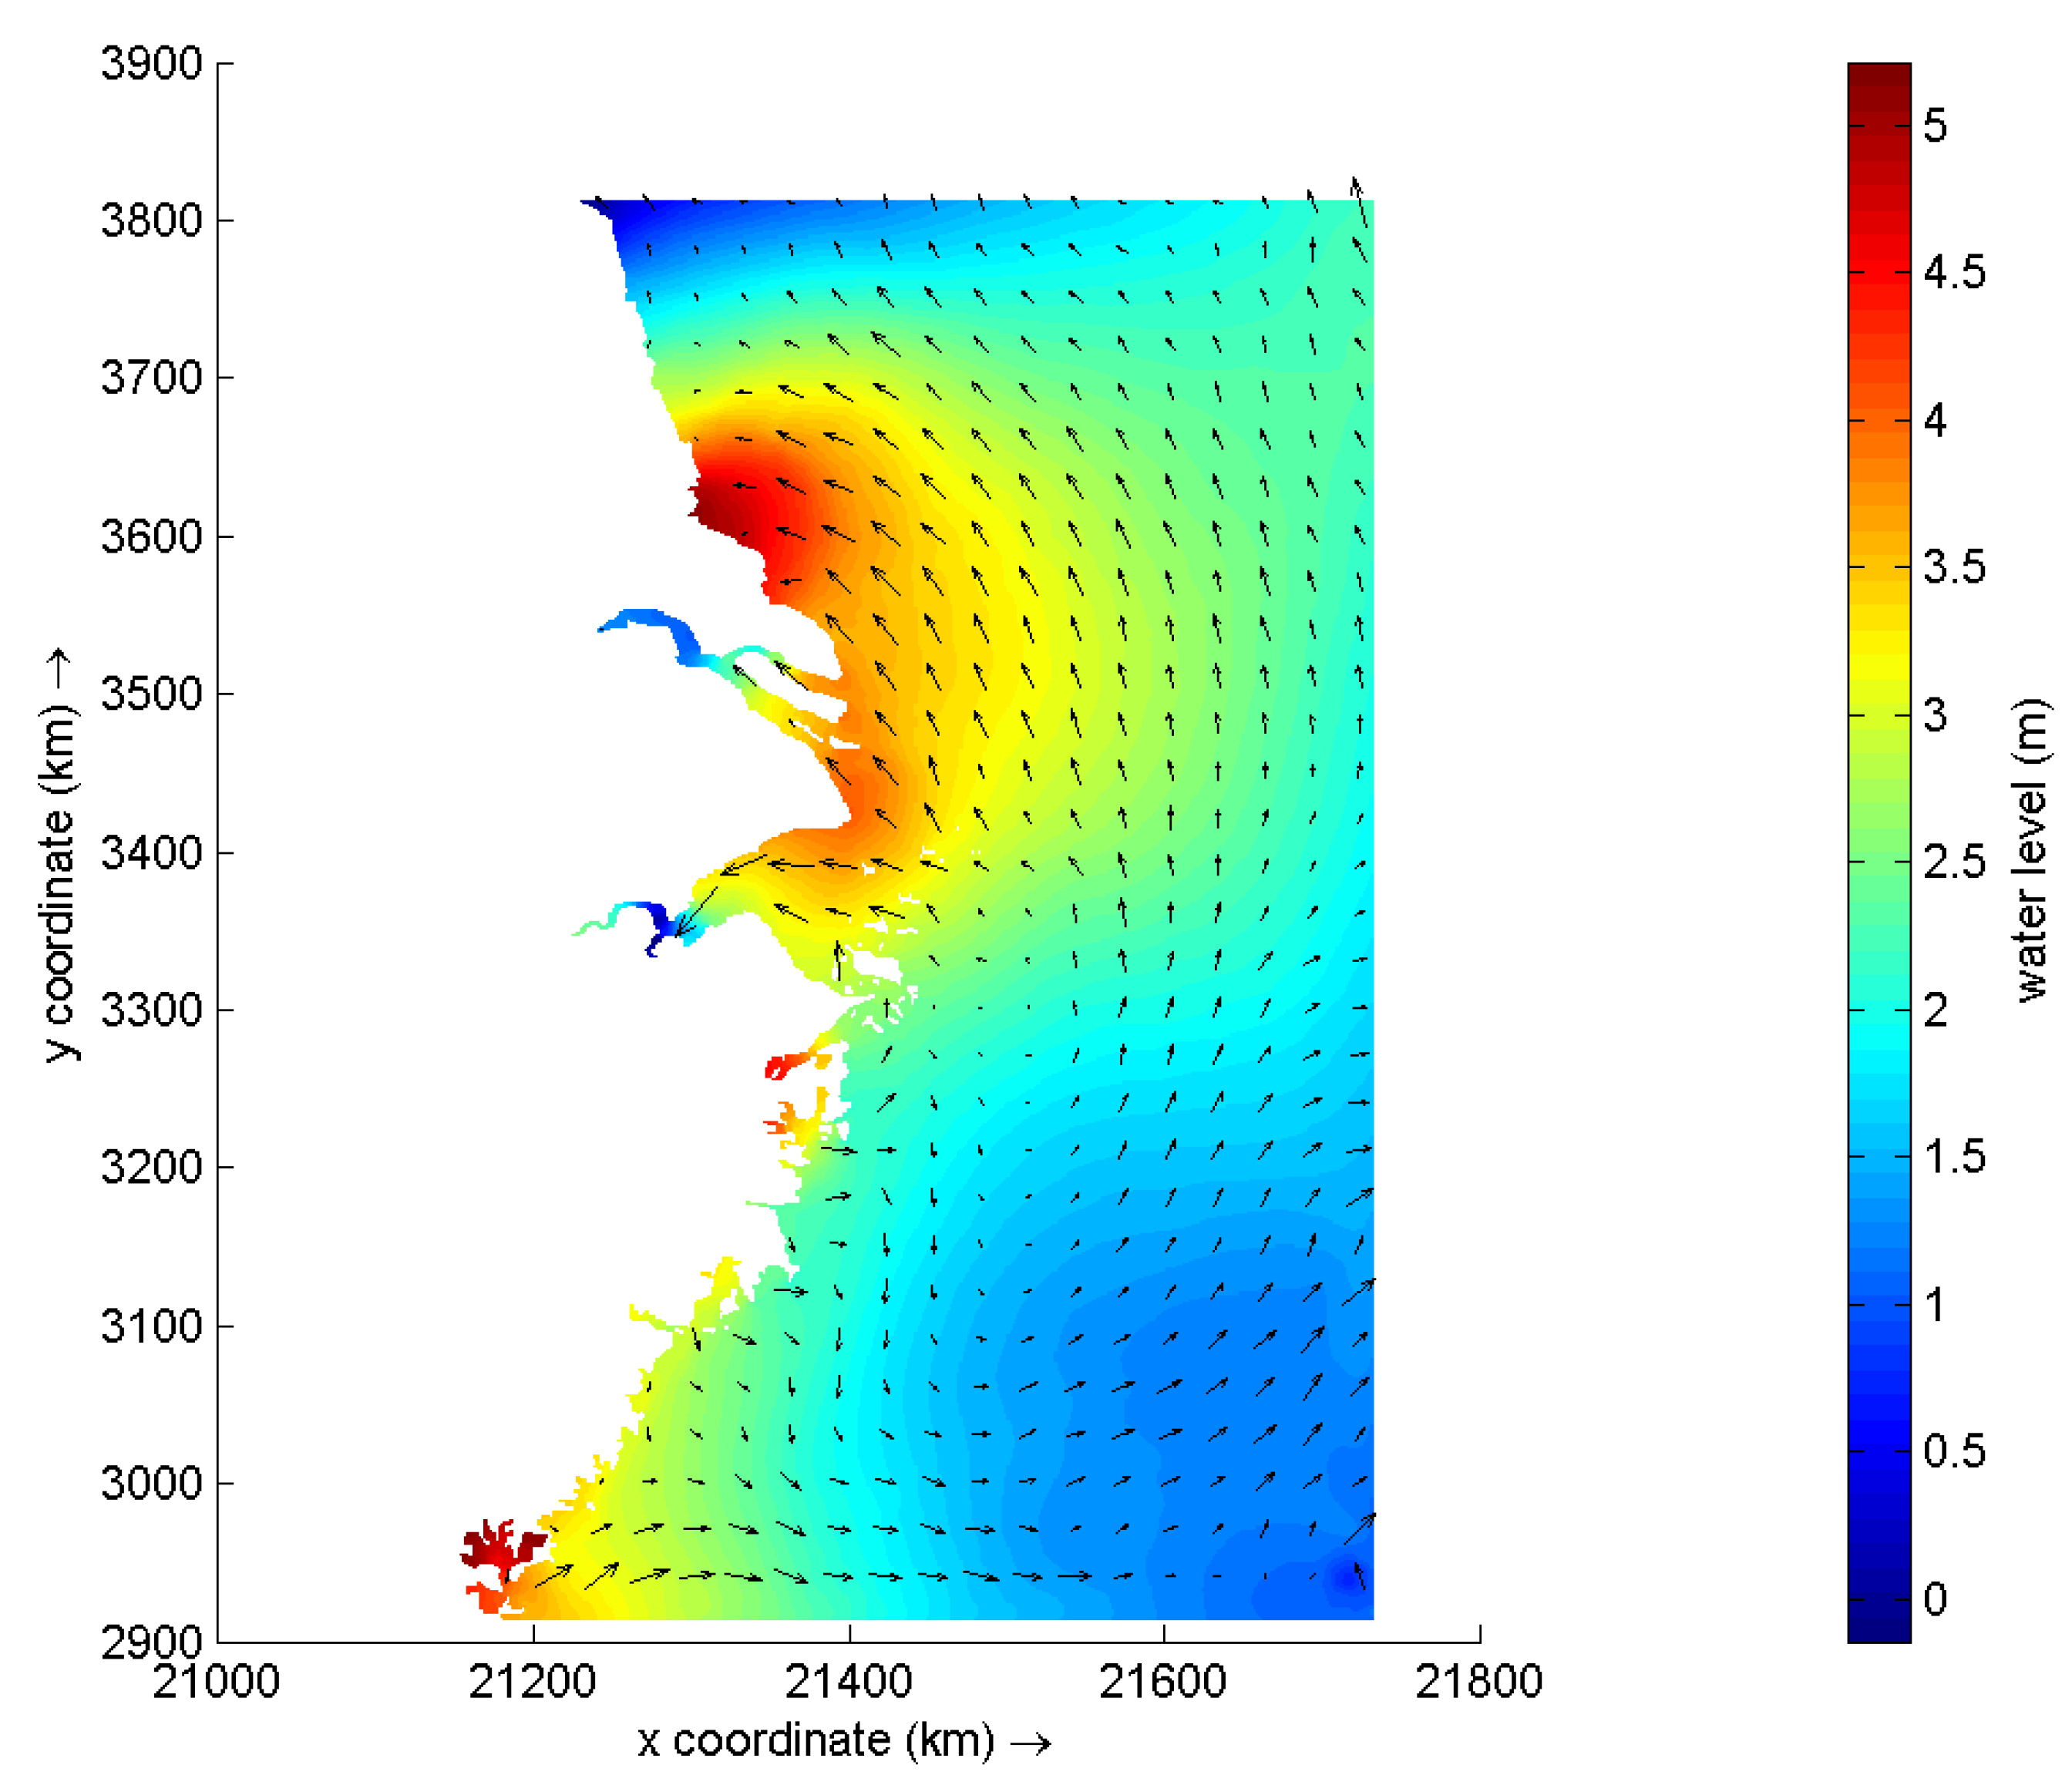
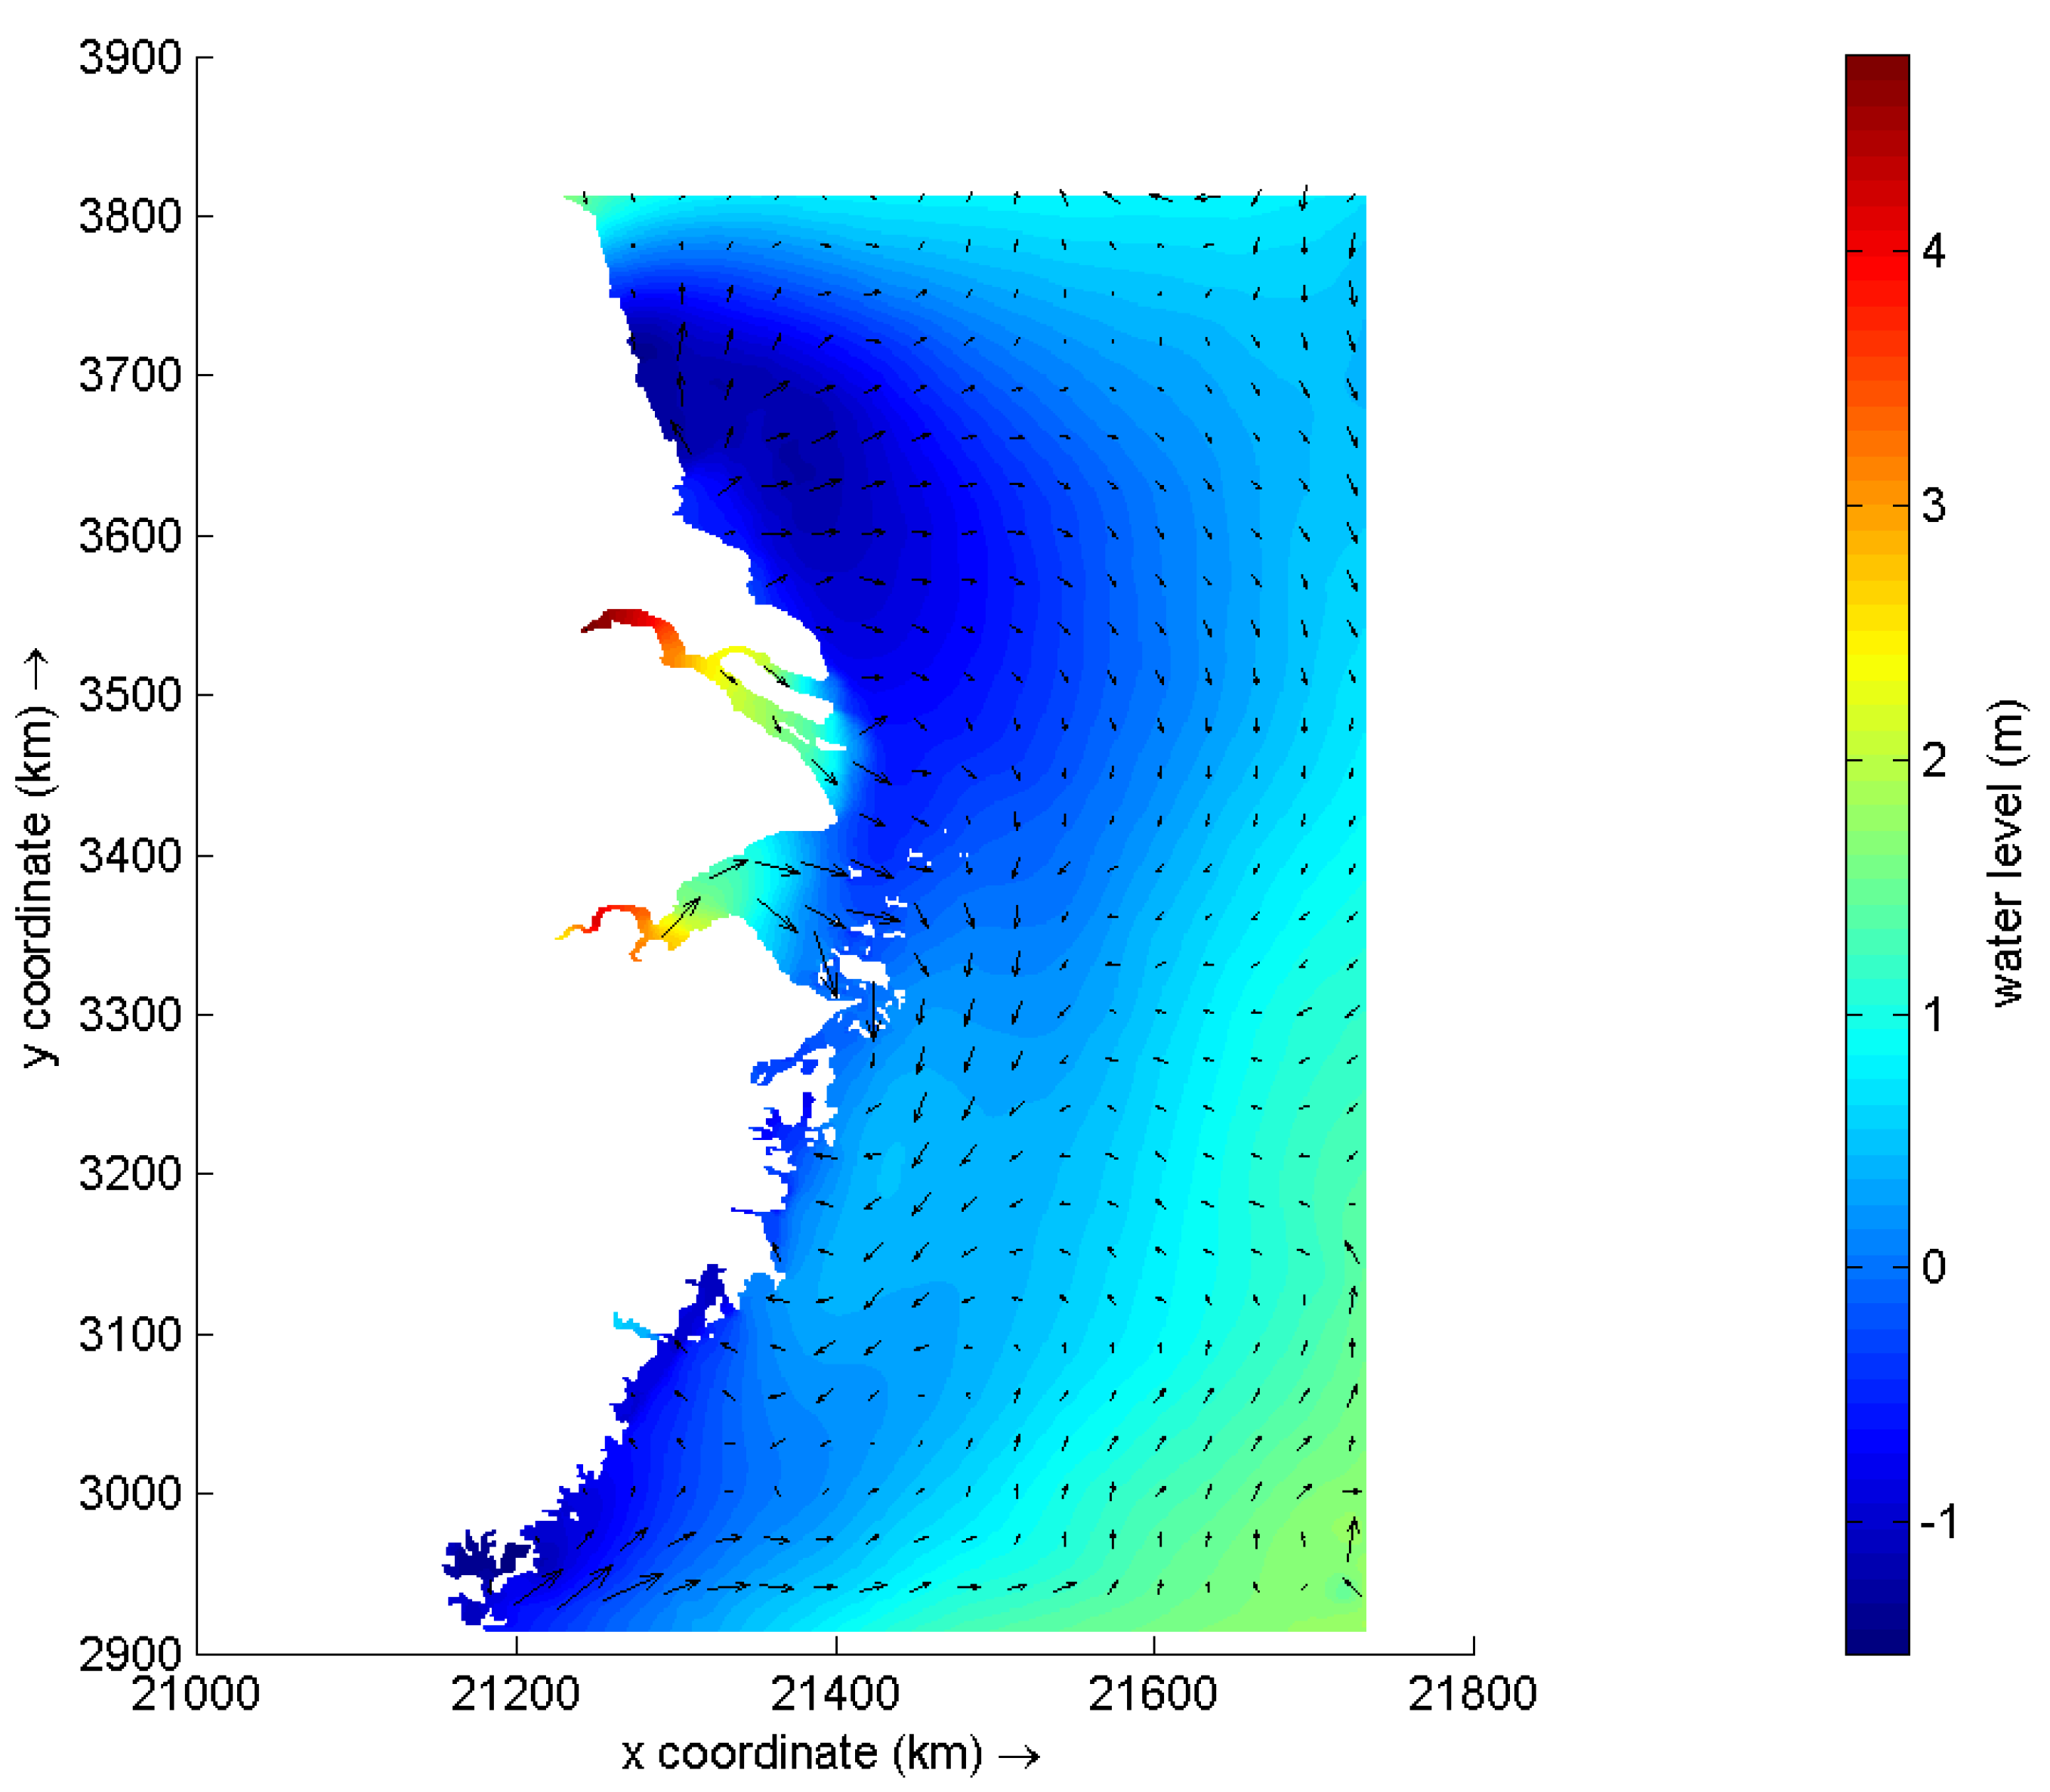
As illustrated in
Figure 8, we selected the time points of high tide and low tide at the Daishan hydrological station (122°11.894′ E, 30°14.64′ N) as the calculation time for the storm surge and flow field. As the numerical model is capable of computing water levels across the entire calculation area, we analyzed the storm surge water level and its spatiotemporal variation during the event.
Figure 9,
Figure 10,
Figure 11,
Figure 12,
Figure 13 and
Figure 14 present the spatiotemporal distribution of water level variations and storm surges during the occurrence of Typhoon In-fa (2021) in the calculation area. These visual representations offer valuable insights into the dynamic behavior of water levels and storm surges in the East China Sea. By systematically analyzing and summarizing the observed characteristics, our study establishes a robust scientific foundation for effective disaster prevention and mitigation strategies in coastal regions. Notably, the direction of the arrows in the figures indicates the prevailing water flow direction, while the arrow size corresponds to the magnitude of the flow velocity.
As shown in
Figure 9, at the high tide of Daishan station at 22:00 p.m. on 24 July, the Yellow Sea and the East China Sea suffered the influence of the typhoon globally, and the extreme water level increase was within the range of 0–5 m. The extreme water level in the nearshore was greater than that in the open sea area, and the increase in water level in the open sea area was relatively small. The closer it was to Hangzhou Bay and the Yangtze River Estuary, the greater the extreme water level, among which the water level in the southern coastal area of Jiangsu rose by more than 4 m with a flow direction of SE. There was no significant rise in the water level in the central and northern coastal areas where the flow direction was S. The water level rise in Yangtze River Estuary, Zhoushan Islands, and Quanzhou in Fujian Province increased significantly by more than 4 m. The flow direction of the Yangtze River Estuary and Zhoushan Islands was E, while that of Quanzhou, Fujian, was N. This spatial variation can be attributed to the complex topographic conditions near the bay. The intricate coastline and shallow shoals in this area can amplify and constrain the storm surge, resulting in higher water levels, as previous studies have also reported (Jeong et al., 2023) [
21]. In contrast, the smooth and deep topography of the open sea region is unfavorable for the accumulation of storm surges.
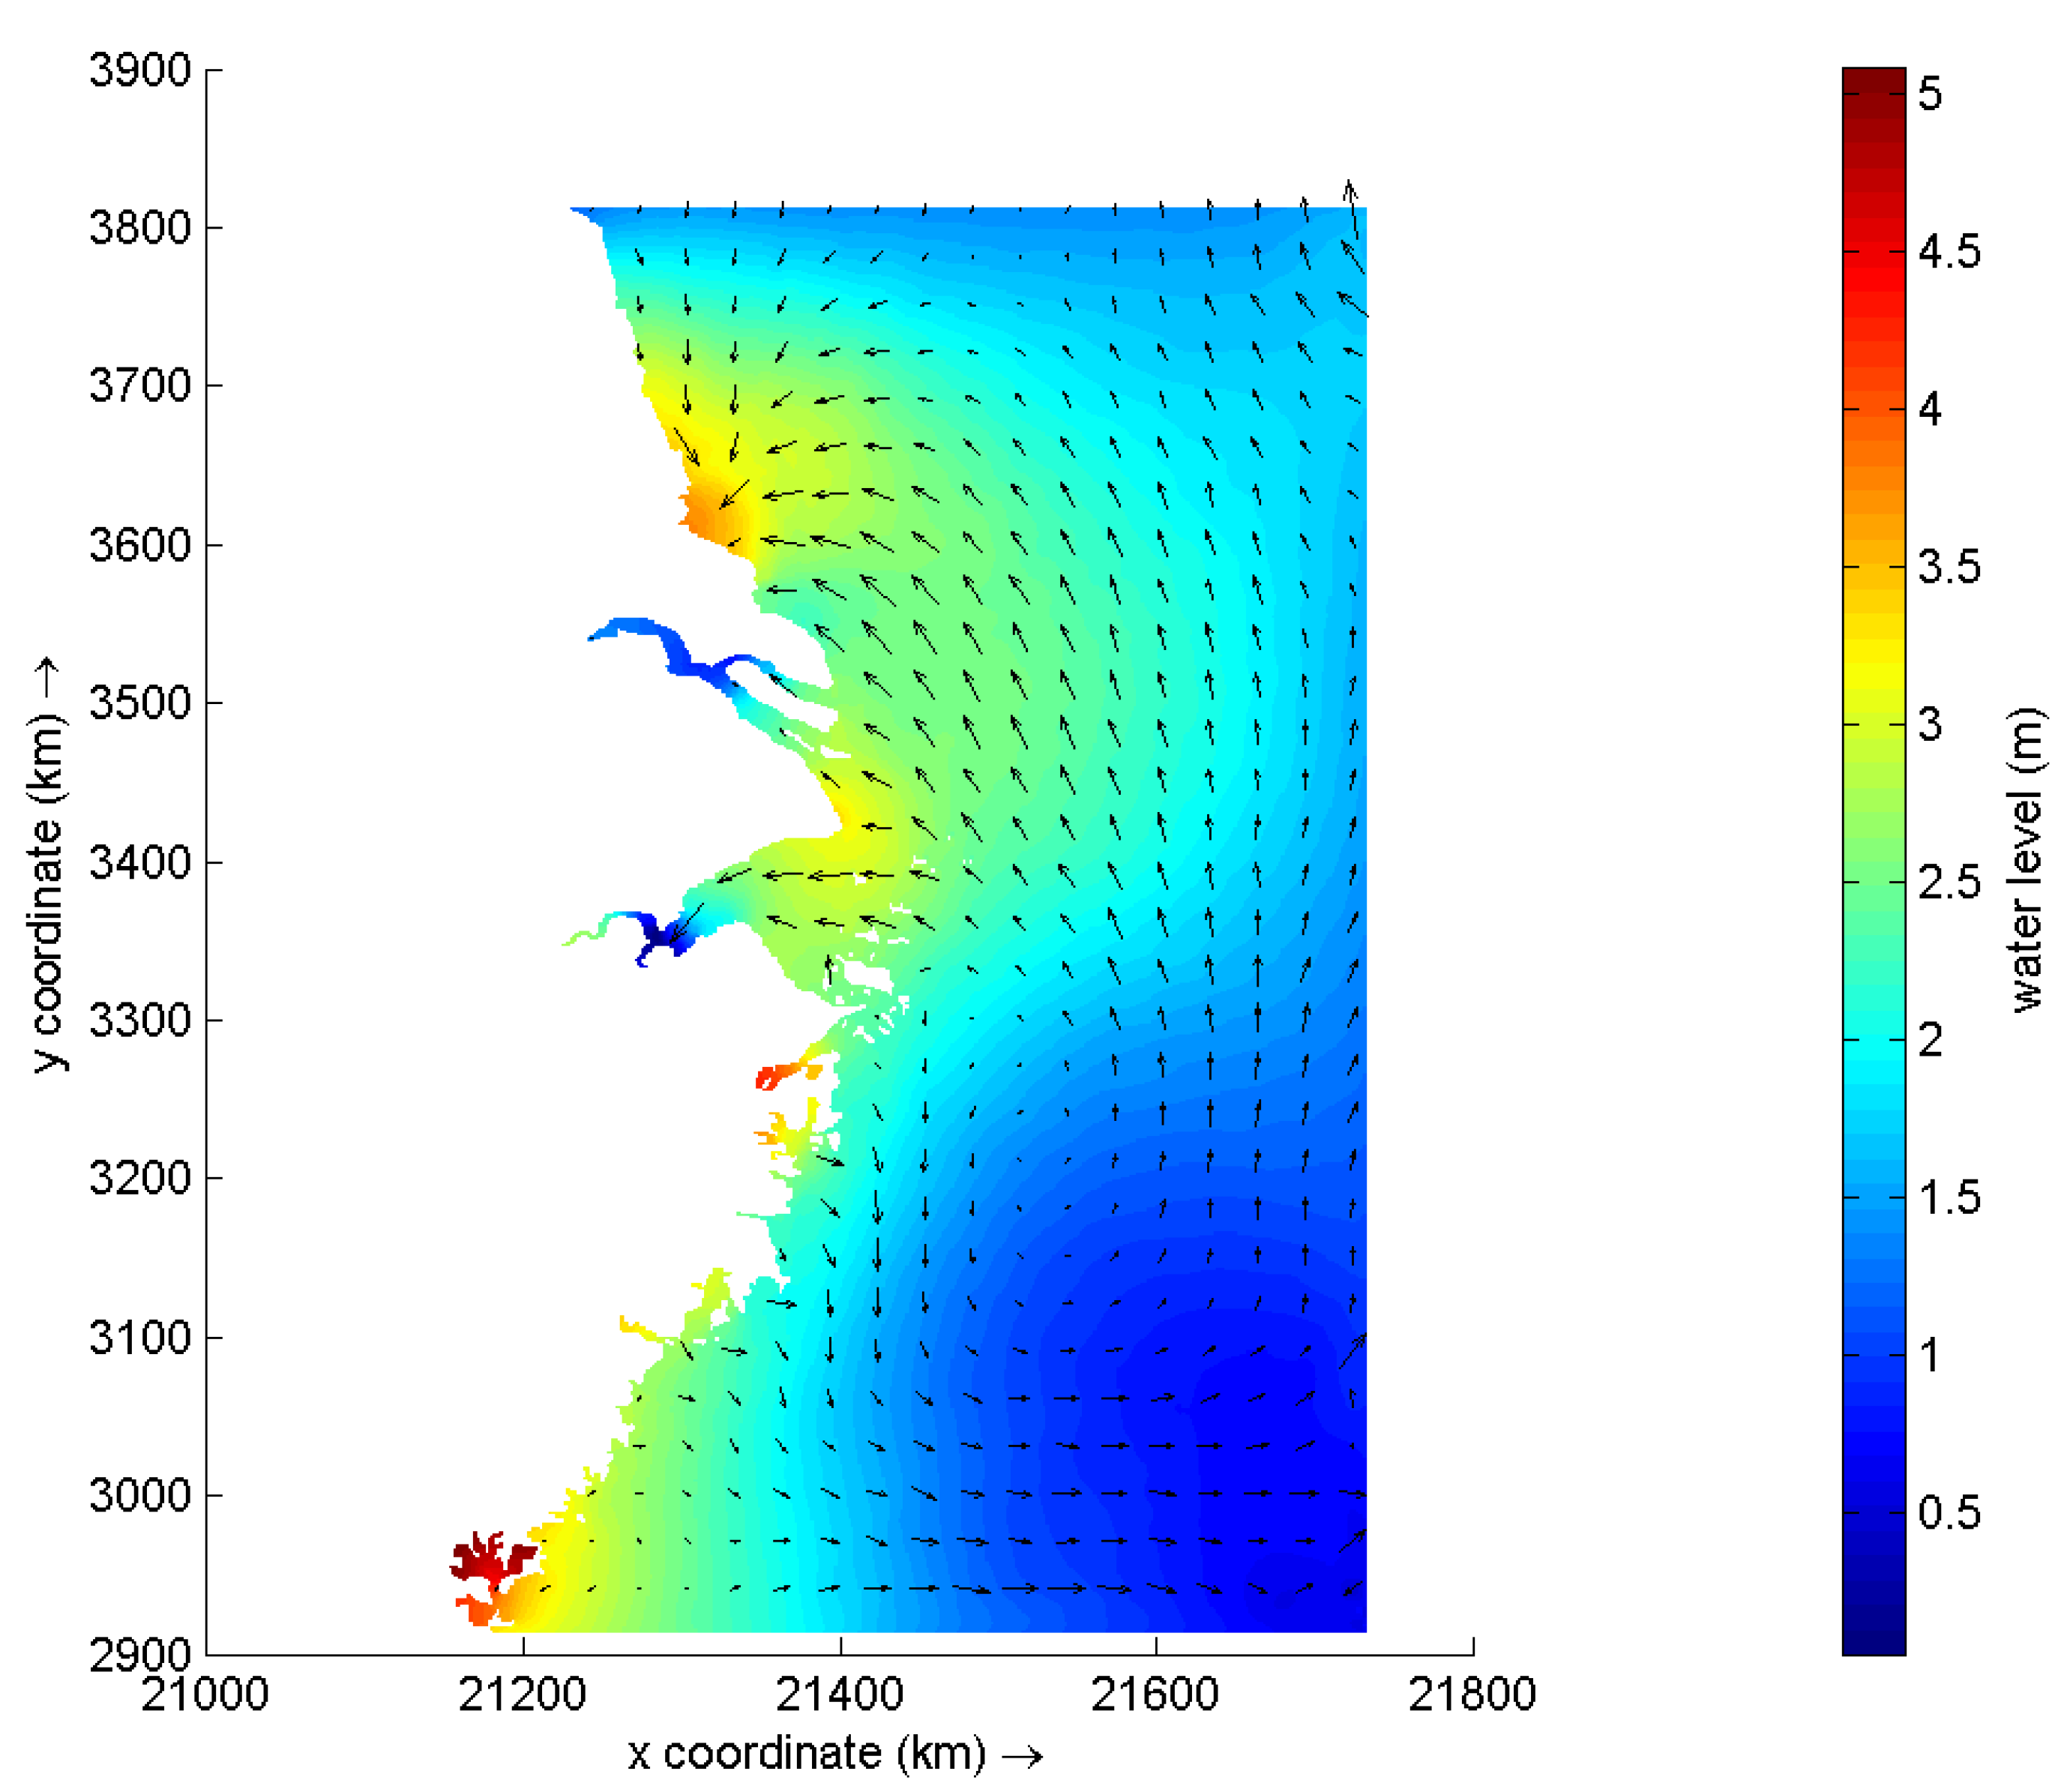
Figure 10 shows the flow field of the Yellow Sea region and the East China Sea region at 5:00 on 25 July with the low tide level of Daishan station. The extreme water level rise was within the range of 0–5 m. The water level in the southern coastal area of Jiangsu rose to 5 m with a flow direction of SE. The water increase is remarkable in the Yangtze River Estuary and Quanzhou, Fujian, where the coastal water level rose by more than 4 m with a flow direction in the Yangtze River Estuary of SE. This indicates that the nearshore areas were closer to the center of the typhoon, experiencing stronger winds and wave forces, which drove tidal fluctuations. Similar storm surge peaks near the landfall point have been observed in previous typhoon events (Chen et al., 2022) [
22].
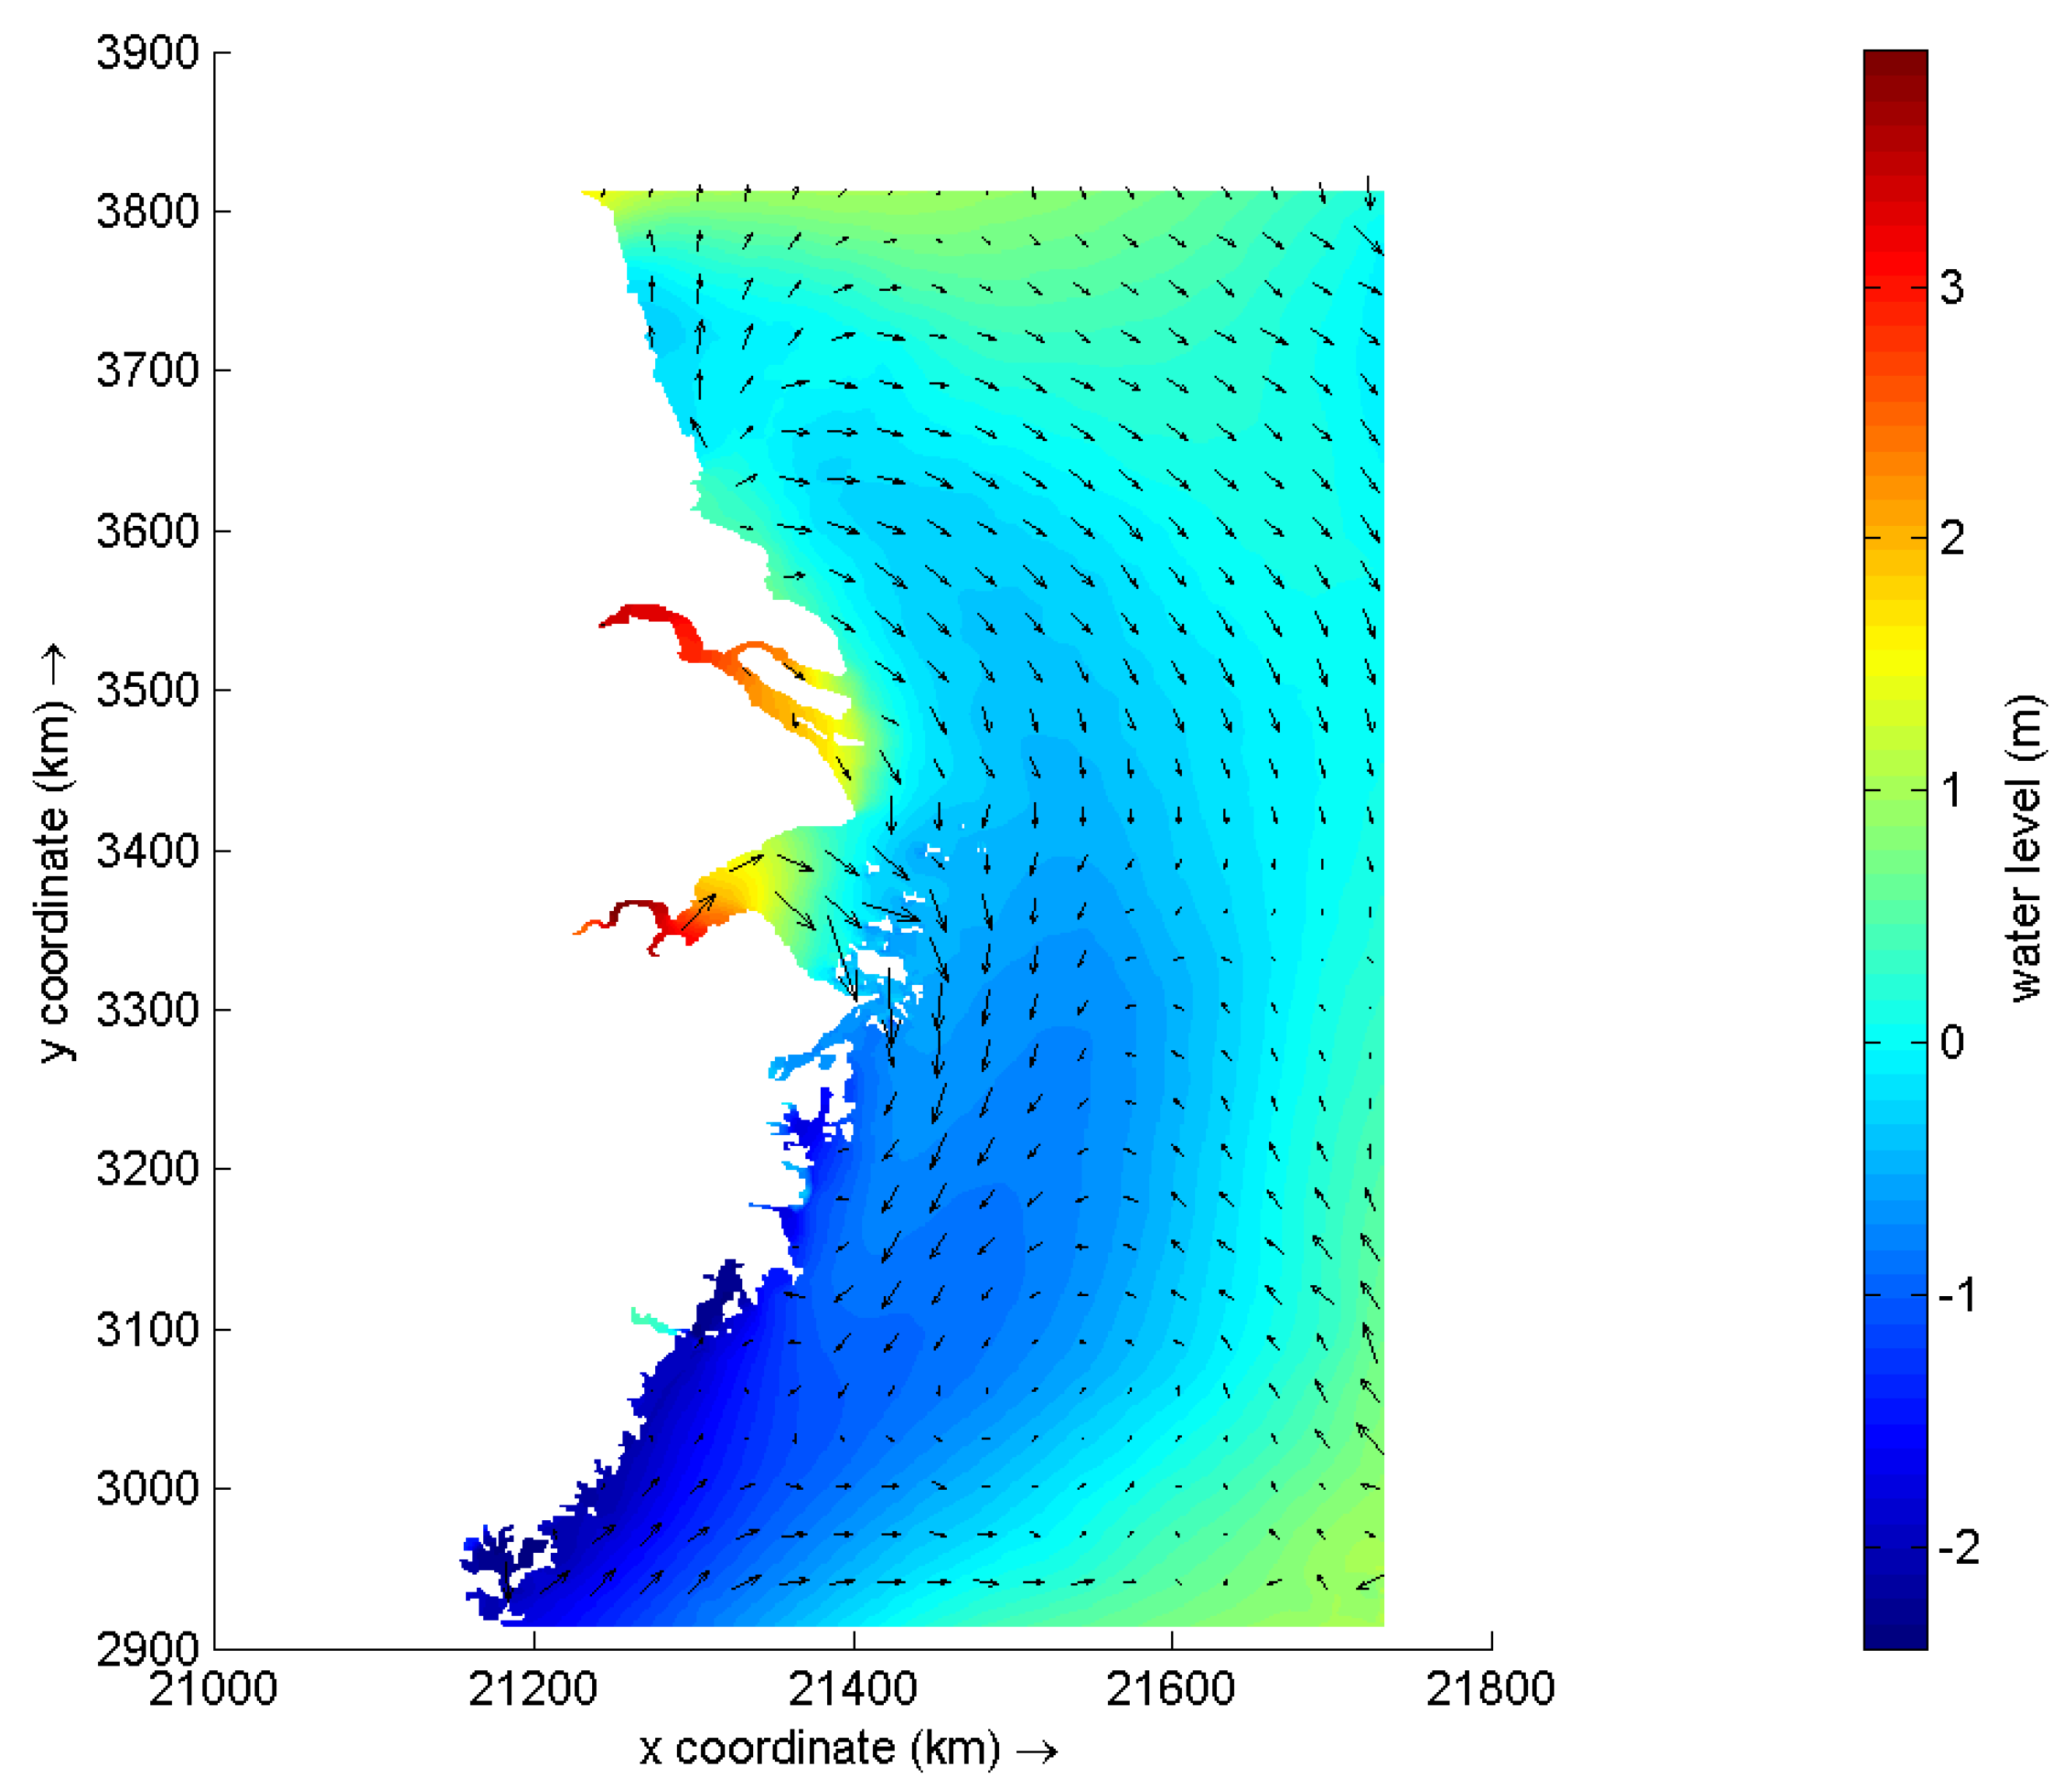
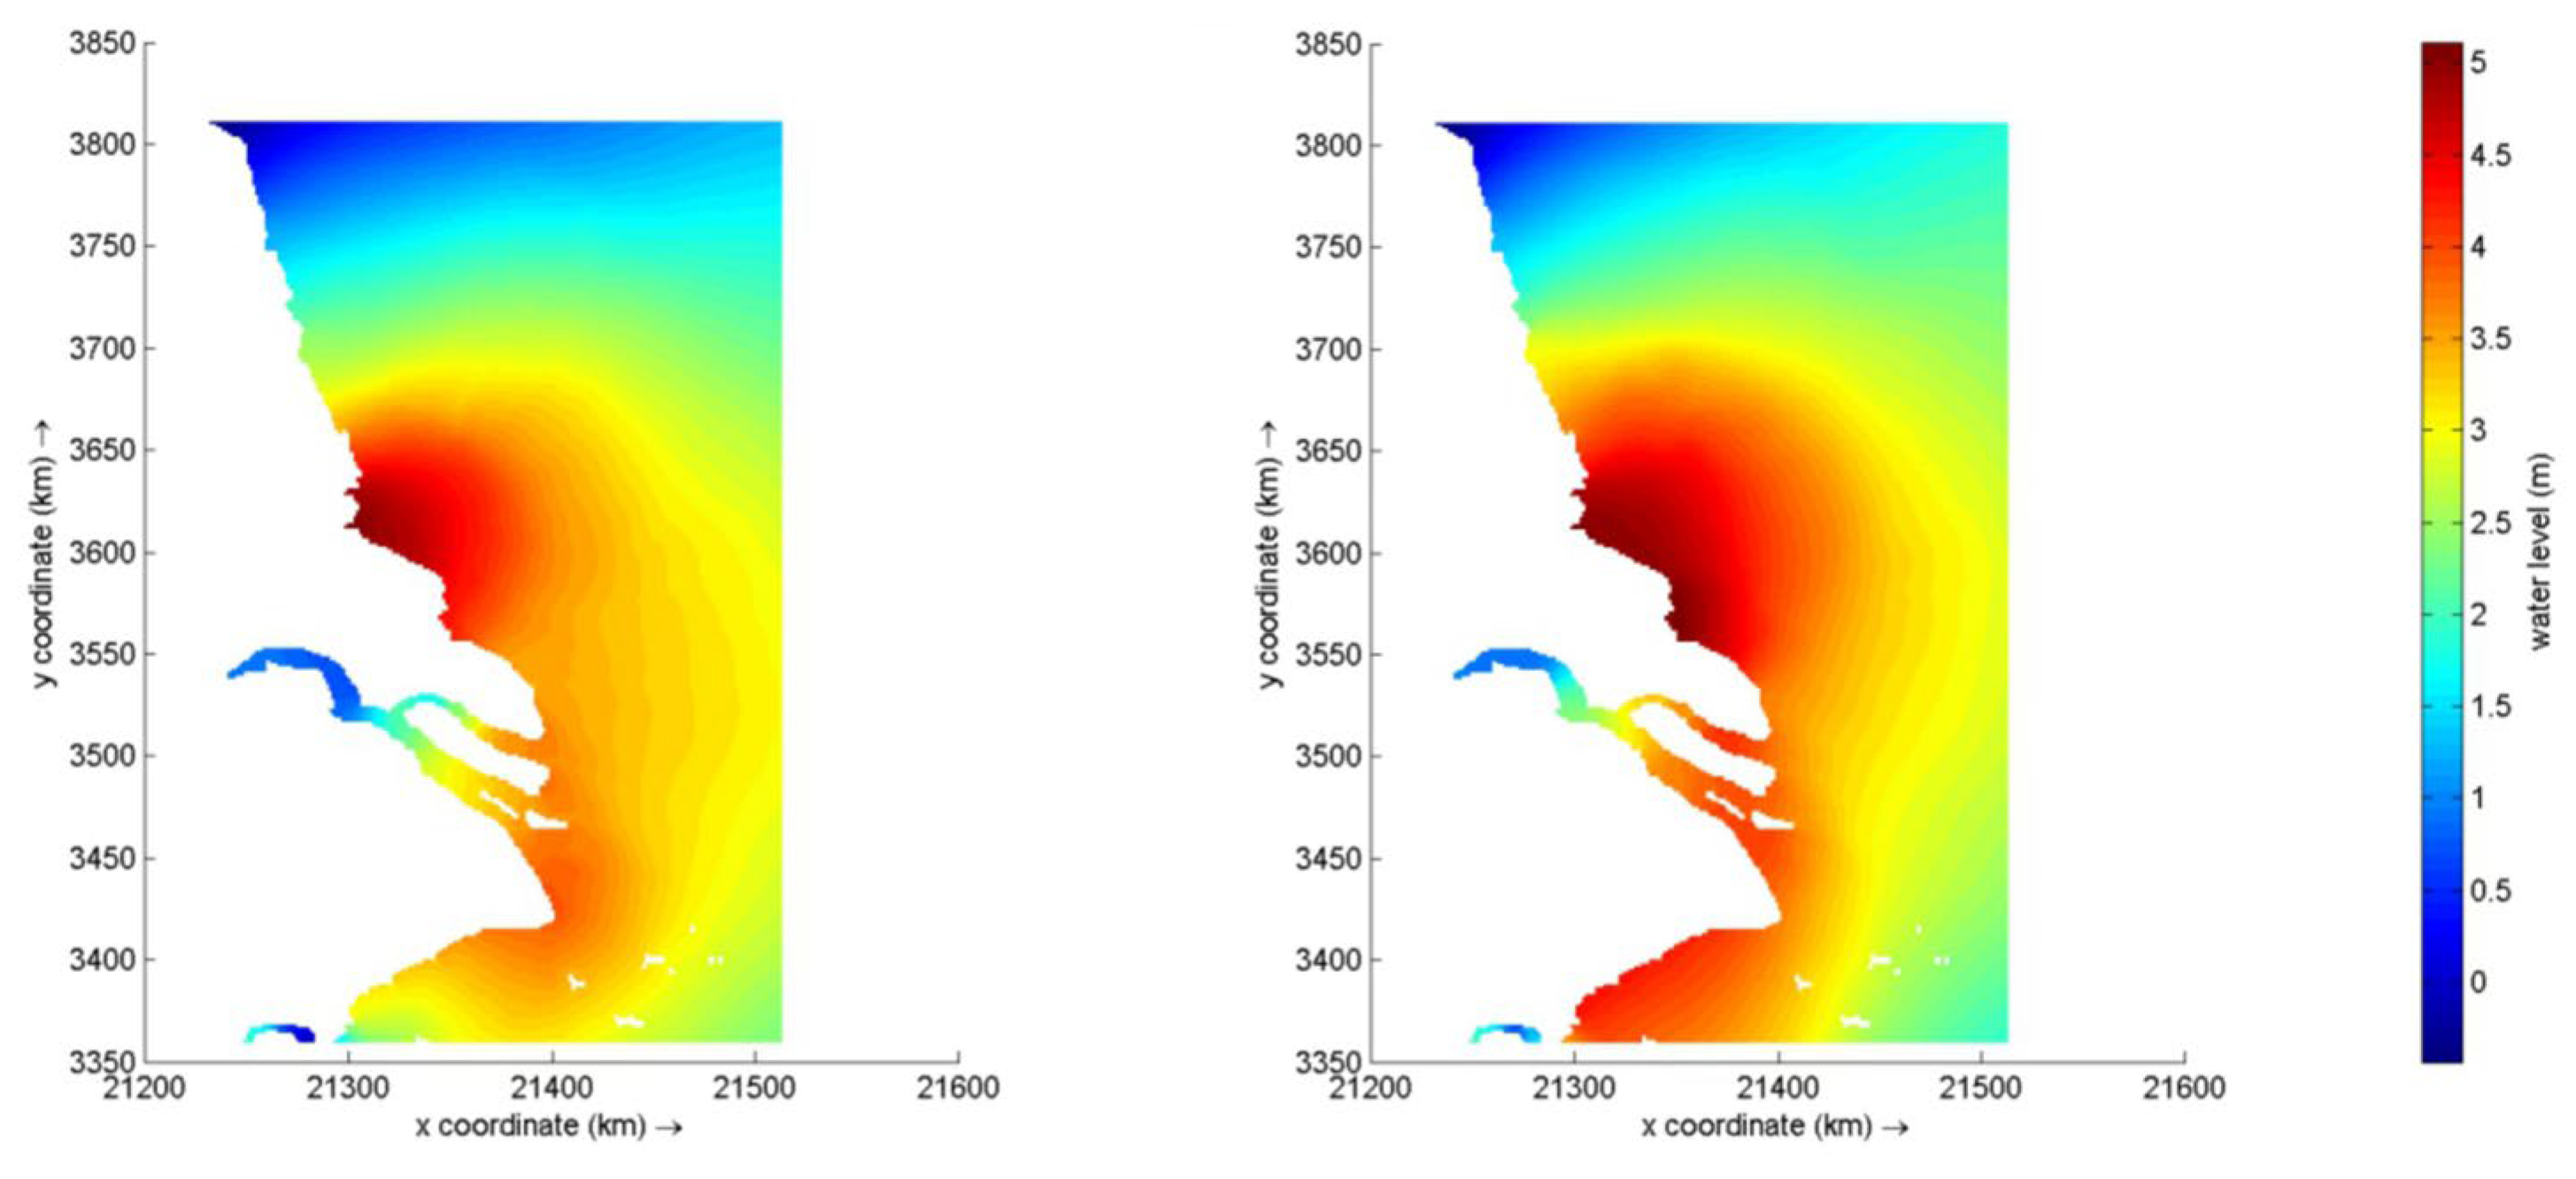
From
Figure 11, the extreme water level rise was 0–3 m at 11:00 a.m. when it was high tide at Daishan station. The affected sea area gradually moved from the Qiantang River Estuary to the sea area in southern Jiangsu, and the flow direction was transferred from SE to N. In the Yangtze River Estuary and Qiantang River Estuary, the coastal water level rise was more than 2 m, and the flow direction of velocity was W. There was no significant rise in the coastal water level in southern and central Jiangsu and Quanzhou, Fujian. The flow direction in southern Jiangsu was NW, and that in Quanzhou was NE. The water increase was enormous in the Yangtze River Estuary and Quanzhou, Fujian, where the coastal water level rose by more than 4 m. The affected center shifted from the Qiantang River Estuary to the southern nearshore area of Jiangsu Province as the typhoon moved northwestward and made landfall. In contrast, the storm surge in the southern part of Jiangsu Province and Quanzhou, Fujian, decreased to less than 1 m due to the greater distance from the typhoon center. This demonstrates a pronounced spatial distribution change in storm surges associated with the typhoon’s path, consistent with previous research (Sun et al., 2018) [
23].
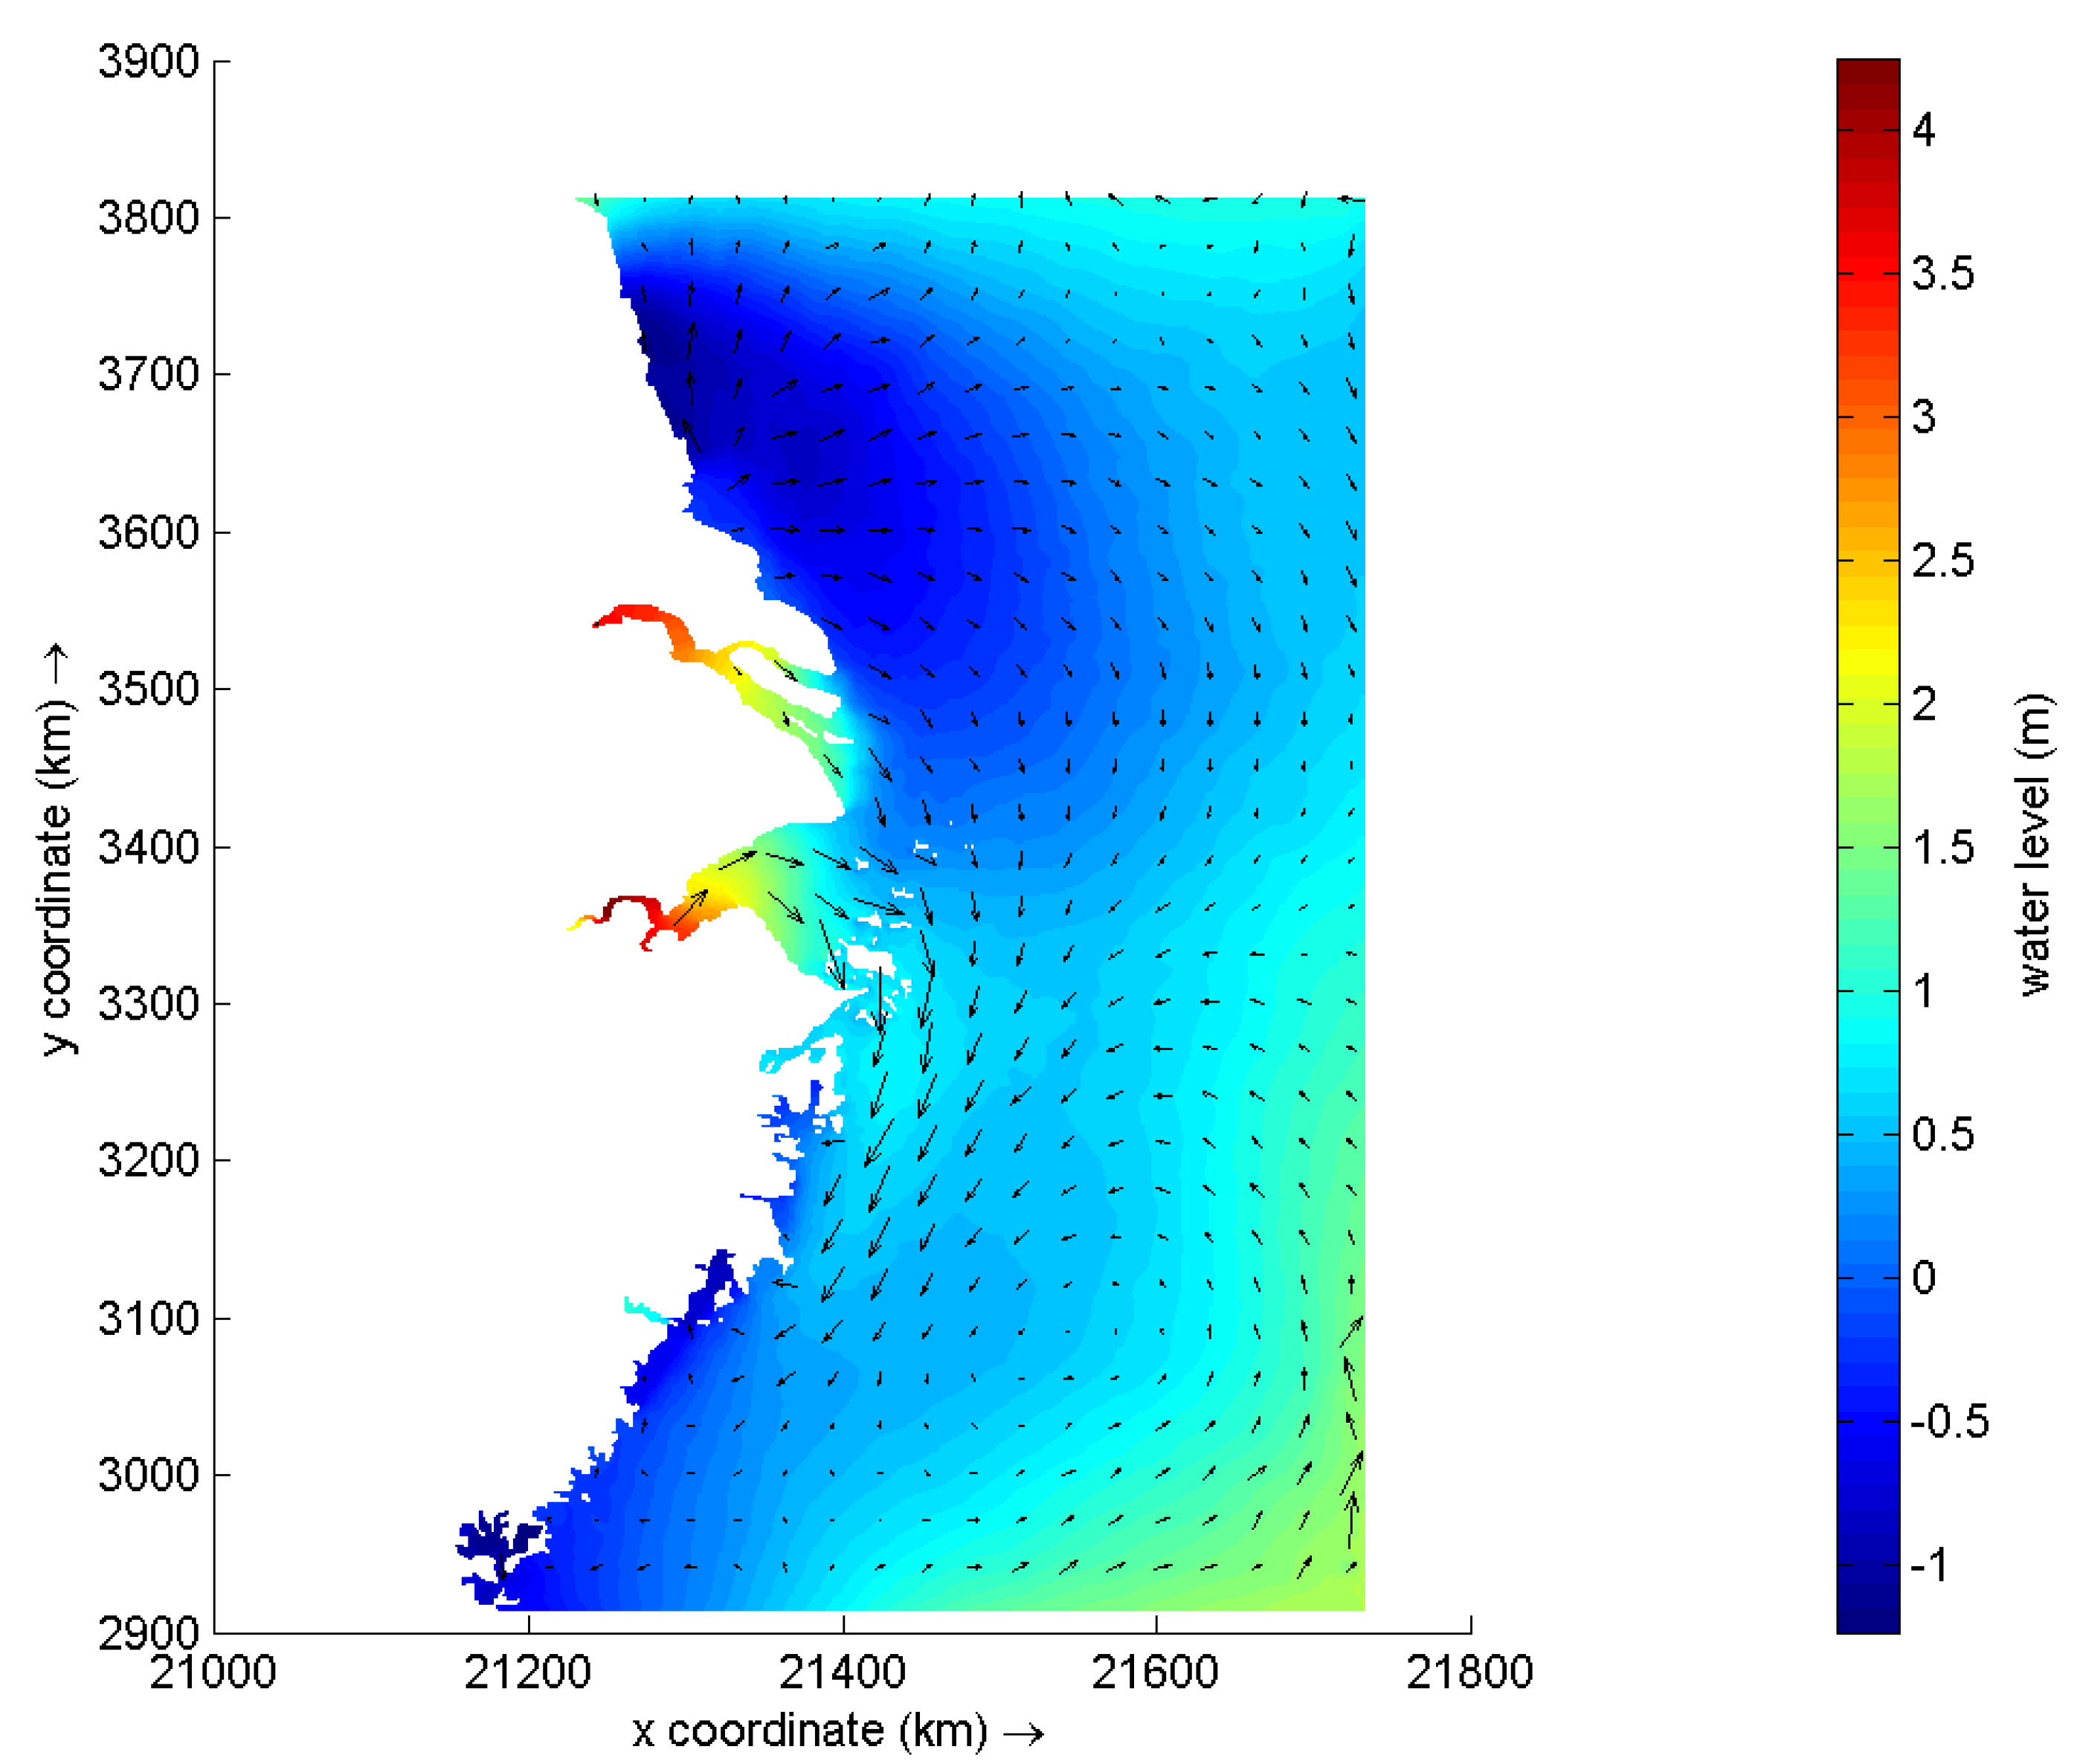
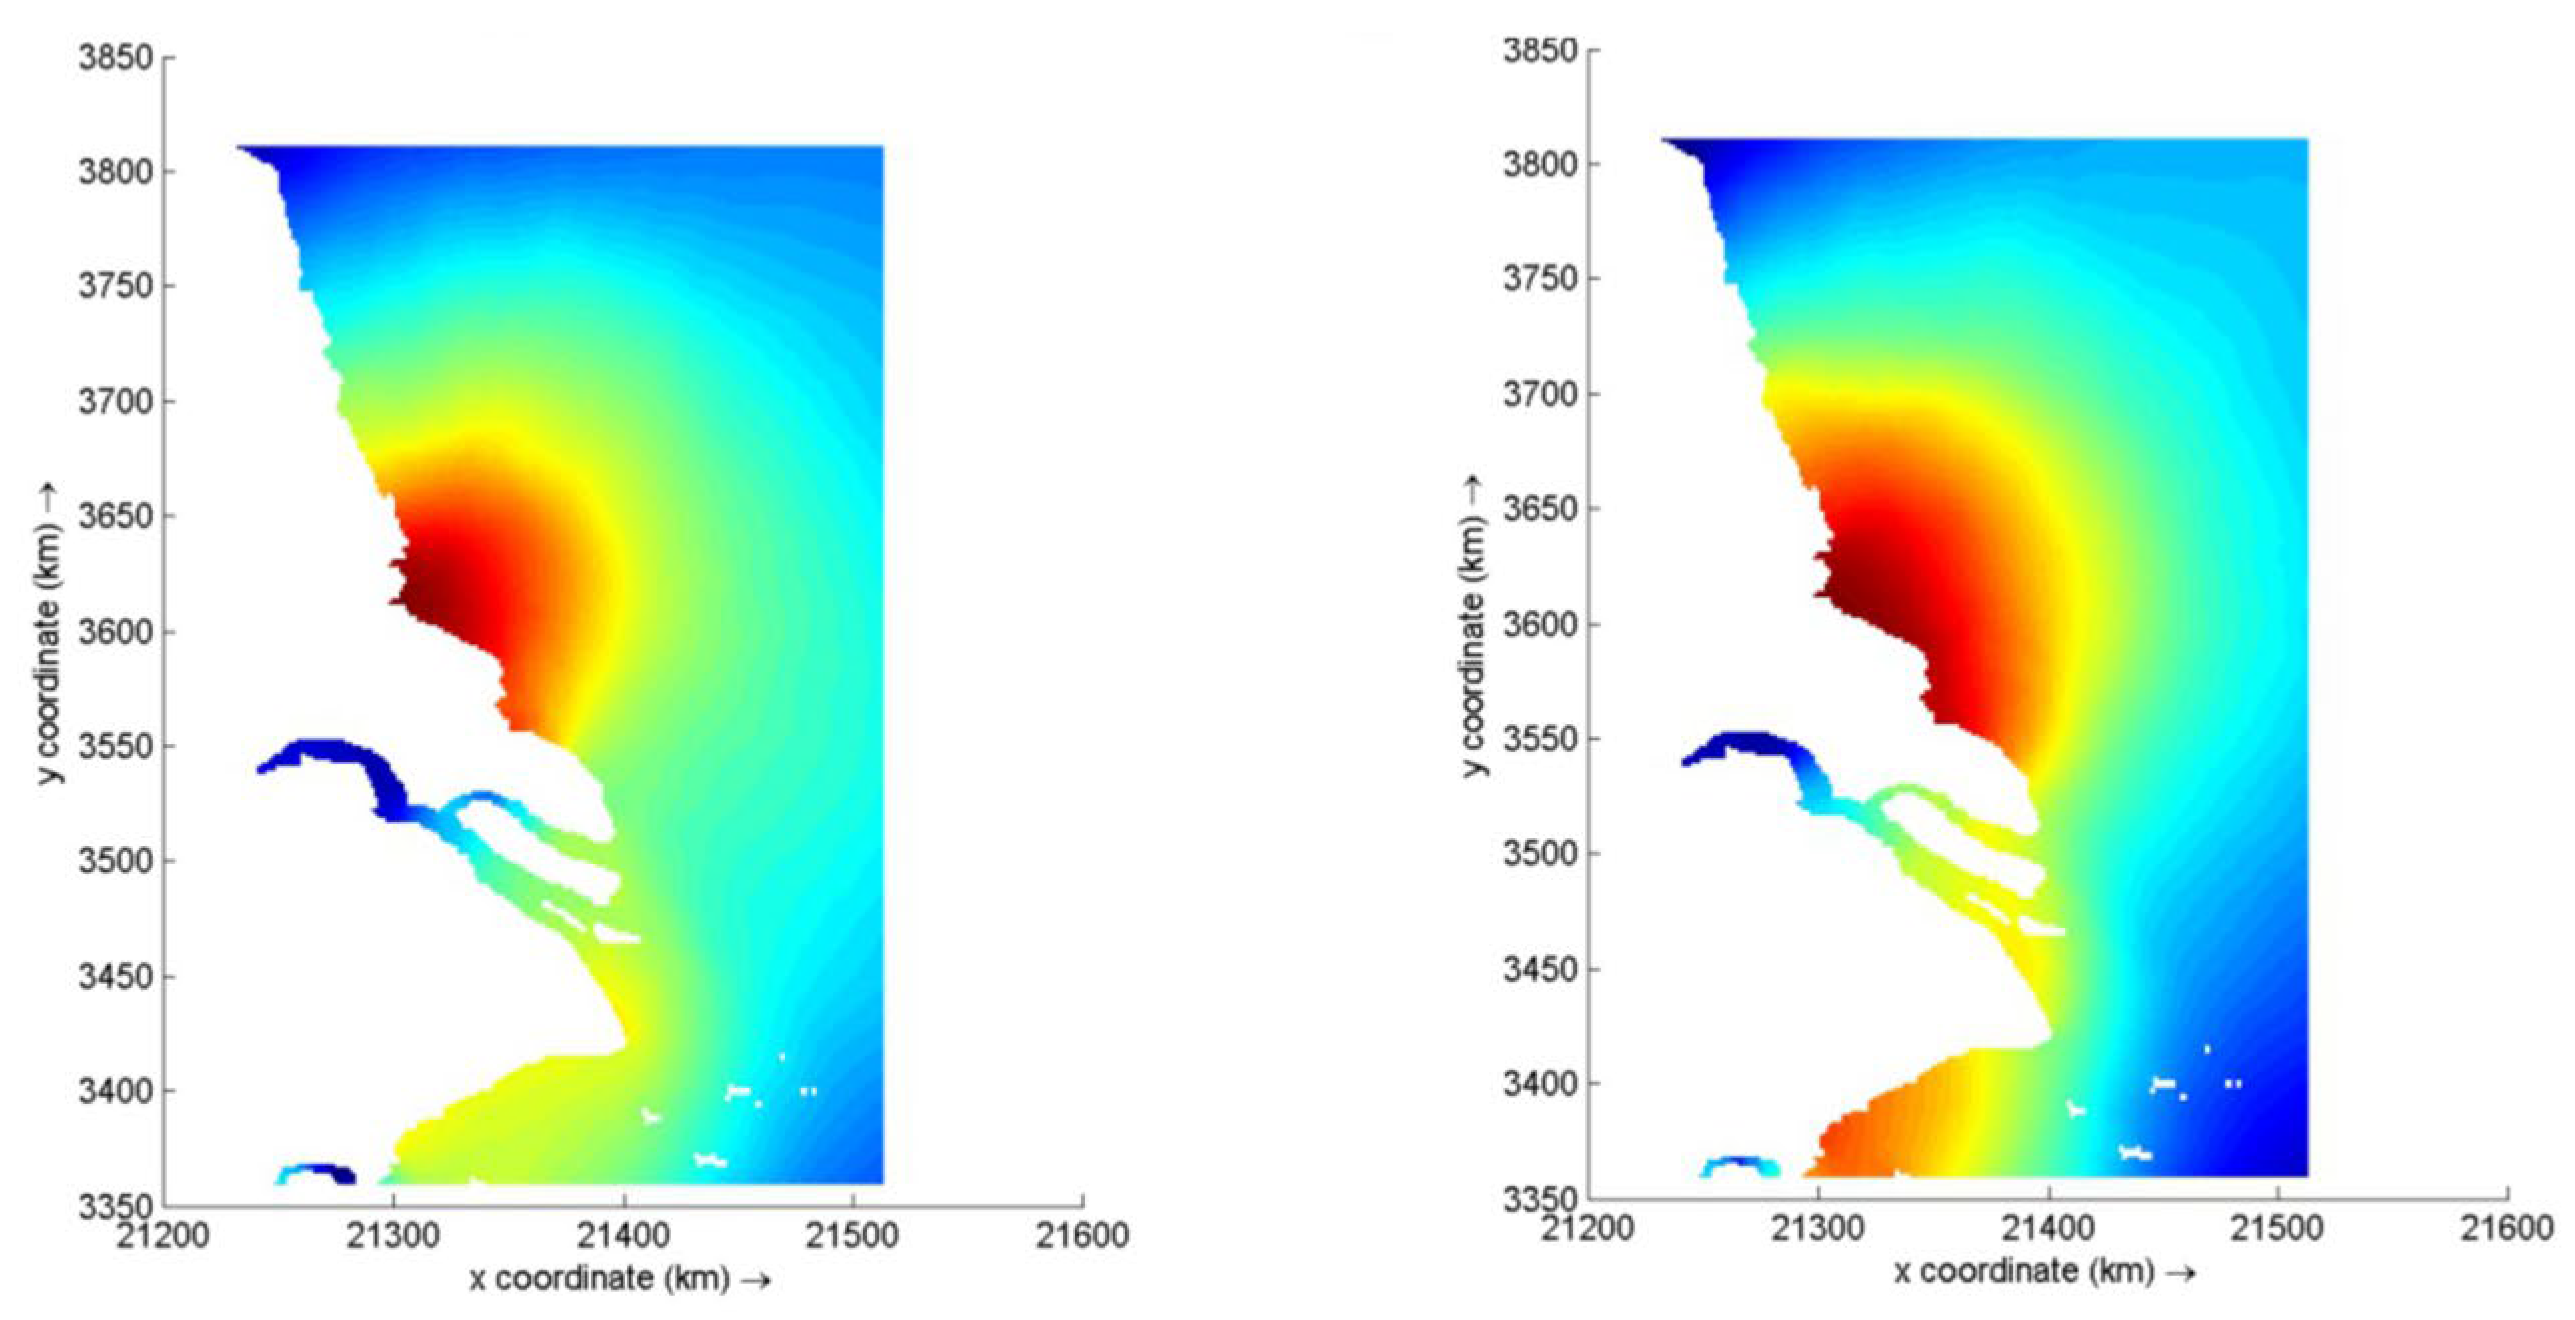
In
Figure 12, we observe that at the low tide level at Daishan station, the typhoon had a limited impact, affecting only some sea areas in the eastern Hainan and Southern Yellow Sea. In the Quanzhou Sea area, the water level increased to 5 m with a flow direction of northeast. The extreme water level rise in southern Jiangsu ranged from 0 to 3 m with a flow direction of southeast. Conversely, we observed no significant changes in the extreme water level in the Yangtze River Estuary and Qiantang Estuary area. The impact of the typhoon was limited, mainly concentrated in the eastern part of Hainan and the southern Yellow Sea adjacent to the landing area. The storm surge in Quanzhou, Fujian, rose sharply, which may be attributed to the tidal–storm surge resonance amplification effect caused by the port topography of Quanzhou Bay.
As depicted in
Figure 13, the impact of the typhoon was limited to the Yangtze River and Qiantang Estuary area, with the extreme water level ranging from 0 to 4.2 m. The flow direction in this region shifted from west to east. Conversely, there was no notable increase in the coastal water level in southern and central Jiangsu and Quanzhou, Fujian. In southern Jiangsu, the flow direction was westward. Similar to Quanzhou Bay, the river mouth topography acts as a constraint and intensifies the storm surge (Jeong et al., 2023) [
22]. In contrast, the impact was limited in the southern part of Jiangsu Province and Quanzhou, Fujian, indicating that these areas mainly experienced storm surges during the typhoon’s approach and had a lesser impact after the passage. This highlights the transient nature of storm surge hazards, dependent on the typhoon’s relative position to the nearshore region.
As shown in
Figure 13, only the Yangtze River and Qiantang Estuary area were affected by the typhoon. The extreme water level rise was between 0 and 4.5 m. The flow direction in this area deflected from W to E. There was no significant rise in the coastal water level in southern and central Jiangsu and Quanzhou, Fujian. The flow direction in southern Jiangsu was W. The rivermouth regions appeared to be more susceptible to storm surge disturbances due to their concave-shaped coastlines.
Jiangsu Province, with a coastline of 945 km long, was most seriously affected by the storm surge. In Typhoon In-fa (2021), taking the south of Jiangsu as an example, the typhoon process exceeded the warning water level, as shown in
Figure 15 and
Figure 16. The exceeding time process was located from 15:00 on 24 July to 16:00 on 24 July 2021 and from 4:00 on 25 July to 5:00 on 25 July 2021. Typhoon In-fa (2021) affected the southern region of Jiangsu Province for 3 days, and the maximum water increase lasted for 2 h at a time.
During the storm surge of Typhoon In-fa (2021), the variation range of the water level was up to 5 m, with the gradient roughly uniform. The water increase gradient varied substantially within a certain range from the typhoon center. What is more, the area of water increase was smaller than that of water decrease, and the water increase gradient was larger than that of water decrease gradient during the typhoon period. There was some water reduction after the water increase. Kelin Hu et al. conducted a numerical analysis of the impact of levee openings on storm surge in coastal Louisiana [
24]. They found that levee openings can effectively reduce storm surges in adjacent basins. The levee openings can inform coastal management strategies in the East China Sea; by analyzing the results, coastal managers can assess the potential impacts of levee breaches on storm surge levels and plan accordingly. This information can guide the design and construction of levee systems, ensuring that they are resilient and capable of withstanding storm surge events. In addition, the stormwater increased dramatically in front of the typhoon, and the water reduction phenomenon occurred after it; that is, the water reduction phenomenon generally occurred behind the typhoon. The stormwater increment in the southern sea area of Jiangsu and the Yangtze River Estuary changed most violently, followed by the central sea area, and the northern sea area had the least impact, which means special attention should be paid to the southern sea area of Jiangsu for disaster reduction due to storm surges, and it is also necessary to consider the impact of storm surges in the design of marine buildings.


