Abstract
The design of artificial reefs must be based on the criteria of both durability and serviceability. In this respect, the seabed subsidence rate related to the weight of the reefs and of their foundation system should be limited. The horizontal drift of the reefs during their life should be small too. In this study, pertaining to the behavior of artificial reefs made of microsilica concrete and realized with foundations in bamboo near the international airport of Hong Kong, 1-year monitoring data and calculations of reef foundation settlements are shown and discussed to assess the performance of the adopted mixed foundation and to deduce the nature of the long-term subsidence. The subsidence related to the settlements of the foundations was monitored using a Multibeam Echo Sounder System. It was found that the observed subsidence rate cannot be justified by the primary consolidation of the soils forming the seabed. Indeed, secondary consolidation seems to play an important role. Overall, after one year of service, the artificial reefs are considered to be effective in terms of limitation of both subsidence and drift.
1. Introduction: The Engineering and Environmental Problem
Durability and serviceability are two main goals for the designers of artificial reefs. Researchers from several fields have provided important contributions in recent decades to solve engineering problems, such as those based on hydrodynamic and structural models [1], to assist with the prediction of reef behavior over its planned life. The subsidence of an artificial reef is a crucial problem involving both ecological and economic aspects, being its serviceability related to target depth intervals, which must ensure that the resident organisms receive well-defined levels of light and oxygen. In this context, geotechnical modelling is the most important tool for the simulation of seabed subsidence scenarios.
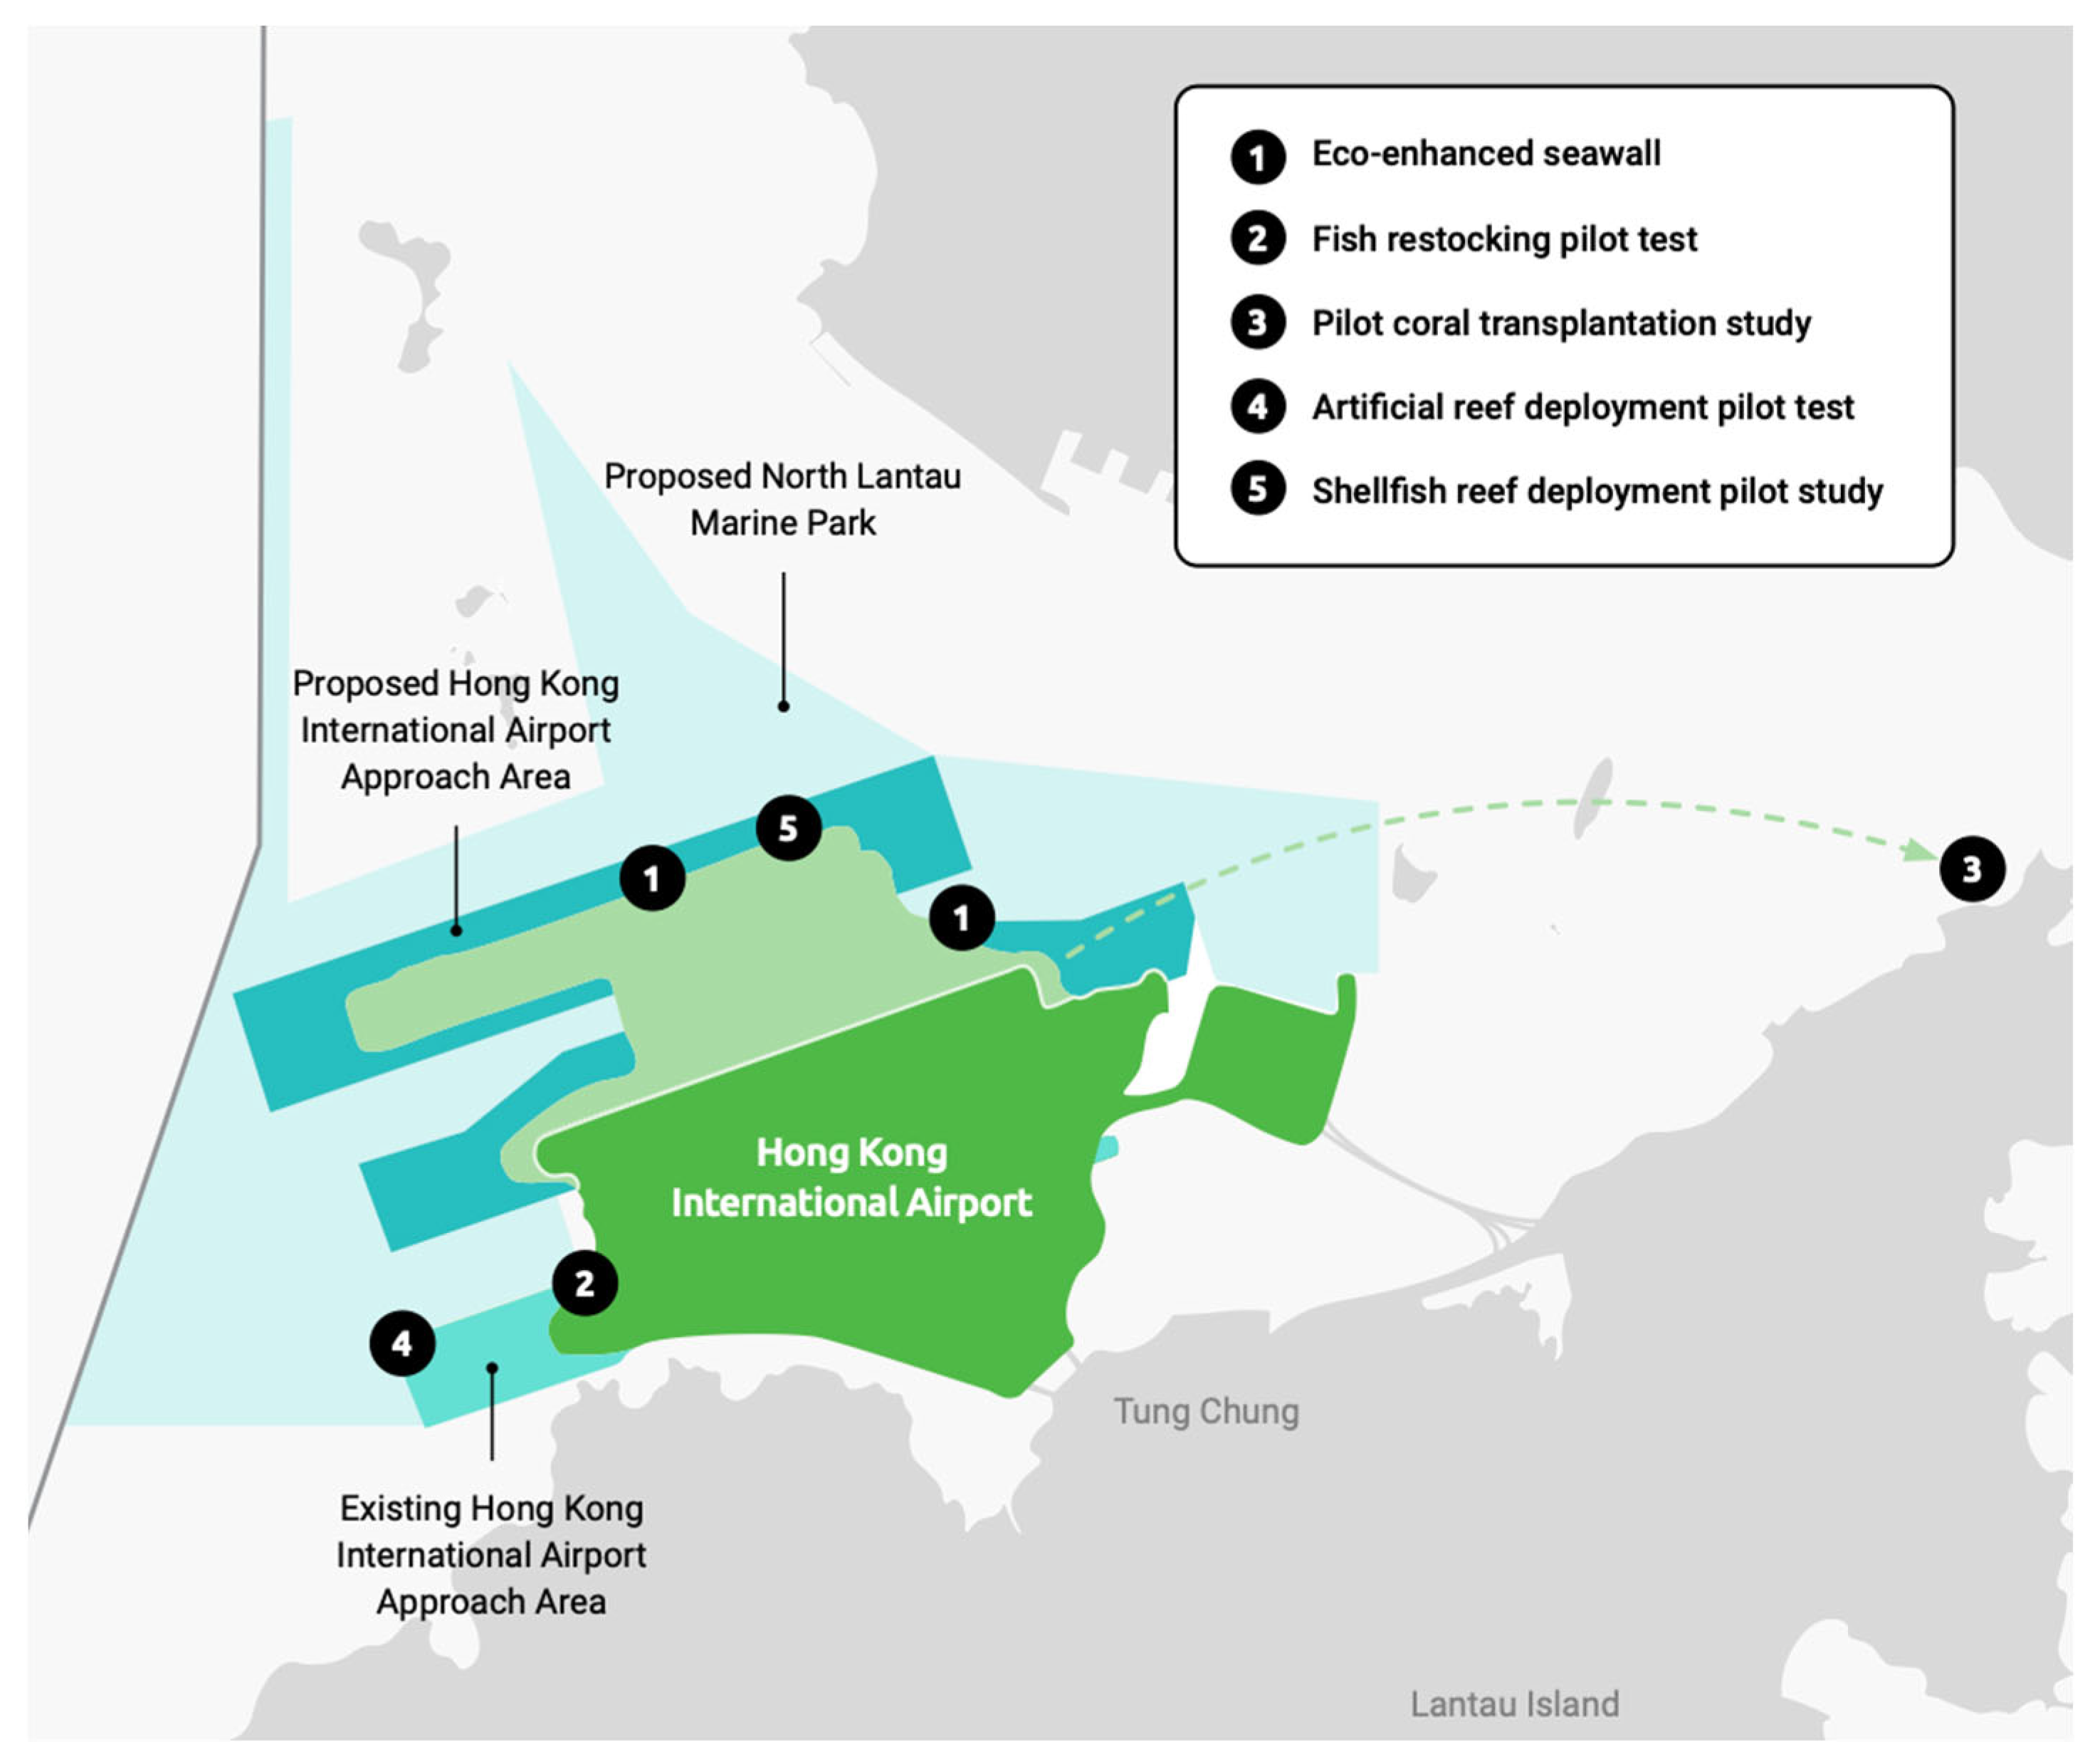
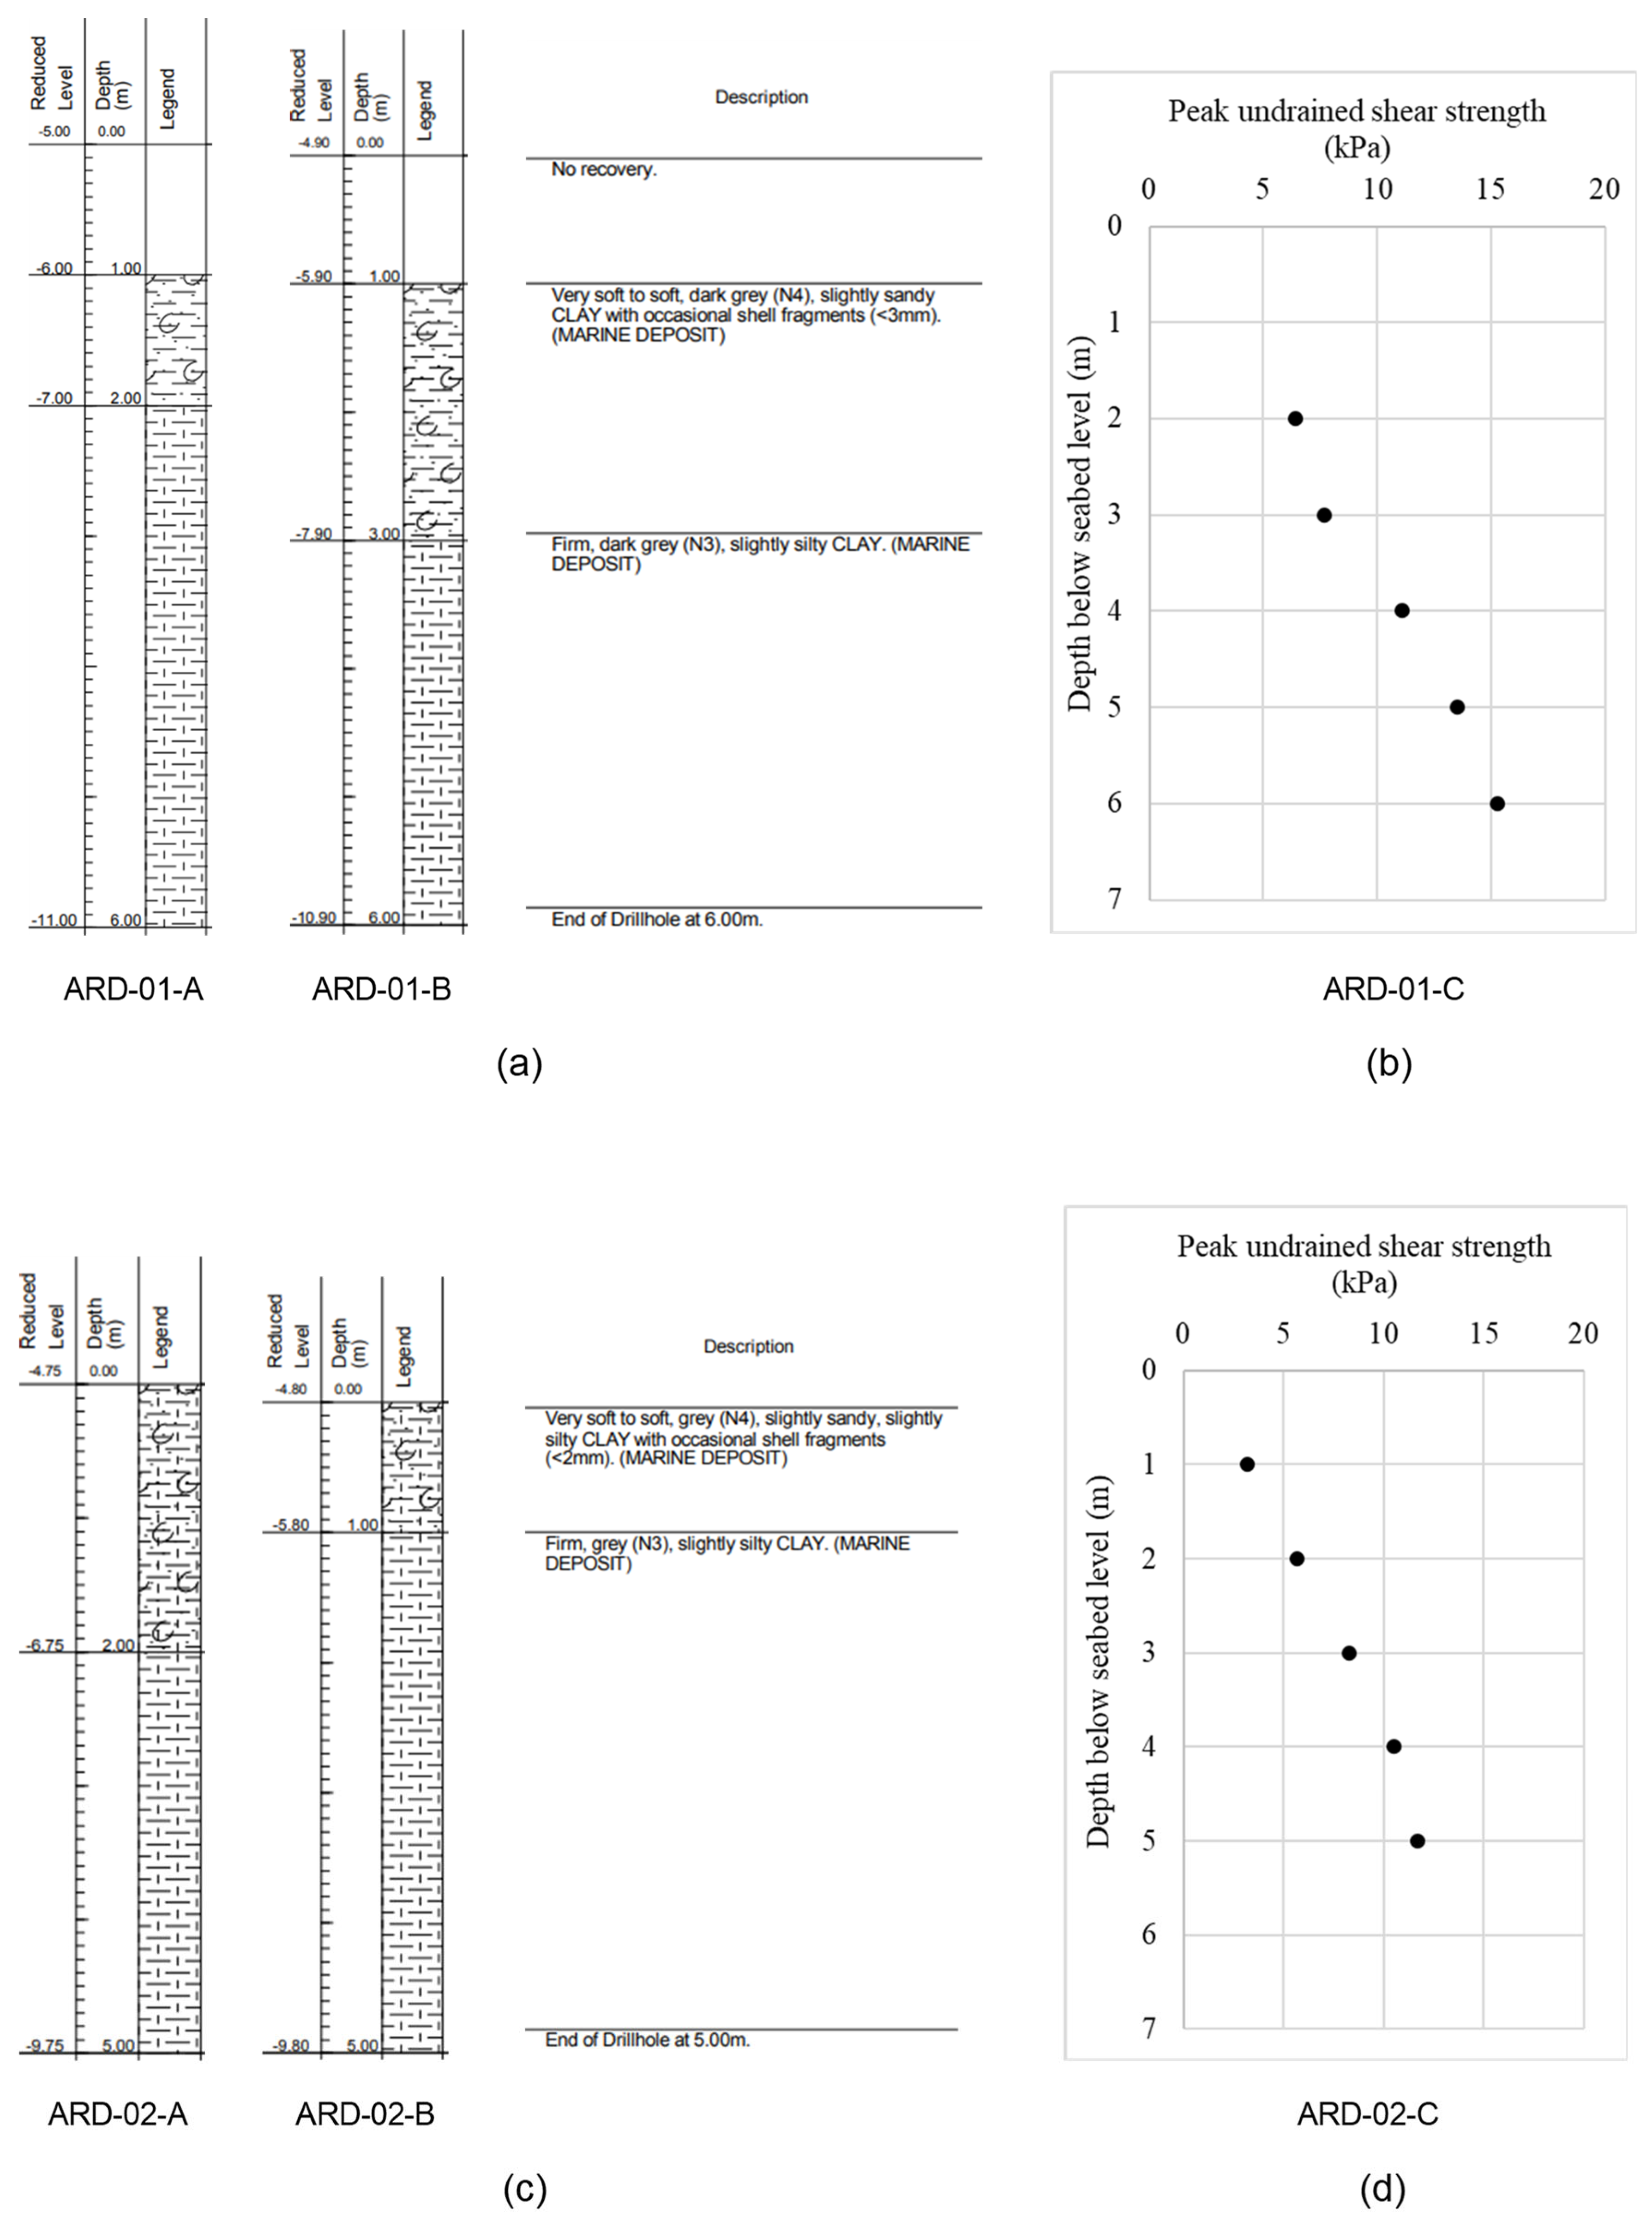
The Hong Kong International Airport (HKIA) Master Plan 2030 [2] revealed that the airport would reach a saturation point sometime between 2019 and 2022. A third runway was deemed essential, to be built on land reclaimed from the sea. The AA3214R project prompted calls from local green groups and residents to mitigate potential effects on marine wildlife—particularly the Chinese white dolphin—and noise impacts in the Pearl River Delta. The Airport Authority (AA) deployed 100 artificial reef (AR) units in the western waters of Hong Kong International Airport’s south runway (Figure 1) from mid-June to early July 2021. The ARs, placed near the future North Lantau Marine Park, serve as a pilot scheme to provide micro-marine habitats for enhancing the marine ecology and fishery resources [3]. In particular, the AR units were placed to develop a “fouling” community, including bivalves, sponges, tunicates, bryozoans, benthic algae and other associated organisms; to develop a complex habitat with numerous and varied refuges for predators, prey and/or foraging resources; and to promote the recruitment of adult and juvenile fish.
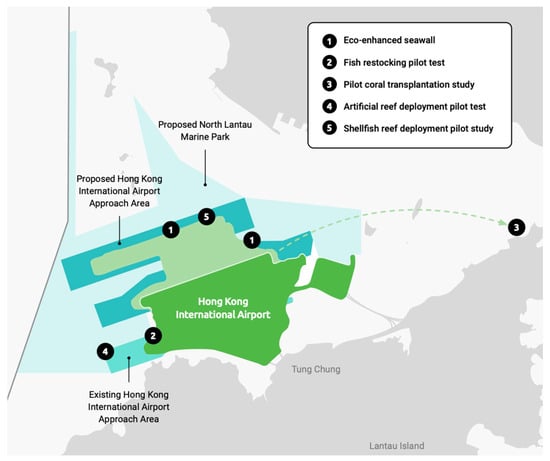
Figure 1.
Geographical and infrastructural context of the artificial reef pilot test.
As mentioned, durability in water is a factor conditioning the choice of the material used to realize reefs. However, the material should also be sustainable. Bamboo has been recently employed, for example in Malalayang Dua [4]. Waruwu [5] quantified the benefit of bearing capacity related to bamboo reinforcement in shallow foundations on peat soil. Looking specifically at the reef foundations, a further requirement is settlement limitation. Yun and Kim [6] found that ARs deployed on footings made of geogrid or hybrid geogrid–bamboo mat reduced their settlement remarkably. Yun and Kim [7,8] prepared three reinforcement types: geogrid, geogrid–bamboo mat (GBM) and seaweed-pile mat (SPM) and performed bearing capacity tests, large size settlement tests and two-dimensional flow scour tests according to the different soil types (sand, silt, clay). They observed that the bearing capacity of the seabed with a reinforced artificial reef increased, and its settlement and scour depth reduced for all reinforcement types.
Hedge and Sitharam [9] performed comparative studies on clay beds reinforced with bamboo and geosynthetics. They found that the ultimate bearing capacity of the clay bed reinforced with bamboo cell and the bamboo grid was 1.3 times more than that of the clay bed reinforced with geocell and geogrid. Furthermore, a substantial reduction in the footing settlement and surface deformation was observed. The bamboo was treated chemically to increase its durability. Although the performance of bamboo in terms of the tensile strength and load-carrying capacity of the clay bed was found to be reduced by 15–20% after the chemical treatment, the treated bamboo was characterized by a better performance than that of its geosynthetic counterparts.
In the present paper, the behavior of the reef foundations realized in bamboo at North Lantau, Hong Kong, has been studied. The results of a 1-year marine survey and of a Finite-Element (FE) numerical modelling are shown and discussed. The survey results provide evidence of the displacements, both horizontal and vertical, suffered by the adopted foundation units, allowing their performance to be assessed. The comparison between calculated and monitored settlements provides an indication on the nature of the long-term subsidence.
2. Design, Installation and Arrangements of the Foundation Units
Two AR unit types, Artificial Reef Type and Artificial Oyster Reef Type, indicated in the following sections as Type 1 and Type 2, respectively, were employed (design: Enrico Dini and Mario Nuzzolese, D-Shape). The same geometric pattern (Figure 2) was adopted for both AR units: toroidal-shaped concrete elements with holes of different diameters and placed at different heights perpendicular to the rotation axis. Each artificial reef unit measures either 900 mm (Type 1, “Large Unit”) or 520 mm (Type 2, “Small Unit”) in diameter and the corresponding masses are 180 kg and 56 kg, respectively.
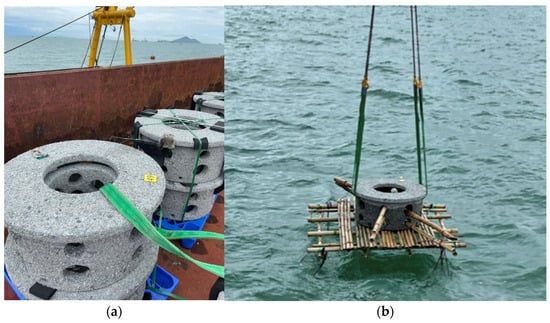
Figure 2.
AR units (a) stored on the ship; (b) descending into the sea (with foundation components).
The units are hollow and made of microsilica concrete, with Ordinary Portland Cement grade C45/20. A reinforcing metal mesh is integrated within the structure. Additionally, polymeric fibers are incorporated into the concrete matrix. The units have a rough surface to enhance marine growth and holes to mimic natural coral reefs. The project team also seeded live oysters on some of the units to further promote the settlement and growth of marine organisms. The concrete mix design is a custom-designed binder system that combines the mechanical properties required for marine infrastructure applications whilst providing suitable surface pH and substrate for species. Typically, conventional new concrete exhibits a pH level ranging from 12 to 13. However, due to the addition of Pulverized Fuel Ash, the final concrete mix can achieve a more neutral pH level of 9 to 10, which is more conducive to marine life. Over time, this pH level will gradually equilibrate with the average seawater pH of approximately 8.2, further enhancing the compatibility of the AR with its marine environment.
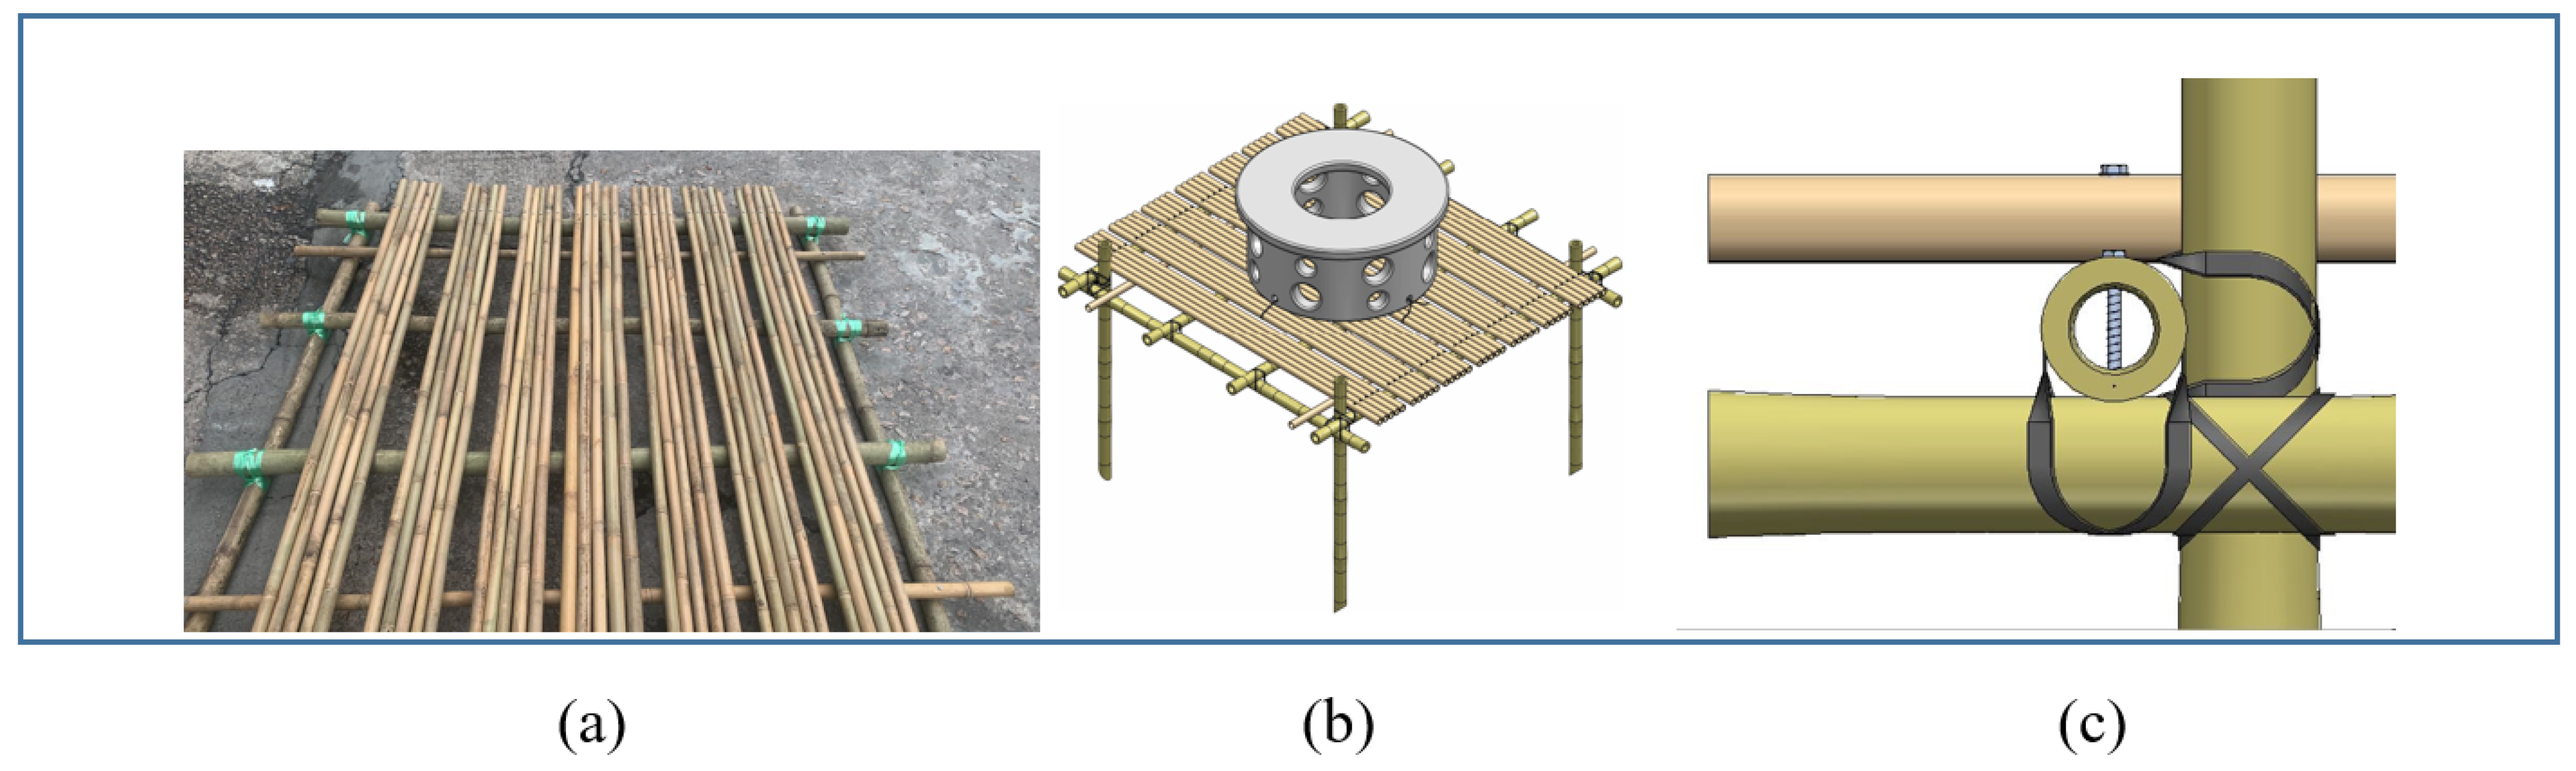
As the seabed in the western waters of Hong Kong International Airport is generally composed of soft mud, extra support was provided to the artificial reef by adding bamboo mats and footings underneath each unit (Figure 3). The mat for Unit Type 1 measures 1800 mm × 1800 mm. The frame and legs are composed of about 5 cm bamboo members. The mat is composed of seven equally spaced groups of about 1.9–2.5 cm bamboo members. The legs are 1200 mm long and fixed in the mud. The lower end of the legs is cut at 45° to facilitate the insertion. The function of these legs is to reduce both the settlements in the mud and the drift related to horizontal actions. At the time of installation, the lower surface of the mat of Unit Type 1 was not brought to the bottom, but a gap was left equal to the estimated initial settlement. The units are designed to withstand storms and water currents up to 2 m/s. Their foundations ensure suitable safety factors in terms of bearing capacity. For static vertical loads, the short-term analysis, even assuming a soil undrained strength of 3 kPa and considering only the contribution of the raft, i.e., without legs, gives a global safety factor of about 38; the long-term analysis gives a global safety factor of about 61.
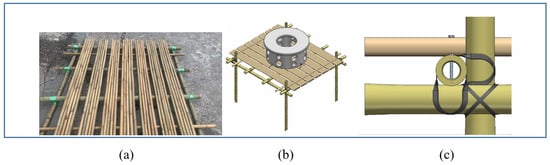
Figure 3.
Components of the AR Unit Type 1: (a) bamboo mat; (b) axonometric view of the unit on the mat with legs; (c) detail of fixing the bamboo members of the mat with wood screws.
The securement of the artificial reef (AR) to the mat was achieved through the utilization of heavy-duty cable ties, specifically measuring 9 mm in width and 750 mm in length. A minimum of four such cable ties were threaded through pre-drilled holes, each with a diameter of 25 mm, to firmly anchor the AR. Where structurally feasible, additional cable ties were employed, potentially increasing their number to six for augmented stability. The employment of four cable ties was deemed sufficient to prevent any significant displacement of the reef from its intended position on the bamboo mat.
The metal components utilized in the construction of the structure were composed of SS316 stainless steel. This grade of stainless steel is well-regarded for its corrosion resistance, particularly in marine environments.
The reefs’ location, with corresponding identification number, reported in Figure 4, was recorded one year after the deployment and is largely representative of the initial areal arrangement, since the horizontal drift over this period was found to be negligible for most units, as discussed later. Multibeam bathymetry surveys were performed every three months and a photographic report (see Figure 5) allowed us to check the structural integrity of the units, ties and mats. Although the subsidence was monitored for both Unit Types, in the following sections, the analysis is mainly focused on the Type 1 reefs, which experienced more intense subsidence.
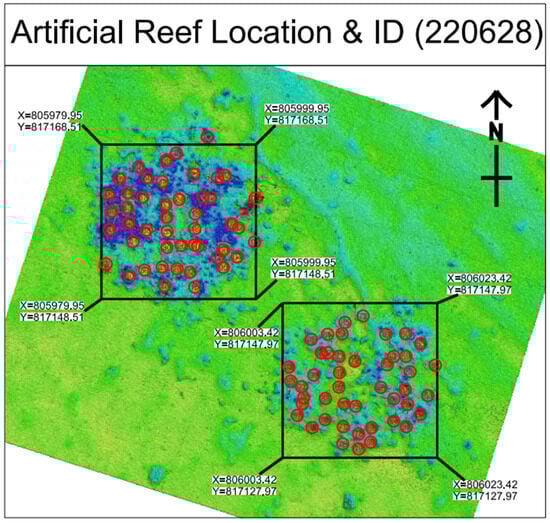
Figure 4.
Multibeam survey showing AR units’ location (1 year after deployment) and identification numbers (in the red circles). (Coordinate reference: Latitude of Origin 22°18′43.68″ N; Longitude of Origin 114°10′42.80″ E; Northing Coordinate of Origin 819,069.80 mN; Easting Coordinate of Origin 836,694.05 mE).

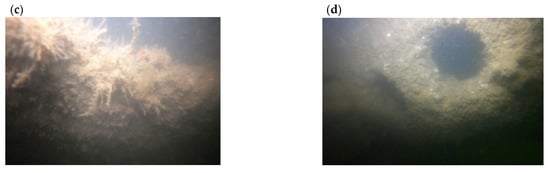
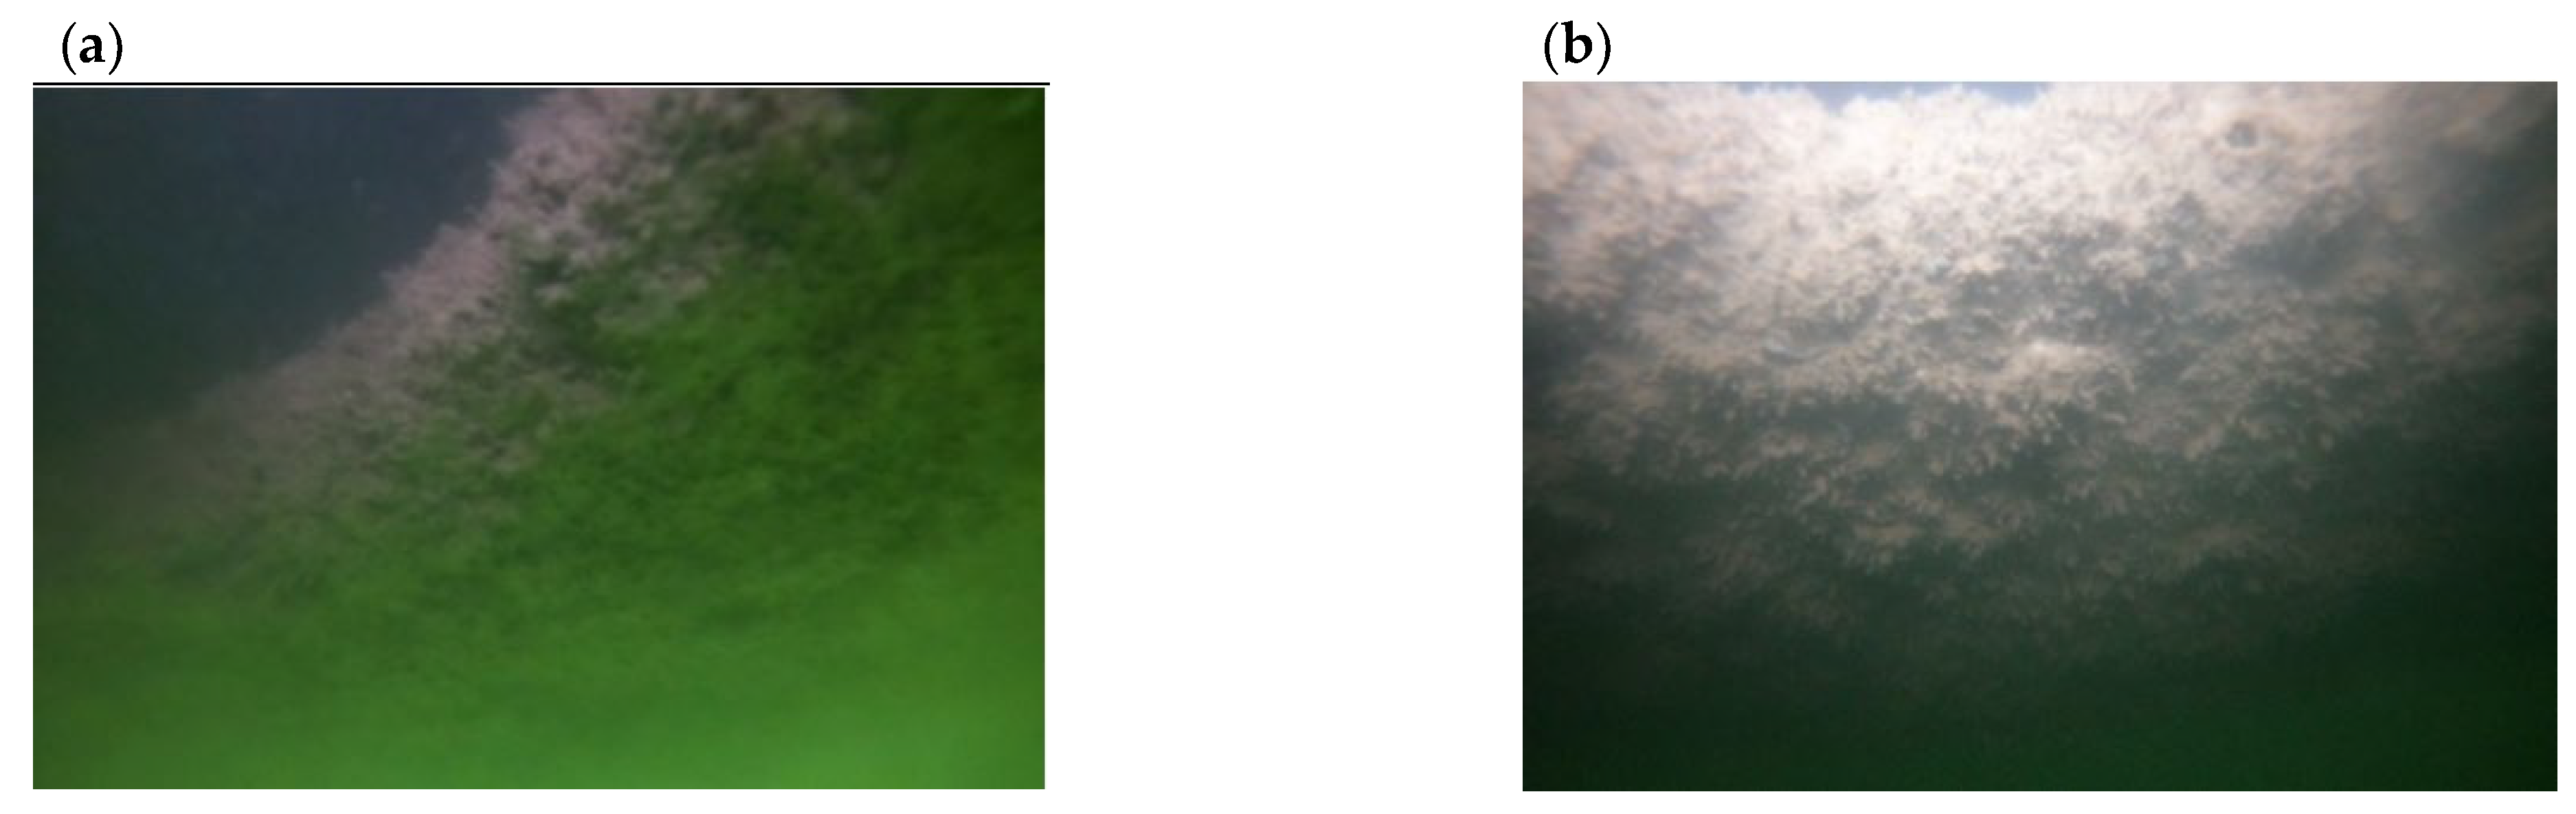
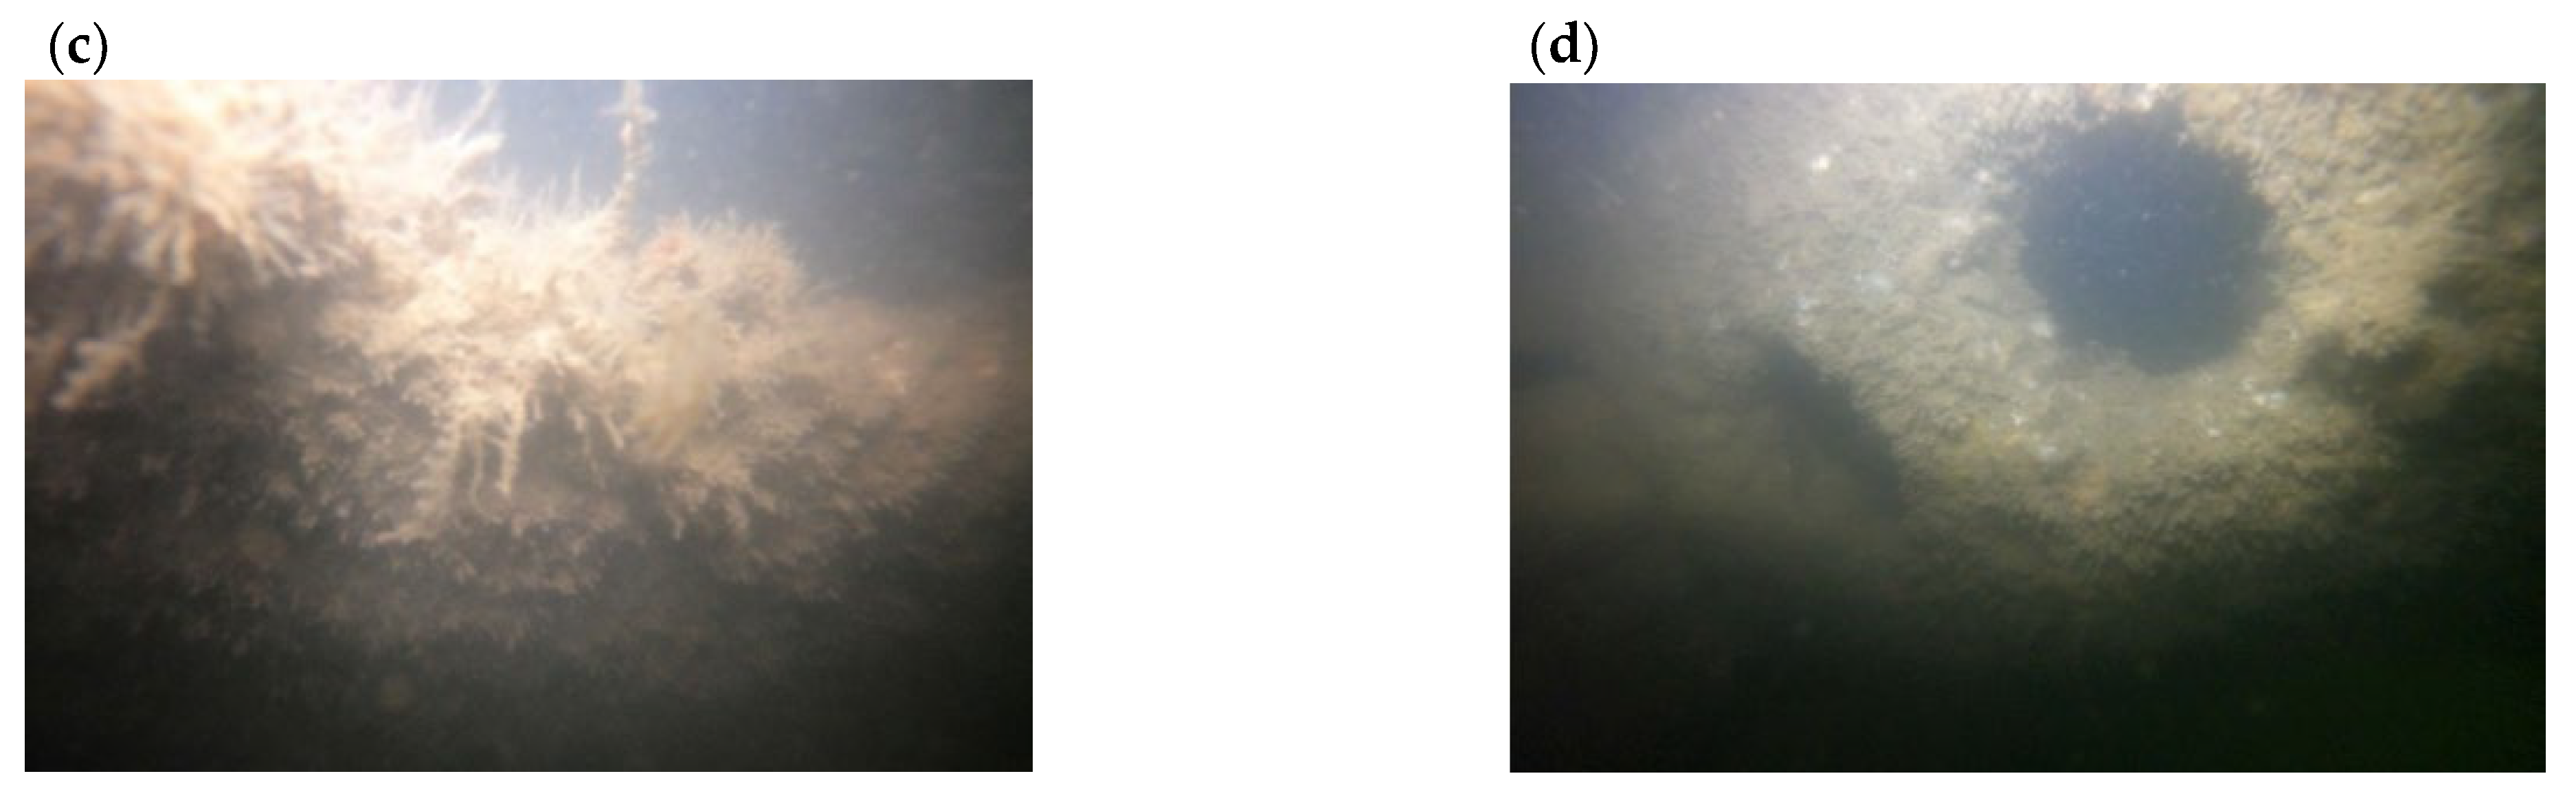
Figure 5.
Photos of some AR units on the seabed (taken on 18 January 2022): (a) Large Unit No. 14 (side view); (b) Large Unit No. 41 (top view); (c) Large Unit No. 43 (side view); (d) Small Unit No. 68 (side view). See also Figure 4 for the location of the numbered units.
3. Subsoil Characterization and Geotechnical Model
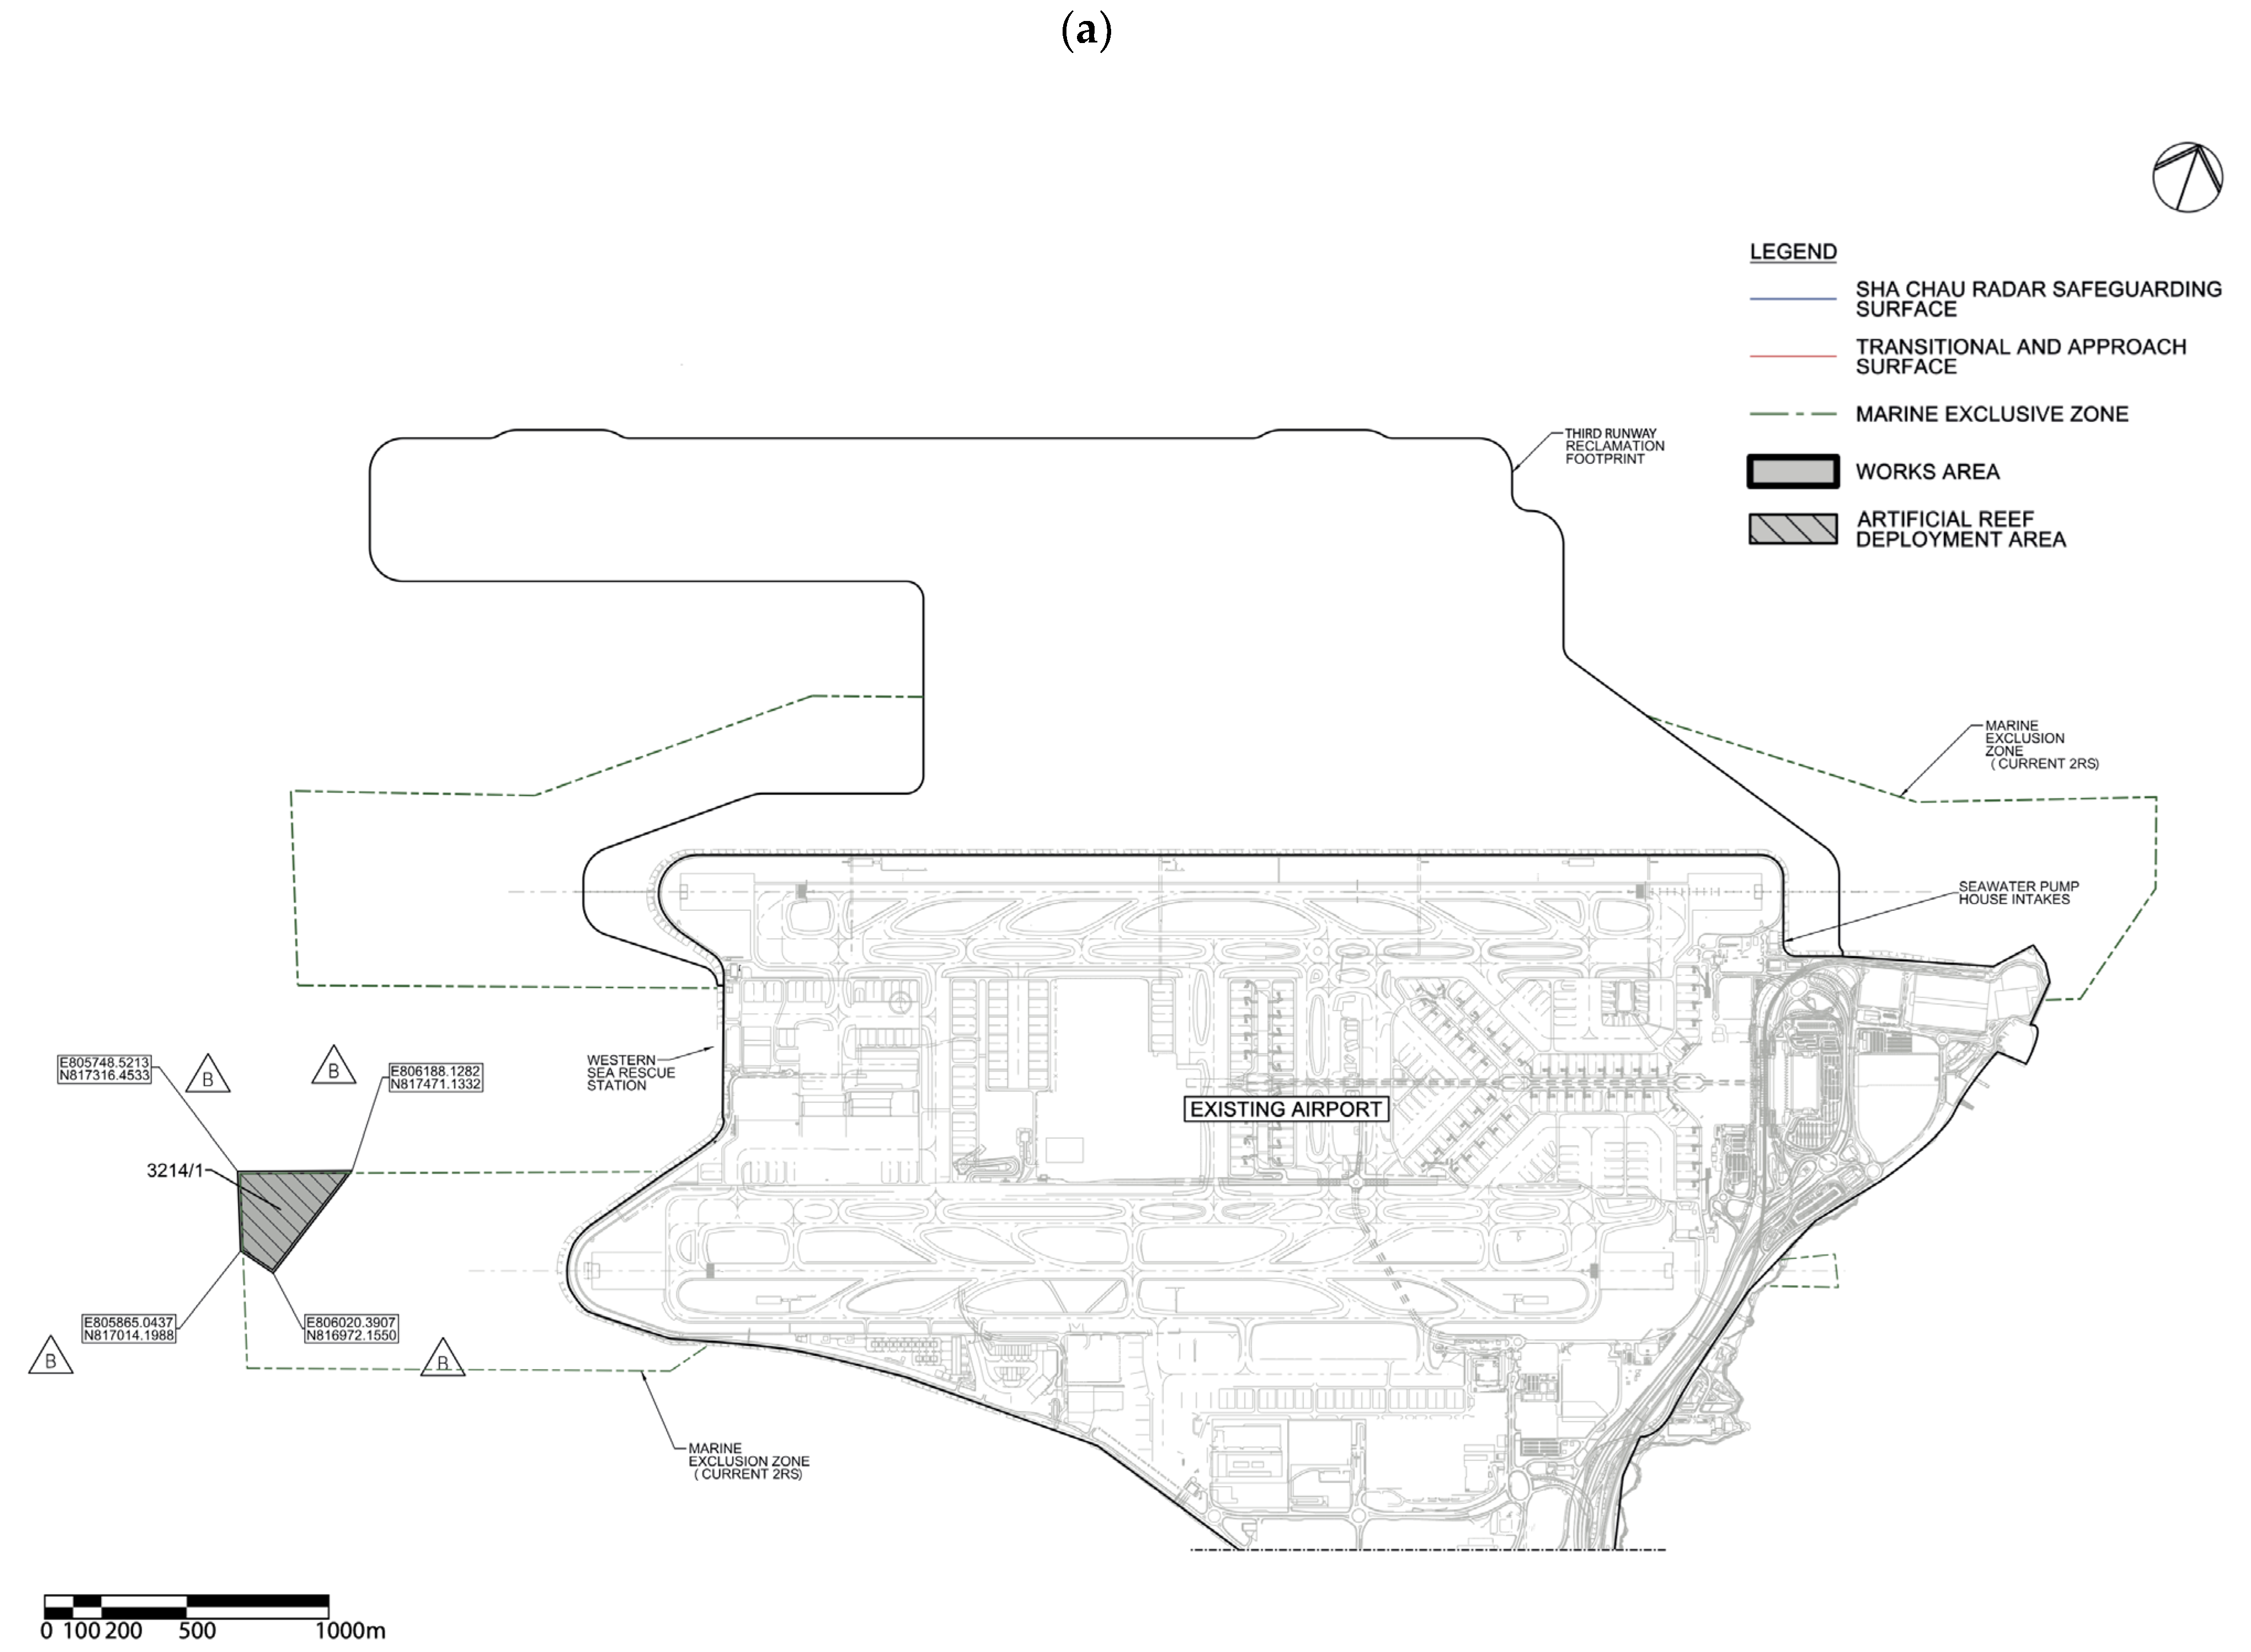
The stratigraphy information and undrained strength of the subsoil were obtained by making drillholes and vane shear test holes, whose location is reported in Figure 6a,b. Drillholes and vane tests pertain to two distinct subzones within the works area, indicated as ARD-01 (see detail B in Figure 6b) and ARD-02 (see detail C), respectively. The seabed in the works area is sub-horizontal, with some differences in level between ARD-01 and ARD-02, i.e., −4.90 ÷ −5.00 m and −4.75 ÷ −4.85 m, respectively, based on what was detected in correspondence of the holes.
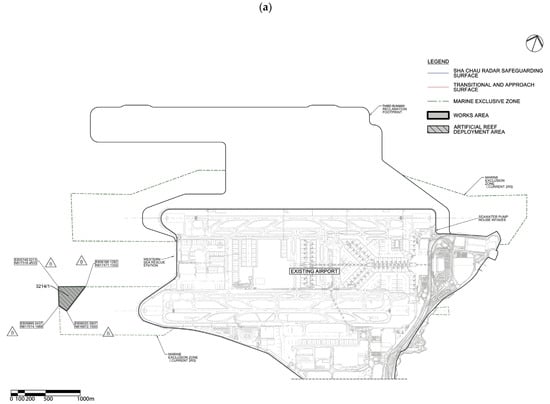
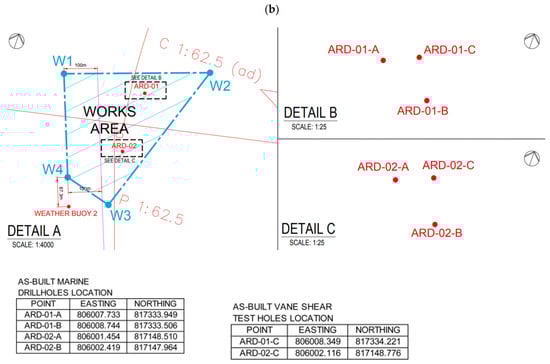
Figure 6.
(a) Location of the works area; (b) location of drillholes and vane shear test holes within the works area (the arrows point to the north).
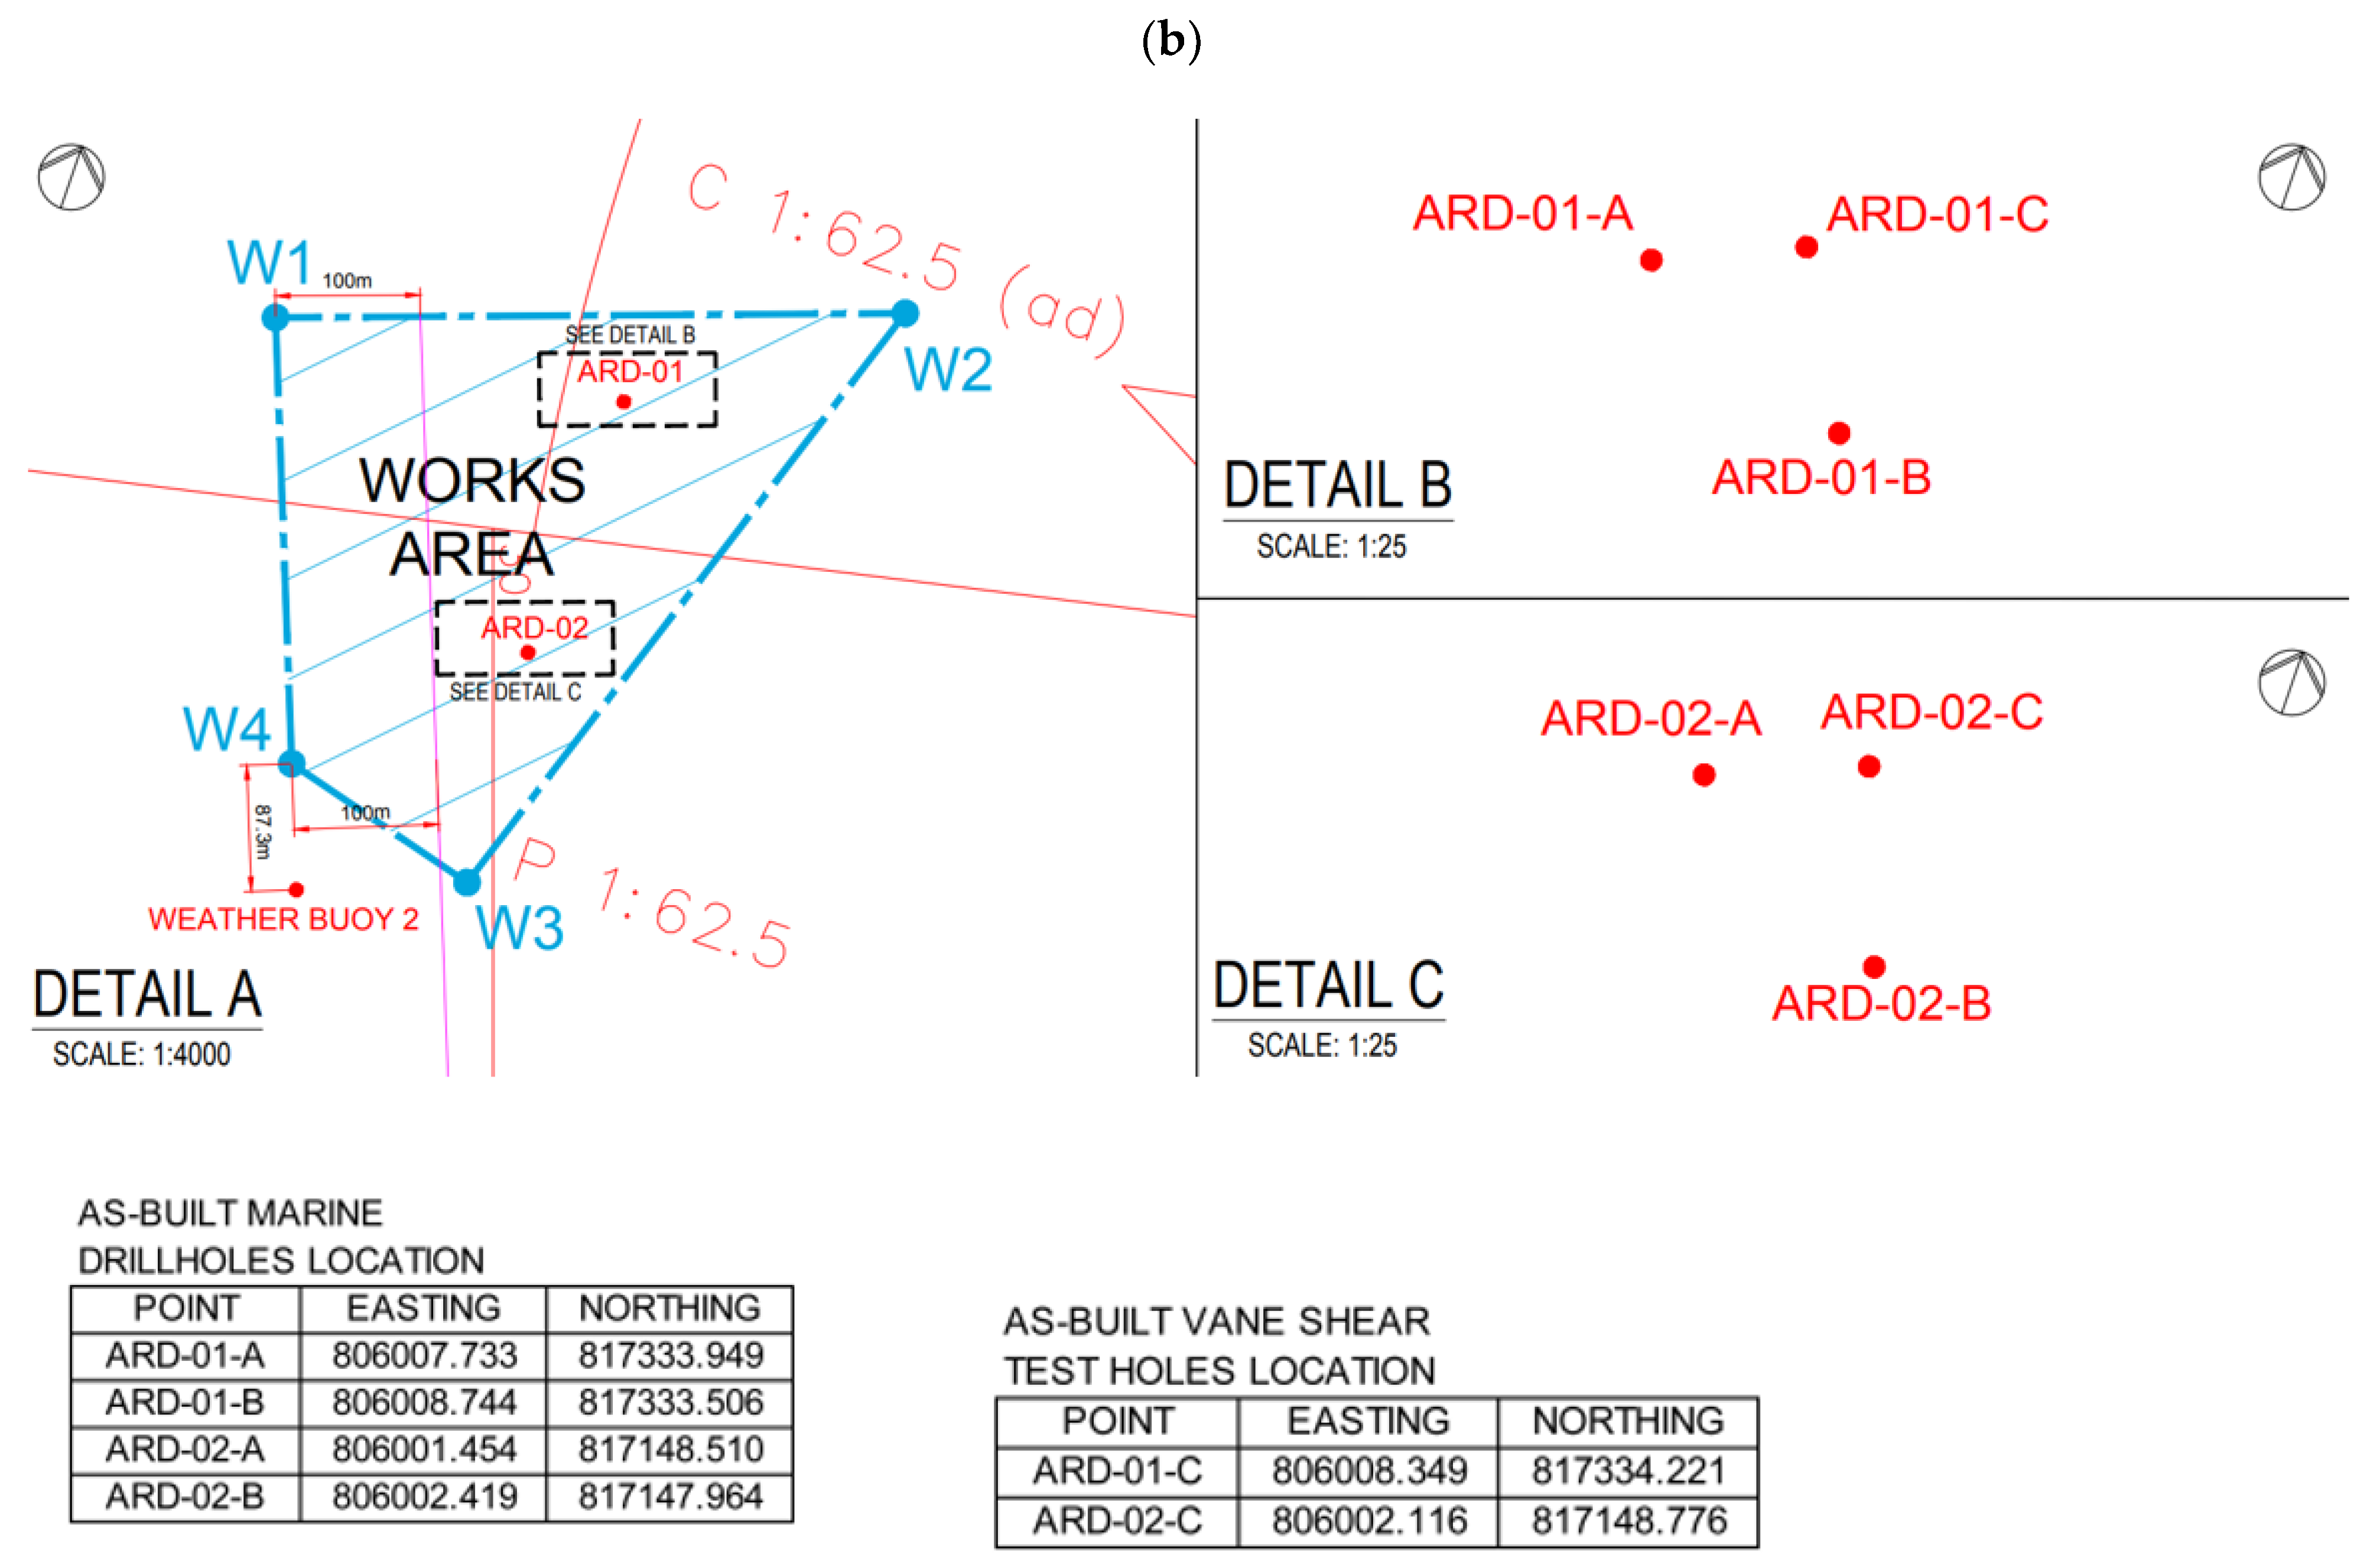
The resulting stratigraphy (Figure 7a,c) shows the presence of an upper layer made of very soft to soft, grey, slightly sandy, slightly silty clay, with occasional shell fragments of thickness varying from 1 to 2 m, and an underlying layer of firm, grey, slightly silty clay.
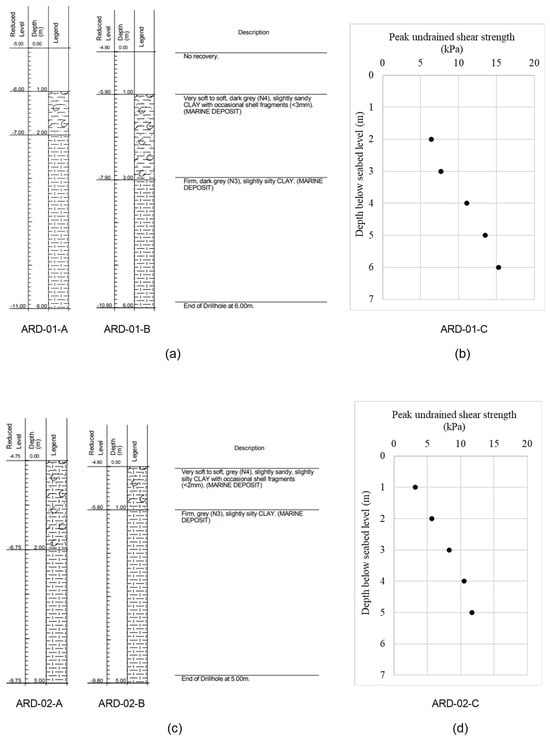
Figure 7.
Stratigraphy of the subzones ARD-01 (a) and ARD-02 (c) and corresponding undrained shear strength profiles (b,d). Level of the seabed: −5.00 m for ARD-01-A, −4.90 m for ARD-01-B, −5.00 m for ARD-01-C, −4.75 m for ARD-02-A, −4.80 m for ARD-02-B and −4.85 m for ARD-02-C.
When dealing with very-low-consistency marine soils, samples taken from the seabed may be easily disturbed, and so in situ measurements may be more reliable than those obtained by element testing in the laboratory. Nevertheless, attempts to experiment on seabed samples have been made by researchers. For example, Cotecchia et al. [10] carried out oedometer and triaxial tests on soft marine sediments of Mar Piccolo (Taranto, Ionian Sea, Italy). This study has been of reference to assume some geotechnical parameters of the soils investigated in the present paper (Table 1), based on granulometric and undrained shear strength similarities. The profiles of the peak undrained shear strength (Figure 7b,d), as measured by the vane shear test along two verticals (ARD-01-C and ARD-02-C, Figure 6), are consistent with what is expected for normally consolidated soils. Based on the stratigraphy, in the geotechnical model two distinct layers have been considered: a 2 m upper layer of very soft to soft clay, where the foundations of the reef units are located, and a lower layer, quite different both in terms of consistency and in terms of sandy and silty fractions.

Table 1.
Geotechnical model assumed for the calculation, based on data from [10,11] pertaining to similar soil (except for values with apex).
4. Monitoring of the Seabed Subsidence over the First Year
The subsidence related to the settlements of the foundations over the entire area was monitored using a Multibeam Echo Sounder System (by Engineering Surveys Limited, Hong Kong, China). The depth measurements refer to the Hong Kong Principal Datum. Cross lines were run to verify the quality of the survey data. The monitoring campaign consisted of six surveys, carried out on the following dates: 30 April 2021, 9 July 2021, 5 October 2021, 4 January 2022, 2 April 2022 and 28 June 2022. The zero reading (date: 30 April 2021, Figure 8) was of reference to assess the rate of bathymetric changes related only to the sedimentation: looking at the survey performed on 9 July 2021 (Figure 9), the average depth of the seabed in area surrounding the reefs seems to be increased, compared to that of the zero reading, by about 10 cm. Some changes in the bathymetry during the year were expected since the Pearl River estuary is dominated by sedimentary accretion. The 2021 July survey was considered to represent, approximately for all units, the initial conditions soon after deployment, which began on 7 June and ended on 11 July of the same year. It is reasonable that the results of this survey are indicative mainly of the immediate settlement and, eventually, of an amount of primary consolidation of the soil. As already mentioned, this study focused on the area of the AR Large Units.

Figure 8.
Pre-deployment bathymetric survey (date: 30 April 2021) (mPD: meters above the Hong Kong Principal Datum).
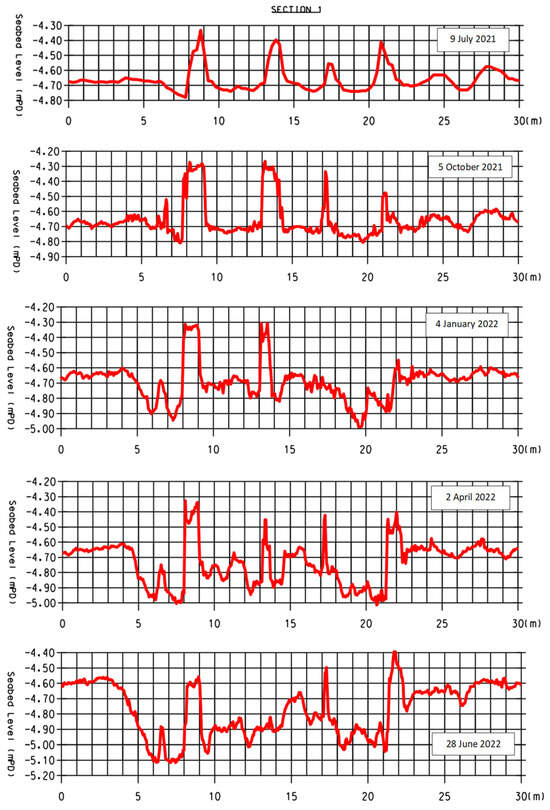
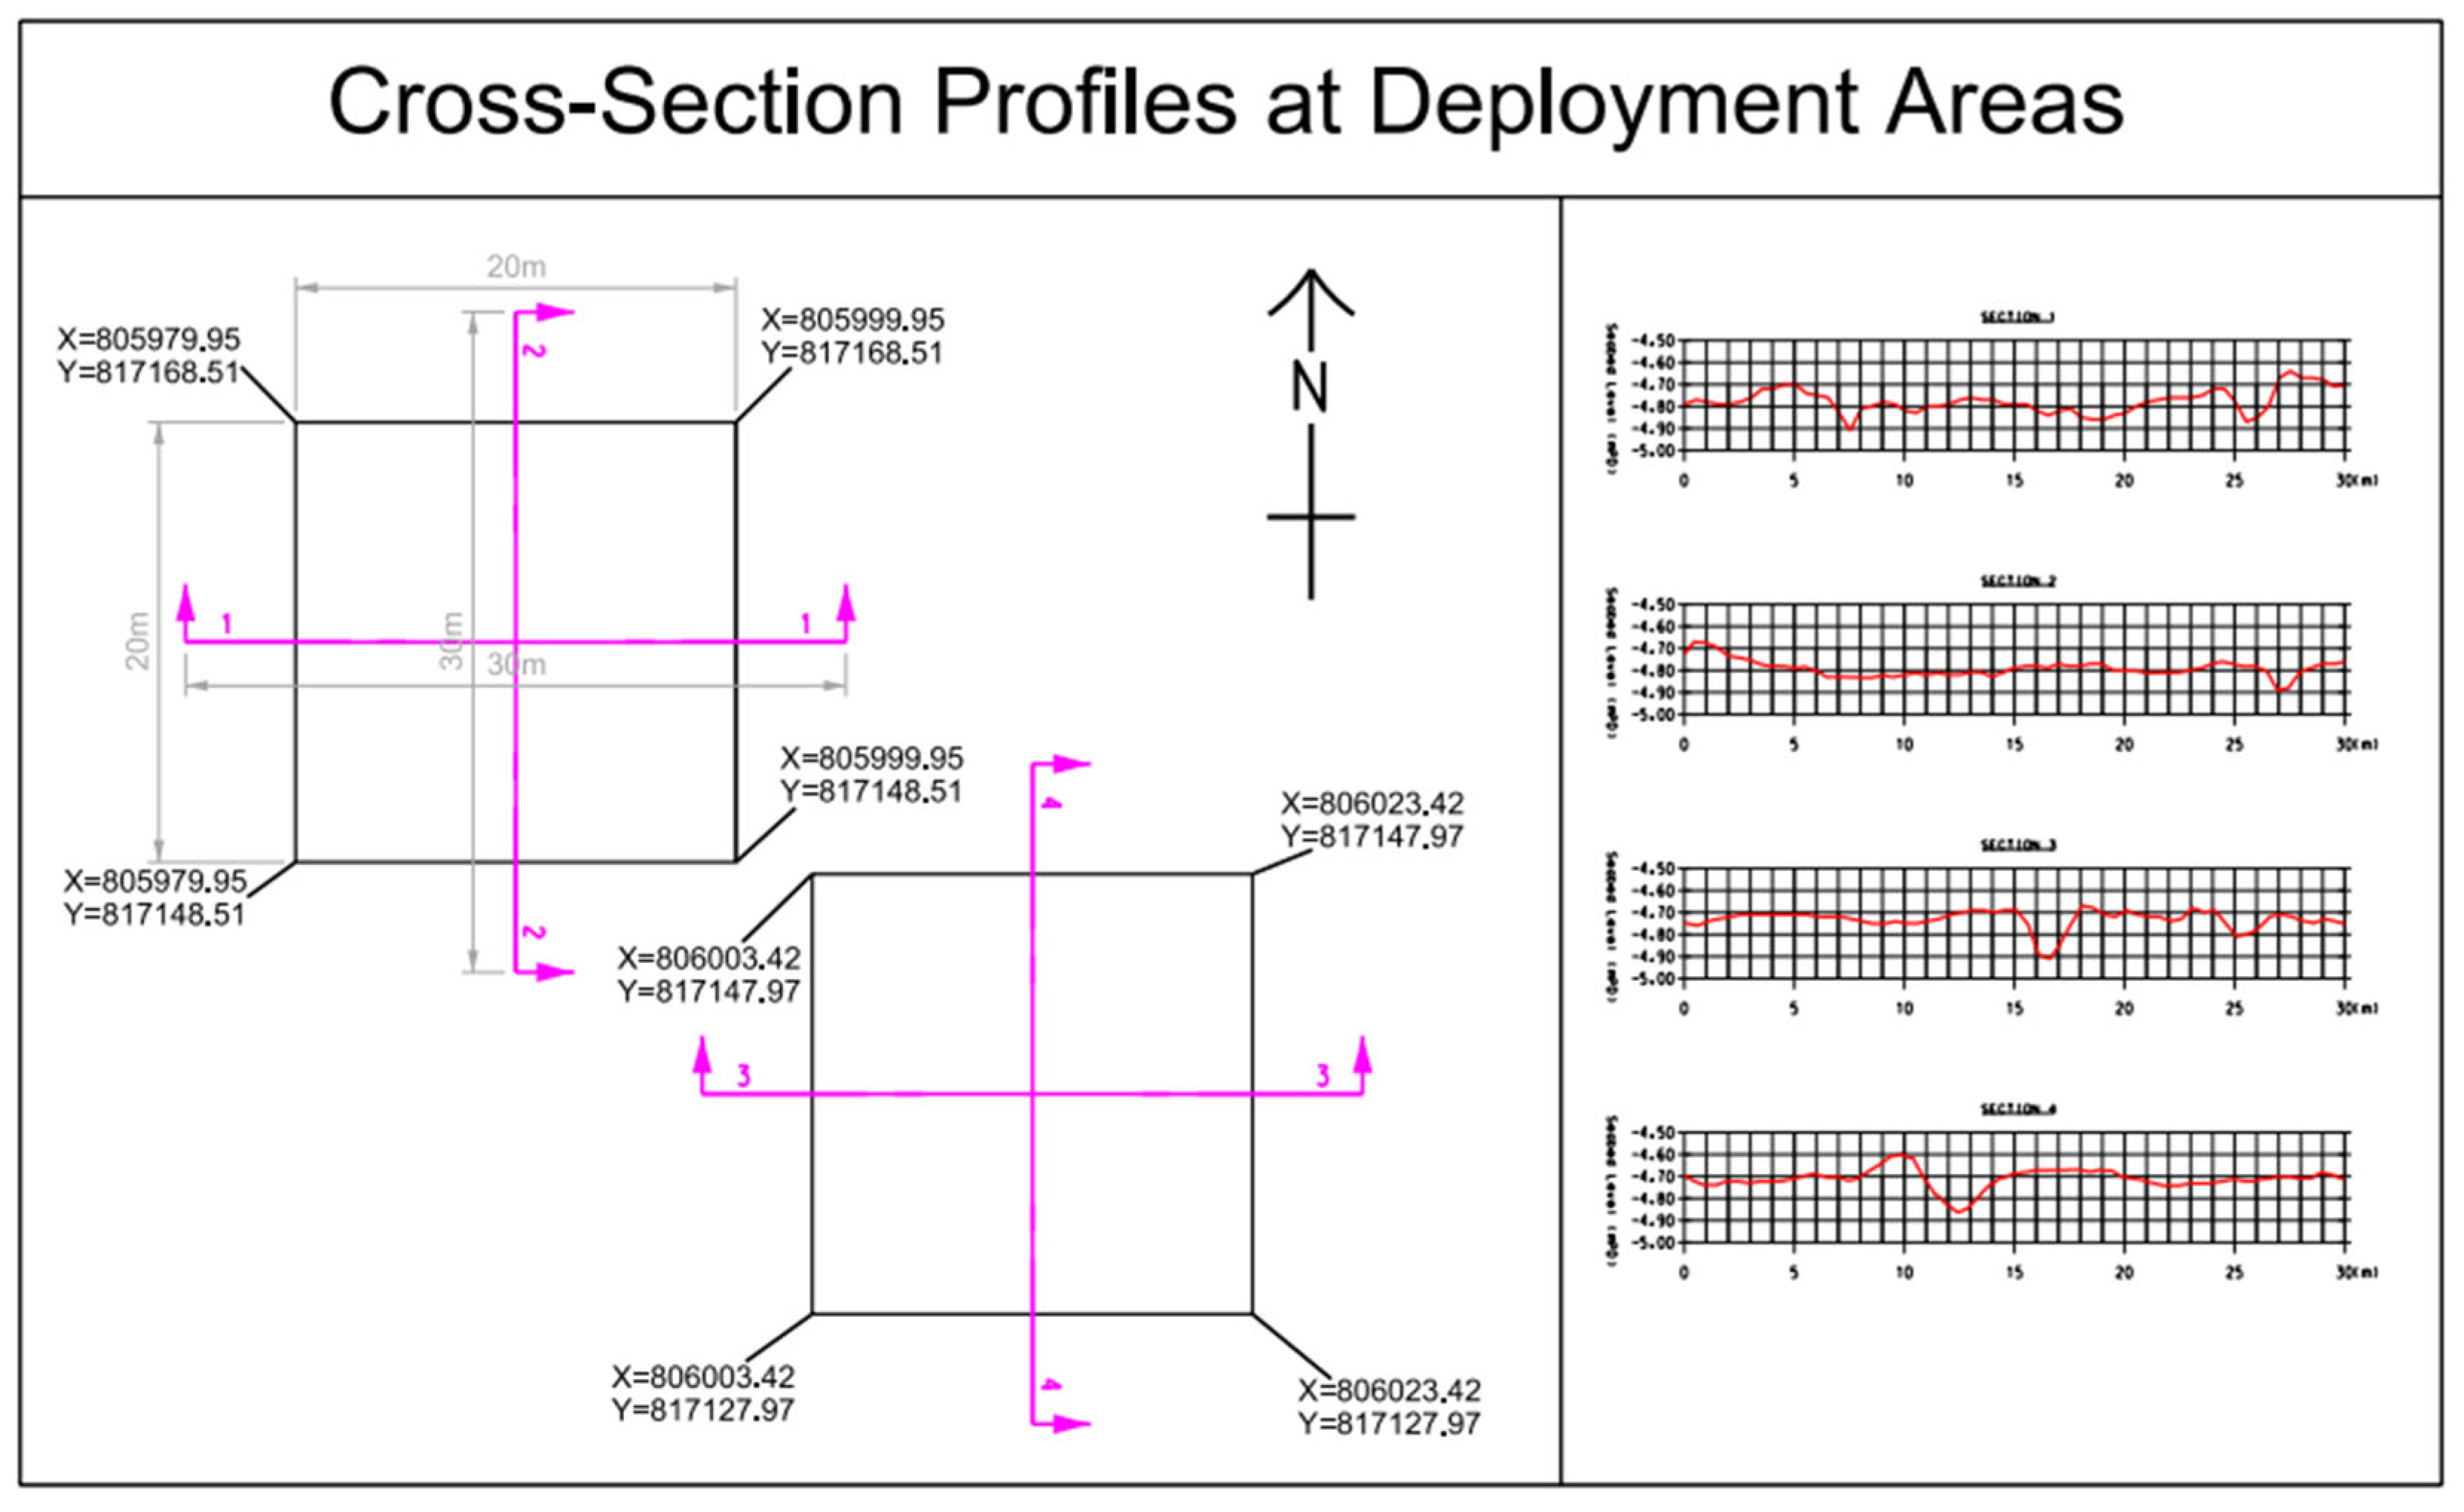
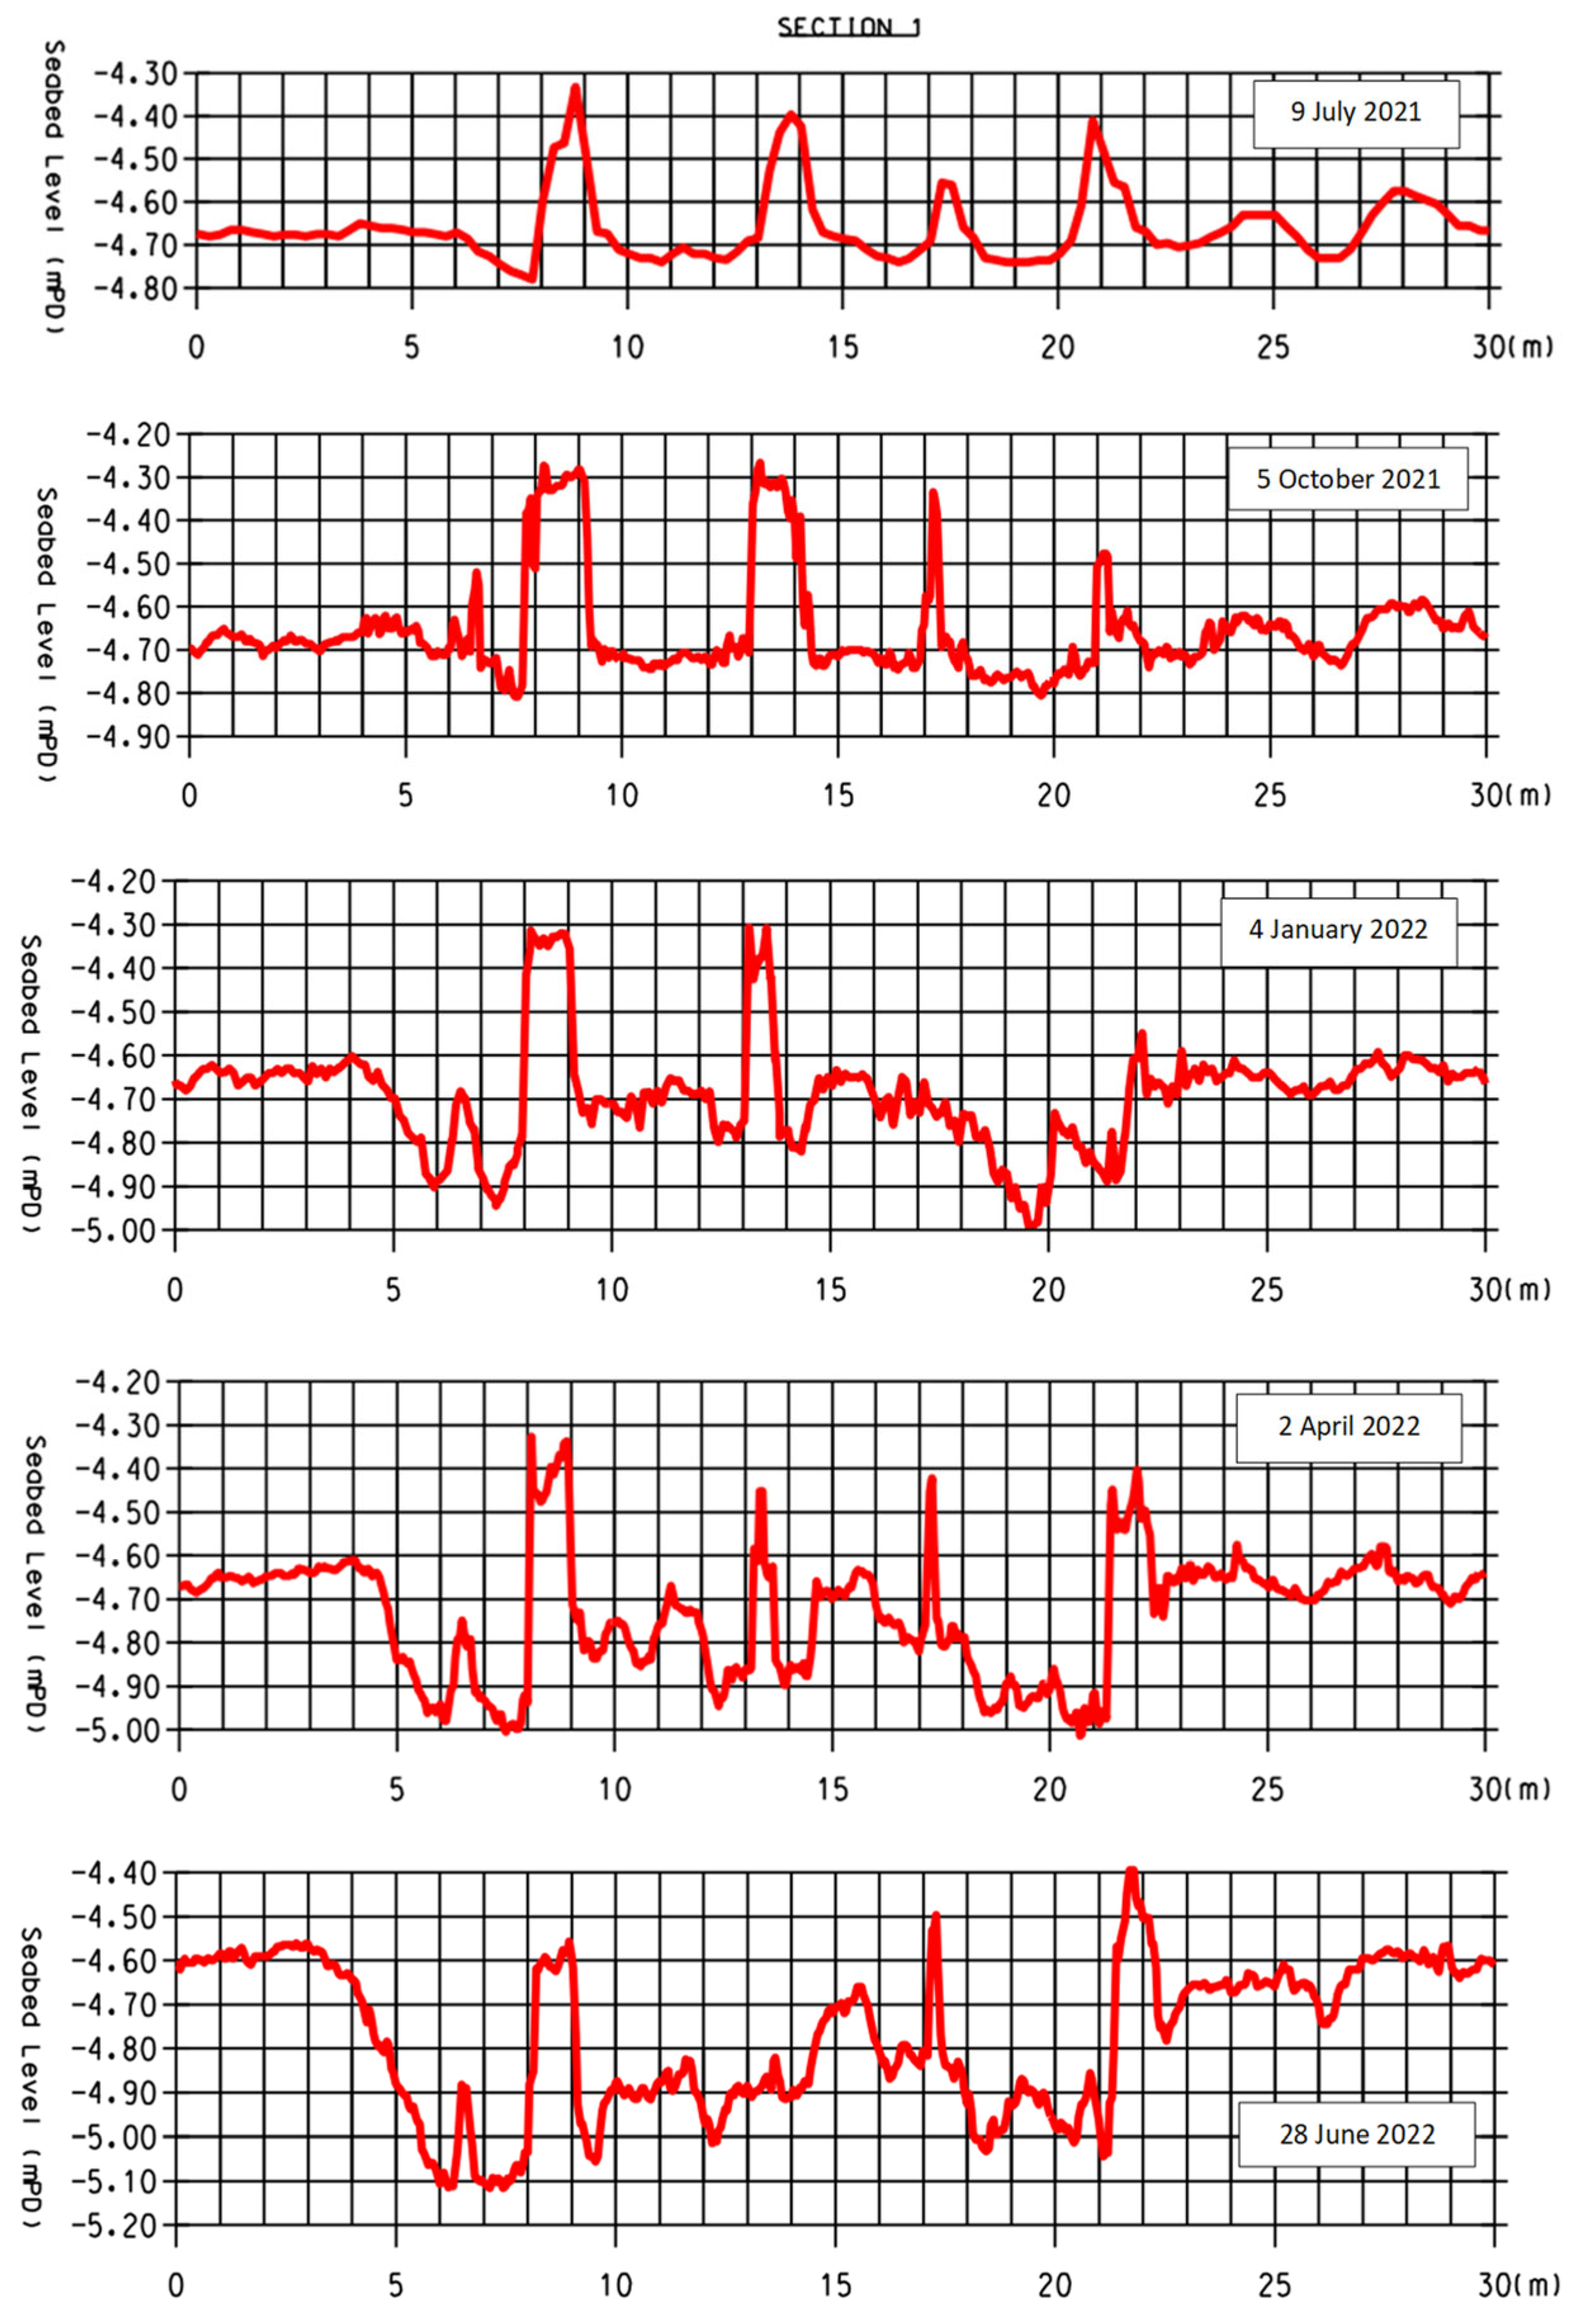
Figure 9.
Post-deployment bathymetric survey: profile evolution with time of cross-section 1 (AR Large Units). (mPD: meters above the Hong Kong Principal Datum).
The data concerning the horizontal displacements of the units indicate that for most units both northward and eastward movement were zero, confirming the resistance to the submarine dynamic actions exerted by the small piles, i.e., the bamboo legs. In Table 2, the movement undergone by AR Large Units at the end of the monitoring period is shown (see their position in Figure 4). Due to marine activities, some AR units have their original location displaced with increasing amount of Seabed Scars (likely caused by Anchor drag). Thirteen Large Units exhibited, on average, displacements of more than 1 m (Table 2). However, as already mentioned, most units did not undergo significant horizontal drift, confirming the efficacy of the foundation legs.
Table 2.
AR Large Unit movement listing table (Diff. E and Diff. N are components of the horizontal displacement). The table shows displacements of only the units that moved during the year of observation. The measurements were N/A for Units 02, 09 and 13. The remaining Large Units underwent zero displacement. Data from the survey of 28 June 2022.
In Figure 9, where the variation of the bathymetric profile for Section 1 over the entire year of the survey is shown, the reef units are recognizable in terms of topographic heights. An initial depth reduction soon after the installation can be locally observed; this is probably due to the seabed humping just around the foundation, as an effect of undrained soil distortion.
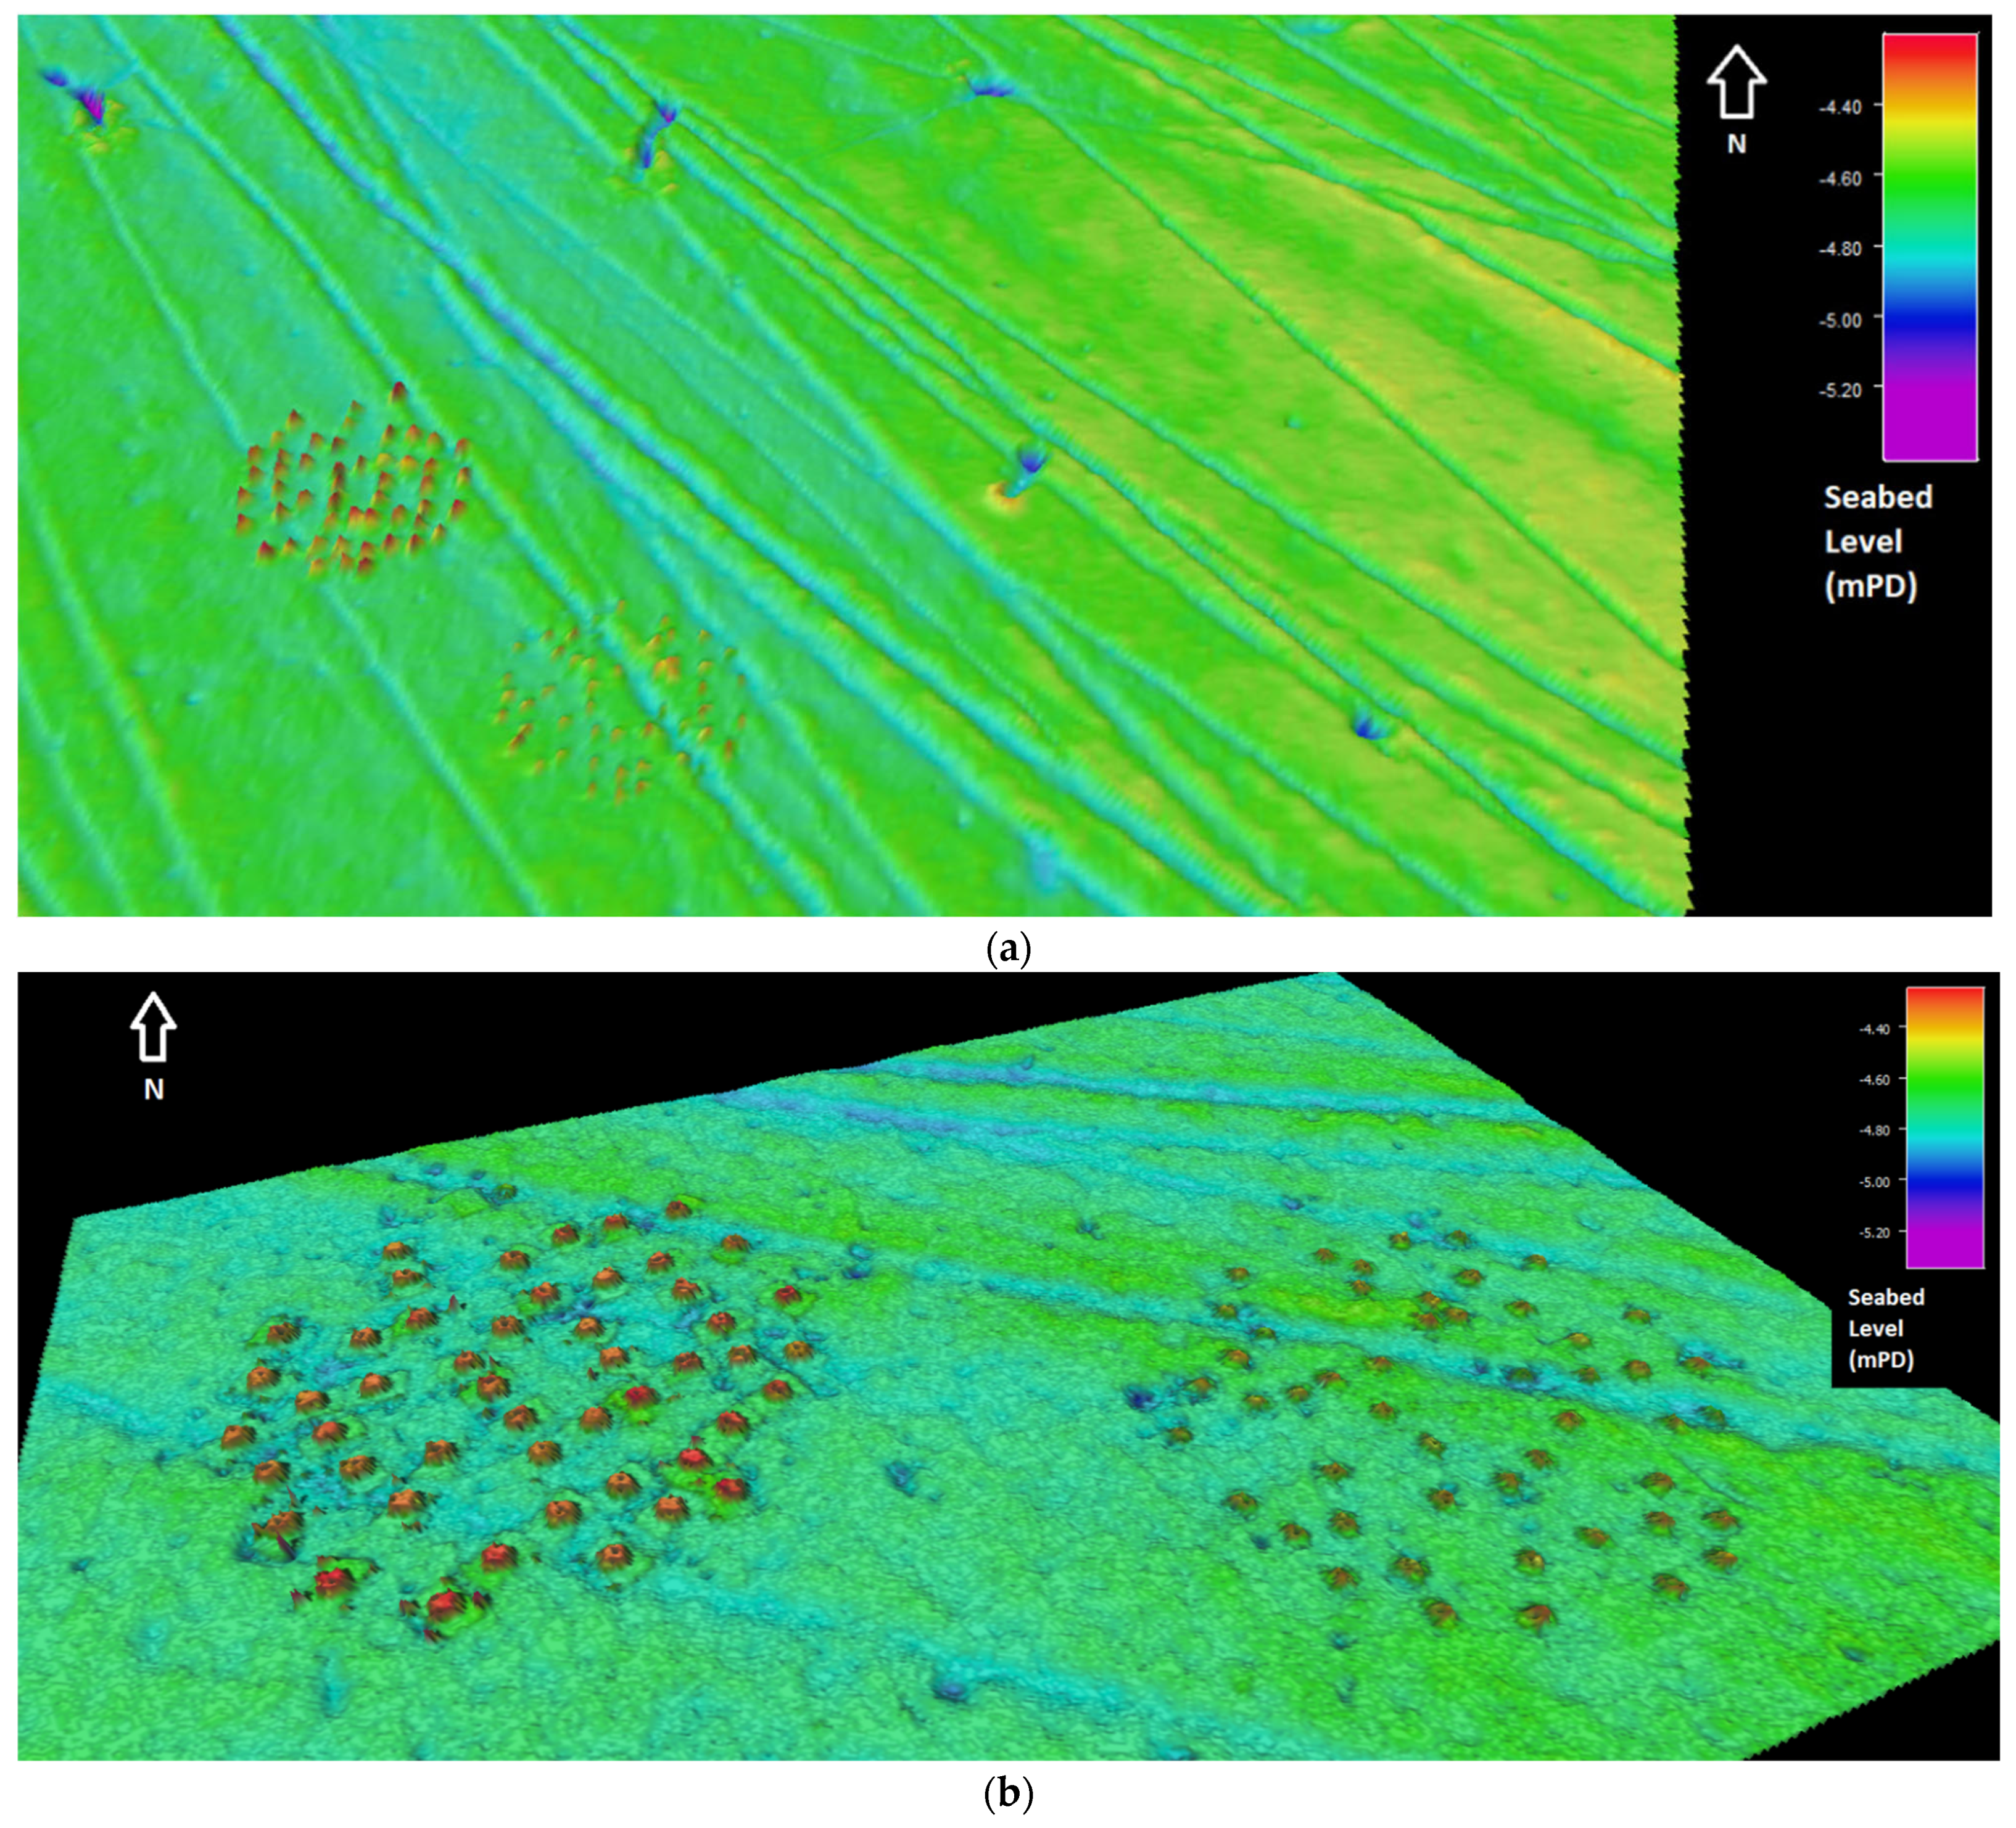
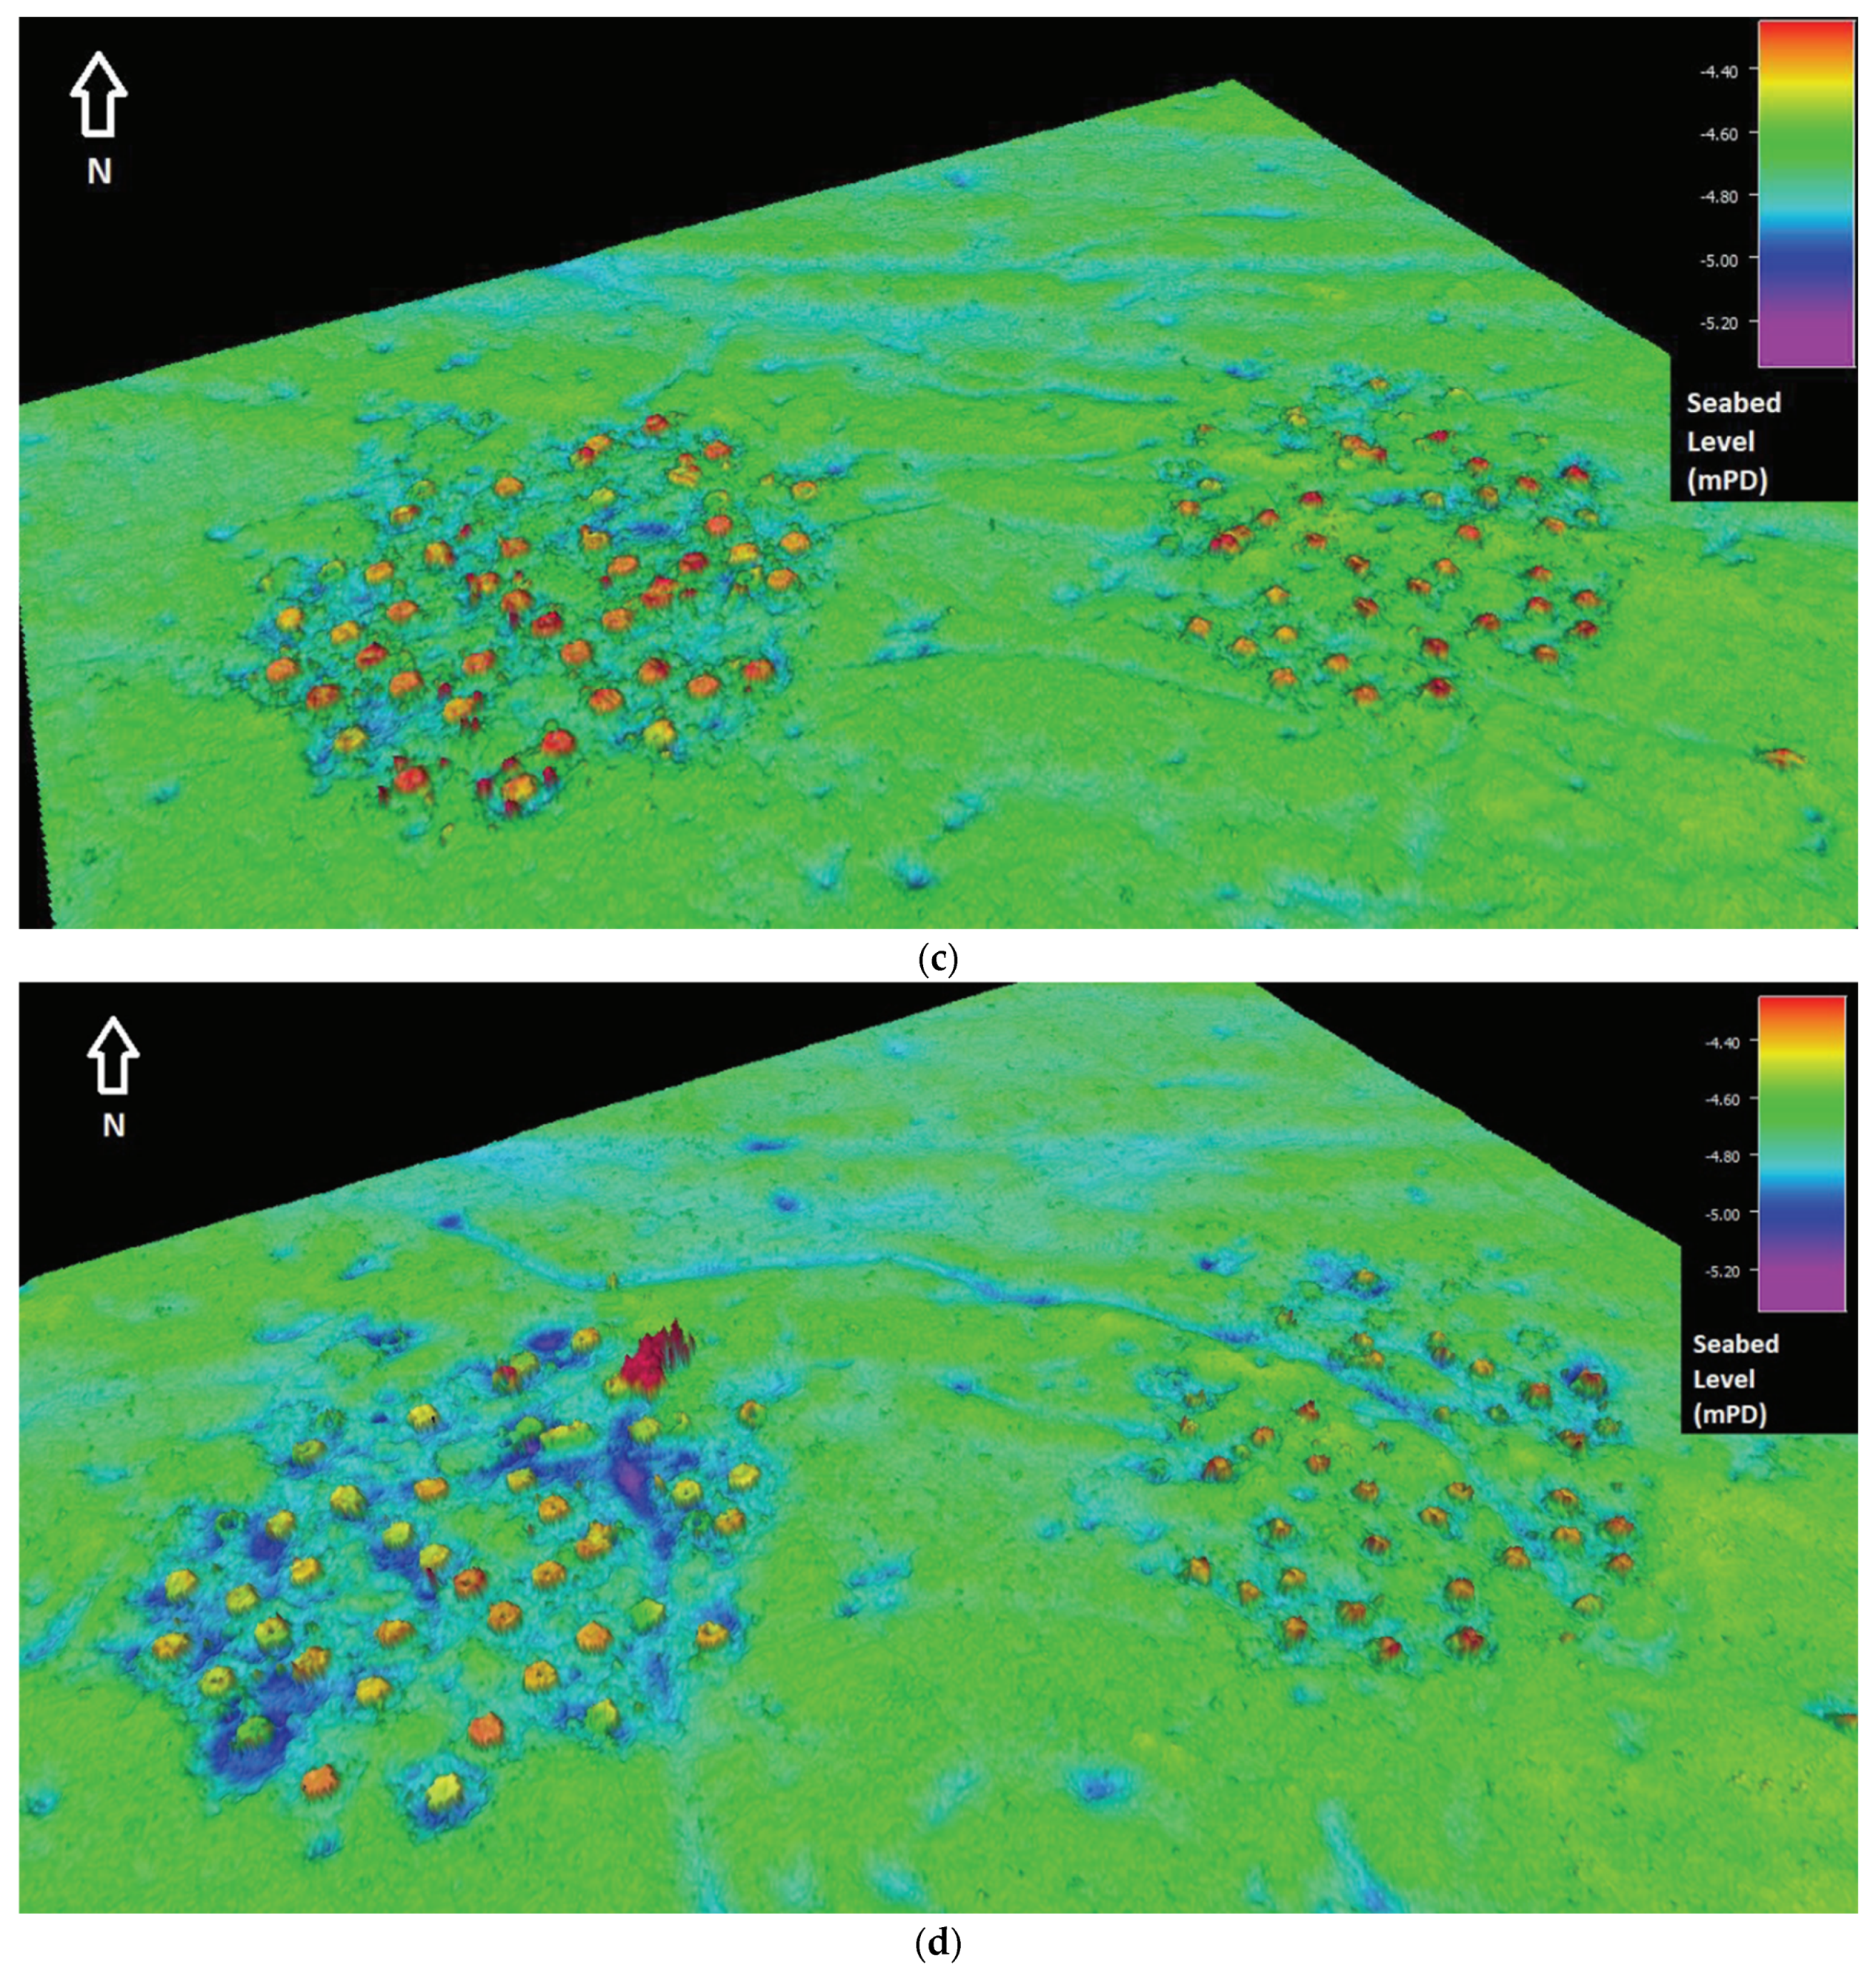
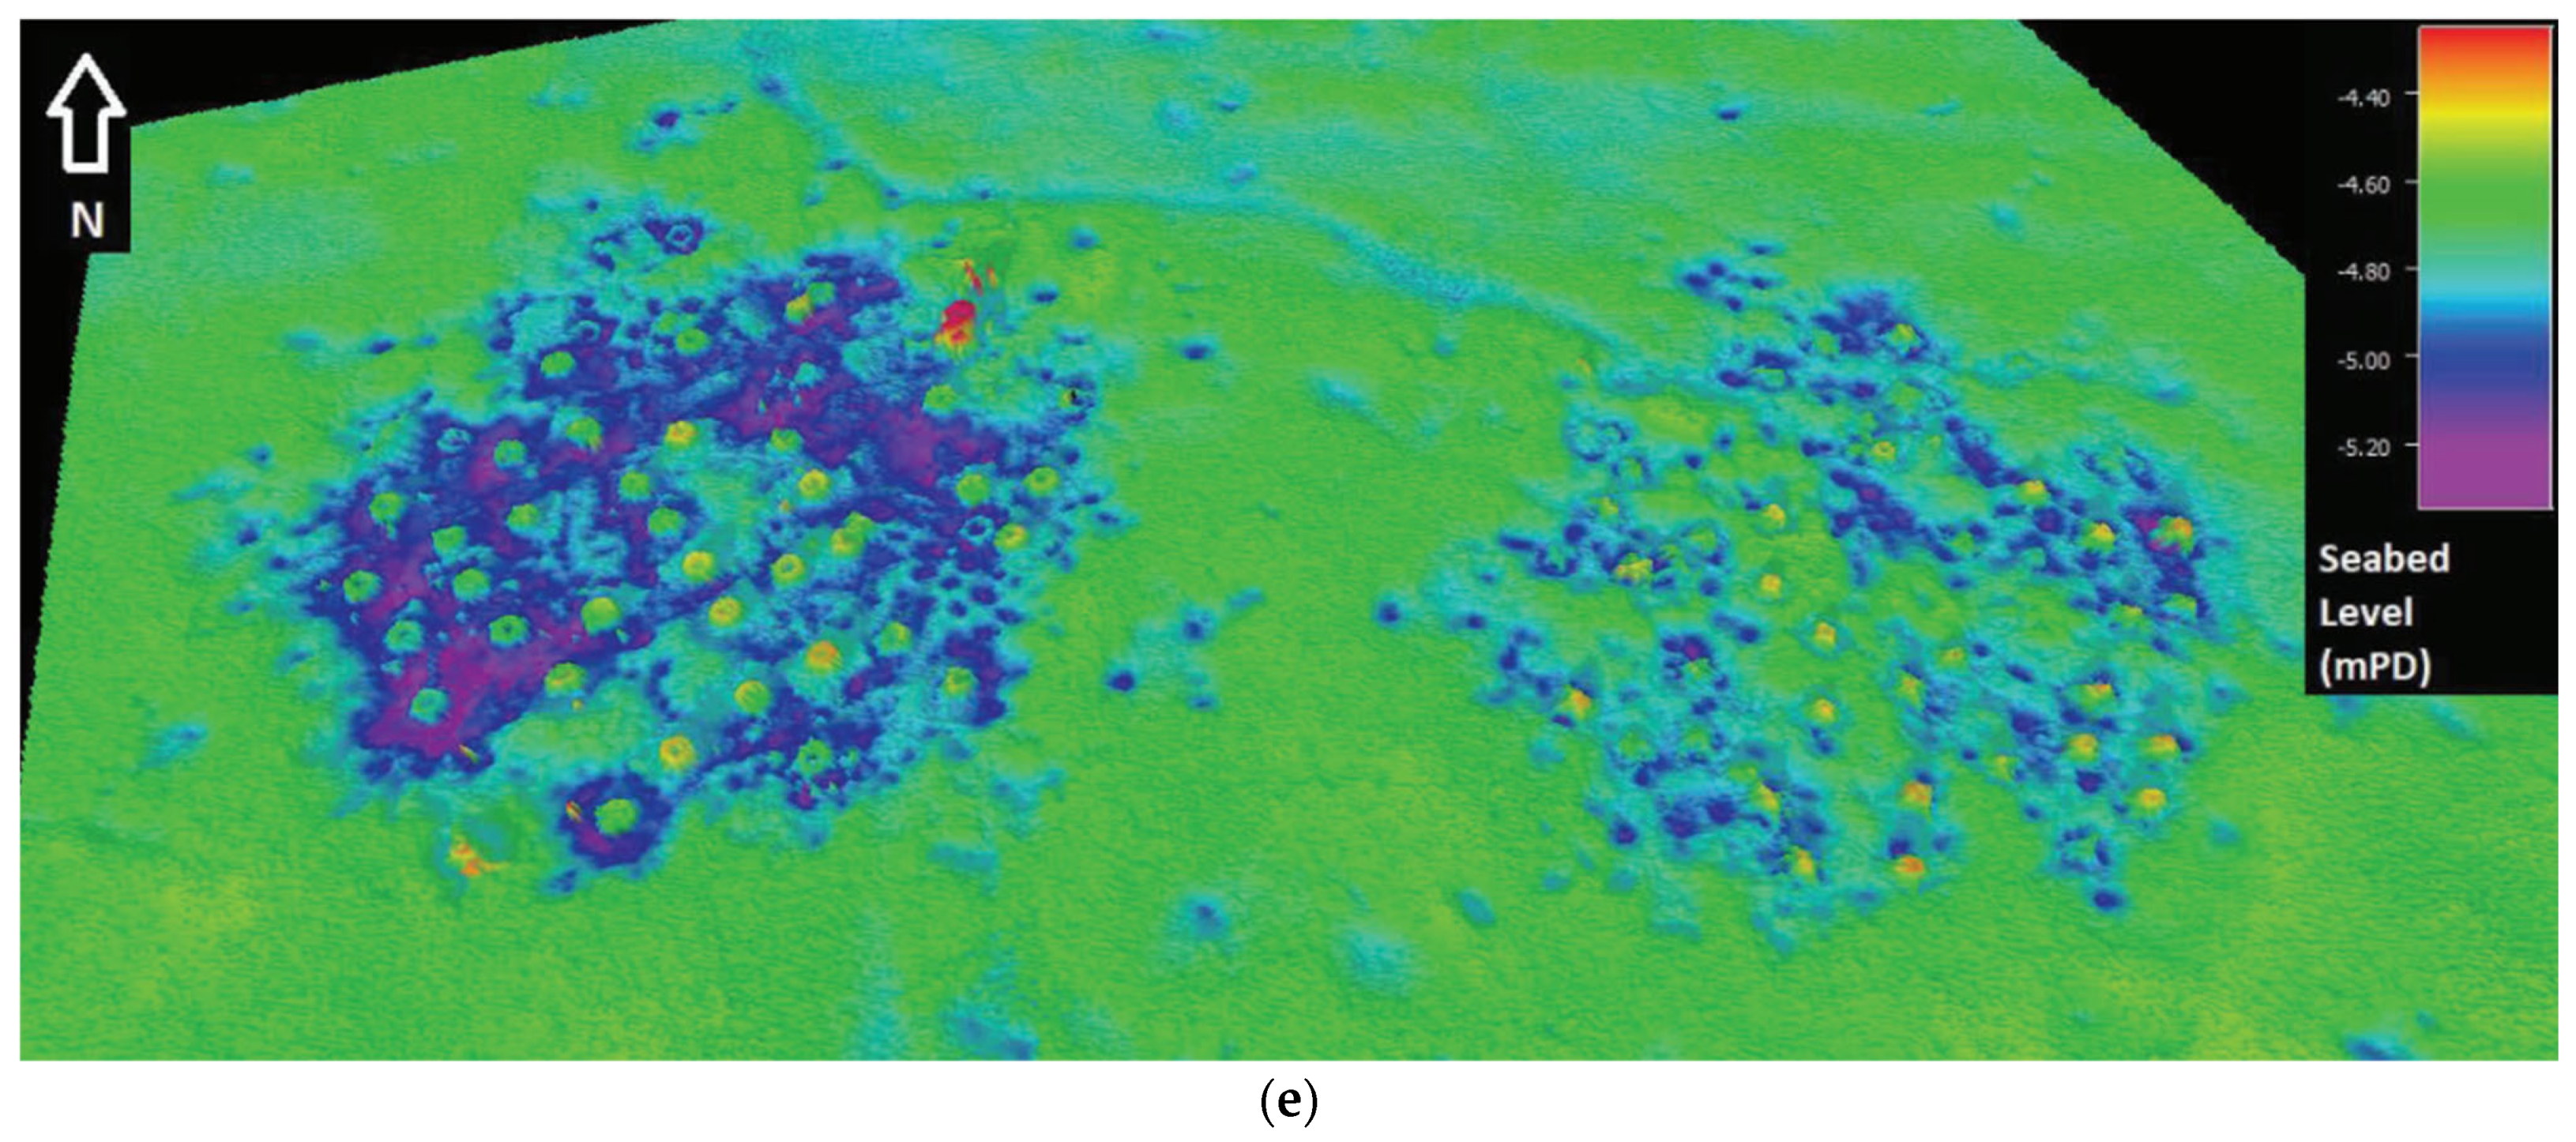
In Figure 10a–e, the 3D perspective view plots of the subsidence measured during the monitoring period are shown. The seabed hosting the reefs gradually and locally deepens.
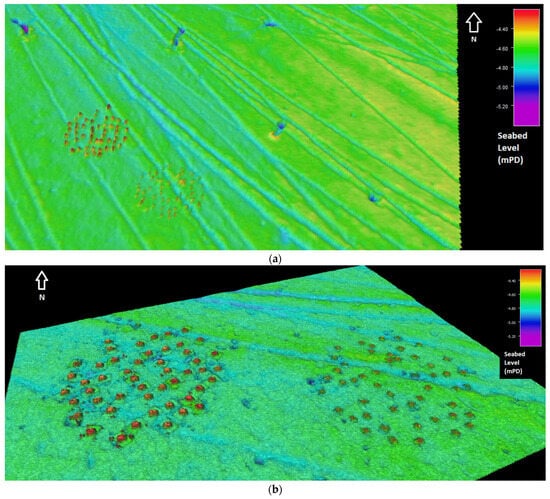


Figure 10.
Perspective view plots (3D) of the bathymetric surveys. (a) 9 July 2021; (b) 5 October 2021; (c) 4 January 2022; (d) 2 April 2022; (e) 28 June 2022. (mPD: meters above the Hong Kong Principal Datum).
The primary rationale for correlating the observed one-year settlements solely with the reefs lies in the crater-like morphology of the subsidence profile. Indeed, the loading attributed to the recent airport land reclamation would theoretically induce a widespread and uniform subsidence across the entire region where the reefs were deployed. However, such a pattern was not discerned during the survey period.
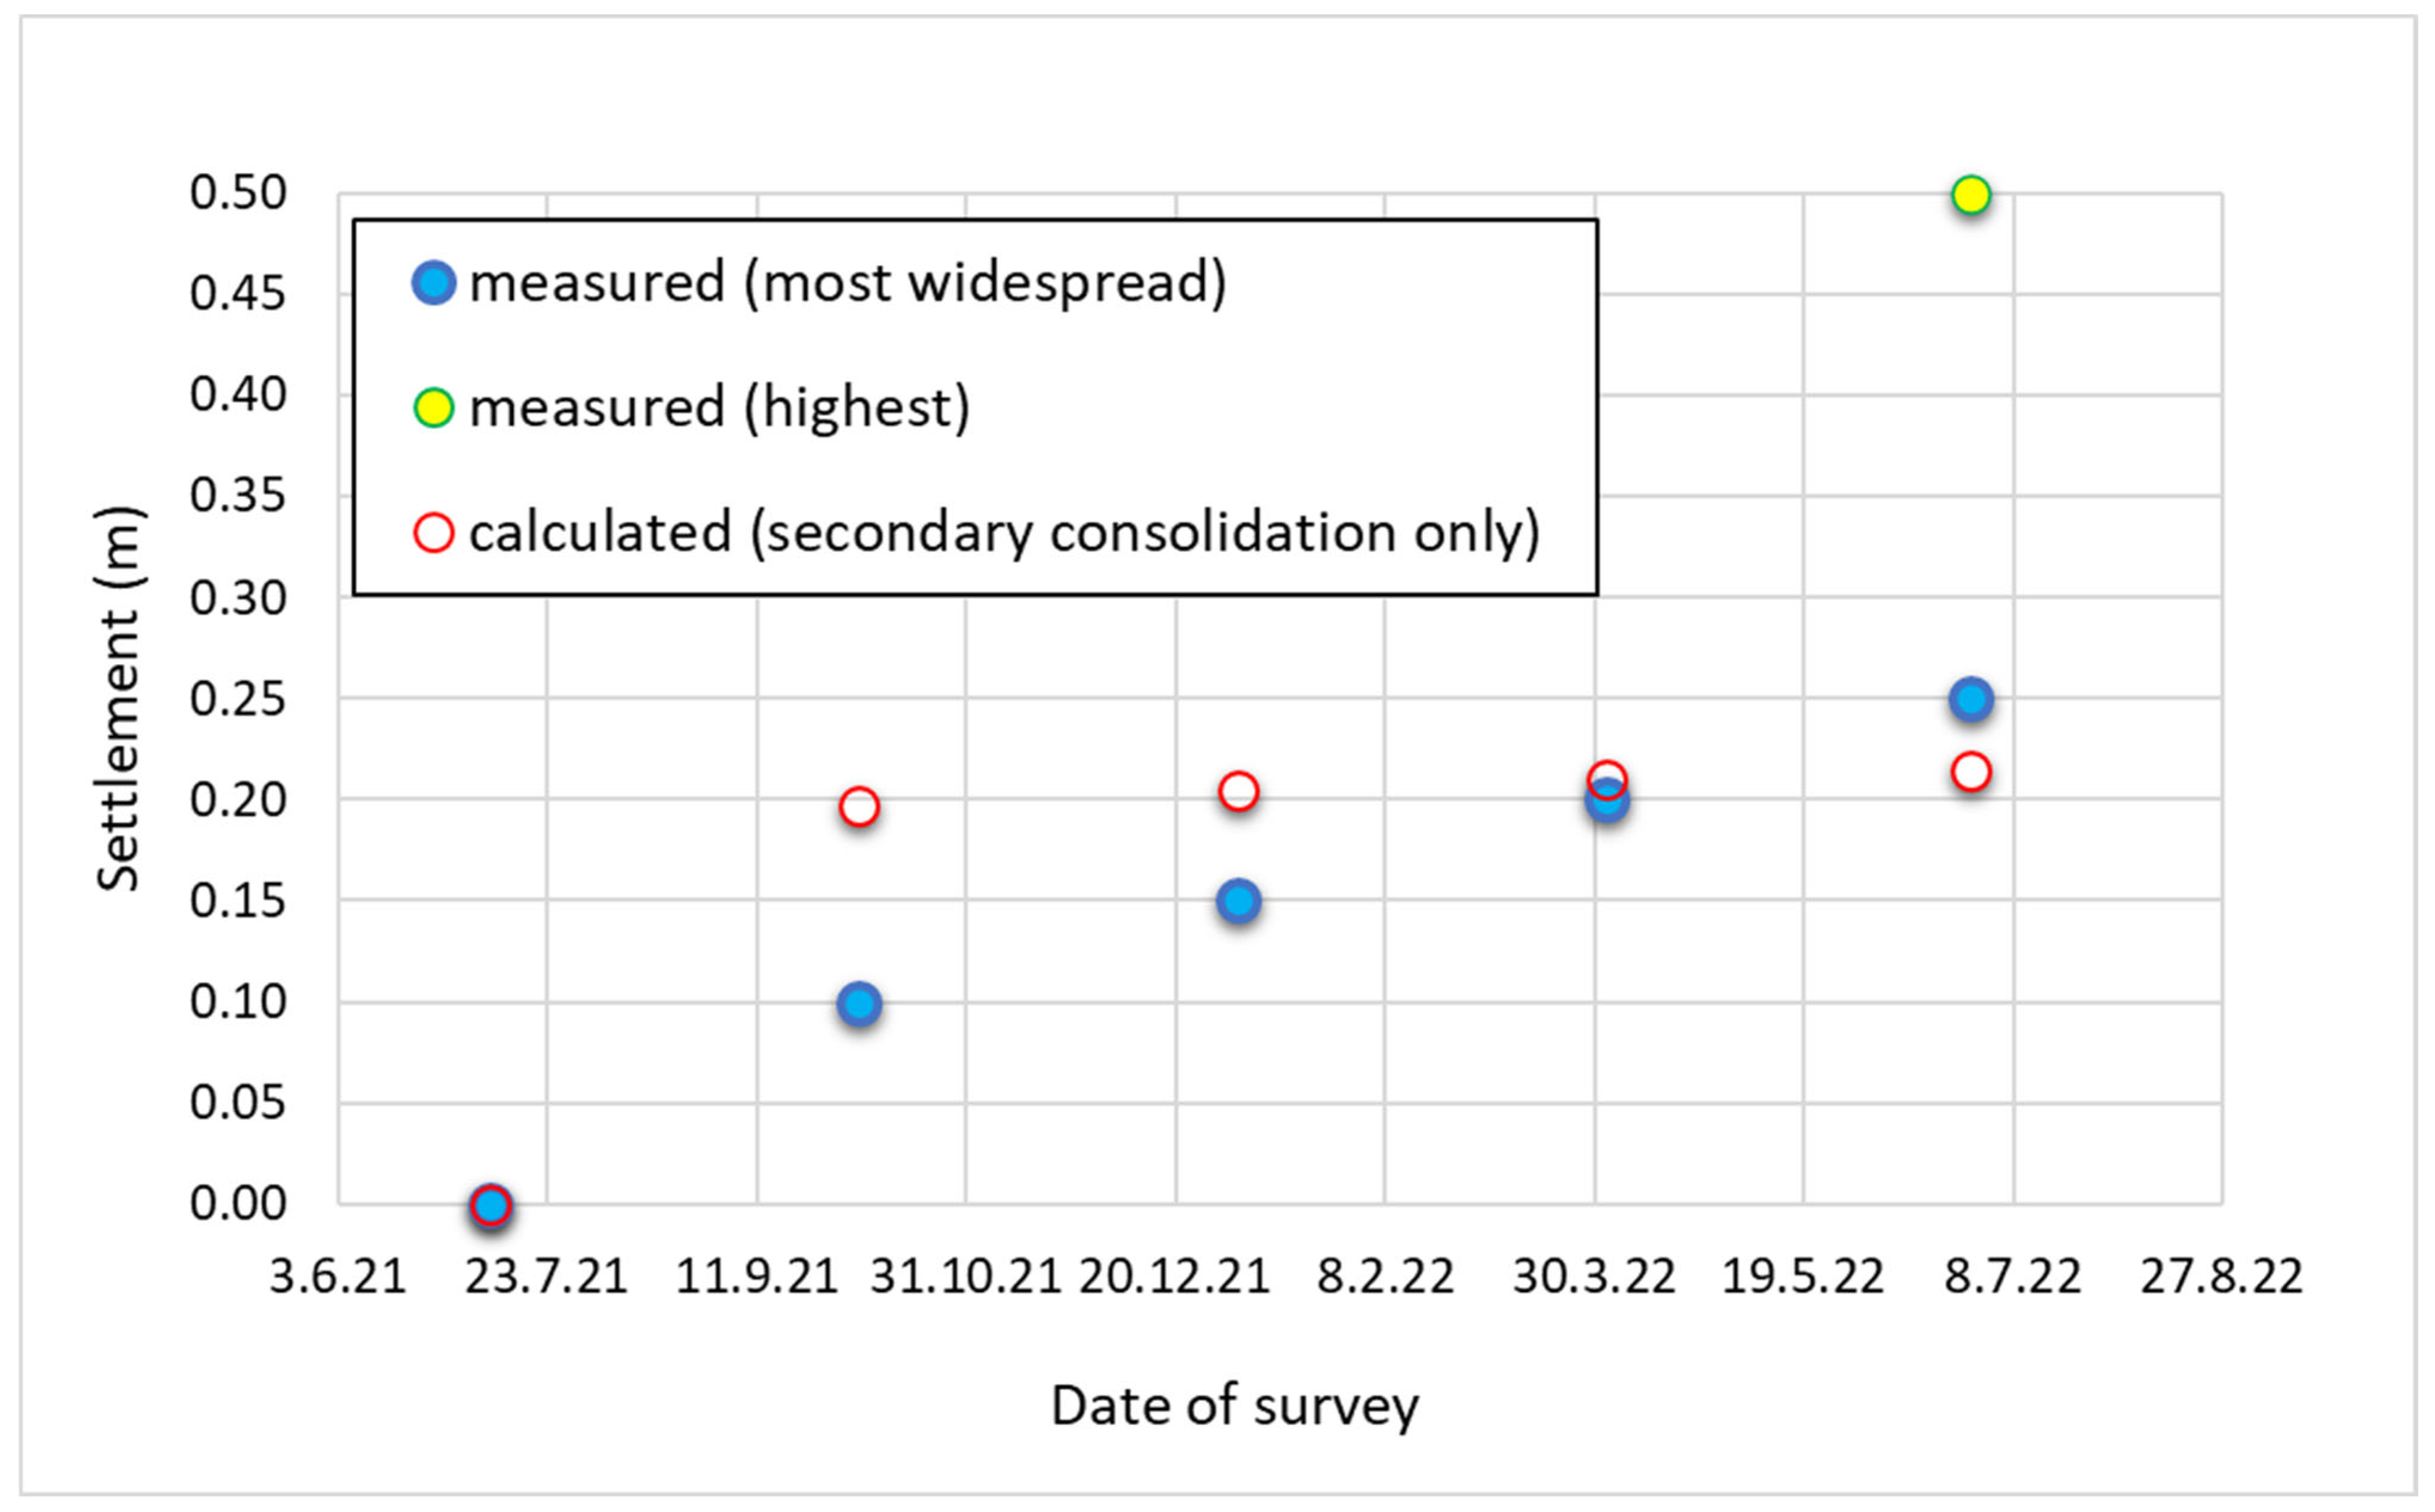
One year after reef deployment, settlements of about 25 cm were mostly widespread across the area, although some areal variability was observed. Locally, settlement peaks even higher than 50 cm could be seldom observed. In Figure 11, measured settlement values, representative of the most widespread subsidence detected across the area during each survey (based on visual inspection of the survey maps; see Figure 10), are plotted, together with the final highest value that can be identified among all AR units, as deduced from the final survey output (Figure 10e). The difference between the final highest value and the most widespread one could be indicative of the geotechnical heterogeneity of the area, as said before, and, as a contributing factor, of locally different submarine dynamic actions. In the same figure, the calculated evolution with time of the secondary settlement is also shown, under the hypotheses that viscous deformations took place soon after reef deployment (i.e., nominally since the 9 July 2021, to assign equal history to all units), the creep involved the upper layer only (using cα = 0.059, Table 1) and the deformation process was one-dimensional. The vertical displacements measured during the first year fit the values calculated for creep quite well. This observation seems to corroborate the interpretation that secondary consolidation is an important source of subsidence in this problem and that to depict a reliable subsidence scenario the soil viscous deformation must be assumed to start soon after reef deployment. The FEM calculation of the foundation primary consolidation settlement will confirm this hypothesis, as shown in the next section. Instead, no attempt was made to calculate the immediate settlement. Indeed, from the survey of July 2021, i.e., soon after the reef installation, it seems that the initial settlement of the reefs was negligible: the difference in depth between their tops and the surrounding seabed (Figure 10a) is practically equal to the height of the units. This is expected for the present case due to the small static loads and because the units have been deployed on the foundation without free-fall installation (Figure 2b), so that momentum effects on the initial settlement [14] may be neglected.
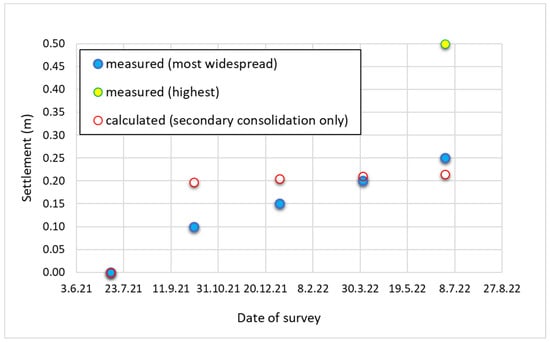
Figure 11.
Comparison between measured and calculated (“creep” amount) settlements of seabed with time, across the deployment area of the Large Units. (The most widespread subsidence detected across the area during each survey is based on visual inspection of the survey maps. The final highest value identified among all AR units is deduced from the final survey output).
5. FEM Calculation of Primary Consolidation Settlement of the Foundation System
5.1. Geometrical Model and Calculation Assumptions
To calculate the primary consolidation settlements of the foundation system subjected to the artificial reef weight, 3D FEM simulations were carried out adopting the FE code PLAXIS (©2022 Bentley Systems, Inc., Exton, PA, USA, 2022) [15]. The simulations were performed considering only one single foundation unit, under the hypothesis that the load diffusion with depth does not involve interference between reef units. The foundation unit, i.e., the bamboo raft-pile, consists of the square bamboo mat connected to four bamboo legs, resting on the seabed under the conditions of calm sea; thus, the primary settlement caused by the weight of the reef unit were evaluated considering only the static and vertical loads. For the purpose of estimating the benefit retrieved by the installation of the foundation legs, the modelling of only the raft, i.e., the bamboo mat without legs, was also performed.
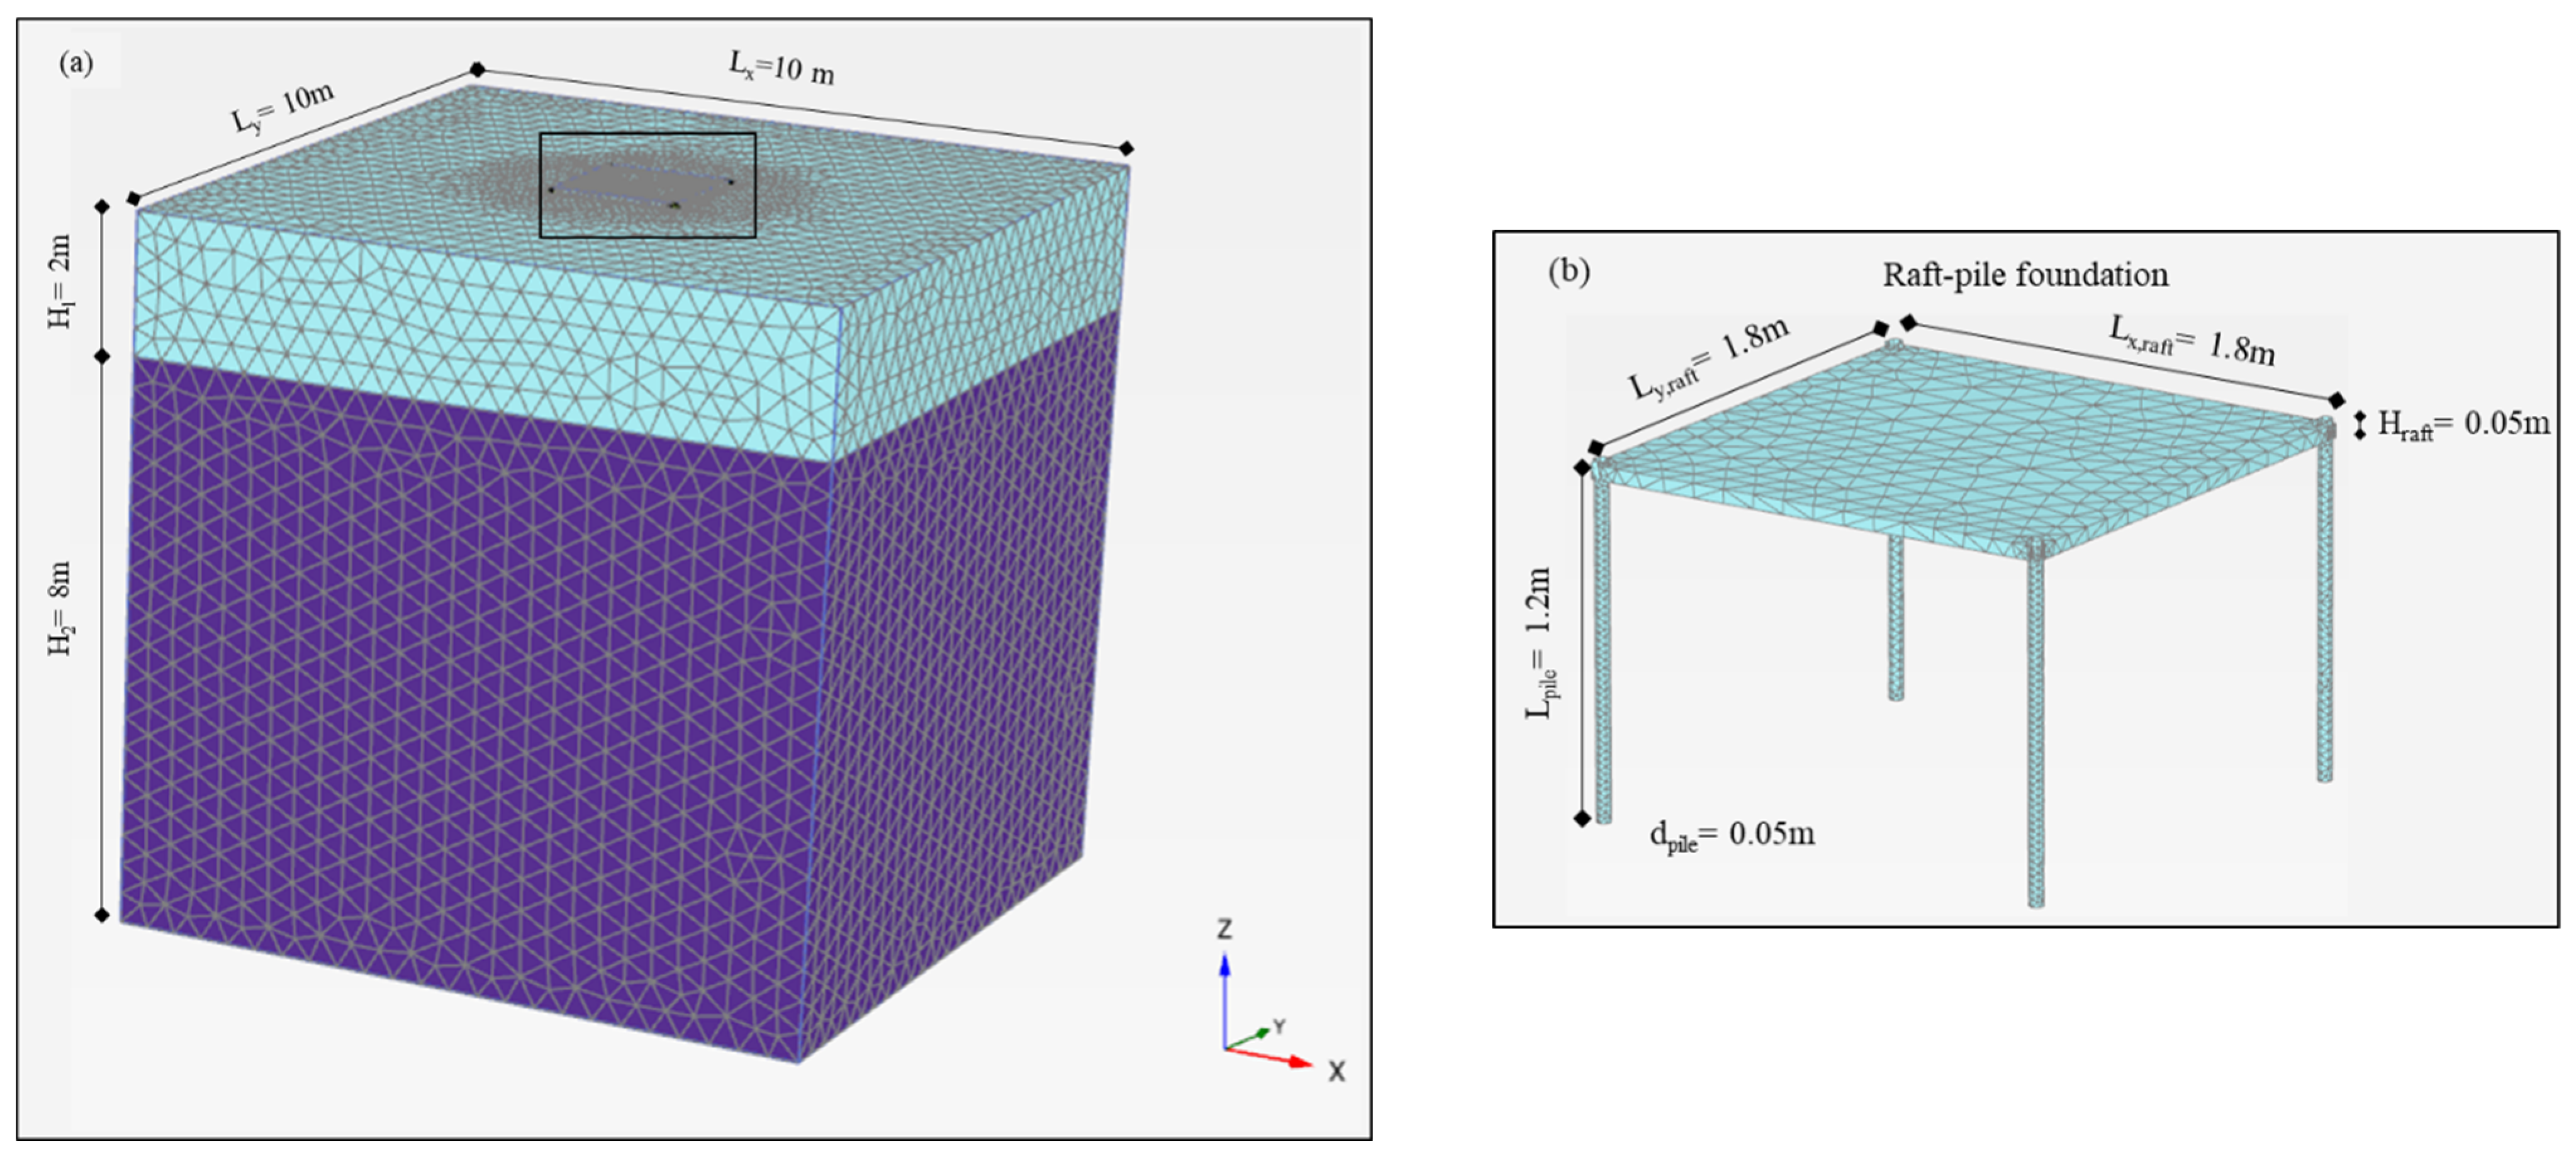
The employed 3D numerical model, shown in Figure 12, consists of the raft-pile foundation resting on a two-layer soil deposit, characterized by the 2 m thick layer of soft clay overlaying an 8 m thick firm clay layer. Therefore, the 3D FE model, discretized into 150,626 10-node tetrahedral elements of an average size of 0.34 m, is 10 m high and 10 m wide along both horizontal directions (Figure 12a). The width of the model was chosen to be large enough to avoid side effects, while the coarseness of the mesh was refined around the foundation system to achieve a higher accuracy in the numerical results. The bamboo piles were implemented as cylindric volume elements of diameter of 0.05 m and length of 1.2 m, while the raft was modelled as a 0.05 m thick square element of dimensions 1.8 m (Figure 12b). The raft-without-legs model was, instead, discretized into 123,839 elements of average size of 0.39 m, for a total number of 175,043 nodes.

Figure 12.
(a) Mesh of the 3D model employed in the FE simulation and (b) geometry and discretization of the raft-pile foundation model.
The bamboo behavior was modelled using a linear elastic model, assuming a unit weight of 3.83 kN/m3, Young’s modulus E’bamboo equal to 16 GPa and Poisson’s ratio ν’bamboo equal to 0.3. The mechanical response of the soil layers was modelled by means of the elastic–perfectly plastic Mohr–Coulomb model, whose parameters are those discussed in Section 3 and summarized in Table 1. The soil–structure interaction between the piles and the surrounding soil was accounted for by means of surface interface elements, whose shear response is governed by the elastic–perfectly plastic Mohr–Coulomb failure criterion. The roughness of the soil-pile interaction was modelled by implementing the strength reduction factor Rinter, i.e., the ratio of tan δsoil-pile and tan φ’soil, equal to 0.4, where the soil-pile friction angle δsoil-pile was assumed based on the similarity with the experimental data from [13].
After the first stage of the stress state initialization performed by adopting the k0 procedure, the installation phase of the raft-pile foundation was simulated by substituting the material in the pile elements and activating the raft element. At this stage, the interface elements were also activated. With reference to the simulation of the bamboo raft without legs, the installation stage was carried out by activating solely the raft element. Contrarily to the real installation procedure, consisting of leaving a gap between the lower surface of the mat and the seabed, the numerical simulations were performed based on the hypothesis that the raft base was already in full contact with the soil soon after the installation, thus implying that the initial settlement was great enough to cause this contact. Finally, the stage of the artificial reef installation was simulated by applying, at the top surface of the bamboo mat, a surface load of 0.3 kPa, uniformly distributed over the square mat area, representative of the effective weight of the artificial reef unit. The applied surface load accounts for the water uplift due to the hydraulic water head of 5 m above the seabed. Both the installation and the loading stages were performed as drained analysis, so that, at the end of the calculation, the computed settlements represent the primary vertical displacements suffered from the foundation system after a period of sufficient length to extinguish the primary consolidation process.
5.2. Numerical Computation of the Foundation System Settlements due to Primary Consolidation
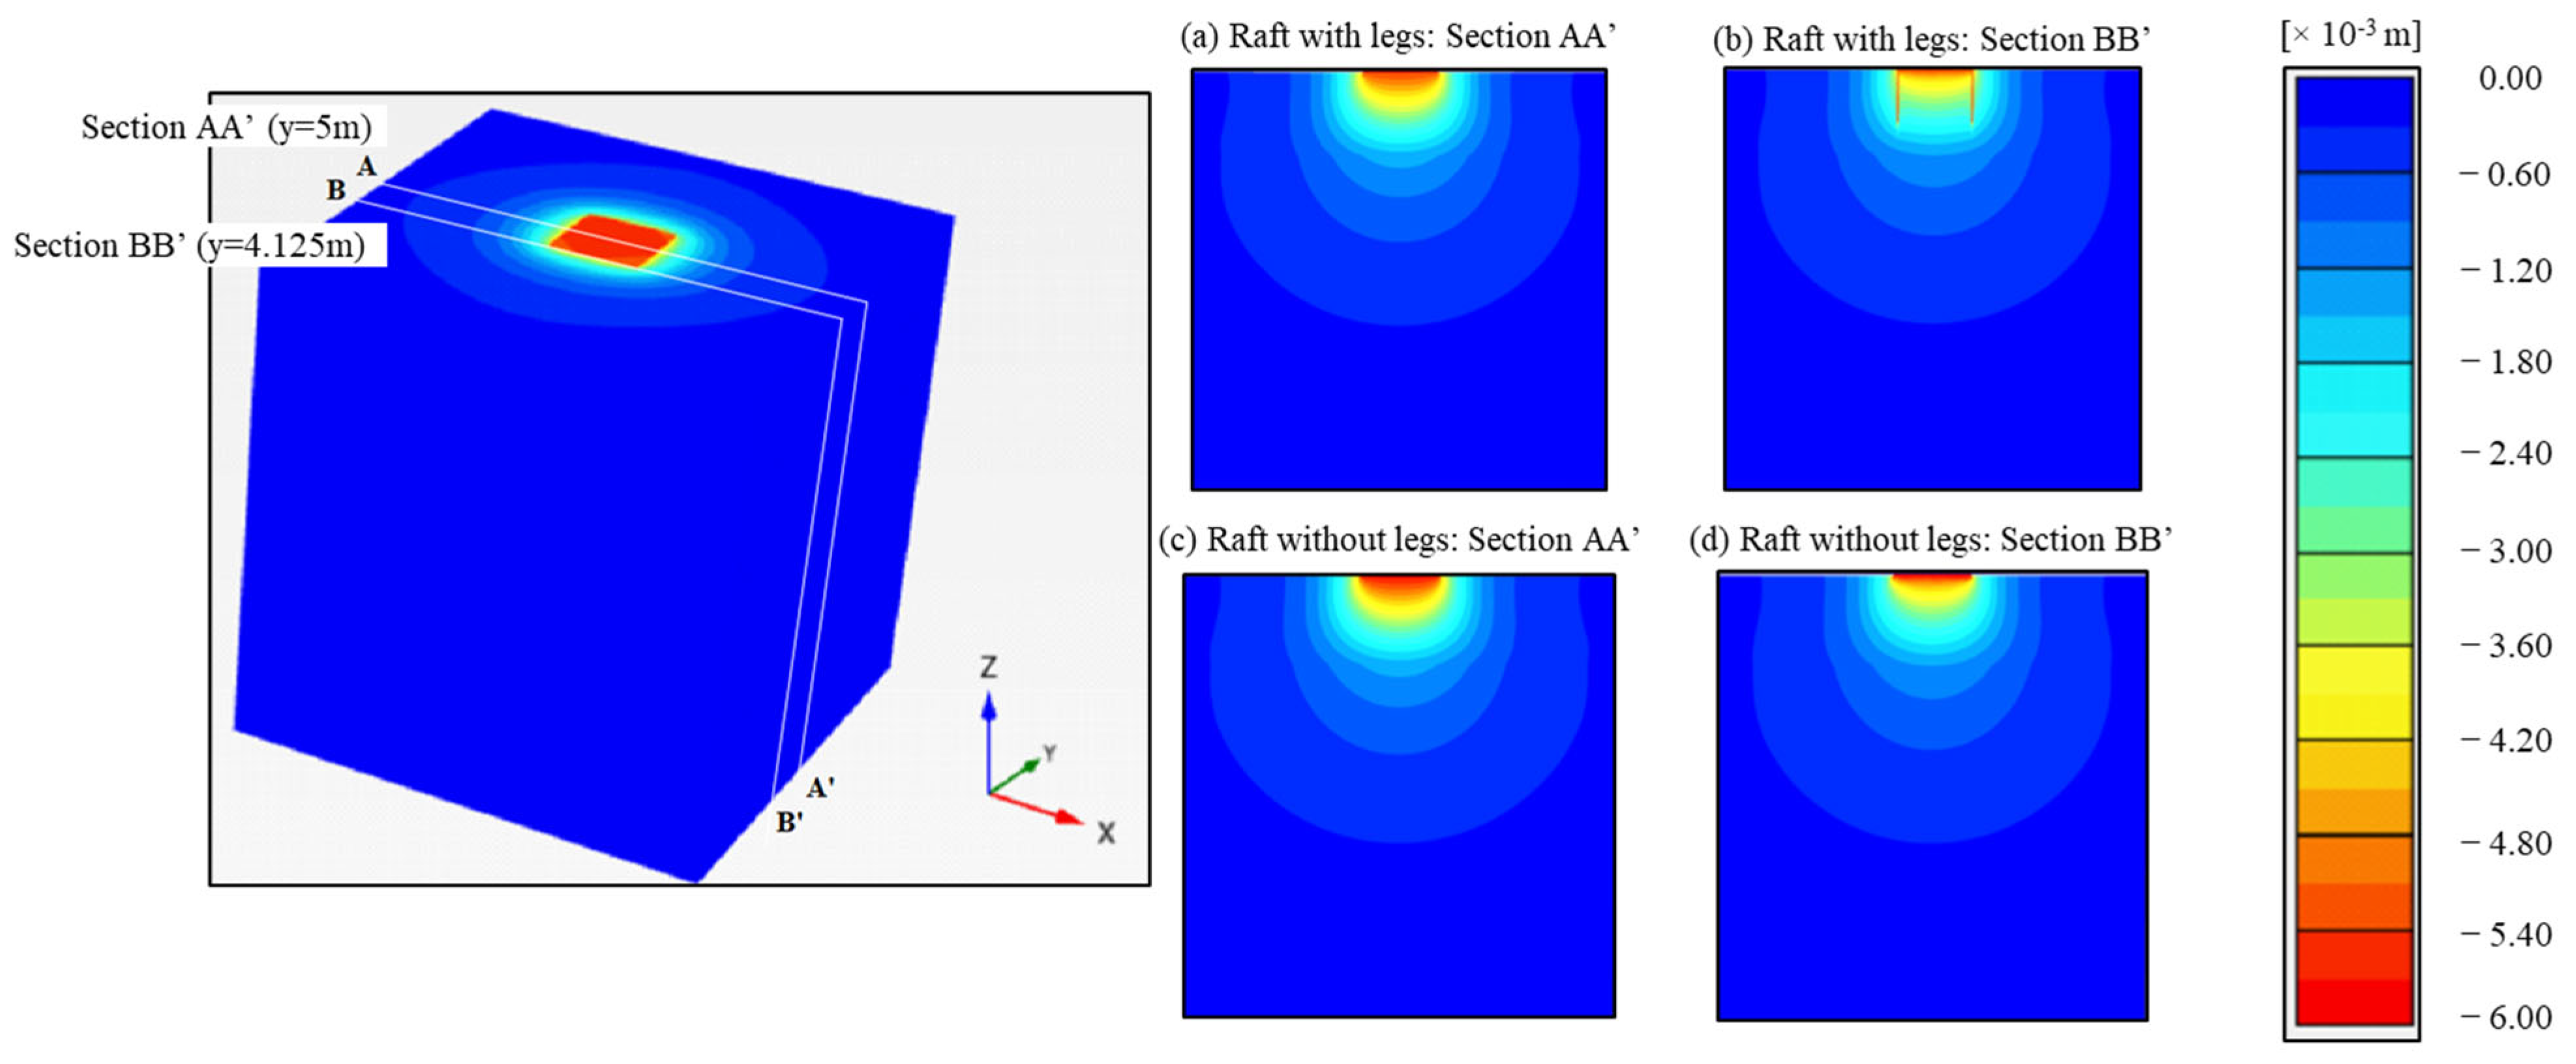
The performance of the raft-with-legs foundation system was estimated in terms of settlement distribution in the soil deposit due to the artificial reef unit self-weight, simulated through the application of a vertical distributed load. The numerical results are shown in terms of vertical displacement distribution obtained at the end of the loading stage along two vertical cross-sections (Figure 13): Section AA* crosses the foundation systems in correspondence of the midpoint of the raft (at y = 5 m); Section BB* crosses the foundation systems along the alignment of the legs (at y = 4.125 m). Additionally, Figure 14 illustrates the vertical displacement distribution along two horizontal lines, passing at the depth of 1 cm below the bottom of the bamboo raft along the above-mentioned cross-sections AA* and BB* in the midpoint and at the border of the raft, respectively.
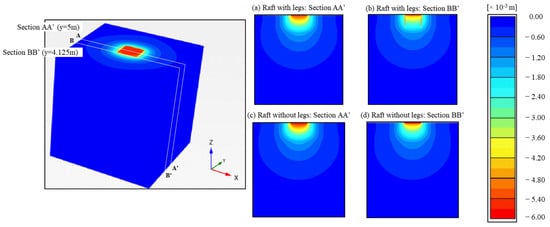
Figure 13.
Results of the 3D numerical simulation at the end of the loading application in terms of contours of vertical displacement along two cross-sections: (a,b) raft with legs and (c,d) raft without legs.
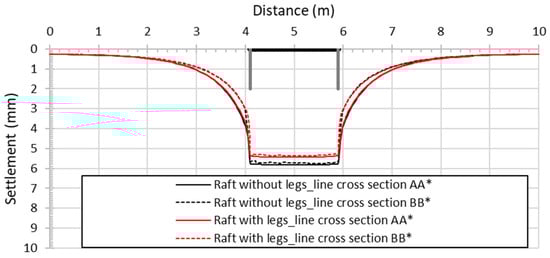
Figure 14.
Settlement distribution along the horizontal line passing at the depth of 1 cm below the bamboo raft.
It can be observed that the raft-with-legs foundation uniformly settles under the applied load, exhibiting a rigid-body vertical movement due to the high stiffness of the bamboo material with respect to the surrounding soil (Figure 13a,b). The maximum primary settlement of the raft with legs is about 5.4 mm, without great differences between the two investigated cross-sections (Figure 14). As expected, the absence of the four legs causes a higher primary settlement of the bamboo raft, although the increase is marginal, as illustrated in Figure 14.
It should be remarked that, in both cases, the computed settlements related to the primary consolidation process are lower than 1 cm, suggesting that the measured displacements are mainly due to secondary consolidation phenomena, probably with further effects related to dynamic marine actions. A progressive reduction in the subsidence rate should therefore be expected over the coming years.
Further research is warranted to explore the potential role of localized erosion phenomena. This could be achieved through large-scale physical modeling that replicates the hydrodynamic response of the mud suspension when transported through the reefs.
6. Concluding Remarks
This study has analyzed monitoring data concerning the subsidence of a soft seabed related to the deployment of AR units near the international airport of Hong Kong and has interpretated these data in the light of settlement calculations. The main conclusions can be summarized in the following points:
- -
- The most widespread seabed subsidence after the first service year of the AR was about 25 cm, preserving suitable biological conditions in terms of depth below sea level.
- -
- The adopted mixed foundation suffered null or low horizontal drift of the AR units, suggesting the efficacy of the lateral resistance of the “piles” under the marine dynamic actions.
- -
- The vertical settlements of the foundations recorded over the first year can be justified by invoking a secondary consolidation process and possible hydrodynamic phenomena, since the primary consolidation amount resulting from calculation for static condition is less than 1 cm, that is, a small amount of the total observed subsidence.
In terms of guidelines for the design and monitoring of future works, the results of this study seem to confirm the usefulness of legs in preventing the drift of the foundation and suggest the importance of deepening the secondary consolidation modelling to predict the bathymetric evolution with time of artificial reefs in similar geotechnical contexts. Moreover, a possible development of the research concerns the quantification of the reef’s durability by analyzing in detail the degradation of the employed materials in a marine environment.
Author Contributions
Conceptualization, E.D. and M.N.; Methodology, F.C.; Software, A.d.L. and A.G.; Investigation, E.D., M.N., F.C., A.d.L. and F.S.; Data curation, F.S.; Writing—original draft, M.N., F.C. and A.d.L.; Supervision, F.C. All authors have read and agreed to the published version of the manuscript.
Funding
This research received no external funding.
Institutional Review Board Statement
Not applicable.
Informed Consent Statement
Not applicable.
Data Availability Statement
The data presented in this study are available in the article.
Acknowledgments
The authors would like to thank Airport Authority Hong Kong (Client), Kat Yue Construction Engineering Ltd. (Main Contractor) and ESL Hong Kong (Surveying & Mapping) for the geological and bathymetric survey data used in this work.
Conflicts of Interest
Enrico Dini holds the position of chairman and is a shareholder of D-Shape Srls, based in Italy, as well as D-Shape Limited, incorporated in Hong Kong. Mario Nuzzolese is a shareholder and the chief executive of D-Shape Limited in Hong Kong. The remaining authors declare that the research was conducted in the absence of any commercial or financial relationships that could be construed as a potential conflict of interest.
Notation
| AR | Artificial reef |
| Cc | Compression index |
| cα | Secondary consolidation coefficient |
| E | Compressive modulus of elasticity |
| Eoed | Oedometric modulus |
| e | Void ratio |
| Rinter | Strength reduction factor |
| γ | Total unit weight |
| δsoil-pile | Soil-pile friction angle |
| ν | Poisson’s ratio |
| ϕ | Friction angle |
References
- Galdo, M.I.L.; Guerreiro, M.J.R.; Vigo, J.L.; Rodriguez, I.A.; Lorenzo, R.V.; Couce, J.C.C.; Couce, L.C. Definition of an Artificial Reef Unit through Hydrodynamic and Structural (CFD and FEM) Models–Application to the Ares-Betanzos Estuary. J. Mar. Sci. Eng. 2022, 10, 230. [Google Scholar] [CrossRef]
- Meinhardt, Hong Kong, Ltd. Airport Master Plan 2030 Contract P131 Initial Land Formation Engineering Study Final Construction Options Report; Meinhardt, Hong Kong, Ltd.: Hong Kong, China, 2009. [Google Scholar]
- Agriculture Fisheries and Conservation Department, PORT SURVEY 2016/17. Available online: https://communities.bentley.com/products/geotech-analysis/b/blog/posts/plaxisconnecteditionv20update1 (accessed on 10 December 2023).
- Kambey, A.D.; Bataragoa, N.E.; Wantasen, A.S. Study on Artificial Reef Made of Bamboo “Bambooreef” in Malalayang Dua Waters, Malalayang District, Manado. J. Ilm. PLATAX 2017, 5, 1–9. [Google Scholar] [CrossRef]
- Waruwu, A. Bamboo Reinforcement in Shallow Foundation on the Peat Soil. J. Civ. Eng. Res. 2014, 4, 96–102. [Google Scholar]
- Yun, D.H.; Kim, Y.T. A Study on Settlement Reduction of Artificial Reefs Using Geosynthetics. In Proceedings of the 6th Asian Regional Conference on Geosynthetics, New Delhi, India, 8–11 November 2016. [Google Scholar]
- Yun, D.H.; Kim, Y.T. Behaviours of Artificial Reef Reinforced with Settlement Reduction Reinforcement. J. Korean Geosynth. Soc. 2019, 18, 1–9. [Google Scholar]
- Yun, D.H.; Kim, Y.T. Scour Characteristics of Artificial Reef through Experiment and Numerical Analysis. J. Korean Geosynth. Soc. 2019, 18, 23–32. [Google Scholar]
- Hegde, A.; Sitharam, T.G. Use of Bamboo in Soft-Ground Engineering and Its Performance Comparison with Geosynthetics: Experimental Studies. J. Mater. Civ. Eng. 2015, 27, 04014256. [Google Scholar] [CrossRef]
- Cotecchia, F.; Vitone, C.; Sollecito, F.; Mali, M.; Miccoli, D.; Petti, R.; Milella, D.; Ruggieri, G.; Bottiglieri, O.; Santaloia, F.; et al. A geo-chemo-mechanical study of a highly polluted marine system (Taranto, Italy) for the enhancement of the conceptual site model. Sci. Rep. 2021, 11, 4017. [Google Scholar] [CrossRef] [PubMed]
- Sollecito, F.; Plötze, M.; Puzrin, A.M.; Vitone, C.; Miccoli, D.; Cotecchia, F. Effects of bio-chemo-mechanical processes on the properties of contaminated marine sediments. Géotechnique 2021, 73, 506–520. [Google Scholar] [CrossRef]
- Sanchez Vivas, L.; Mullins, G.; Cunningham, J.A.; Mihelcic, J.R. Mechanical properties of bamboo: A research synthesis of strength values and the factors influencing them. J. Am. Bamboo Soc. 2019, 29, 1–21. [Google Scholar]
- Tang, G.; Sun, P.; Zhao, Y.; Yin, L.; Zhuang, H. Experimental research on friction coefficient between grain bulk and bamboo clappers. IOP Conf. Ser. Mater. Sci. Eng. 2017, 274, 012116. [Google Scholar] [CrossRef]
- Van Chau, T.; Jung, S.; Na, W.-B. Measurement and prediction of the initial settlement of cube-type artificial reefs caused by free-fall installation using a laboratory-scale experiment, regression analysis, and numerical collision analysis. Ocean. Eng. 2021, 223, 108643. [Google Scholar] [CrossRef]
- Bentley (2022). PLAXIS 3D CE V22, Reference Manual 2022.


Disclaimer/Publisher’s Note: The statements, opinions and data contained in all publications are solely those of the individual author(s) and contributor(s) and not of MDPI and/or the editor(s). MDPI and/or the editor(s) disclaim responsibility for any injury to people or property resulting from any ideas, methods, instructions or products referred to in the content. |
© 2024 by the authors. Licensee MDPI, Basel, Switzerland. This article is an open access article distributed under the terms and conditions of the Creative Commons Attribution (CC BY) license (https://creativecommons.org/licenses/by/4.0/).