Abstract
Directive 2017/164/EU proposed a drastic reduction of nitrogen monoxide (NO) and nitrogen dioxide (NO2) levels, thereby fortifying the health protection framework within the mining industry. Despite the commendable record of non-road emissions standards (Stage IV and V) in continuing to reduce NOx emissions, concerns remain about compliance with the directive’s strict limits, particularly in demanding tunnels and mining fields. To illustrate this problem, this study undertakes a comprehensive assessment of the practical feasibility surrounding the implementation of these proposed limits in a 6.2 internal diameter tunnel-boring machine (TBM) tunnel constructed with Stage III emission locomotives. The results cast light upon the formidable challenges entailed in achieving strict compliance with the envisioned limits, with a substantial number of measurements notably surpassing these thresholds, primarily concerning NO2 emissions from Stage III engines. To address these challenges, this study highlights the key role of moving to Stage IV-V locomotives or introducing electric locomotives to effectively reduce NOx emissions, ensure compliance with the directive, and avoid delays in tunnel construction.
1. Introduction
Directive 2017/164, published on 31 January 2017, proposed new indicative occupational exposure limit values (IOELV) with the aim of increasing health protection in mines. This directive called for a significant reduction in nitrogen monoxide (NO) levels from 25 ppm to 2 ppm, and nitrogen dioxide (NO2) levels from 3 ppm to 0.5 ppm. However, concerns have arisen about the feasibility of implementing such stringent limits, especially in the context of tunnelling and underground mining activities [1]. The directive allows for a transitional period until August 2023 [2], during which measures need to be taken to comply with the proposed reductions.
On the other hand, the progression of emissions standards for non-road machinery throughout the past two decades highlights a substantial and ongoing commitment to the reduction of NOx emissions. The transition from less stringent Stage I (1999) and Stage II (implemented from 2001 to 2004) regulations to the more rigorous Stage III (enforced from 2006 to 2013) and Stage IV (introduced in 2014) standards vividly demonstrates a continuous commitment to emissions reduction. Notably, the permissible level of NOx emissions for engines with a net power range of 130 to 560 kW evolved as follows: 9.2 g/kWh in Stage I, reduced to 6 g/kWh by the conclusion of Stage II, and further lowered to 2 g/kWh at the end of Stage III. Stage IV engines, however, adhere to an exceptionally stringent NOx emission limit of just 0.4 g/kWh. Importantly, Stage V, established in 2019, maintains the same NOx emission limit as Stage IV. This remarkable decrease in permitted emissions clearly demonstrates the significant breakthroughs made in emissions control technology and procedures. The legislative development from Stage I/II to Stage III/IV represents a determined attempt to reduce NOx emissions from machinery, with each level reducing emission thresholds and fostering technical advancement to set the groundwork for a cleaner and more sustainable future.
In response to these concerns about NOx Directive 2017/164 and Stage V application, plant manufacturers are exploring alternatives to traditional diesel power, such as electric or hydrogen fuel-powered motors, as well as adopting emission control systems like diesel particulate filters (DPFs) and selective catalytic reduction (SCR) [2,3].
While efforts are being made to comply with the new limits, there is a lack of published studies on nitrogen oxides (NOx) in tunnel construction or mining activities. A study conducted in a tunnel that was constructed using the New Austrian tunnelling method (NATM) indicated that significant efforts are required before 21 August 2023, to meet the directive requirements [3]. Similarly, an investigation in an underground tungsten mine using the room and pillar mining methods reported NO2 and CO values that exceeded the directive limits [4]. Also, a magnesite and dolomite underground mine, exploited using the post pillar and sublevel open stopping methods, showed NO2 values surpassing the directive [4]. Similar levels were also shown in a Swedish iron ore mine [5]. Furthermore, the Health and Safety Executive (HSE) reported average NO values of up to 3 ppm and NO2 values of up to 1.9 ppm in a sewer drill and blast tunnel [6]. In addition to studies assessing NOx concentrations in tunnel construction and mining activities, there have been previous studies that estimate the emissions of nitrogen oxides (NOx) in tunnel motorway construction [7,8].
The global tunnel-boring machine market is experiencing significant growth, but there are limited data on NOx emissions during tunnel construction with tunnel-boring machines (TBMs). TBMs are preferred for their avoidance of explosives, which are a major source of NOx emissions in tunnelling construction activities [9].
In recent decades, mounting concern has surrounded NOx exposure due to its significant health implications. Peaks in NO2 levels have been linked to increased hospital admissions [10], with a particular emphasis on its concentration in enclosed spaces that are exposed to exhaust emissions [11]. The consequences of prolonged and intense exposure to nitrogen dioxide (NO2) in confined areas can be severe, occasionally resulting in fatalities. Even at low concentrations, NOx has been associated with respiratory problems, respiratory infections, and stroke [12].
Fatality resulting from NO2 inhalation is attributed to bronchospasm, pulmonary edema, hypoxemia, and respiratory acidosis [13]. Furthermore, studies have established a correlation between lower NOx concentrations and fatalities related to respiratory illnesses [14].
Workers exposed to NO2 may experience symptoms like irritation, coughing, and dyspnea, which can persist for extended periods, even at modest exposure levels. Severe exposure can manifest as coughs, chest pain, dyspnea, cyanosis, and pulmonary edema. Additionally, exposure to NO2 can induce the production of nitrosamines, some of which are associated with cancer risk [15]. Monitoring NO2 levels not only aids in identifying diesel emissions but also indicates the presence of other anthropogenic pollutants [16], often correlating with elemental carbon concentrations [17].
It is important to note that nitric oxide (NO) is inherently unstable in the air, spontaneously oxidizing to NO2. This oxidative process can potentially lead to DNA strand breakage and mutagenic base changes upon exposure [18].
NOx in tunnels primarily originates from diesel engines burning fuel that reacts with airborne water vapor, forming acids that damage human lungs and cause chronic illnesses [19]. Additionally, tunnel-boring machines (TBMs) are equipped with emergency generators, which are only used in the case of power supply failure or for high voltage (HV) cable extensions.
The objective of this study is to evaluate the feasibility of implementing the indicative occupational exposure limit values (IOELV) suggested in Directive 2017/164/EU and to provide detailed information on NO2 concentrations in a TBM tunnel during construction. We have selected a medium-diameter tunnel as an example, as these tunnels pose greater challenges for ventilation and may more easily exceed the proposed limits.
2. Materials and Methods
2.1. Tunnel-Boring Machine (TBM)
An Earth Pressure Balance Shield (EPB) TBM was selected for use in cohesive soils with high clay, mud, or silt contents and low water permeability. The TBM’s cutting wheel excavates the soil while also serving as support for the tunnel face to prevent settlement. Additives such as foam are used to condition the excavated material for conveyance [20,21]. Ten gantries are installed behind the shield, housing mechanical devices for transporting segments, handling grout, and supplying hydraulic and electric energy. The gantries also contain primary cooling circuits and the primary air ventilation system. The TBM had a total length of 110 m and required a crew of 20 workers, including various roles such as the pit boss, lead miner, TBM driver, erector driver, ring builders, segment feeder and belt extension operators, TBM engineer, fitters, electricians, surveyor, cleaner, and assistants.
The TBM cycle is divided into the following parts:
- (a)
- Advance Preparation: The logistic process is adjusted to ensure that the grout and segment trains arrive just as the ring build is completed. Grout is pumped from the grout car into the permanently installed grout tank on the gantry, and segments are loaded into the segment feeder’s unloading area.
- (b)
- Advance Mode: Once the ring build is finished, the TBM driver activates the advance mode. The driver controls various parameters, including the EPB pressure in each sensor, the advance rate, tail skin articulation, tail seal compound, shield articulation, foam injection, screw conveyor, belt scales, and cutting wheel. The duration of this phase generally ranges from 15 to 40 min.
- (c)
- Grouting: While the TBM is in advance mode, the grout man injects grout into the last constructed ring to prevent settlements. Grout is injected via four independent grout pumps, each serving one grout line in the tail skin.
- (d)
- Ring Build: After the advance is completed and the tail skin clearance is measured, the lead miner, erector driver, and two miners start constructing the ring, following a predefined sequence generated via an informatics program. The ring build usually takes between 10 and 20 min.
- (e)
- Ancillary Operations: Other essential operations for TBM progress include belt extension, track extension, pipes extensions, and other necessary services.
2.2. Locomotives
The project utilized Schoma CHL 200G 40-tonne tunnel locomotives for hauling materials to the operating tunnel-boring machines. The locomotives comply with EU regulation 2004/26/EC stage IIIA and US standard EPA TIER III for exhaust emissions. They are specified as follows:
- Loco weight: 40 t;
- Power: 200 kW;
- Track gauge: 900 mm;
- Loco width: 1600 mm;
- Fire suppression system for the engine compartment with semi-automatic activation;
- Particulate filter CRT for regeneration (exhaust system silencer);
- Color video system;
- Additional driver’s control panel within the man-riding vehicle (loco and man-rider form one unit with control panels at each end);
- Fitted radio system for communication with the rail movement control room (RMC), and other locomotives.
The locomotives are designed to handle a maximum gradient of 3.7%, with an extra 2–3% capacity for short-length climbs into fixed crossings. They have a maximum haulage capacity of 85 tonnes and a maximum speed of 30 km/h. Equipped with hydrostatic drive transmission and a retarder, they can maintain a constant downgrade speed without using pneumatic wheel brakes. An electronic control system allows the driver to run the train at a pre-set constant speed. The locomotives are the primary source of NOx emissions in the tunnel, with a theoretical NOx emission of 4 g(HC + NOx)/kWh when 90% of the mixture NOx is NO.
2.3. Ventilation System
The primary ventilation system, known as blowing ventilation, consists of a three-stage fan with a power of 250 kW and a nominal diameter of Ø1.4 m. Air is blown through an Ø1.6 m ventilation duct, which is stored in segments of 100 m in a cassette system. This system allows for easy cassette change and duct extension. The primary ventilation system is designed to provide approximately 17 m3/s at the tunnel face (about 25 m3/s at the fan) when the tunnel reaches its maximum length of 6800 km. The fan selected for temporary ventilation during tunnel excavation is the Zitron Axial type ZVN 1-14-250/4.
The secondary ventilation system, known as exhaust ventilation, circulates air in the TBM and the tunnel. It sucks air from the front of gantry one and blows it behind the ventilation cassette, ensuring air circulation of the TBM despite the primary ventilation’s output being at the end of the gantries. This system consists of a 0.6 m diameter steel air tube and a 15 kW ventilator located on the top level of the gantry.
2.4. Gas Monitoring
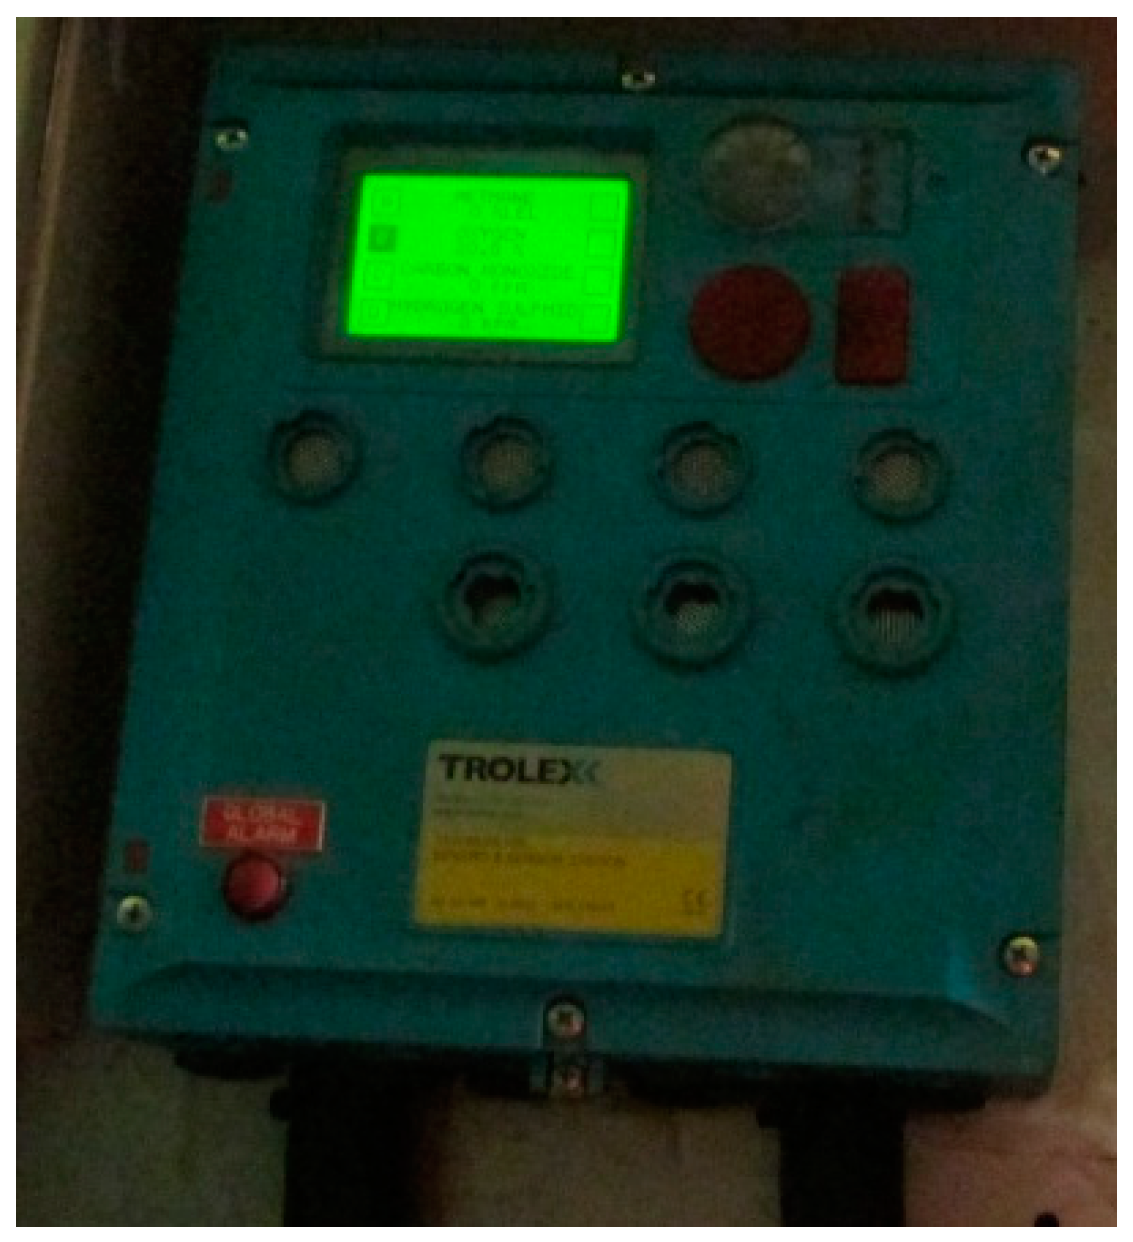
A stationary gas measurement system (Figure 1) is installed on the TBM and gantries to measure gas concentrations at the height of 1.5 m, which is recommended for environmental and occupational measurements [22,23].
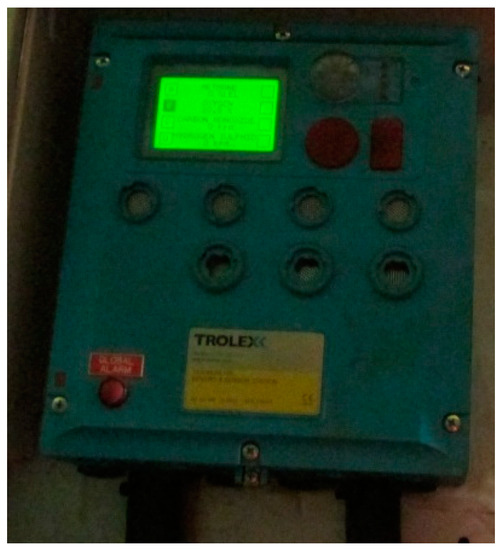
Figure 1.
Trolex fixed gas monitoring station.
The gas-monitoring system (GMS) sensors are divided into two groups, one located in the TBM next to the man locks and the other in the main control box at gantry two. The incoming data are continuously evaluated and stored in the data logging system, and displayed on the operator control cabin display to indicate gas levels. A horn signal is given when a limit value is exceeded to warn all personnel working with the TBM.
The gas monitoring system includes electrochemical sensors for NO2 gas detection with specific linearity, range, and resolution information. The TBM stores the average gas concentration during the excavation cycle, and every time the TBM operator presses the ring-built button, the average gas concentration per ring is recorded. The gas monitoring equipment specifications are as follows:
NO2 Sensor:
- Range: 0 to 20 ppm;
- Linearity: 2%;
- Time Response: <20 s;
- Resolution: 1 ppm.
The measurement method used in this study has been found to be entirely valid for the current established limits, at that time. However, it should be noted that in the event of a substantial reduction in occupational exposure limit (OELV) levels, the current measuring equipment may no longer be the most suitable.
Understanding the repercussions of a significant decrease in OELV levels, especially concerning nitrogen dioxide (NO2) concentrations, is crucial. The measurement equipment utilized in this study is considered valid and reliable for this purpose. It will allow for an accurate assessment of any changes in NO2 levels, enabling informed decisions to protect workers’ health and maintain air quality in the work environment.
2.5. Sample Design
The TBM crew can be considered a similar exposure group (SEG), since the workers move around the TBM during their shift. According to the UNE-EN 689 standard [24], at least 3 to 6 representative exposure measurements are required for workers in each SEG. Continuous monitoring using the Trolex station with a 24/7 alert system provides representative NOx levels during the TBM tunnel construction. The monitoring setup meets and exceeds the requirements outlined in Technical Instruction 04.7.06 of the General Regulation on Basic Mining Safety Standards adopted in Spanish Royal Decree 863/1985 of 2 April 1985. This instruction demands a minimum of 30 samples of at least 10 s each when using direct reading devices; the continuous monitoring in this study surpasses these requirements.
2.6. Limits
Occupational exposure limit values (OELVs) and short-term OELVs are crucial in ensuring worker safety. OELVs represent the average exposure during a work schedule of 8 h per day and 40 h per week, while short-term OELVs refer to the 15 min exposure that should not be exceeded at any time during a workday, even if the 8 h OELV is within limits.
According to Spanish and European legislation until August 2023, the recommended OELVs for NO and NO2 in mining and tunnelling activities are 25 ppm and 2 ppm, respectively, with corresponding short-term OELVs of 30 ppm and 5 ppm. However, Directive 2017/164/EU proposed significant reductions in NOx limits, with the proposed OELVs for NO being 2 ppm and NO2 being 0.5 ppm. The short-term OELV for NO2 was proposed at 1 ppm. Table 1 provides a comparison of the current limits and the proposed limits.

Table 1.
OELVs in mining: current limits and proposed limits.
Directive 2017/164/EU proposed a drastic reduction in NOx limits. It is essential to note that the proposed reduction in NOx limits in Directive 2017/164/EU is already being implemented in other underground activities, such as works in underground car parks. However, the proposed levels will be subject to review before the transitional period ends. The directive acknowledges that there are currently difficulties with the availability of measurement methodologies that could be used to demonstrate compliance with the proposed limit value for nitrogen dioxide in underground mining and tunnelling environments [25,26].
3. Results
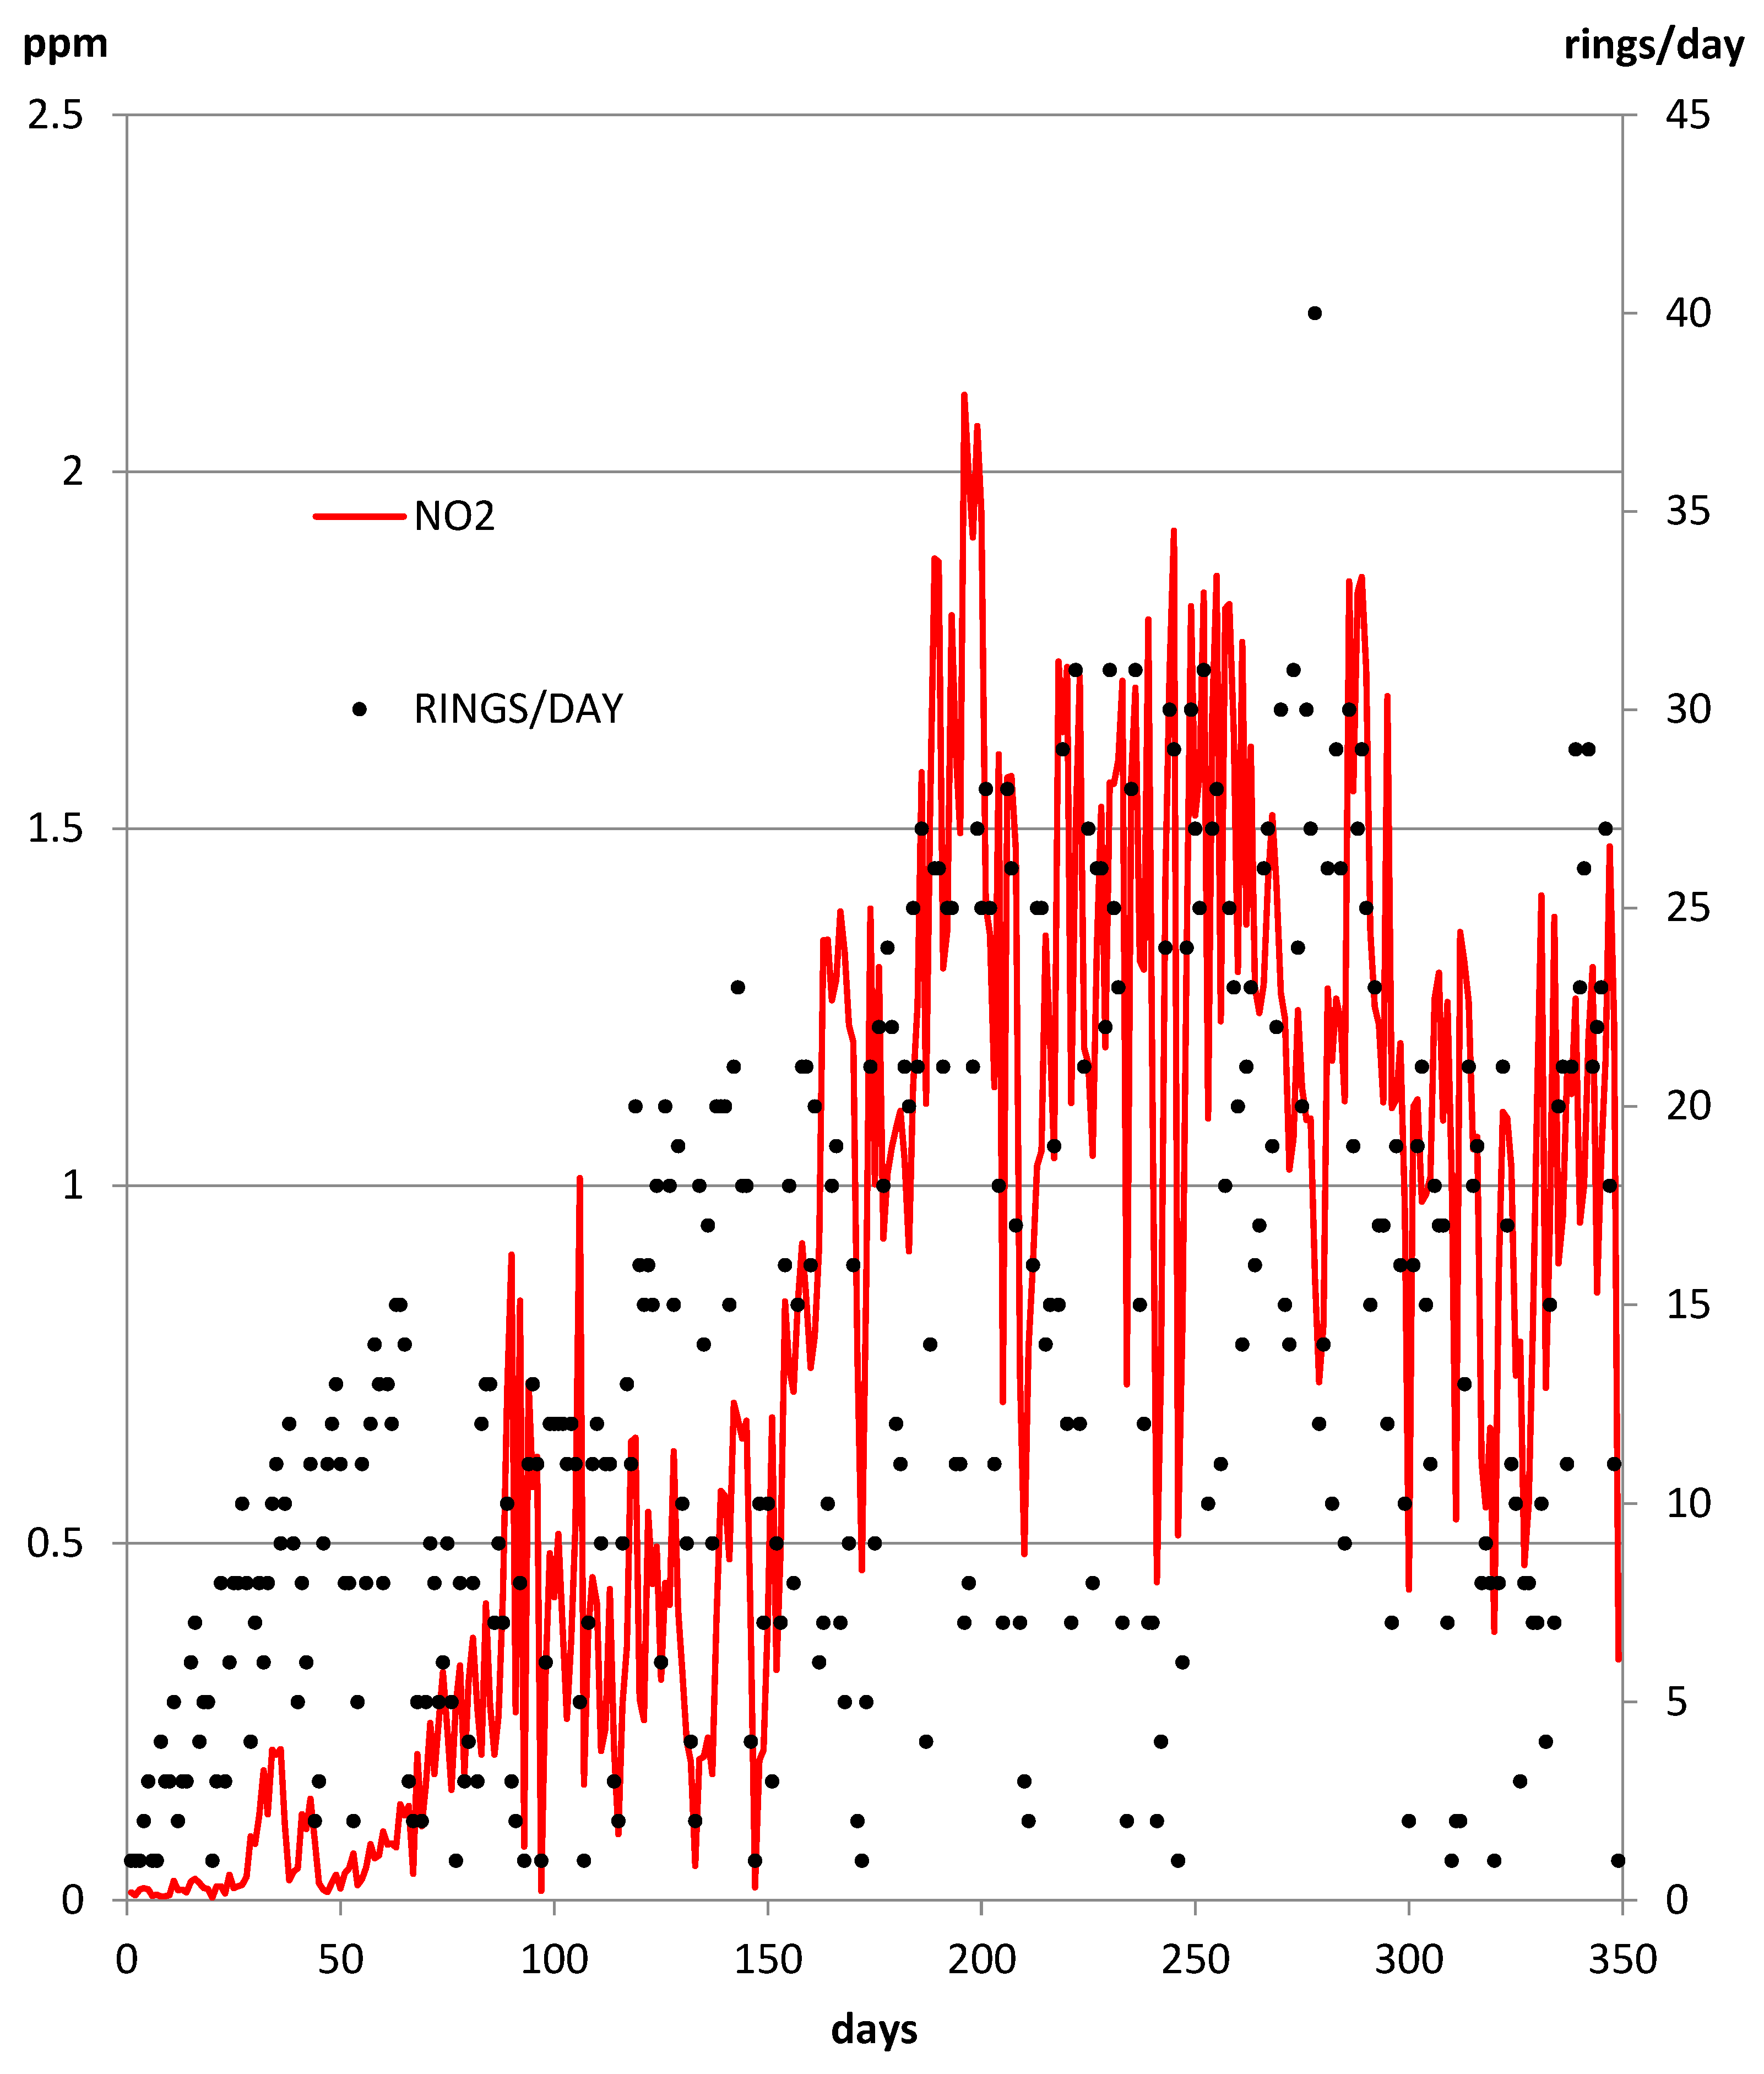
To gain a comprehensive understanding of the issue, Figure 2 illustrates the daily NO2 averages along with the daily TBM ring production. A clear relationship can be observed between the TBM’s production and an increase in NO2 levels in the TBM. As the TBM production increases, the number of locomotives required for transporting rings, grout, and other materials also increases, leading to higher NO2 emissions in the TBM. Additionally, Figure 2 shows a correlation between the tunnel length and NO2 levels. As the tunnel length increases, the TBM’s performance improves, but this improvement is accompanied by an increase in NOx levels. Furthermore, the reduction of airflow at the tunnel face due to the expansion of the tunnel length also contributes to the higher concentration of NOx.
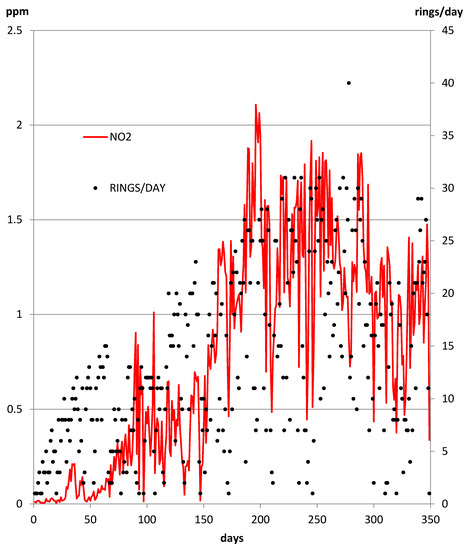
Figure 2.
Daily NO2 averages and daily TBM ring production.
The average NO2/NO ratio is 0.70 ppm NO2/ppm NO. This ratio provides important insight into the composition of NOx emissions in the tunnel and can be valuable for further analysis and mitigation strategies.
Overall, there were a total of 4640 NO2 readings collected throughout the 349-day construction period of the tunnel. The following section will analyze these data comprehensively, including individual data points and daily averages.
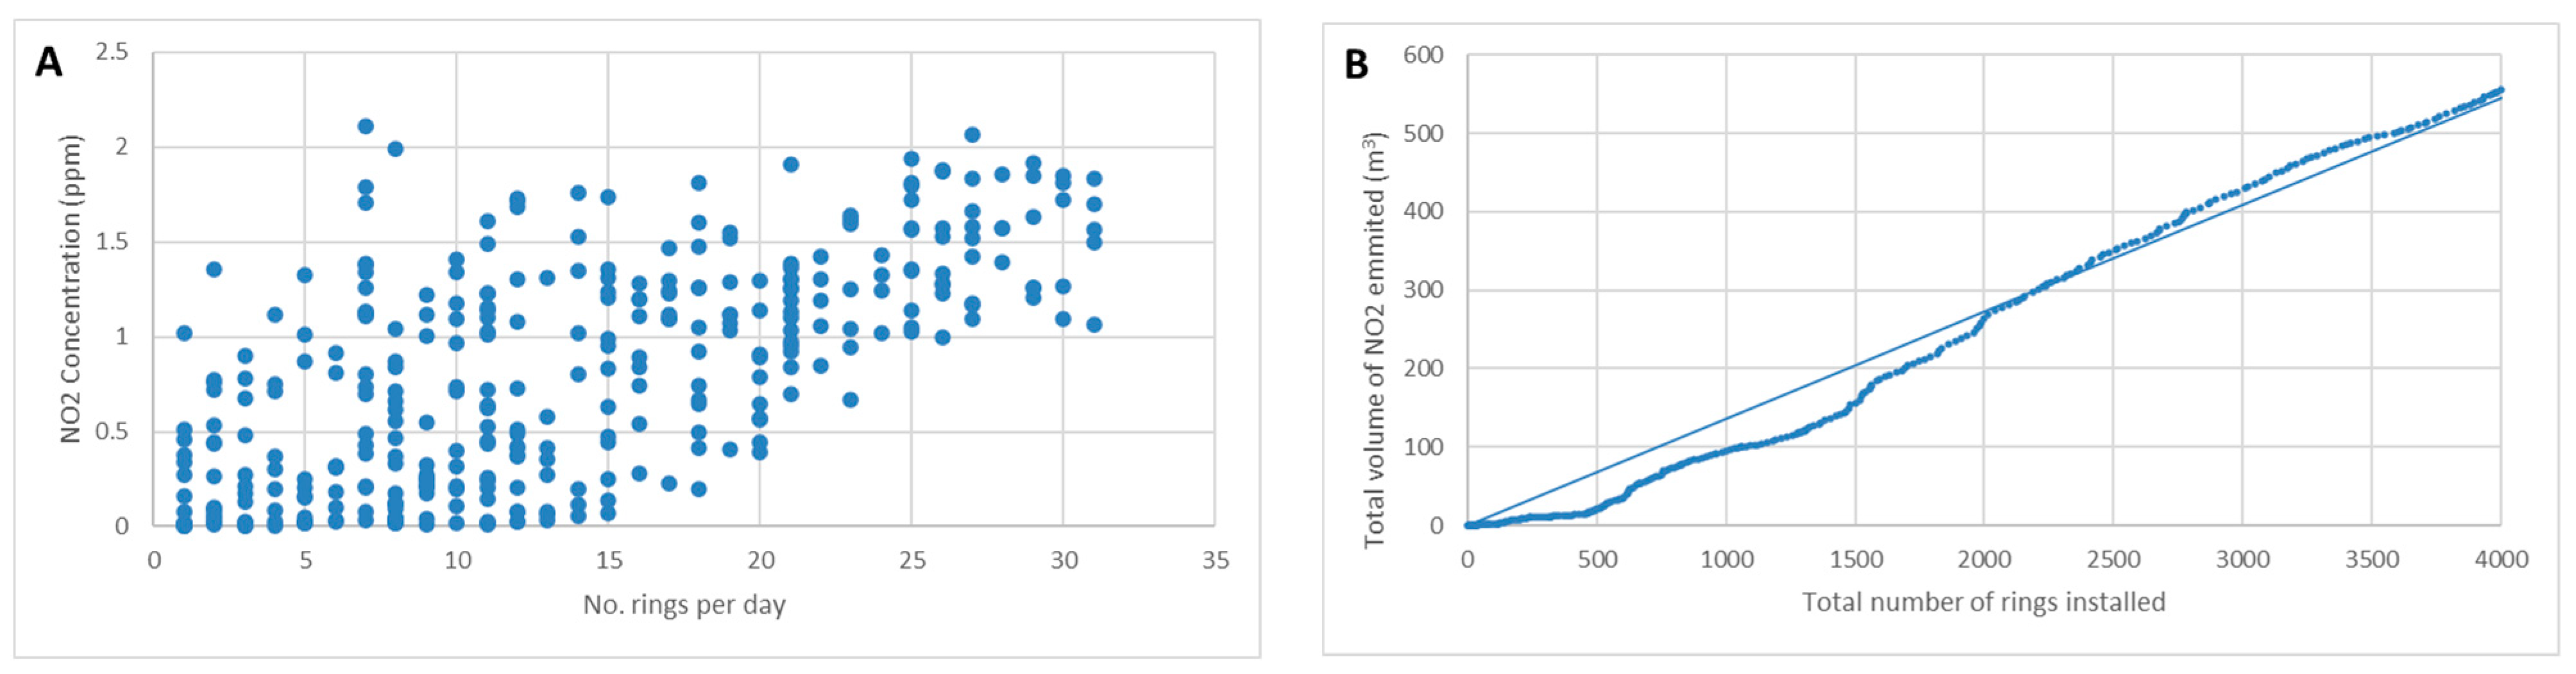
There is a clear relationship between the number of rings installed per day and the concentration of NO2 in the air. As seen in the graph in Figure 3A, the NO2 concentration increases as the number of rings increases. Although there is some dispersion in the results, a linear relationship can be established, with a correlation coefficient of r2 = 0.78. This is logical because the more rings are installed in a day, the more times locomotives have to enter the tunnel on that day, and therefore, the higher the amount of NO2 they have emitted inside the tunnel. However, this relationship becomes much more evident when representing the total volume of NO2 emitted inside the tunnel as a function of the total number of rings installed up to that point. As shown in Figure 3B, the relationship between these variables is much clearer. It should be noted that if the number of locomotives was continuously increased as the tunnel progressed, the relationship between these variables would be parabolic, as seen in the first part of the graph. In this case, beyond a certain tunnel length, the number of California crossings and, consequently, the number of locomotives inside the tunnel remains constant. As the decrease in air flow rate is nearly linear for large lengths, the concentration will increase linearly.
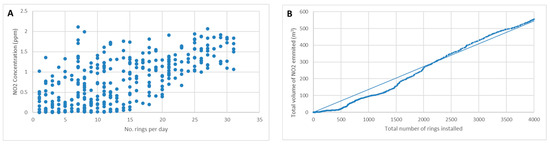
Figure 3.
Relation between number of rings installed and NO2 (A). NO2 emitted inside the tunnel vs. total rings installed (B).
4. Discussion
The data presented in Figure 2 underscore the dynamic nature of NO2 emissions during TBM tunnel construction and highlight the factors that influence their levels. They emphasize the necessity for the meticulous management of TBM production, locomotive usage, and ventilation to mitigate the impact on air quality and safeguard worker health. These findings shed light on the complexity of NO2 emissions in tunnel construction projects and underscore the importance of adopting effective strategies to minimize their adverse effects on the environment and the well-being of the workforce.
To assess the compliance with the current and proposed occupational exposure limit values (OELVs) for NO2, all available measurements were classified and summarized in Table 2 and Table 3, respectively. Table 2 indicates that, under the current OELV, 36 measurements exceed the limits. However, under the proposed OELVs in Directive 2017/164/EU, 3457 measurements exceed the proposed limits (74% of measurements exceed the limit for NO2), indicating a substantial potential for exceeding the legal thresholds if mitigation measures are not implemented effectively.
Table 2.
Number of NO2 measurements in relation to the current OELV and the proposed OELV.
Table 3.
Number of days with NO2 daily average in relation to the current OELV and the proposed OELV.
Table 3 presents the daily average concentration of NO2, and the corresponding number of days that exceed different concentration ranges in relation to the current and proposed OELVs. It reveals that, under the current OELV, all measurements are below the OELV. However, with the proposed OELV, 209 days (60% of the days) surpass the OELV.
Figure 4 demonstrates the percentage of days with different NO2 average concentrations under the current and proposed OELVs. While there are no significant concerns for NO2 concentrations within the current limits, approximately 60% of the days will surpass the limit under the proposed OELV, and 13% of the days will be close to the limits. These findings emphasize the urgent need for effective mitigation strategies to control NO2 emissions during TBM tunnel construction and ensure compliance with the proposed OELV.
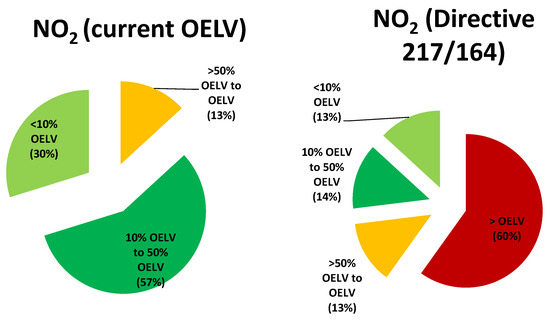
Figure 4.
Percentage of the days with different NO2 average concentrations.
Overall, the results reveal the potential challenges in meeting the proposed OELVs for NO2 during TBM tunnel construction.
4.1. Possible Technical Solutions
To meet the NO2 limit value (OELV = 0.5 ppm) proposed in Directive 2017/164/EU during TBM tunnel construction, various technical solutions are explored.
4.1.1. Performance Adjustment
Maintaining the current TBM tunnel facilities (including Stage III engines in the locomotives) while adhering to the directive’s OELV limit would impact TBM performance. One approach is to decrease TBM performance, resulting in fewer trips to transport materials and segments, and leading to reduced NOx emissions and lower gas concentrations in the tunnel atmosphere. For the case analyzed, where the TBM production was maintained at an average of 18 rings/day at its maximum length, 18 rings/day can be considered a realistic advancement rate.
To estimate the NO2 average concentration inside the tunnel, theoretical calculations were performed based on specific design parameters and measures following the below premises:
- -
- Maximum tunnel length: Lmax = 6880 m;
- -
- Average performance (average number of rings/day) = 18 rings/day;
- -
- Number of locomotives in the tunnel (NL): variable, from 1 to 4 locos in the tunnel simultaneously;
- -
- Locomotive speed: vL = 15 km/h;
- -
- Rings transported per trip = 1 ring;
- -
- Unloading time of the material in the TBM: t0 = 15 min;
- -
- Duration of the excavation cycle + ring placement: tC = 40 min;
- -
- Locomotive Power: PL = 200 kW;
- -
- Average power used by the locomotive (approx.): PM ≈ 30% PL;
- -
- NO2 emission rate: eNO2 = 3.0 g/kWh;
- -
- Minimum fresh airflow at the face: Q = 18 m3/s;
- -
- Diameter of the ventilation pipe: dT = 1.6 m.
Herein, we present a simplified calculation method to quantitatively analyze the issue. Our aim is not to conduct an exhaustive ventilation calculation but to provide a straightforward illustration of the limitations imposed by the new regulations and their practical implications. Although this method is theoretical in nature, the calculation parameters are derived from practical experience.
Suppose, at a given moment, that the tunnel’s length is denoted as L (meters), the locomotives’ speed as v (km/h), and a time t0 (hours) is taken for the ring installation maneuver. In this case, the time that a locomotive spends inside the tunnel for each ring, denoted as ti (hours per ring), is calculated as follows:
If nA rings are installed per day, the total time that the locomotives spend inside the tunnel, denoted as tL (hours per day), can be expressed as
The number of locomotives inside the tunnel simultaneously is determined by the need to ensure rapid ring installation to facilitate excavation. For short tunnels, a single locomotive (NL = 1) is sufficient. As the tunnel’s length increases, the number of locomotives is incrementally raised, up to a maximum of NL = 4. When the tunnel reaches its maximum length, it can accommodate three to four locomotives simultaneously, with an average taken as NL = 3.5.
Let us assume that a locomotive consumes an average power, PM (kW), during its work in the tunnel and transports one ring in each cycle. The total average power consumed by the locomotives in the tunnel, denoted as PMT (kW), is calculated as
The energy consumed by the locomotives in a day, denoted as EL (kWh/day), is given through the following equation:
If the locomotive’s NO2 emission rate is eNO2 (g/kWh), and the NO2 density is dNO2 (kg/m3), then the daily volume of NO2 emitted by the locomotives, denoted as VNO2 (m3/day), can be calculated as
For a uniform operation, the ring installation is distributed throughout the day, and this volume of NO2 will dilute into the incoming airflow over the course of the day. The average NO2 flow rate introduced into the tunnel, denoted as q (m3/s), is calculated as
If the clean air supply from the ventilation system is denoted as Q (m3/s), the average volume-based NO2 concentration within the tunnel, denoted as CNO2 (ppm), is calculated as
The theoretical curve of the flow rate as a function of the tunnel length is determined based on the fan’s characteristic curve and tunnel data. Assuming a ventilation pipe with a 1.6 m diameter, the flow rate Q (m3/s) can be calculated as follows:
The typical values for an installation with a 250 kW fan and a 1.6 m diameter pipe with minimal leaks are Qmax = 55 m3/s, Qmin = 25 m3/s, and c = 0.0004.
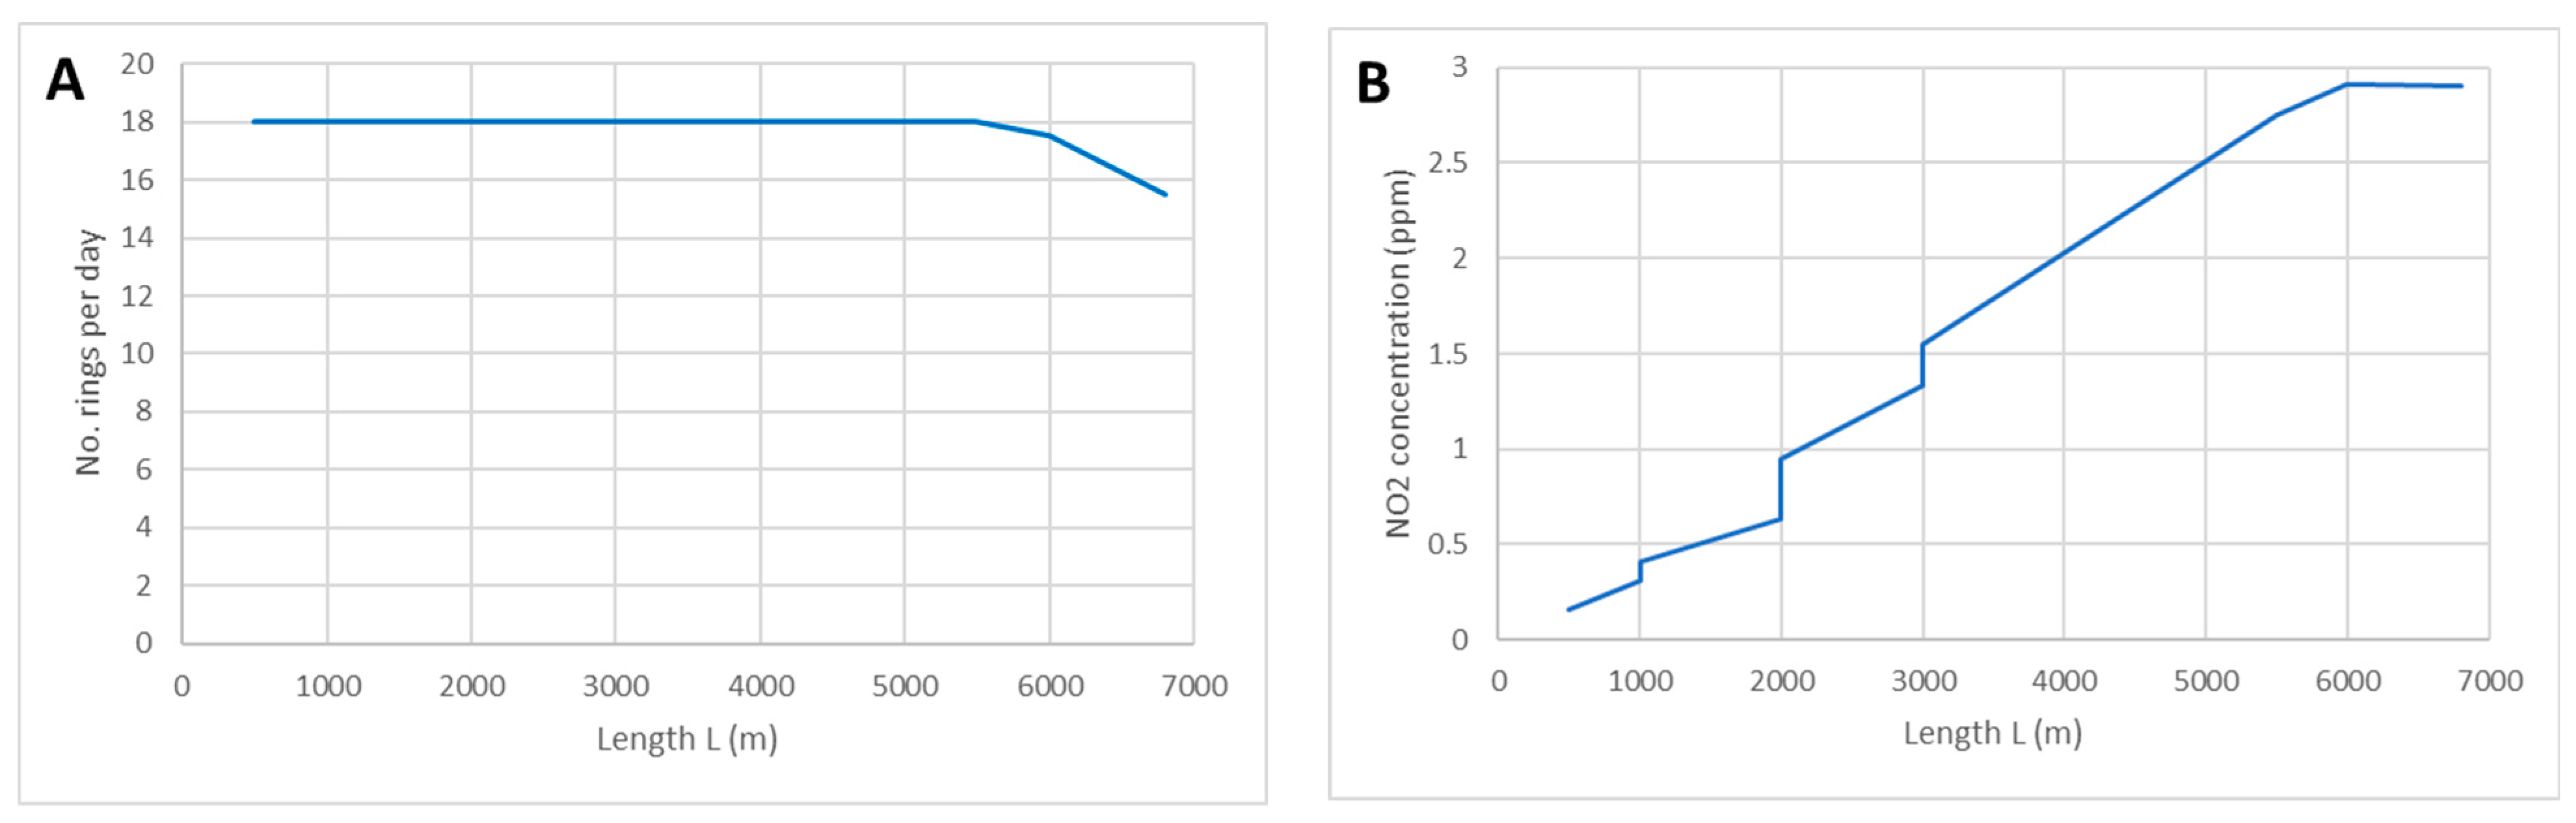
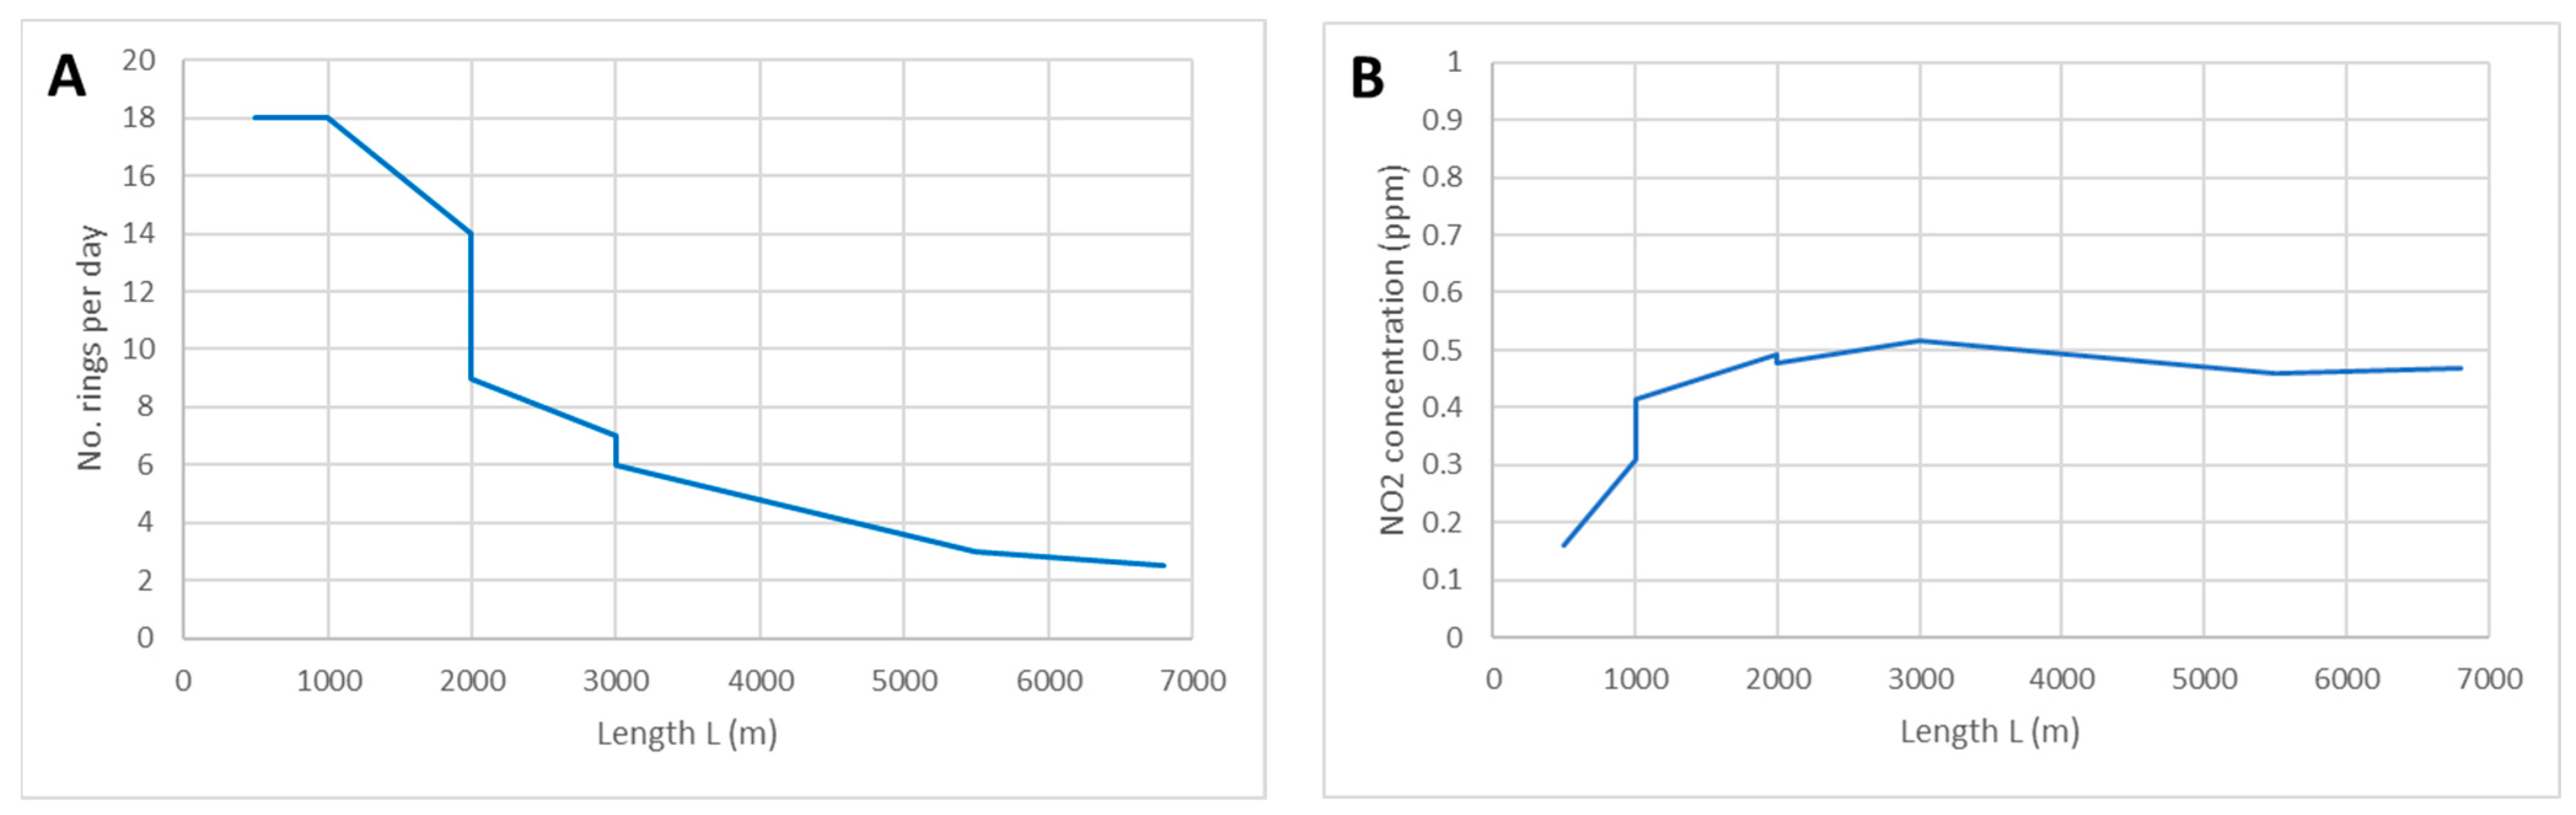
These calculations reproduced the actual situation, where a maximum advancing rate of 18 rings/day ensured that NO2 concentrations remained below 3 ppm, complying with the current legislation. Only a slight decrease in the advancing rate would be necessary for tunnel lengths beyond 5500 m (Figure 5).
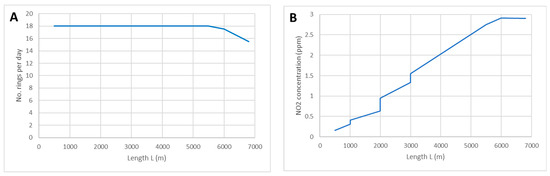
Figure 5.
TBM performance (A), and NO2 concentration under actual conditions (B).
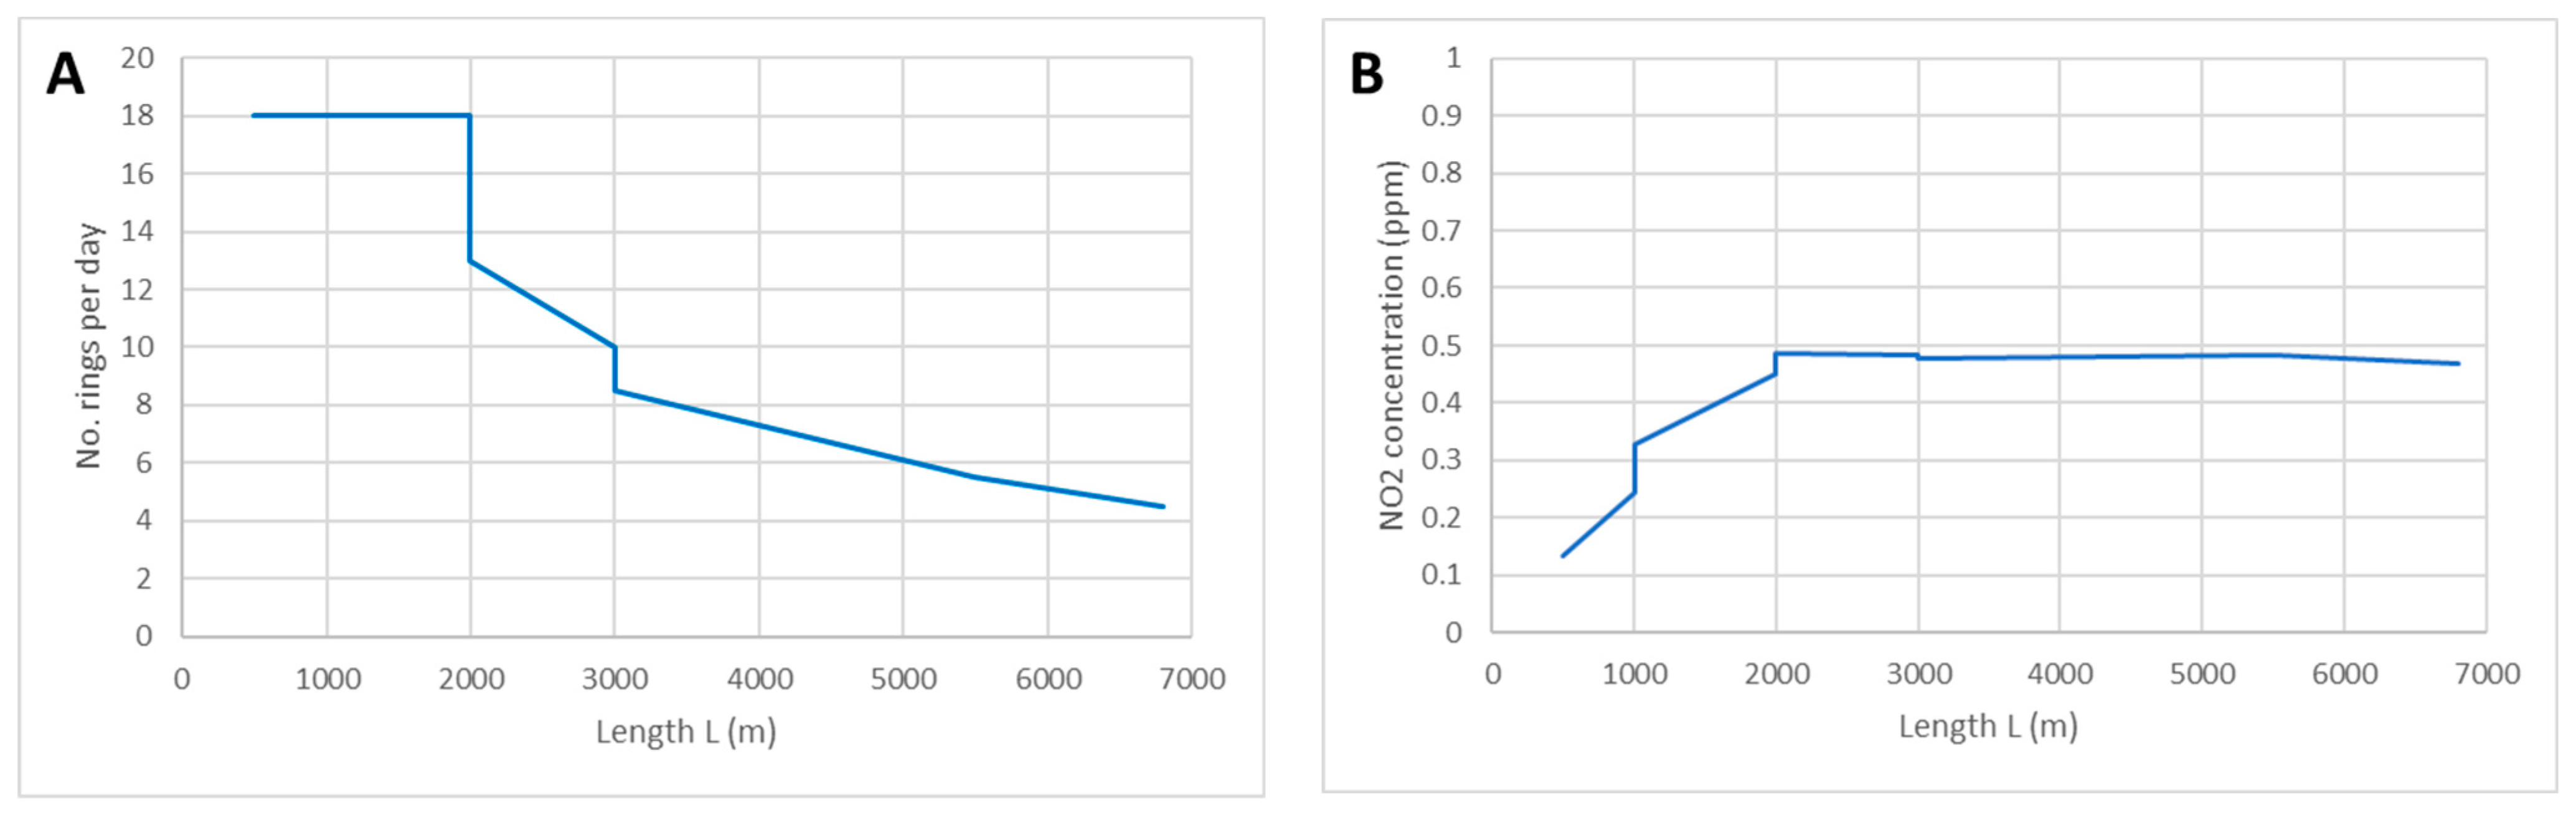
However, conforming to the new directive’s requirement without making modifications to tunnel facilities presents significant challenges. As the tunnel length exceeds 1000 m, maintaining an average performance of 18 rings/day would necessitate the operation of two locomotives. Upon reaching a tunnel length of 6500 m, the performance would need to be gradually reduced to 3 rings/day to meet the OELV (Figure 6). Implementing such performance reductions could result in potential economic losses, rendering this approach less feasible in practice. However, if real conditions lead to an advancement rate of less than 3 rings/day (e.g., due to difficult ground excavation), the tunnel could still be mined using the existing facilities and work schemes.
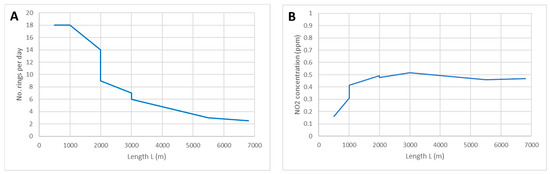
Figure 6.
TBM performance (A) and NO2 concentration to meet Directive 217/164’s requirements (B).
4.1.2. Changes in Current Operating Parameters
To maintain performance, changes to the current operating parameters are considered. One possibility is increasing the locomotive speed inside the tunnel. However, this theoretical proposal may conflict with other requirements of occupational risk prevention legislation, especially regarding safety and ground-borne noise in the medium-diameter tunnel.
Another parameter to be considered is increasing the ventilation [27], but space limitations in the medium-diameter tunnel make increasing ventilation bagging challenging. However, hypothetically increasing the ventilation pipe diameter to 2.0 m and achieving a realistic flow increase of up to 45 m3/s are contemplated. Even with these modifications (speed of 20 km/h and flow rate of 45 m3/s), sustaining an advancing rate of 18 rings/day is feasible only up to 2000 m, providing minimal improvement (Figure 7).
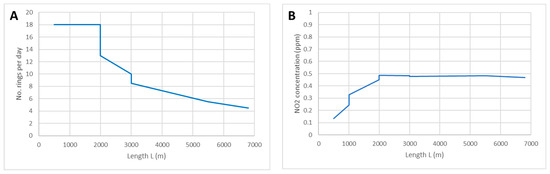
Figure 7.
TBM performance (A) and NO2 concentration to meet Directive 217/164’s requirements (increasing locomotive speed and ventilation) (B).
Increasing the number of locomotives inside the tunnel poses further challenges, as the proposed technical measures may be difficult to apply effectively. This highlights that diesel locomotives, similar to current models, might not be practical in most projects under the new directive’s requirements.
4.1.3. Reducing or Eliminating NOx Emissions at the Source
To address NOx emissions at the source, two potential solutions are considered:
- (a)
- Use Stage IV or Stage V engines in the locomotives, or locomotives equipped with diesel particulate filters (DPFs) and selective catalytic reduction (SCR) technologies
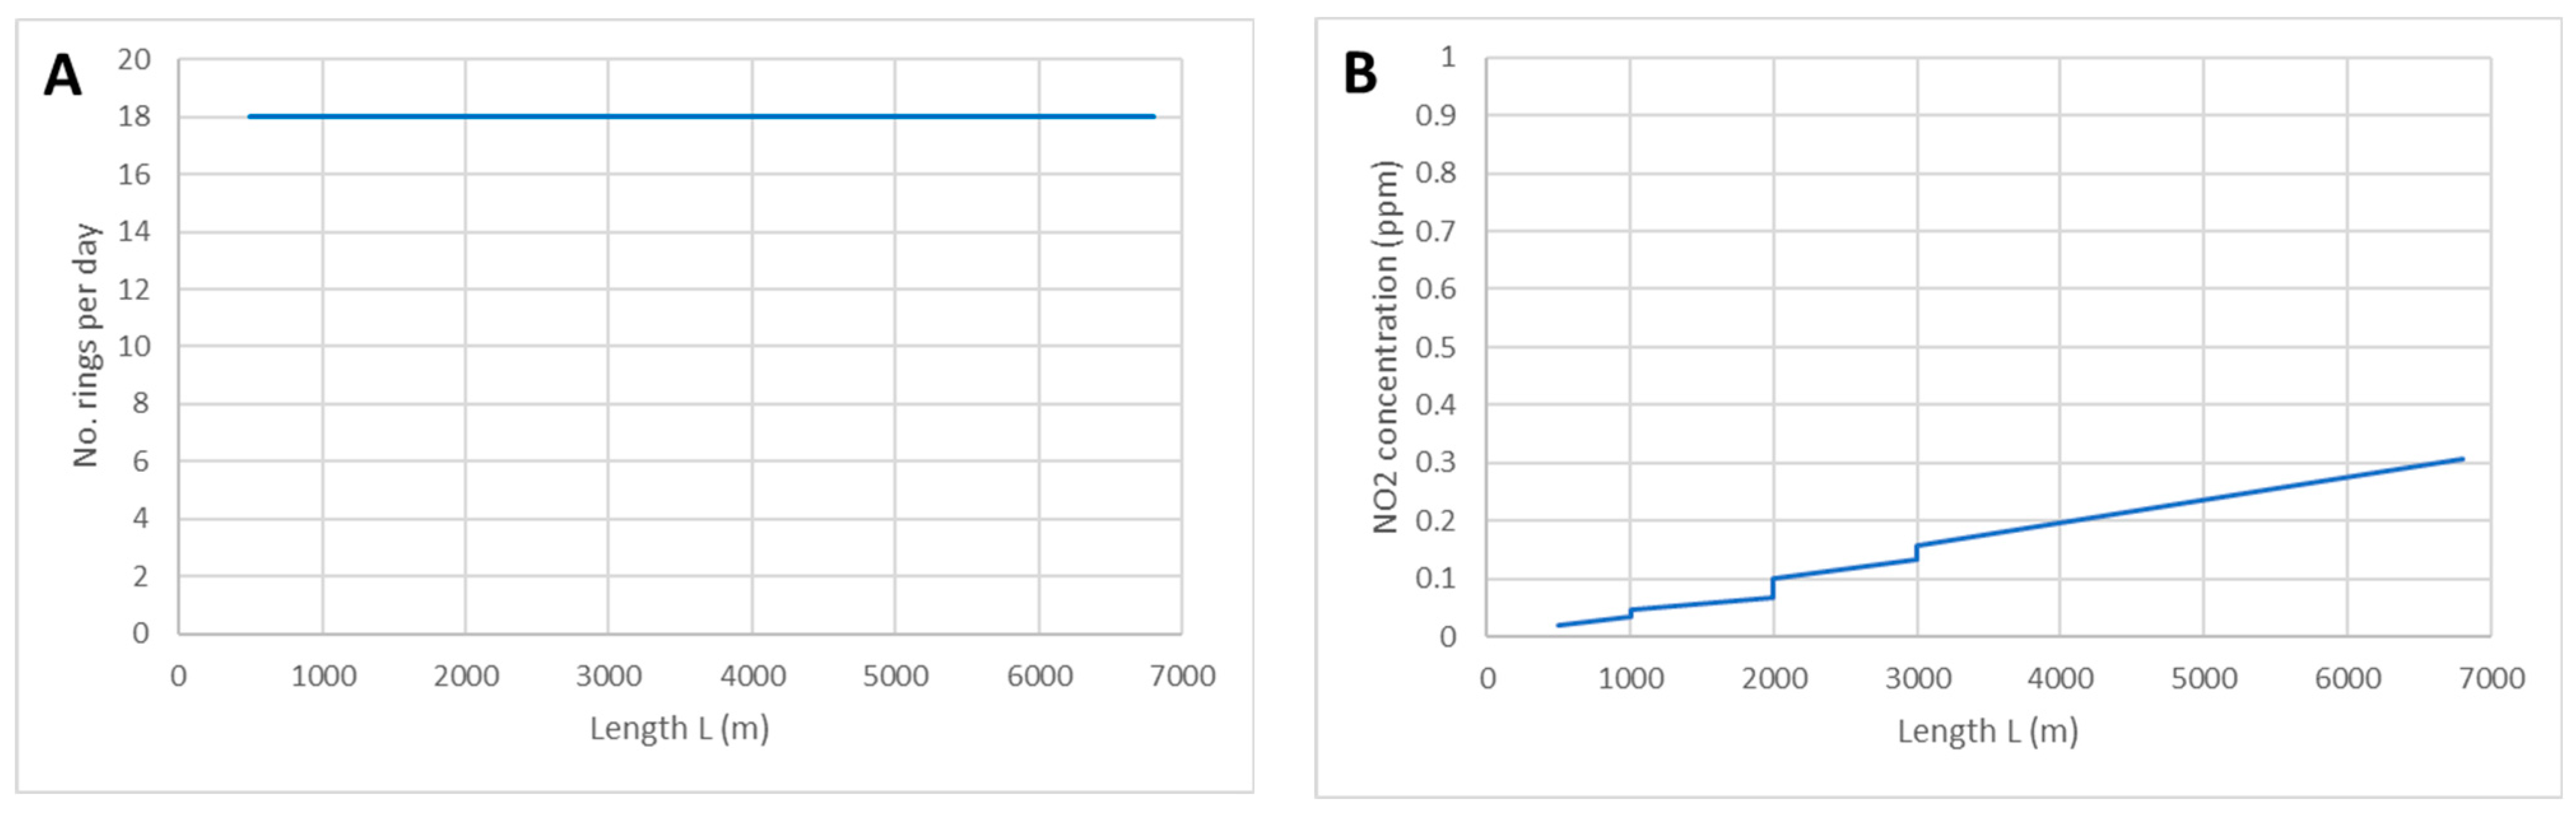
Stage IV and Stage V, utilizing a combination of DPF and SCR technologies in diesel plant machinery, can effectively reduce NOx levels. The process involves neutralizing CO in a catalytic chamber and using a particulate filter to capture diesel particles. Finally, urea is utilized in a catalytic chamber to neutralize NOx. Operating within a temperature range of 200–450 °C, this emission control technology offers promising possibilities. Stage IV and Stage V reduces NOx emissions to 0.4 g/kW. If we recalculate the parameter adjustment with this emission rate, the number of locomotives increases as the tunnel progresses, reaching a maximum of four locomotives in the tunnel simultaneously. In the analyzed case, performance could be maintained at 18 rings per day without reaching the maximum emission of 0.5 ppm of NO2 (Figure 8).
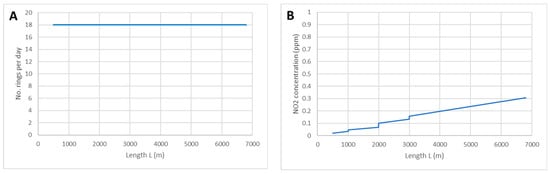
Figure 8.
TBM performance (A) and NO2 concentration with Stage IV or V locomotives (B).
The use of locomotives with Stage IV or higher engines significantly reduces emissions, enough to meet the requirements of Directive 2017/164/EU.
- (b)
- Electric or Hybrid Locomotives
An alternative approach involves the use of electric or hybrid tunnel locomotives to eliminate NOx emissions right at the source. While some manufacturers do offer such models, limitations in locomotive power make this solution primarily viable for smaller tunnels or those without significant gradients and with low requirements for transporting heavy loads. Nevertheless, in the context of this example, there are already electric locomotive solutions available, albeit with certain considerations. For instance, the onboard battery can complete eight to nine full runs when the tunnel spans its full length of 6.8 km, requiring approximately 8 h for recharging. In cases of continuous operation, a secondary battery for the next shift can be provided, allowing for seamless battery swapping and recharging. In general, electric locomotives are more expensive to purchase and maintain than diesel locomotives. The hybrid solution helps the locomotive accelerate the train faster than a diesel locomotive of the same capacity. Ultimately, the choice between electric or hybrid locomotives for tunnel construction will depend on the specific needs and requirements of the project.
5. Conclusions
5.1. Achieving NO2 Reductions in Tunnels
Directive 2017/164/EU’s ambitious targets for NO2 reduction within tunnels using tunnel-boring machines (TBMs) can be readily met by adopting electric locomotives. However, it is important to acknowledge that this may not be a feasible solution in scenarios involving steep slopes or requirements for transporting heavy loads.
5.2. Effective Alternatives to Electric Locomotives
In cases where steep slopes are a concern or heavy loads are required, the utilization of locomotives equipped with advanced Stage IV or Stage V engines is recommended. These engines incorporate state-of-the-art technologies such as diesel particulate filters (DPFs) and selective catalytic reduction (SCR), which have demonstrated their efficacy in significantly reducing NOx emissions, aligning with the directive’s limits.
5.3. Managing Older Machines
For tunneling projects that involve older machines adhering to Stage III or lower emissions regulations, it is imperative to implement measures to mitigate NOx emissions. This includes retrofitting these machines with essential technologies like diesel particulate filters (DPFs) and selective catalytic reduction (SCR).
5.4. Enhancing Safety and Health Standards
The implementation of Directive 2017/164/EU undoubtedly heralds an elevation in safety and health standards across TBM tunnel construction. By proactively addressing emissions through suitable locomotive choices and emission control technologies, projects can align with the directive’s stringent limits while safeguarding the well-being of workers and the environment.
Author Contributions
Conceptualization, H.G.-G. and R.R.; methodology, H.G.-G. and R.R.; validation, M.B., R.R. and H.G.-G.; formal analysis, H.G.-G., M.B. and R.R.; investigation, H.G.-G.; data curation, H.G.-G. and R.R.; writing—original draft preparation, H.G.-G. and R.R.; writing—review and editing, R.R., M.B. and H.G.-G.; visualization, M.B.; supervision, R.R.; project administration, H.G.-G.; funding acquisition, H.G.-G. All authors have read and agreed to the published version of the manuscript.
Funding
This research received no external funding.
Institutional Review Board Statement
Not applicable.
Informed Consent Statement
Not applicable.
Data Availability Statement
The data presented in this study are available on request from the corresponding author. The data are not publicly available due to confidentiality reasons.
Acknowledgments
This research and the preparation of this paper were made possible by the invaluable support and collaboration from the Instituto Nacional de Silicosis, University of Oviedo, and the Polytechnic University of Catalonia. We express our sincere gratitude to these institutions for their unwavering commitment to advancing scientific knowledge in this field. We extend our special thanks to the HUCA library for providing us with access to a wealth of reference materials and valuable information that significantly contributed to the depth and quality of our research. Lastly, we acknowledge the contributions of all individuals involved in this study, whose dedication and expertise have enriched our understanding of the complex challenges posed by NOx emissions in TBM tunnel construction.
Conflicts of Interest
The authors declare no conflict of interest.
References
- Banasiewicz, A. Analysis of Historical Changes in the Limit Value of Nitrogen Oxides Concentrations for Underground Mining. IOP Conf. Ser. Earth Environ. Sci. 2021, 684, 012018. [Google Scholar] [CrossRef]
- Tato Diogo, M. European Legal Framework Related to Underground Mining and Tunnelling Concerning Commission Directive (EU) 2017/164, 31 January Establishing a Fourth List of Indicative Occupational Exposure Limit Values. Int. J. Min. Sci. Technol. 2020, 30, 541–545. [Google Scholar] [CrossRef]
- García-González, H.G.; González-Garcia, J.; Fernández-Cachon, S.G.C.; Mateos, S.P. Nitrogen Oxides Gas Levels in NATM Tunnel Construction during the Directive 2017/164/EU Transitional Period. Inf. Constr. 2022, 74, e439. [Google Scholar]
- Soares-Gonçalves, A.C. Air Quality in Underground Mining. Suggested Adjustments for the Fulfilment of the Commission Directive; Universidade de Lisboa: Lisboa, Portugal, 2019. [Google Scholar]
- Gren, L.; Krais, A.M.; Assarsson, E.; Broberg, K.; Engfeldt, M.; Lindh, C.; Strandberg, B.; Pagels, J.; Hedmer, M. Underground Emissions and Miners’ Personal Exposure to Diesel and Renewable Diesel Exhaust in a Swedish Iron Ore Mine. Int. Arch. Occup. Environ. Health 2022, 95, 1369–1388. [Google Scholar] [CrossRef] [PubMed]
- Dowker, P.; Walsh, P. RR757—Real-Time Measurement of Nitrogen Monoxide in Tunnels; Health and Safety Executive, (HSE): Buxton, Derbyshire, UK, 2009. [Google Scholar]
- Giunta, M.; Lo Bosco, D.; Leonardi, G.; Scopelliti, F. Estimation of Gas and Dust Emissions in Construction Sites of a Motorway Project. Sustainability 2019, 11, 7218. [Google Scholar] [CrossRef]
- Giunta, M. Assessment of the Impact of CO, NOx and PM10 on Air Quality during Road Construction and Operation Phases. Sustainability 2020, 12, 10549. [Google Scholar] [CrossRef]
- Chang, X.; Chai, J.; Liu, Z.; Qin, Y.; Xu, Z. Comparison of Ventilation Methods Used during Tunnel Construction. Eng. Appl. Comput. Fluid Mech. 2020, 14, 107–121. [Google Scholar] [CrossRef]
- Ab Manan, N.; Noor Aizuddin, A.; Hod, R. Effect of Air Pollution and Hospital Admission: A Systematic Review. Ann. Glob. Health 2018, 84, 670–678. [Google Scholar] [CrossRef] [PubMed]
- Garcia-Gonzalez, H.; Domat, M.; Lopez-Pola, T.; Fernandez-Rubio, P.; Fernandez-Rodriguez, P. Particulate Matter Characterization in a Hospital’s Underground Car Park. Powders 2022, 1, 194–206. [Google Scholar] [CrossRef]
- Chen, T.-M.; Gokhale, J.; Shofer, S.; Kuschner, W.G. Outdoor Air Pollution: Nitrogen Dioxide, Sulfur Dioxide, and Carbon Monoxide Health Effects. Am. J. Med. Sci. 2007, 333, 249–256. [Google Scholar] [CrossRef]
- Douglas, W.W.; Hepper, N.G.; Colby, T.V. Silo-Filler’s Disease. Mayo Clin. Proc. 1989, 64, 291–304. [Google Scholar] [CrossRef] [PubMed]
- César, A.C.G.; Carvalho, J.A.; Nascimento, L.F.C. Association between NOx Exposure and Deaths Caused by Respiratory Diseases in a Medium-Sized Brazilian City. Braz. J. Med. Biol. Res. 2015, 48, 1130–1135. [Google Scholar] [CrossRef] [PubMed]
- Heberle, S.M.; Lorini, C.; Rosa, M.S.G.; Barros, N. Evaluation of Bus Driver Exposure to Nitrogen Dioxide Levels during Working Hours. Atmos. Environ. 2019, 216, 116906. [Google Scholar] [CrossRef]
- Moshammer, H.; Poteser, M.; Kundi, M.; Lemmerer, K.; Weitensfelder, L.; Wallner, P.; Hutter, H.-P. Nitrogen-Dioxide Remains a Valid Air Quality Indicator. Int. J. Environ. Res. Public Health 2020, 17, 3733. [Google Scholar] [CrossRef] [PubMed]
- Berlinger, B.; Ellingsen, D.G.; Romanova, N.; Friisk, G.; Daae, H.L.; Weinbruch, S.; Skaugset, N.P.; Thomassen, Y. Elemental Carbon and Nitrogen Dioxide as Markers of Exposure to Diesel Exhaust in Selected Norwegian Industries. Ann. Work. Expo. Health 2019, 63, 349–358. [Google Scholar] [CrossRef] [PubMed]
- Weinberger, B.; Laskin, D.L.; Heck, D.E.; Laskin, J.D. The Toxicology of Inhaled Nitric Oxide. Toxicol. Sci. 2001, 59, 5–16. [Google Scholar] [CrossRef] [PubMed]
- Lopatin, O.P. Phenomenology of Nitrogen Oxides Formation in a Gas-Diesel Engine. J. Phys. Conf. Ser. 2020, 1515, 042009. [Google Scholar] [CrossRef]
- Maidl, B.; Herrenknecht, M.; Maidl, U.; Wehrmeyer, G. Mechanised Shield Tunnelling; John Wiley & Sons: Hoboken, NJ, USA, 2013. [Google Scholar]
- Vinai, R.; Oggeri, C.; Peila, D. Soil Conditioning of Sand for EPB Applications: A Laboratory Research. Tunn. Undergr. Space Technol. 2008, 23, 308–317. [Google Scholar] [CrossRef]
- Garcia Gonzalez, H.; García-Ordiales, E.; Diez, R.R. Analysis of the Airborne Mercury and Particulate Arsenic Levels Close to an Abandoned Waste Dump and Buildings of a Mercury Mine and the Potential Risk of Atmospheric Pollution. SN Appl. Sci. 2022, 4, 76. [Google Scholar] [CrossRef]
- Nagl, C.; Spangl, W.; Buxbaum, I. Sampling Points for Air Quality; Representativeness and Comparability of Measurement in Accordance with Directive 2008/50/EC on Ambient Air Quality and Cleaner Air for Europe; European Parliament: Luxembourg, 2019. [Google Scholar]
- EN 689:2018+AC:2019; Workplace Exposure—Measurement of Exposure by Inhalation to Chemical Agents—Strategy for Testing Compliance with Occupational Exposure Limit Values. Comite Europeen de Normalisation: Brussels, Belgium, 2018.
- European Commission (EC). Commission Directive (EU) 2017/164 of 31 January 2017 Establishing a Fourth List of Indicative Occupational Exposure Limit Values Pursuant to Council Directive 98/24/EC, and Amending Commission Directives 91/322/EEC, 2000/39/EC and 2009/161/EU (Text with EEA Relevance). Off. J. Eur. Union 2017, 27, 115–120. [Google Scholar]
- Technical Instruction 04.7.06 ‘Monitoring Poisonous Gases in the Atmosphere during Underground Activities’ of the General Regulation on Basic Mining Safety Standards Adopted by Spanish Royal Decree 863/1985 of 2 April 1985. 2017. Available online: https://www.boe.es/diario_boe/txt.php?id=BOE-A-2018-14894 (accessed on 21 August 2023).
- CDC. CDC—Mining—Diesel Aftertreatment Control Technologies in Underground Mines—NIOSH. Available online: https://www.cdc.gov/niosh/mining/works/coversheet195.html (accessed on 21 August 2023).

Disclaimer/Publisher’s Note: The statements, opinions and data contained in all publications are solely those of the individual author(s) and contributor(s) and not of MDPI and/or the editor(s). MDPI and/or the editor(s) disclaim responsibility for any injury to people or property resulting from any ideas, methods, instructions or products referred to in the content. |
© 2023 by the authors. Licensee MDPI, Basel, Switzerland. This article is an open access article distributed under the terms and conditions of the Creative Commons Attribution (CC BY) license (https://creativecommons.org/licenses/by/4.0/).