Article

A Three-Dimensional Mesoscale Computational Simulation Method for Soil–Rock Mixtures Considering Grain Crushing

1
School of Mine Safety, North China Institute of Science and Technology, 468 Xueyuan Street, Sanhe, Langfang 065201, China
2
School of Science, North China Institute of Science and Technology, 468 Xueyuan Street, Sanhe, Langfang 065201, China
3
School of Safety Engineering, North China Institute of Science and Technology, 468 Xueyuan Street, Sanhe, Langfang 065201, China
*
Author to whom correspondence should be addressed.
Appl. Sci. 2023, 13(18), 10552; https://doi.org/10.3390/app131810552
Submission received: 7 August 2023 / Revised: 15 September 2023 / Accepted: 19 September 2023 / Published: 21 September 2023
(This article belongs to the Section Earth Sciences)

Abstract

:
A new 3D mesoscale computational approach to simulate the mechanical behavior of soil–rock mixtures (SRMs) with the consideration of the grain-crushing process is proposed in this study. The proposed approach adopts a random SRM mesostructure generation algorithm to create a random SRM structure. Based on the generated mesostructure, the whole simulation area is divided into discrete cubic numbers, and the mesostructure is transformed into a material distribution matrix as an input for the computational approach. The computational approach is achieved by the coupling calculation of Matlab and COMSOL. Theimulations are presented alongside experimental data to validate the efficiency of the proposed approach. The simulation results indicate that the proposed computational approach can accurately capture the mechanical behavior of SRMs under loadings. This method helps to predict the physical properties of SRMs and has promising applications in engineering.

1. Introduction

The deformation and deterioration of soil–rock mixtures (SRMs) are frequently encountered in most geotechnical disasters such as earthquake liquefaction, slope instability, and earth dam collapse [1]. As defined by Medley [2], the threshold of soil and rock in a soil–rock mixture is 5% of the characteristic length. Therefore, understanding the behavior of soil–rock mixtures aids in the study of disaster early warnings such as landslides and debris flows.
The first difficulty of studying the behavior of SRMs is to characterize the random geometry feature in different engineering practices. Due to differences in geological activity, the SRMs in different engineering practices have differences in their particle distributions, shapes, and placement angles. In most recent studies, the geometry features of SRMs have been characterized in two different ways. The first method is to use digital image processing (DIP) methods in SRM structures captured by a high-resolution camera (2D images) or X-ray CT (3D images). For example, Xu et al. [3] used the DIP method in their captured images and reconstructed the mesostructures of SRMs. Based on the reconstructed mesostructures, Xu simulated the mechanical behavior of the SRMs from a digital image by using the finite element method (FEM). Similar to Xu, Meng et al. [4] used a DIP-based discrete element method (DEM) to analyze the heterogeneous geomaterials of SRMs. The second method of characterizing the geometry is to generate a random mesostructure of SRMs with similar statistic geometry parameters, such as gradation and fractal dimension. Xu developed random generation algorithms for the mesostructures of both 2D [5] and 3D [6] SRMs. Xu’s approach involves growing new tetrahedrons on a hexahedron base; therefore, it is suitable to generate angular rock particles. Meng [7] et al. developed a different method that randomly picks vertices within a spherical domain to generate rock particles, which is efficient in producing rounded rock particles. Li [8] integrated Xu and Meng’s method and developed a new method that generates the mesostructures of SRMs using their gradation and particle shape proportion.
The second challenge of investigating the behavior of SRMs is introducing the degradation process of large grains under compression or shear loadings. A considerable amount of the literature has revealed that the degradation process associated with loading-induced grain crushing affects the macroscopic mechanical behavior of SRMs [9,10]. For example, Li et al. [11] performed an in situ direct shear test on the soil–rock mixtures in the three gorges reservoir area in China. The direct shear test showed that the grain breakage in SRMs has a significant influence on the shear strength of SRMs. Similar conclusions have been drawn by many other in situ or laboratory tests [12,13,14,15]. To account for the degradation process of the large grains (or rock particles), several attempts have been made to develop a constitutive model of SRMs. For example, Daouadji et al. [10] proposed an elastoplastic model for grain materials that takes into account grain breakage. Cecconi et al. [9] developed a constitutive model for pyroclastic soil that considers the grain crushing process under loading of the large particles. Zhang et al. [16] developed a viscoelastic model for multi-layered coarse-grained soil that considers the interface-layer effect of SRMs. However, these constitutive models are all theoretic models based on the homogenization assumption and cannot be applied in the mesoscopic geometry models. Very few studies are available for considering the degradation process of large particles in a mesoscopic geometry simulation.
Most of the studies that have been published so far about the mesoscale simulation of SRMs suffer from lacking consideration of grain crushing during the loading process. For example, Meng et al. [17] developed a mesoscale computational model based on the finite element method (FEM). However, this study failed to characterize the degradation process of rock particles. Xu et al. [18] developed a 3D random mesostructure modeling system of SRMs based on the discrete element method (DEM). This study adopted a non-overlapping combination method to model convex polyhedron rock blocks for DEM numerical simulation. However, this study did not consider grain breakage either. Shan et al. [19] developed a 2D model of SRMs based on the DEM and could not account for the grain-crushing process of large particles.
This paper aims to develop a mesoscale computational approach that considers the degradation process of large particles in a randomly generated three-dimensional mesostructure of SRMs. Firstly, the generation algorithm of the random mesostructures of SRMs was briefly introduced. Then, the details of the mesoscale computational approach, including the Matlab-COMSOL coupled simulation method, constitutive model, and degradation process were established. Finally, the mesoscale computational approach was verified based on several trial simulations.

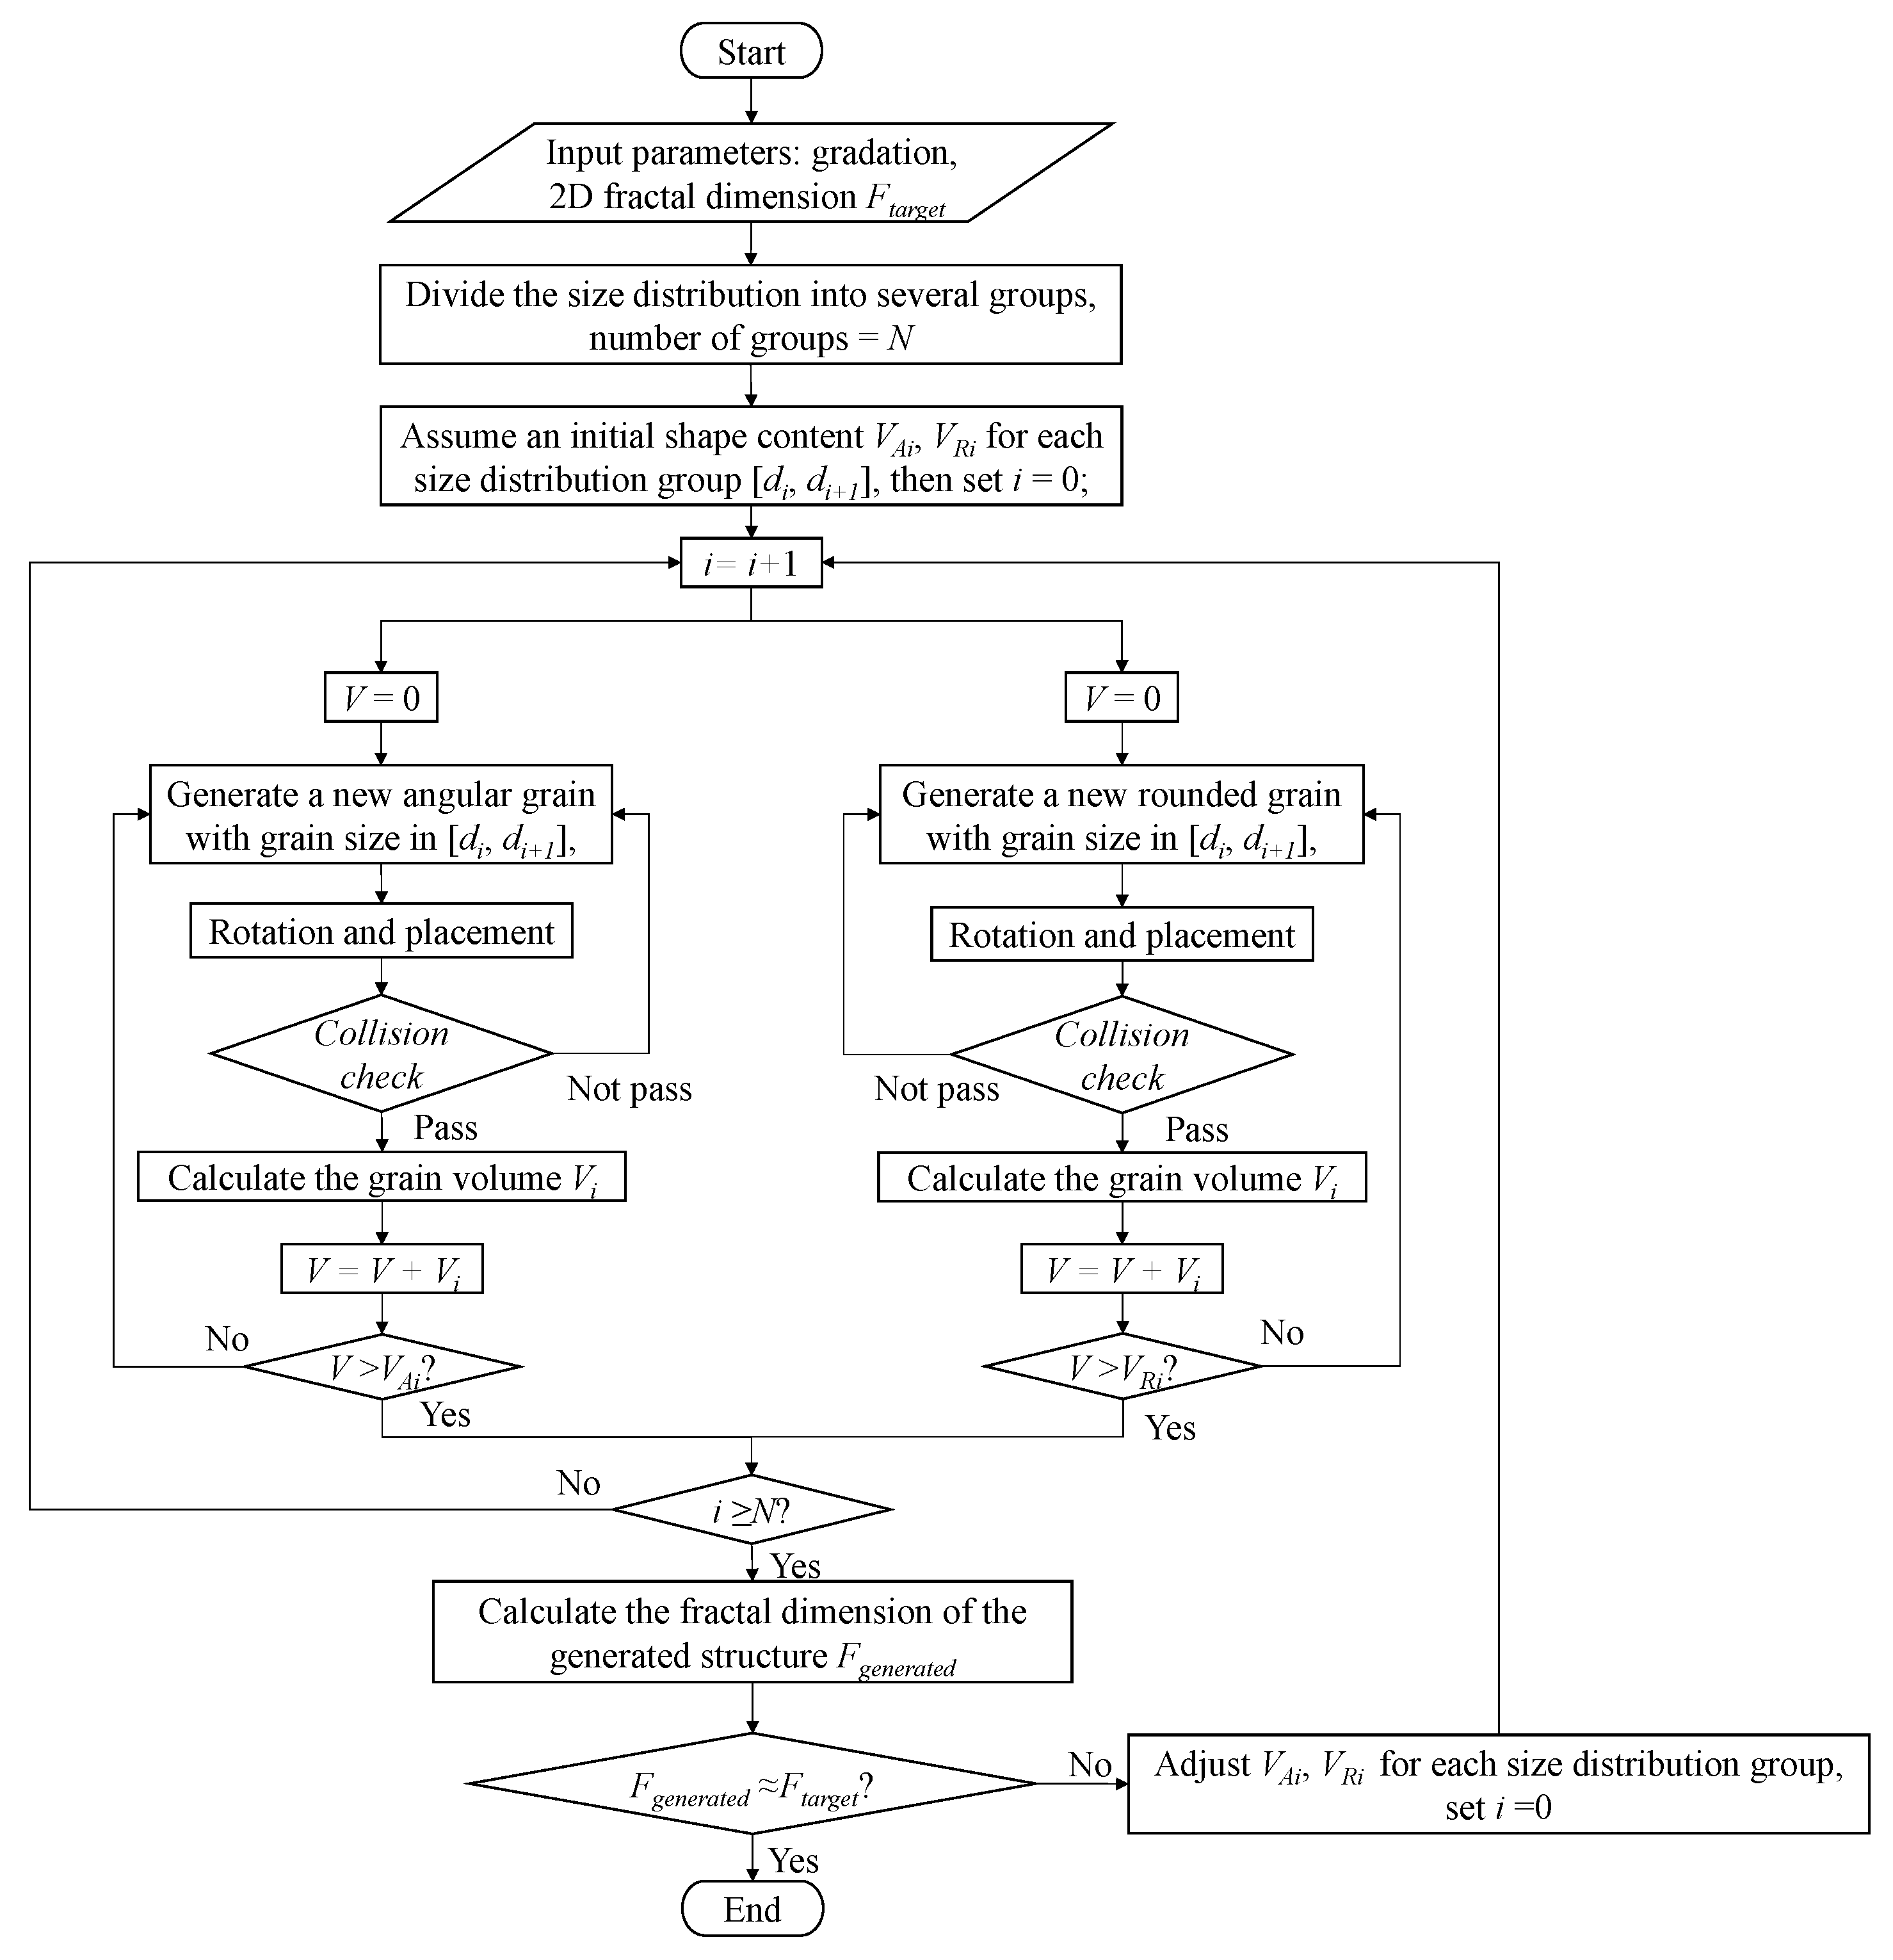
2. Generation Algorithm of Random Soil–Rock Mixtures

The first step of the proposed mesoscale computational approach is to generate an appropriate 3D geometry model that can capture the significant features of SRMs. In most of the SRM simulation studies, a geometry model of SRMs can be generated in two ways. The first method is to capture the real geometry shapes of SRMs from in situ samples based on the DIP method. This method can capture all of the geometry features of in situ samples; however, it is time-consuming and difficult to extrapolate the existing geometry to other shapes with different gradations. The second method is to randomly generate an SRM model with different shapes of rock particles. This method requires the generation algorithm to capture most of the geometry features of the natural SRM materials such as the gradation curve, shape of the rock particles, and fractal dimensions. In most SRM geometry generation studies, only the gradation of rock particles was considered. However, an analysis of particle shapes indicated that the shape of rock particles has a significant effect on the mechanical properties of SRMs [20,21,22]. In this study, a novel algorithm that can randomly generate SRM geometry models with different gradations, fractal dimensions, and particle shapes was adopted.

2.1. General Generation Algorithm

The adopted method used the Monte Carlo method to generate the SRM structure. The first step of generating a mesoscale structure of a SRM is to assign target geometry parameters for the generated model. These geometry parameters include gradation, fractal dimension, and content of different particle shapes. The adopted algorithm can generate both rounded grains and angular grains. Once the target parameters are obtained, the second step is dividing the gradation curve into several groups. For each group, different numbers of rounded particles and angular particles were generated until the volume content met the gradation curve. Each generated particle was randomly rotated and placed in a random location before collision detection with the existing structure that had been generated. If a randomly rotated and placed particle intersects with the existing structure, the particle will be rotated with another random angle and placed in a new random location, then perform collision detection again until there is no intersection between the new particle and the existing generated structure. A flowchart detailing the generation of the SRM algorithm is shown in Figure 1. More details about generating a single grain and collision detection are introduced in the following section.

2.2. Generation of Single Rock Particle

As introduced in the previous section, the adopted algorithm can generate rock particles with two different shapes based on the given size: rounded and angular. Examples of the generating of rounded and angular rock particles are shown in Figure 2 and Figure 3. For both rounded and angular rock particles, the first step of generating a single rock particle is to generate a sphere boundary with the given particle size. No vertex or edge during the generation process was allowed to exceed the sphere boundary. Based on the sphere boundary, two antipodal points, A and B, were selected as the first two vertices of the generated particle. The distance between two antipodal points was the diameter of the sphere. With this method, the size of the generated particle could be controlled.
To generate a rounded particle, the next step is to select several random tangential sections that are perpendicular to the line segment connecting A and B. Then, several random vertices are selected inside of each tangential section. The last step is to connect the two antipodal points with the generated vertices.
To generate an angular rock particle, the second step is randomly selecting two vertices inside of the sphere boundary, shown as vertexes C and D in Figure 3. Vertexes A, B, C, and D can be connected to form a tetrahedron. After generating the first tetrahedron, the area of each face is calculated. Once the area of each face is larger than the pre-defined threshold, a new random vertex (represented as vertex E in Figure 3) will be selected to form a new tetrahedron. The final step is to combine all of the tetrahedrons into a new geometrical object. More details about generating the rounded and angular particles can be found in our previous studies [8].

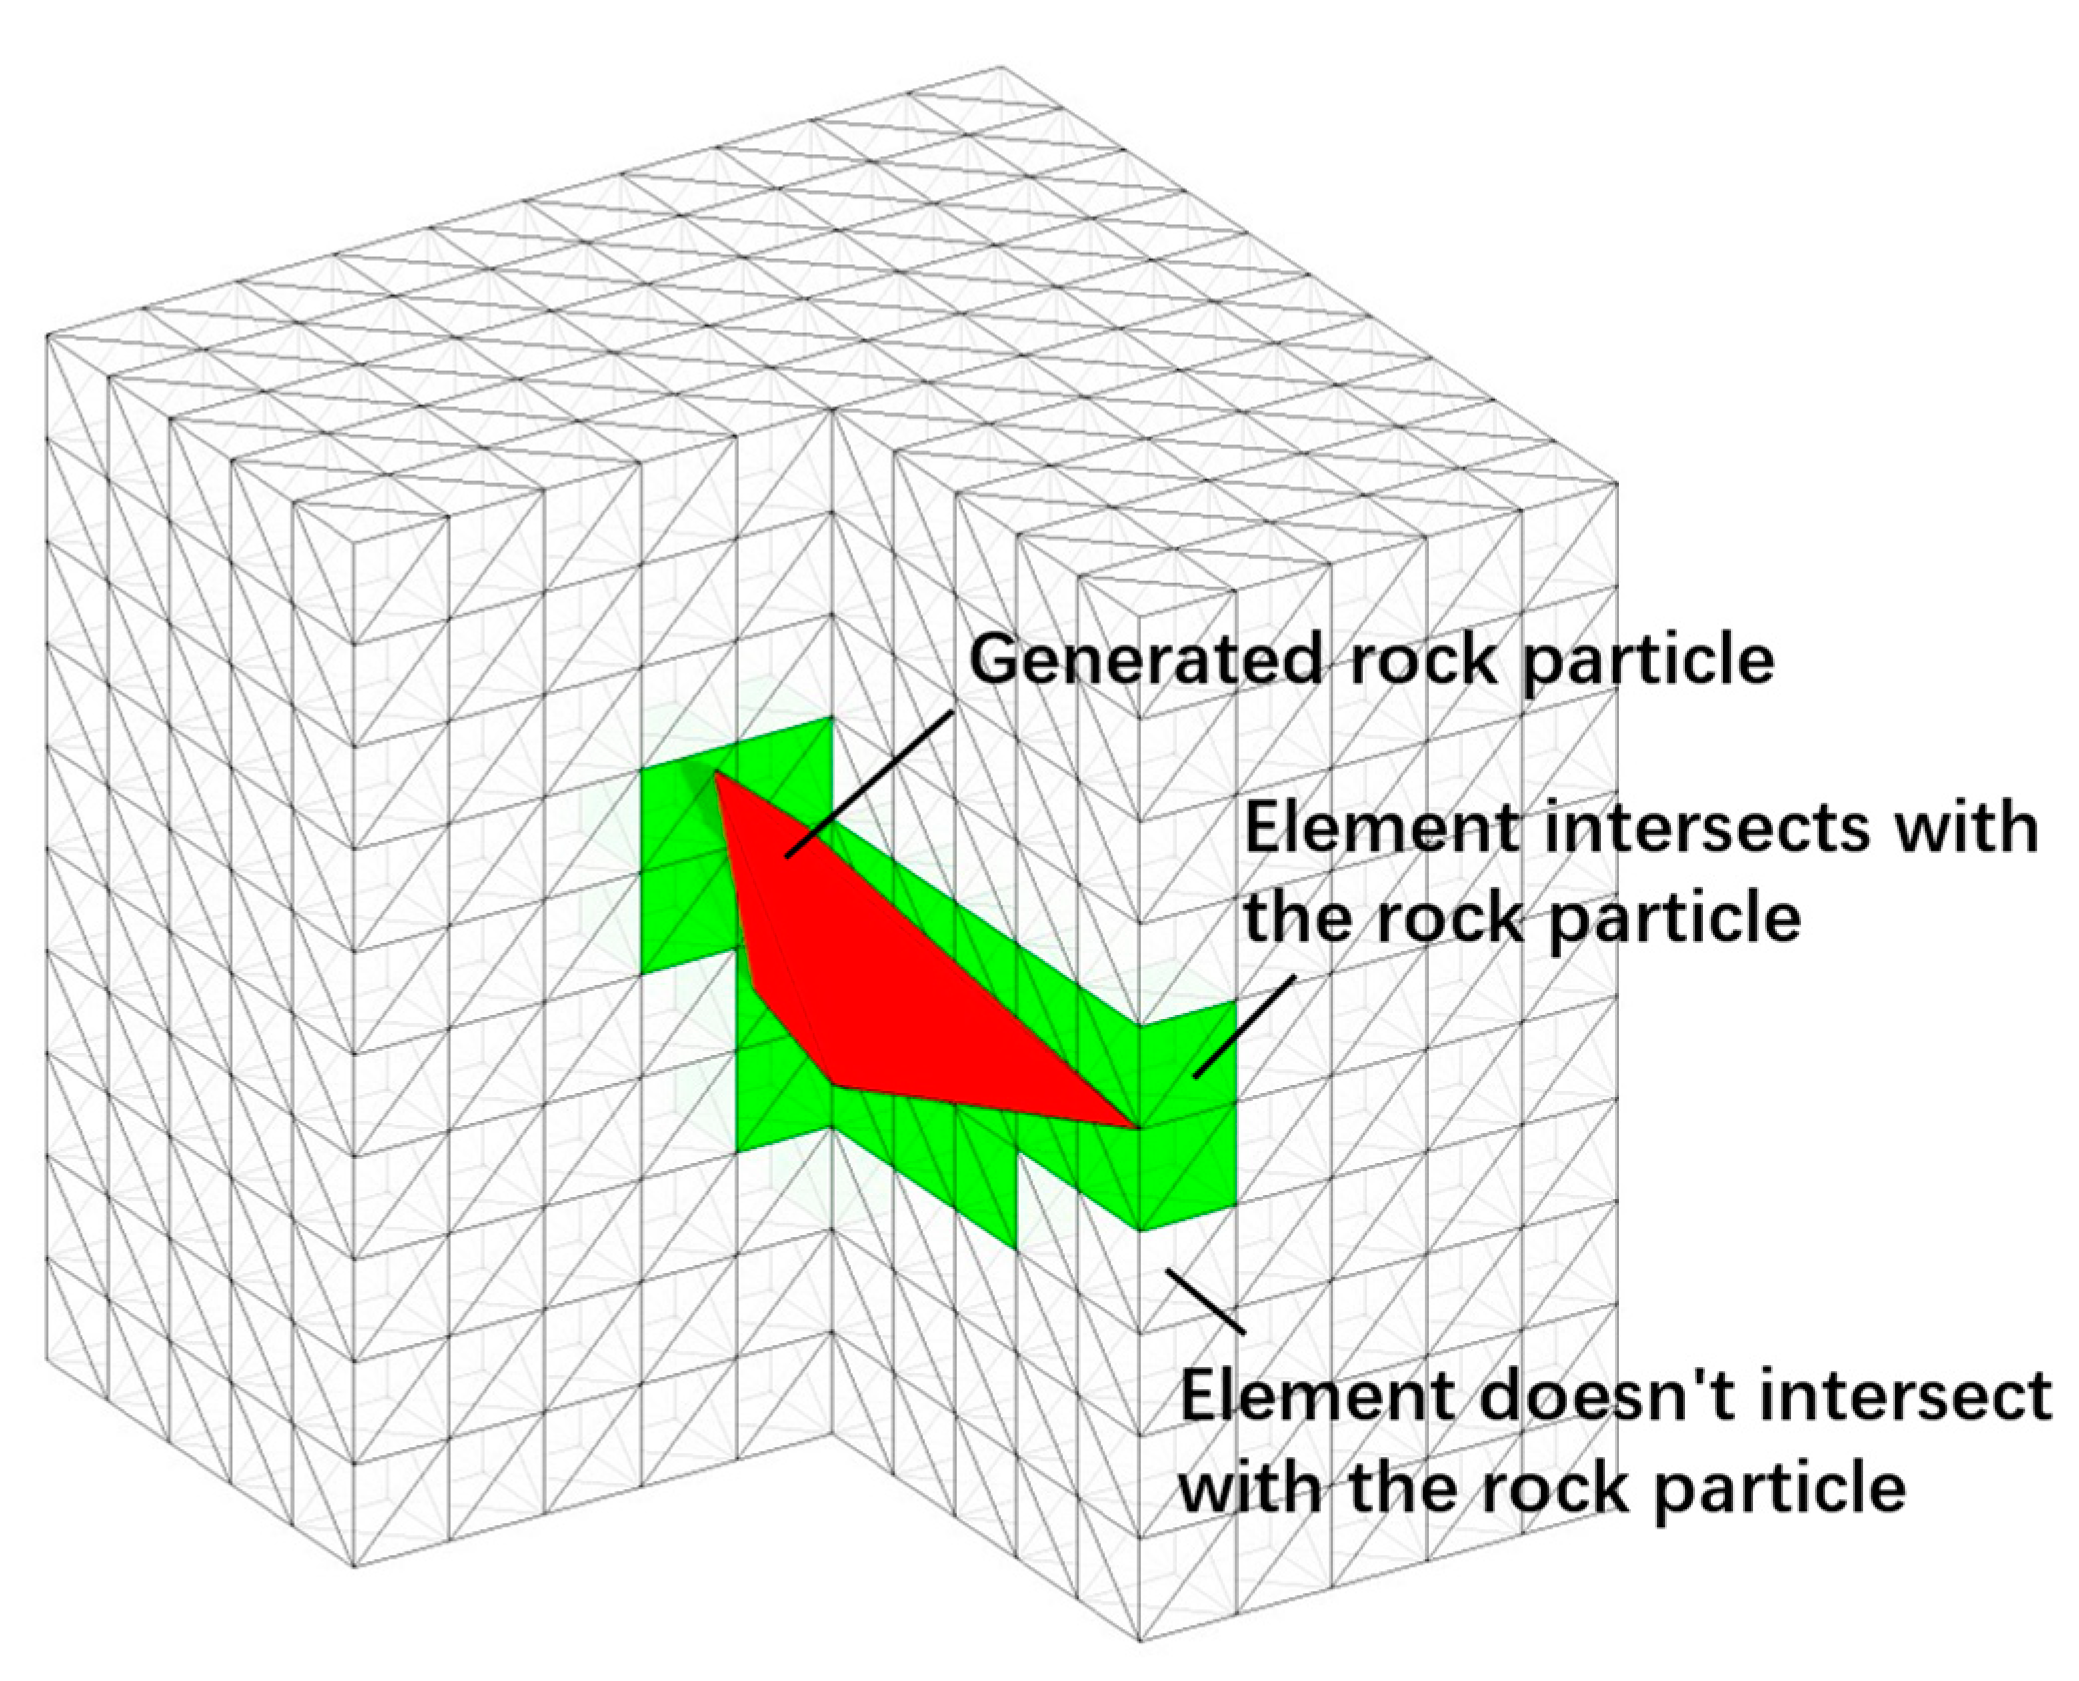
2.3. Grain Placement and Collection Detection

After generating a single rock particle, the generated particle needs to be rotated at a random angle and placed in a random location. The coordinates of each vertex could be transferred by the following equation:
x 1 , y 1 , z 1 = x 0 , y 0 , z 0 c o s ( α ) sin ( α ) 0 s i n ( α ) c o s ( α ) 0 0 0 1 c o s ( β ) 0 s i n ( β ) 0 1 0 s i n ( β ) 0 c o s ( β ) 1 0 0 0 c o s ( γ ) s i n ( γ ) 0 s i n ( γ ) c o s ( γ )                         + r 1 L , r 2 W , r 3 H
where (x0, y0, z0) are the initial coordinates of the vertex, (x1, y1, z1) are the transformed coordinates; α, β, and γ are random angles ranging from 0 to 360 degrees; r1, r2, and r3 are random constants ranging from 0 to 1; L, W, and H are the length, width, and height of the generation area, respectively. Connecting the vertices after the transformation can transfer the original rock particle into a new location with a random angle.
The collision detection method adopted in the generation method is the Gilbert–Johnson–Keerthi (GJK) algorithm. The GJK algorithm is a widely used collision-detection algorithm for convex shapes in computer graphics. More details about the principle and steps of the GJK method can be found in related studies [8,23].

3. Mesoscale Simulation of Soil Rock Mixtures

The second step of the mesoscale approach is to import the generated mesostructure of an SRM into a numerical simulation platform. For most of the related studies, the generated SRM mesostructure was imported directly into the simulation software COMSOL Multiphysics 5.6 as the geometry model. However, this method has two drawbacks. Firstly, the generated SRM structure is usually composed of numerous differently shaped and sized polyhedrons, which can easily cause difficulties in mesh generation. Secondly, once the geometry structure of the SRM is determined, it is difficult to achieve the boundary destruction and breakage of large particles during the numerical simulation process. In this study, the generated SRM mesostructure was not imported into the numerical simulation platform in the form of geometric boundaries but in the form of a material distribution matrix. Based on the generated mesostructure, the whole simulation area was divided into discrete cubic numbers, and the mesostructure was transformed into a material distribution matrix as an input for the computational approach. The details of the material distribution matrix are introduced in the following section.

3.1. Area Discretization and Material Distribution Matrix Calculation

After generating the SRM mesostructure, the whole simulation area is divided into numbers of the cubic area with the same size. The location of each cubic area could be represented by its coordinates in the x, y, and z axess, and the information of each cubic area could be stored in a three-dimensional matrix, i.e., the material distribution matrix. Then, collision detection will be performed between each cubic area and the generated SRM mesostructure through the GJK algorithm. If the SRM structure intersects with the cubic area, then the cubic area will be represented as 1 in the material distribution matrix, otherwise the cubic area will be represented as 0 in the material distribution matrix. During the computational approach, if a rock element is damaged into a soil element, then the corresponding value in the matrix will change from 1 to 0. An example of the area discretization is shown in Figure 4. In Figure 4, the generated rock particle is shown as the red area, and the cubic area which intersects with the generated rock particle is shown as the green area. The cubic area which does not intersect with the rock particle is shown as the white area. The smaller the size of the cube, the higher the resolution of the discretization, and the more accurate the material distribution matrix will be.
Based on the material distribution matrix, the material property matrix can be generated. For example, to assign Young’s modulus for each element, the Young’s modulus distribution matrix could be calculated based on the following equation:
E = n · E s o i l + M · E r o c k E s o i l
where E is the Young’s modulus distribution matrix, n is a matrix in which all elements are 1, M is the material distribution matrix, Esoil is the Young’s modulus of the soil element, and Erock is the Young’s modulus of the rock element. The matrices E , n , and M have the same size.
Figure 5 shows an example of three generated SRM structures before and after the discretization process. The diameters of the three models are all 0.5 m, and the height is 1m. The resolution during the discretization is 0.002 m; therefore, the whole computation area was divided into 250 × 250 × 500 = 31,250,000 elements.

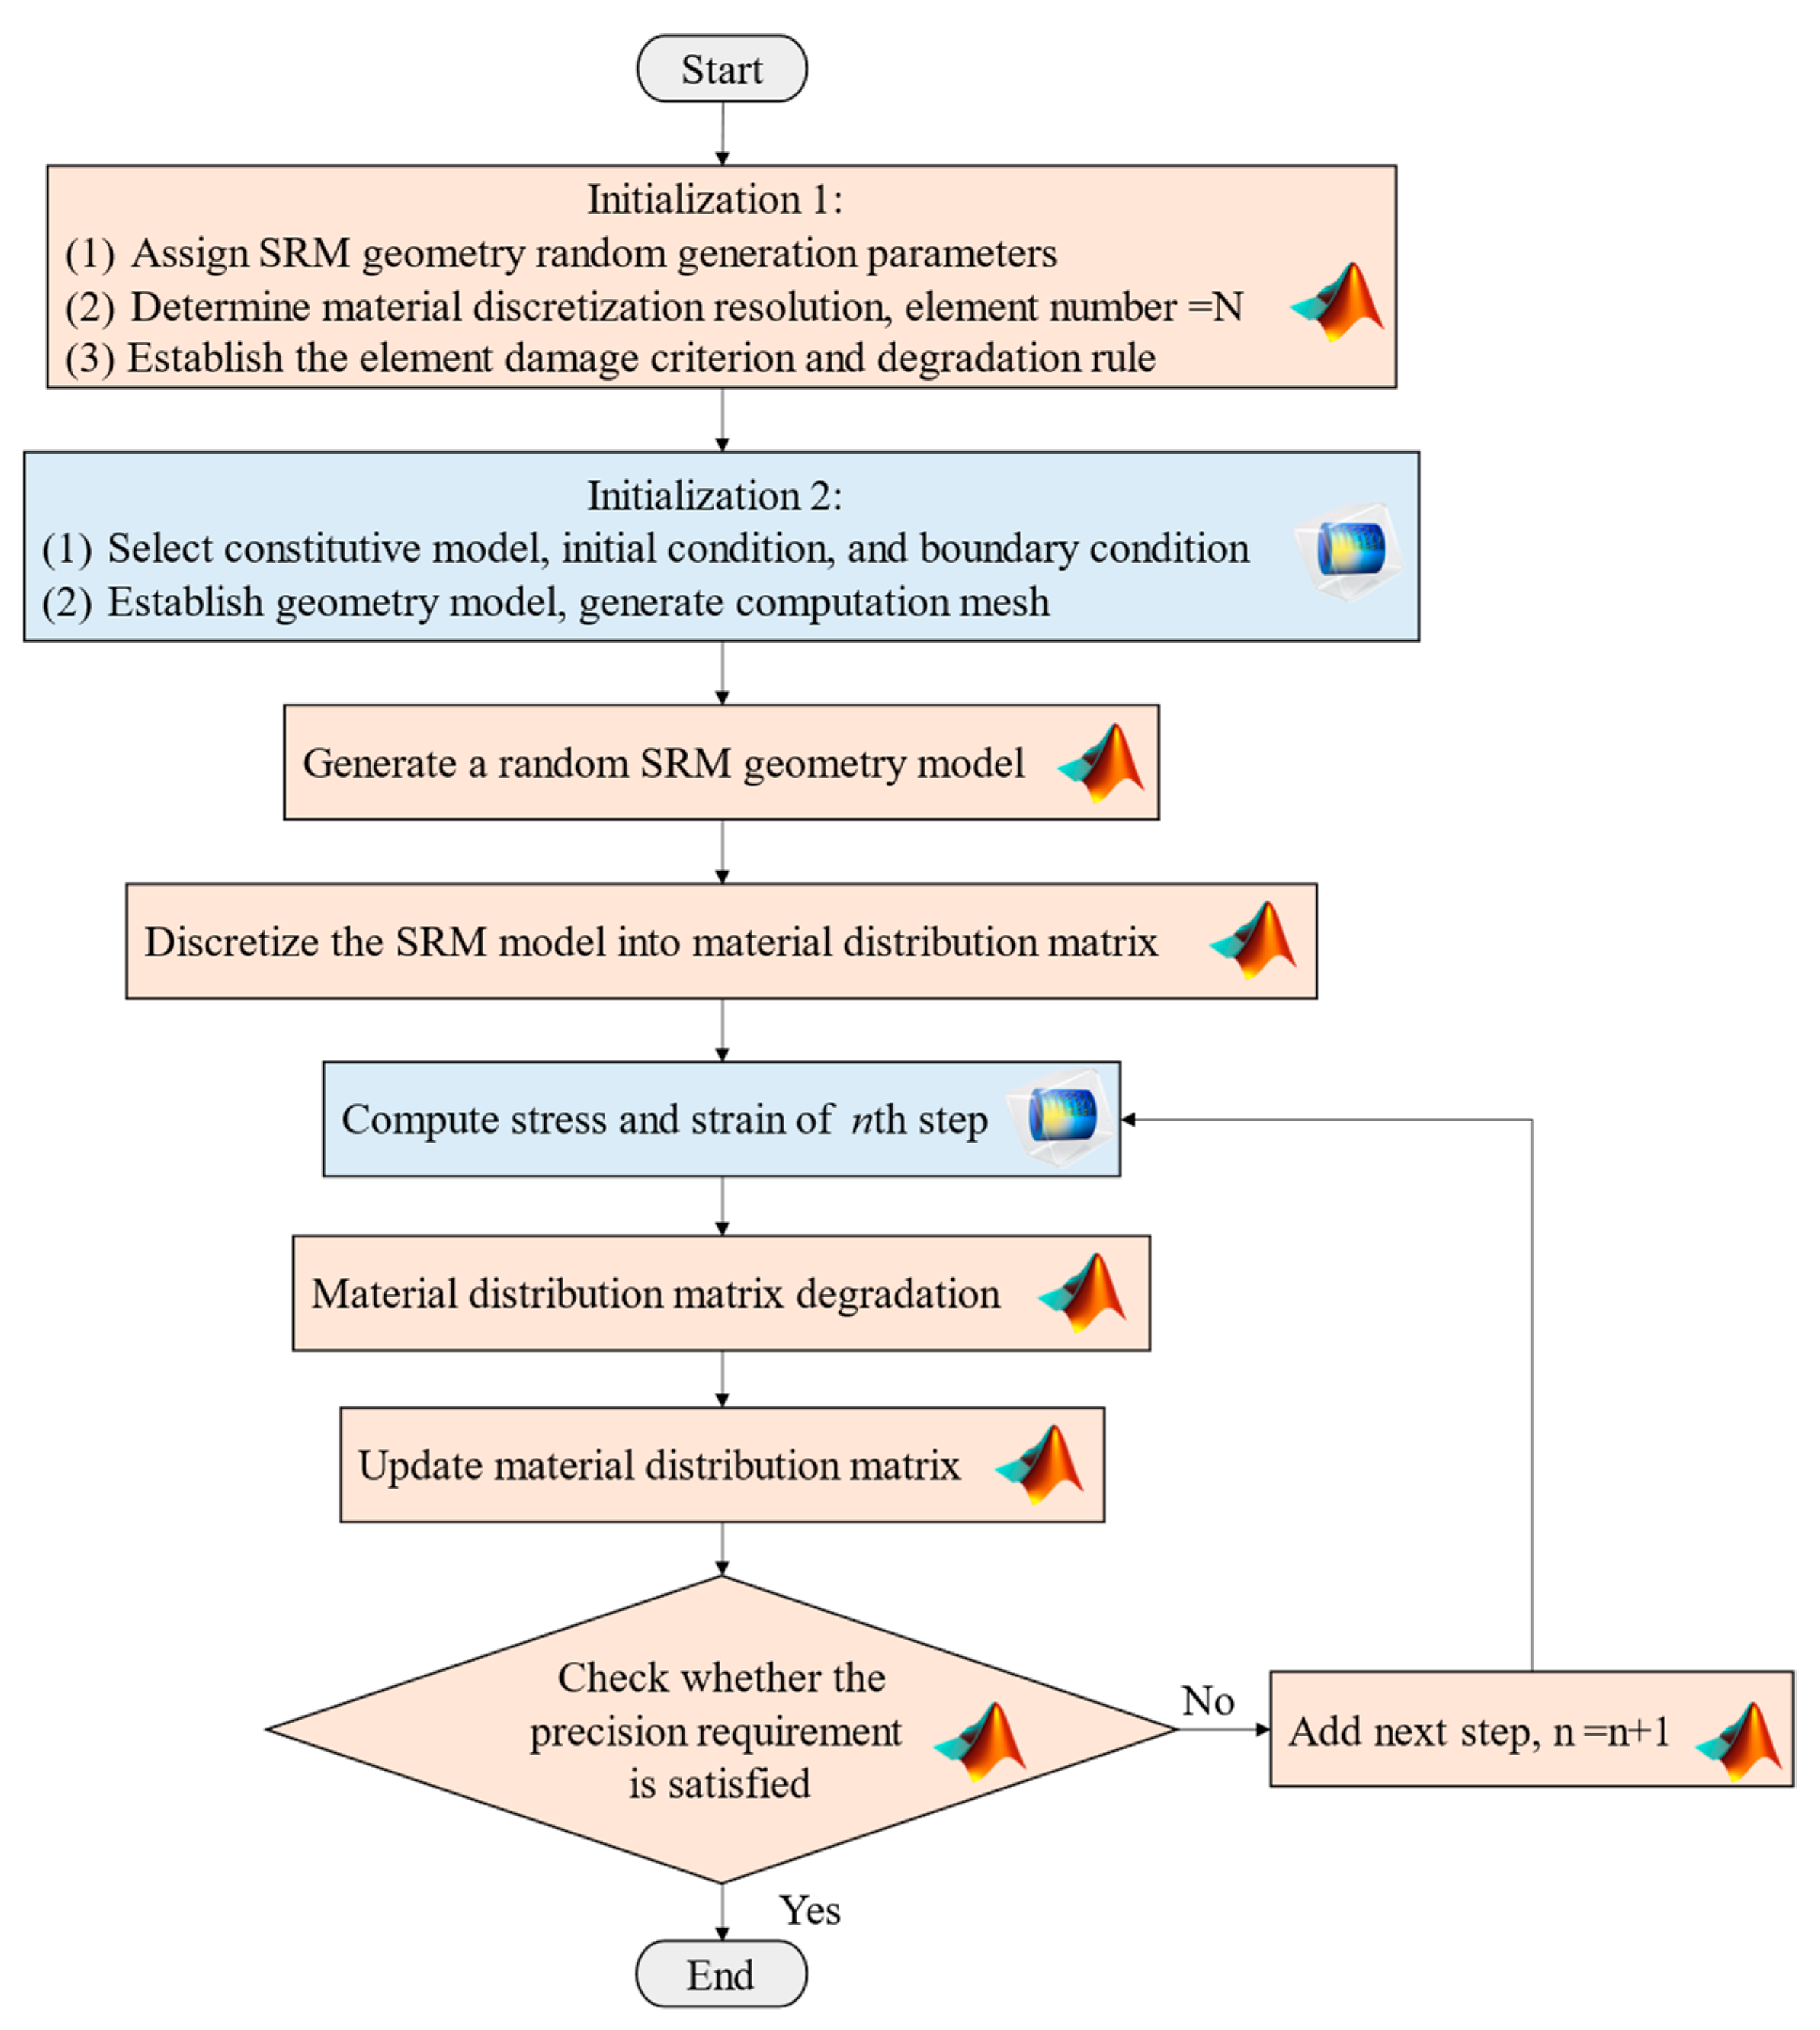
3.2. Implementation of the Mesoscale Computational Approach

Based on the generated random SRM structure, the mesoscale computational approach can be performed by using the coupling calculation of COMSOL Multiphysics and Matlab. In this study, the SRM mesostructure generation, material discretization, material degradation, and material distribution matrix updates were performed by Matlab. The establishment of the initial condition and boundary condition, constitutive model, and calculation of stress and strain was performed by COMSOL. The coupling computation of Matlab and COMSOL was realized through the COMSOL livelink for Matlab. The communication between the two softwares was achieved through a generated txt file.
The general flowchart of the mesoscale computational approach is shown in Figure 6. To realize the initial parameters, a set of values of the gradation curve, volume content with different particle shapes, and fractal dimension is assigned to generate a random SRM structure. At the same time, the material discretization resolution and element number N of the whole simulation area is determined. The damage criterion and degradation rule are pre-defined as well in Matlab. In this study, the maximum tensile stress criterion (Equation (3)) and the Mohr–Coulomb criterion (Equation (4)) were chosen to determine whether the element is damaged.
F 1 = σ 3 σ t 0 = 0
F 2 = σ 1 σ 3 1 + sin φ 1 s i n φ σ c 0 = 0
where σ1 and σ3 are the maximum and minimum principal stress, σt0 and σc0 are the uniaxial tensile strength and uniaxial compressive strength, and φ is the internal friction angle.
The constitutive model, initial condition, and boundary condition were selected in COMSOL. To save computational resources and improve computational efficiency, a linear elastic model was used in this study. At the same time, the geometry model and computational mesh were established in the initialization process.
Then, a random SRM mesostructure was generated by the algorithm mentioned above. After that, the whole computational area was discretized into numbers of cubic areas, and a material distribution matrix was generated based on collision detection.
Based on the material distribution matrix, geometry model, initial condition, and boundary condition, a loop calculation was performed. For each loop, the maximum and minimum principal stress, σ1 and σ3, and maximum and minimum principal strain, ε1 and ε3, were calculated and outputted as txt files by COMSOL. Then, the damage criterion was used to locate the damaged element. All damaged rock elements were transformed into soil elements, and the degradation law was used to reduce the modulus and strength of the damaged element. The material distribution matrix was updated after the degradation process. At the end of each loop computation, the calculation results were checked to determine whether the precision requirement was satisfied. If the requirements were met, the loop calculation would end. Otherwise, a new time step was added, and the loop calculation was performed again.
However, it should be noted that, due to the inherent limitation of the proposed method, this method cannot simulate the contact behavior of soil matrix and rock particles, which might induce errors during the simulation.

4. Model Validation and Parametric Study

To validate the proposed mesoscale computational approach, a numerical simulation of a uniaxial compressive test and a triaxial compressive test was performed. The simulation of the uniaxial compressive test is used to show the evolution of the SRM under loading, and the simulation of the triaxial compressive test is used to compare our model results with previous published experimental results.
For the simulation of the uniaxial compressive test, a numerical model with a diameter of 0.05 m and a height of 0.1 m was established. The rock content of the generated SRM structure was set as 15%. The Young’s modulus of the rock particles and soil matrix was assumed as 3000 MPa and 50 MPa, respectively. The maximum tensile strength and the maximum compressive strength of the rock particles were set as 8 MPa and 90 MPa, respectively. The internal friction angle of the rock particles and soil matrix was set as 50° and 25°, respectively, and the cohesion of the soil matrix was set as 100 kPa.
For the simulation of the uniaxial compressive test, the elements on the top and bottom of the sample were fixed in the vertical direction but could move freely in the horizontal direction. The simulations assumed a loading displacement increment of 0.005 m/step. The evolution of the soil–rock distribution, von Mises stress, and accumulated damage are shown in Figure 7. Figure 7 shows that the proposed mesoscale computational approach captured the breakage of rock particles during the uniaxial compressive test. The results show that, in the SRM structure, the rock particles bear the majority of the load, and the stress concentration phenomenon is observed at the edge of the rock particles. Due to the stress concentration, large rock particles break down into several smaller rock particles, and the stress is redistributed. In addition, the damage process of the soil matrix is also defined in the simulation of the uniaxial compressive test. Once a soil element is damaged, it will deteriorate and become a weaker element with a smaller Young’s modulus.
A simulation of a triaxial compressive test was performed to validate the proposed computational approach. The experimental results of a SRM sample with rock contents of 30% were used to validate the simulation field [24]. Samples with a diameter of 0.1 m and height of 0.2 m were used in the triaxial compressive test. The triaxial compression test was conducted at three different confining pressures, namely 100 kPa, 200 kPa, and 300 kPa. In the simulation, the size of the model was adjusted to the same size as the experimental samples. Because the mechanical properties such as the Young’s modulus, friction angle, and internal cohesion of rock particles and soil matrix are not mentioned in the reference, the mechanical properties used in the simulation were calibrated by trial and error. The stress–strain curves from the numerical simulation and experiment are presented in Figure 8. The simulated stress–strain curve is in good agreement with the experimental stress–strain curve under different confining loadings. In addition, compared with the experimental results, the stress–strain curve of the numerical simulation shows oscillatory behavior, which is due to the redistribution of stress caused by the breakage of the rock particles under loading.
In summary, the numerical simulation results of the uniaxial and triaxial tests indicated that the proposed mesoscale computational approach could capture the mechanical behavior of SRMs and characterize the grain-crushing process of SRMs under loadings.

5. Conclusions

In this paper, a mesoscale computational approach for SRMs with the consideration of the breakage of rock particles is proposed. The proposed computational approach adopts a random SRM geometry generation algorithm, which can take into account the shape content, gradation, and fractal dimension in the generation process. Based on the generated SRM structure, the simulation area is discretized to calculate the material distribution matrix. The material distribution matrix is used for the coupling calculation of Matlab and COMSOL. Using this approach, we carried out a numerical simulation of a uniaxial compressive test and a triaxial compressive test. Based on the analysis conducted as part of this study, the following conclusions were drawn:
  • In contrast to other related studies, the proposed computational approach in this study not only employs randomly generated geometric models but also takes into account the breakage of rock particles under loadings;
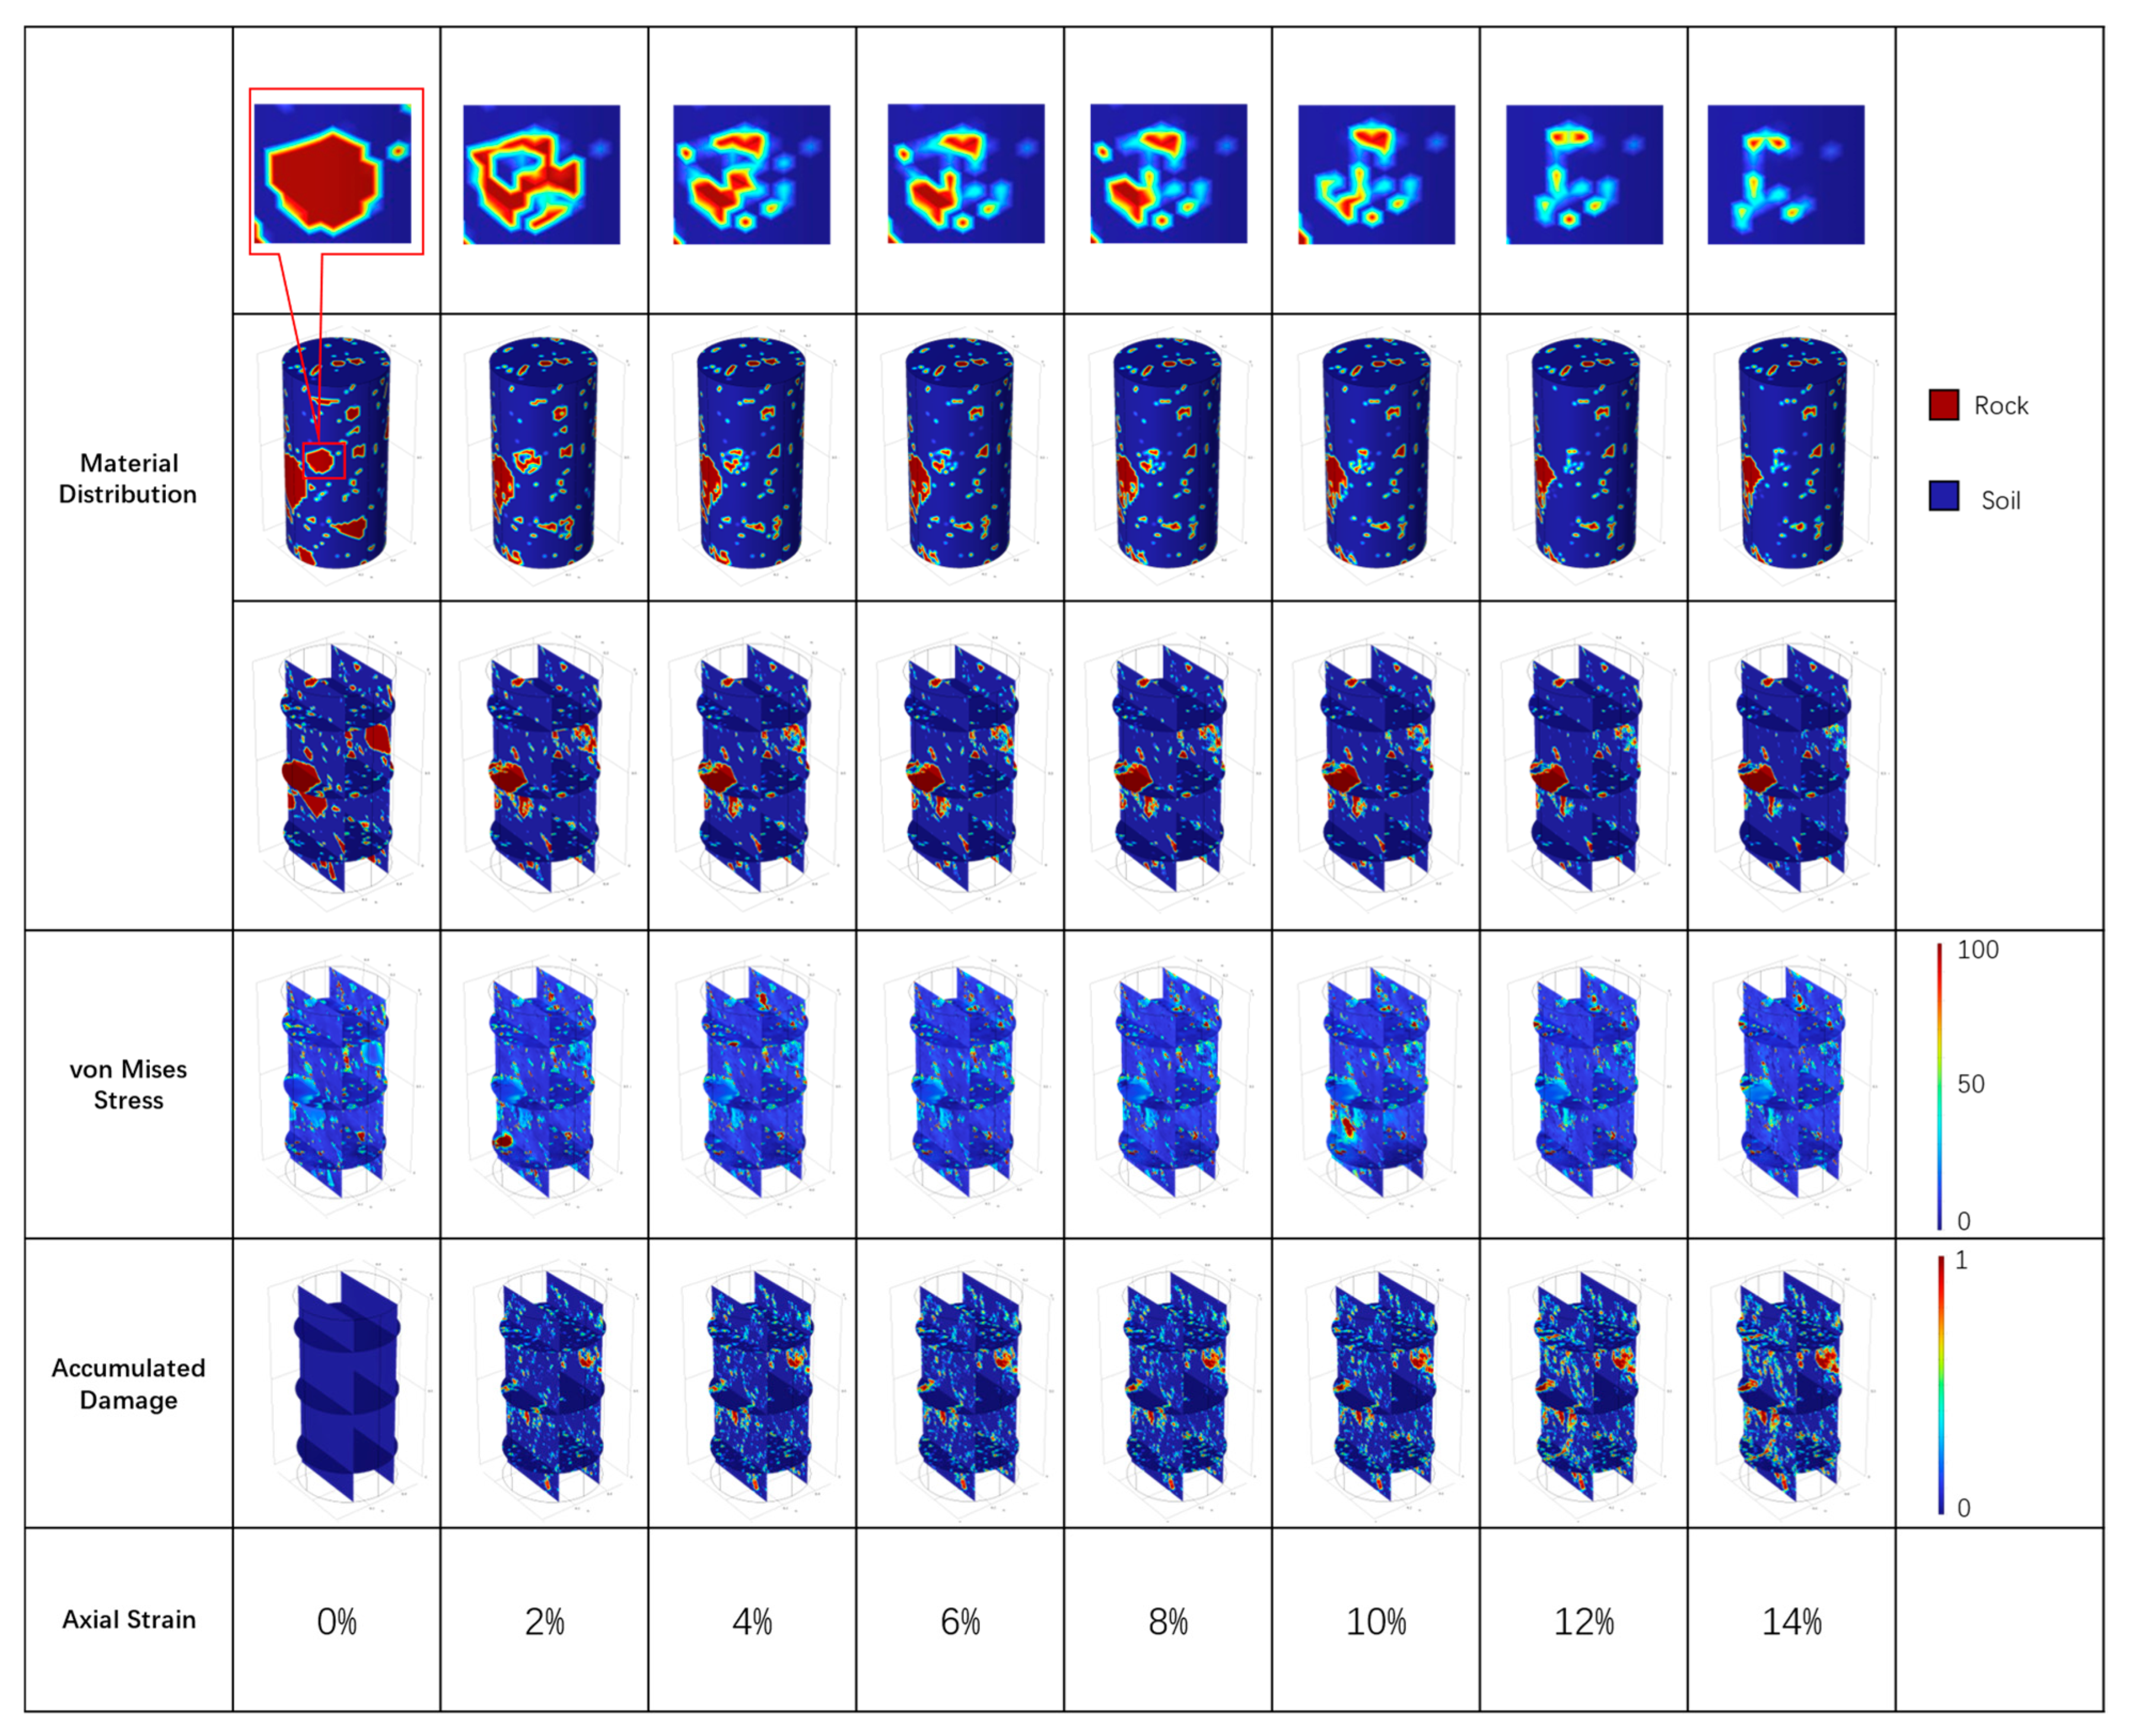
  • The numerical simulation results of the uniaxial compressive test show that, in the SRM structure, the rock particles bear the majority of the load, and the stress concentration phenomenon is observed at the edges of the rock particles. Due to the stress concentration, large rock particles break down into several smaller rock particles and the stress is redistributed;
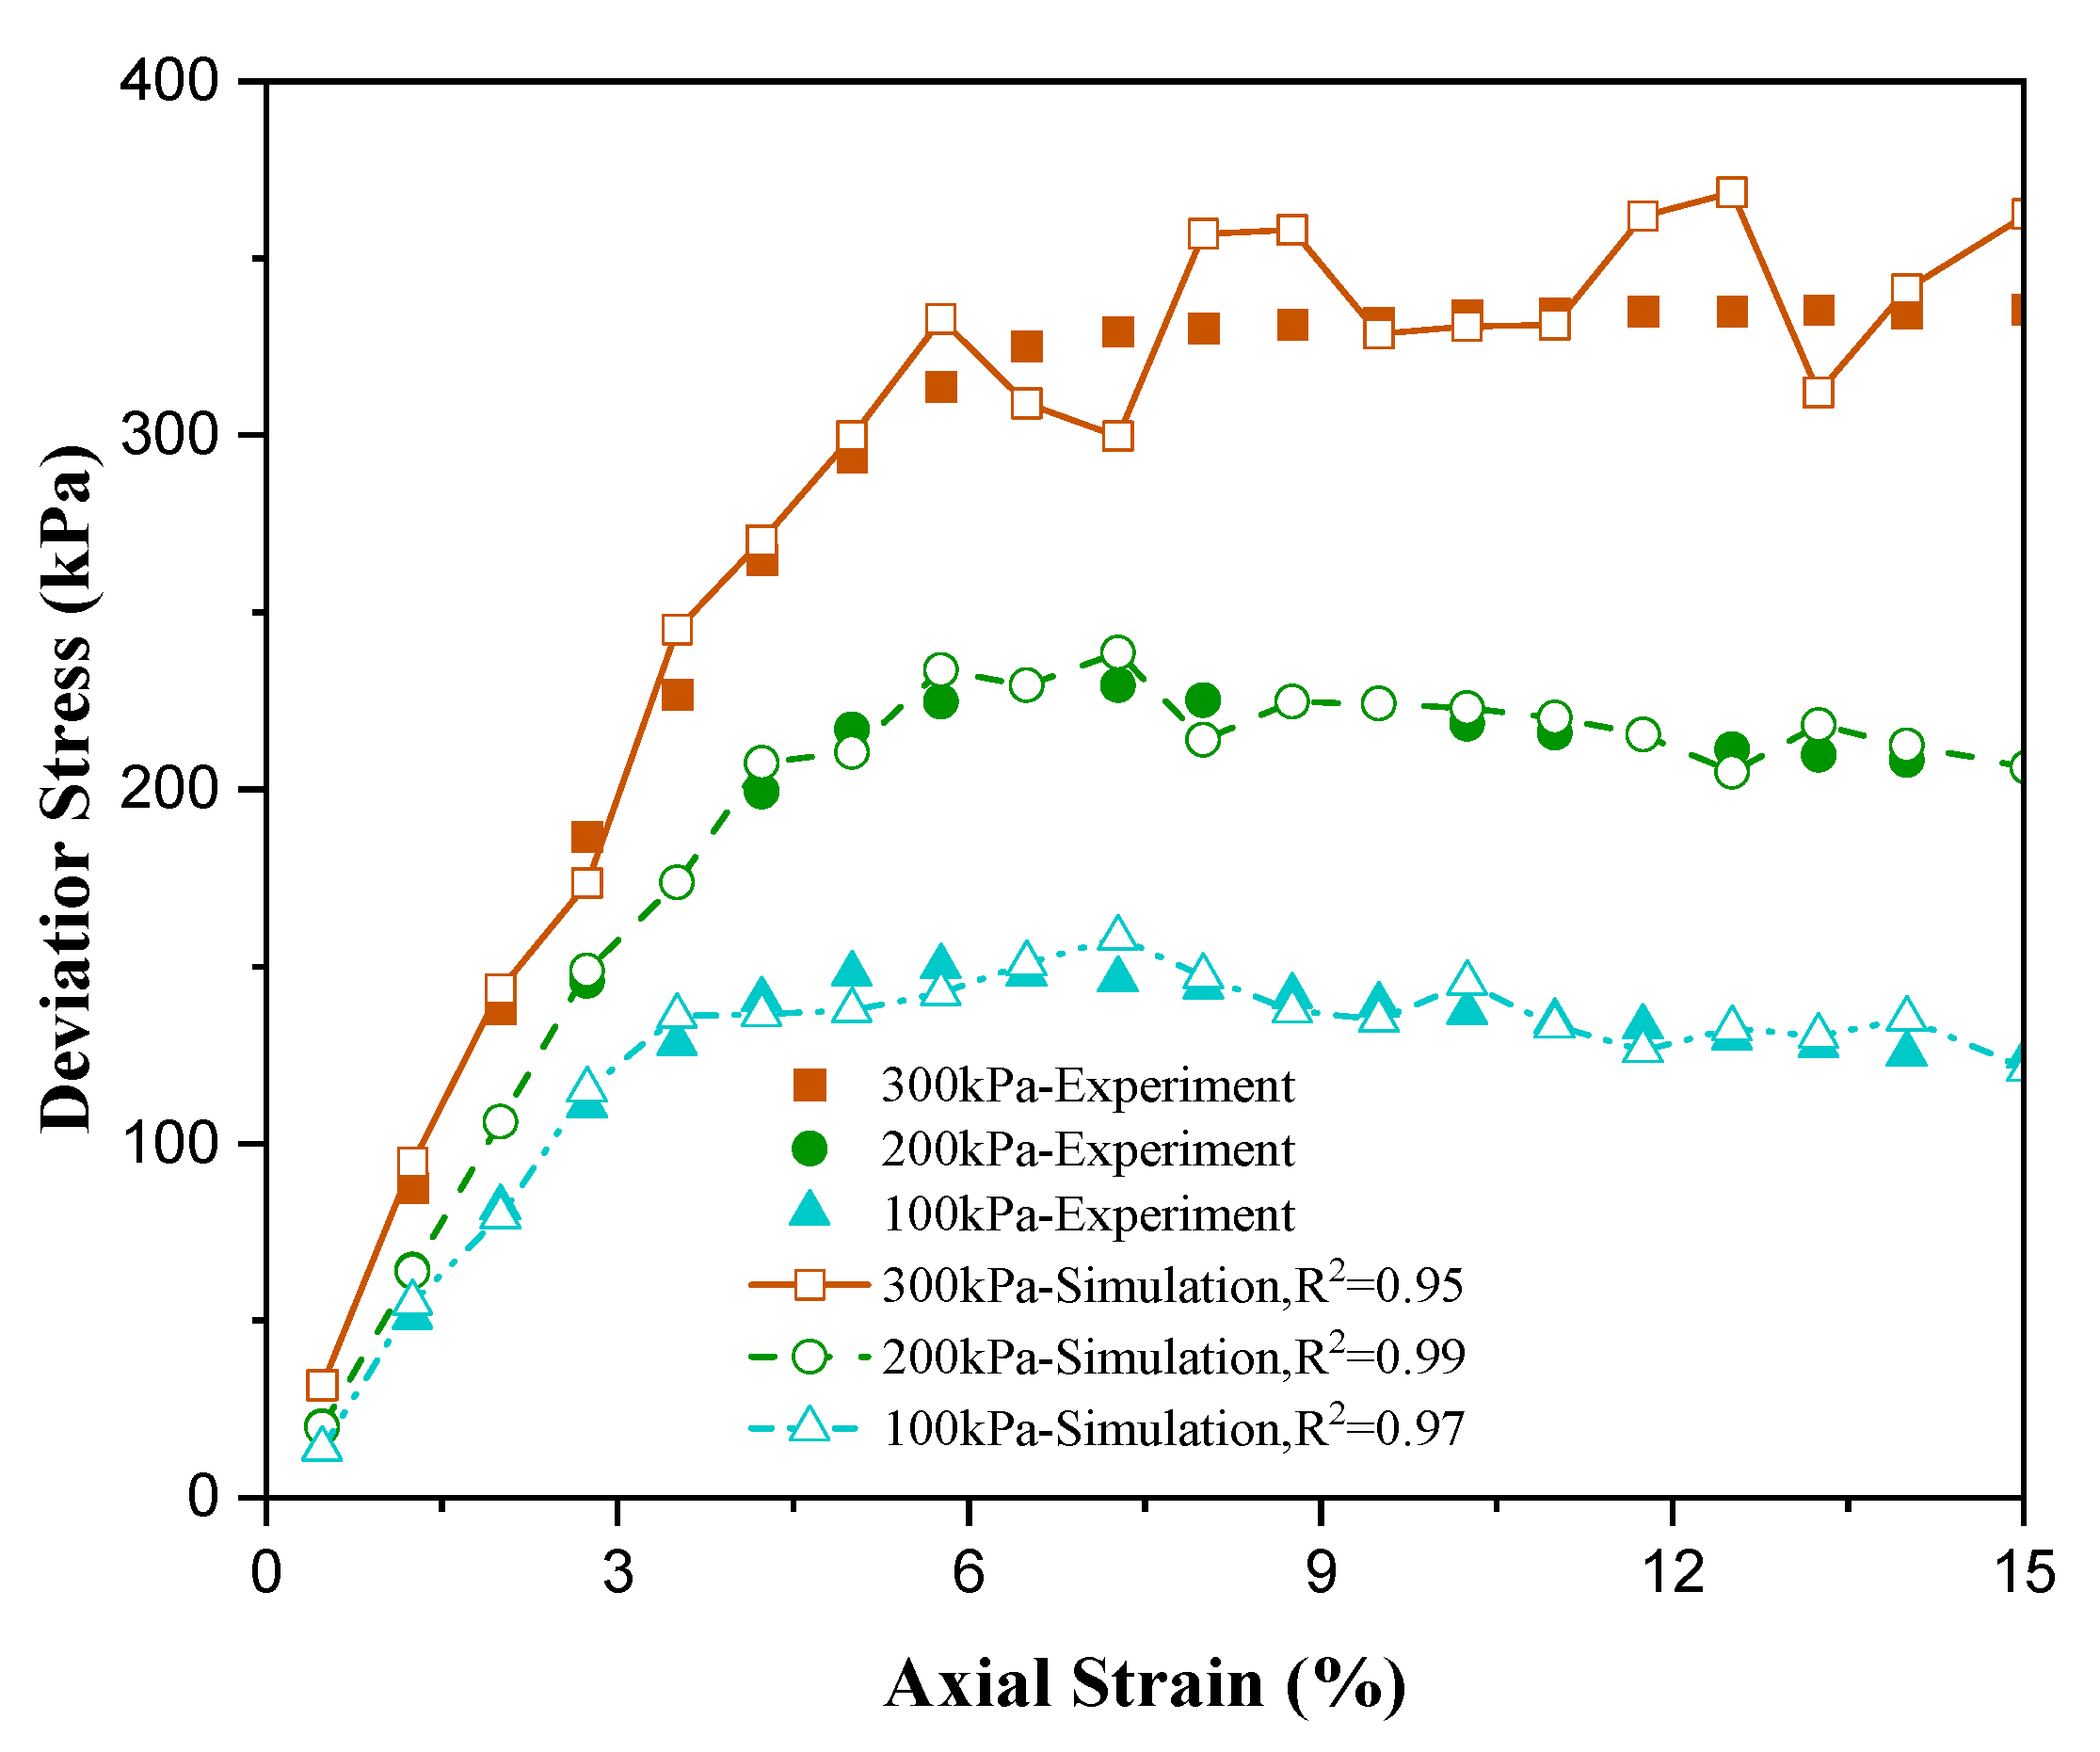
  • The stress–strain curve of the numerical simulation is in good agreement with the results from the experiment. This result indicates that the proposed computational approach can accurately characterize the mechanical behavior of SRM material.

Author Contributions

The authors confirm contribution to the paper as follows: study conception and design: Z.L., H.Y. and Z.Z.; data collection: Y.X. and G.L.; data analysis: Z.L. and G.L.; draft manuscript preparation: Z.Z., Z.L. and Y.X. All authors have read and agreed to the published version of the manuscript.

Funding

The experiments described and the resulting data presented herein, unless otherwise noted, were funded under the Natural Science Foundation of Hebei Province (Grant No. E2021508026) the Fundamental Research Funds for the Central Universities (Grant No. 3142023013).

Institutional Review Board Statement

Not applicable.

Informed Consent Statement

Not applicable.

Data Availability Statement

The data supporting this study are included in the paper.

Conflicts of Interest

The authors declare that they have no known competing financial interests or personal relationships that could have appeared to influence the work reported in this paper.

References

  1. Yang, C. Numerical Simulation of Rock-Soil Aggregate Mixture-Throughout Digital Image Processing. Soil Eng. Found. 2019, 33, 49. [Google Scholar]
  2. Medley, E.W. The Engineering Characterization of Melanges and Similar Block-in-Matrix Rocks (Bimrocks); University of California: Berkeley, CA, USA, 1994. [Google Scholar]
  3. Xu, W.-J.; Yue, Z.-Q.; Hu, R.-L. Study on the mesostructure and mesomechanical characteristics of the soil–rock mixture using digital image processing based finite element method. Int. J. Rock Mech. Min. Sci. 2008, 45, 749–762. [Google Scholar] [CrossRef]
  4. Meng, Q.; Wang, H.; Xu, W.; Zhang, Q. A coupling method incorporating digital image processing and discrete element method for modeling of geomaterials. Eng. Comput. 2018, 35, 411–431. [Google Scholar] [CrossRef]
  5. Xu, W.-J.; Hu, L.-M.; Gao, W. Random generation of the meso-structure of a soil-rock mixture and its application in the study of the mechanical behavior in a landslide dam. Int. J. Rock Mech. Min. Sci. 2016, 86, 166–178. [Google Scholar] [CrossRef]
  6. Xu, W.-J.; Zhang, H.-Y.; Jie, Y.-X.; Yu, Y.-Z. Generation of 3D random meso-structure of soil-rock mixture and its meso-structural mechanics based on numerical tests. J. Central South Univ. 2015, 22, 619–630. [Google Scholar] [CrossRef]
  7. Meng, Q.; Wang, H.; Xu, W.; Cai, M. A numerical homogenization study of the elastic property of a soil-rock mixture using random mesostructure generation. Comput. Geotech. 2018, 98, 48–57. [Google Scholar] [CrossRef]
  8. Li, Z.; Yi, H.; Zhu, C.; Zhuo, Z.; Liu, G. Randomly Generating the 3D Mesostructure of Soil Rock Mixtures Based on the Full In Situ Digital Image Processed Information. Fractal Fract. 2022, 6, 570. [Google Scholar] [CrossRef]
  9. Cecconi, M.; DeSimone, A.; Tamagnini, C.; Viggiani, G.M. A constitutive model for granular materials with grain crushing and its application to a pyroclastic soil. Int. J. Numer. Anal. Methods Géoméch. 2002, 26, 1531–1560. [Google Scholar] [CrossRef]
  10. Daouadji, A.; Hicher, P.-Y.; Rahma, A. An elastoplastic model for granular materials taking into account grain breakage. Eur. J. Mech. A/Solids 2001, 20, 113–137. [Google Scholar] [CrossRef]
  11. Li, X.; Liao, Q.; He, J. In-situ tests and a stochastic structural model of rock and soil aggregate in the three gorges reservoir area, china. Int. J. Rock Mech. Min. Sci. 2004, 41, 702–707. [Google Scholar] [CrossRef]
  12. Zhang, H.-Y.; Xu, W.-J.; Yu, Y.-Z. Triaxial tests of soil–rock mixtures with different rock block distributions. Soils Found. 2016, 56, 44–56. [Google Scholar] [CrossRef]
  13. Zhang, Z.-L.; Xu, W.-J.; Xia, W.; Zhang, H.-Y. Large-scale in-situ test for mechanical characterization of soil–rock mixture used in an embankment dam. Int. J. Rock Mech. Min. Sci. 2016, 86, 317–322. [Google Scholar] [CrossRef]
  14. Cen, D.; Huang, D.; Ren, F. Shear deformation and strength of the interphase between the soil–rock mixture and the benched bedrock slope surface. Acta Geotech. 2016, 12, 391–413. [Google Scholar] [CrossRef]
  15. Jin, L.; Zeng, Y.; Xia, L.; Ye, Y. Experimental and Numerical Investigation of Mechanical Behaviors of Cemented Soil–Rock Mixture. Geotech. Geol. Eng. 2016, 35, 337–354. [Google Scholar] [CrossRef]
  16. Zhang, J.; Rao, Q.; Yi, W. Viscoelastic Parameter Prediction of Multi-Layered Coarse-Grained Soil with Consideration of Interface-Layer Effect. Appl. Sci. 2020, 10, 8879. [Google Scholar] [CrossRef]
  17. Meng, Q.; Wang, H.; Cai, M.; Xu, W.; Zhuang, X.; Rabczuk, T. Three-dimensional mesoscale computational modeling of soil-rock mixtures with concave particles. Eng. Geol. 2020, 277, 105802. [Google Scholar] [CrossRef]
  18. Xu, W.-J.; Wang, S.; Zhang, H.-Y.; Zhang, Z.-L. Discrete element modelling of a soil-rock mixture used in an embankment dam. Int. J. Rock Mech. Min. Sci. 2016, 86, 141–156. [Google Scholar] [CrossRef]
  19. Shan, P.; Lai, X. Mesoscopic structure PFC∼2D model of soil rock mixture based on digital image. J. Vis. Commun. Image Represent. 2018, 58, 407–415. [Google Scholar] [CrossRef]
  20. Latham, J.-P.; Munjiza, A.; Garcia, X.; Xiang, J.; Guises, R. Three-dimensional particle shape acquisition and use of shape library for DEM and FEM/DEM simulation. Miner. Eng. 2008, 21, 797–805. [Google Scholar] [CrossRef]
  21. Gu, F.; Sahin, H.; Luo, X.; Luo, R.; Lytton, R.L. Estimation of Resilient Modulus of Unbound Aggregates Using Performance-Related Base Course Properties. J. Mater. Civ. Eng. 2015, 27, 04014188. [Google Scholar] [CrossRef]
  22. Sun, S.; Zhu, F.; Wei, J.; Wang, W.; Le, H. Experimental Study on Shear Failure Mechanism and the Identification of Strength Characteristics of the Soil-Rock Mixture. Shock. Vib. 2019, 2019, 1–25. [Google Scholar] [CrossRef]
  23. Kockara, S.; Halic, T.; Iqbal, K.; Bayrak, C.; Rowe, R. Collision detection: A survey. In Proceedings of the 2007 IEEE International Conference on Systems, Man and Cybernetics, Montreal, QC, Canada, 7–10 October 2007. [Google Scholar]
  24. Yao, Y.; Li, J.; Ni, J.; Liang, C.; Zhang, A. Effects of gravel content and shape on shear behaviour of soil-rock mixture: Experiment and DEM modelling. Comput. Geotech. 2022, 141, 104476. [Google Scholar] [CrossRef]
Figure 1. Flowchart of the mesostructure generation algorithm.
Applsci 13 10552 g001
Figure 2. Example of generating a rounded rock particle. (a) generating sphere boundary and random tangential sections; (b) selecting random vertices in the tangential section; (c) connecting generated vertices.
Applsci 13 10552 g002
Figure 3. Example of generating an angular rock particle. (a) generating sphere boundary and the first tetrahedron; (b) randomly generating anther vertex on the surface with the largest area; (c) connecting generated vertices.
Applsci 13 10552 g003
Figure 4. Example of the area discretization.
Applsci 13 10552 g004
Figure 5. Examples of SRM geometries with different rock content before and after discretization.
Applsci 13 10552 g005
Figure 6. Flowchart of the mesoscale computational approach.
Applsci 13 10552 g006
Figure 7. Evolution of the material distribution, von Mises stress, and accumulated damage of the uniaxial compressive strength.
Applsci 13 10552 g007
Figure 8. Comparison between the numerical simulation and experimental data of the triaxial compressive tests under different confining loadings.
Applsci 13 10552 g008
Disclaimer/Publisher’s Note: The statements, opinions and data contained in all publications are solely those of the individual author(s) and contributor(s) and not of MDPI and/or the editor(s). MDPI and/or the editor(s) disclaim responsibility for any injury to people or property resulting from any ideas, methods, instructions or products referred to in the content.

