Article

Field Experiments on 3D Groundwater Flow Patterns in the Deep Excavation of Gravel-Confined Aquifers in Ancient Riverbed Areas

1
College of Civil Engineering, Tongji University, Shanghai 200092, China
2
Key Laboratory of Geotechnical and Underground Engineering, Ministry of Education, Tongji University, Shanghai 200092, China
3
Shanghai Institute of Geological Survey, Shanghai 200072, China
4
Shanghai Guanglian Environmental Geotechnical Co., Ltd., Shanghai 200436, China
5
China 20 Metallurgical Group Co., Ltd., Shanghai 201999, China
*
Authors to whom correspondence should be addressed.
Appl. Sci. 2023, 13(18), 10438; https://doi.org/10.3390/app131810438
Submission received: 12 August 2023 / Revised: 6 September 2023 / Accepted: 9 September 2023 / Published: 18 September 2023

Abstract

:
In ancient riverbed areas, the hydro-geological conditions are extremely complex because of the cutting of ancient river channels during the sedimentary process. How to lower groundwater level in water-riched gravel-confined aquifer during deep excavation is vital for underground engineering. Groundwater flow patterns had to be understood during foundation pit dewatering. This paper presents a field case study conducted at the deep foundation pit of the Qianjiang Century City station on Hangzhou Metro Line 6, which is notable for its 52 m deep unclosed waterproof curtain. A total of 34 pumping wells were installed within the pit. During the tests, one well was subjected to a pumping well, while the others served as observation wells. The research included two sets of multi-depth pumping tests, which differed in terms of their filter lengths, aimed at investigating the flow pattern around pump wells and the roots of diaphragm walls. The study found that the use of longer filters, higher pump rates, and filters placed nearer to aquifer roofs enhances dewatering efficiency and minimizes impact on the surrounding geological environment. This paper introduces a novel concept known as the diaphragm wall–pumping well effect, which regulates the water head outside the pit and the subsidence, thereby optimizing the drawdown of the deep foundation pit with an unclosed waterproof curtain. The findings were applied in the foundation pit dewatering of Qianjiang Century City station, and the drawdown in and outside the pit was effectively controlled.

1. Introduction

Foundation pits are significant structures utilized in large-scale underground space construction [1,2,3]. As urban development progresses, the continuous expansion of excavation area and depth could pose environmental impacts. In particular, excavations in multi-aquifer-aquitard strata, abundant in groundwater, present considerable risks [4]. Groundwater control is thus imperative to prevent water inrush accidents and ensure the safety of underground construction [5,6,7,8,9,10,11,12,13,14]. However, inappropriate dewatering can lead to undesirable consequences such as soil deformation, differential settlement, and sand flow or piping [15,16,17,18]. To mitigate these adverse effects, waterproof curtains such as diaphragm walls, bored piles, and mixing piles are established before excavation [19,20]. By preventing water seepage and extending the seepage path, these curtains help minimize groundwater extraction and ground settlement. Depending on the relative position of the excavation depth of the foundation pit and the confined aquifer, foundation pits can be classified into three categories. In the case of shallow foundation pit excavation, diaphragm walls do not intrude into the aquifer. This method, however, is unsuitable for further urban underground space development. Diaphragm walls are employed to completely sever the aquifer. While effective when dealing with thin and shallow aquifers, this method becomes cost-prohibitive and technically challenging when the pit intersects deep aquifers. The third method uses an unclosed waterproof curtain (Figure 1). This technique is applied when a deep excavation pit is situated over a deep aquifer, offering economic, technical, safety, and environmental advantages. The unclosed waterproof curtain method has been extensively used in foundation pit dewatering, evident in various projects such as the Shanghai Metro station [21], Shanghai Metro Line 4 [22,23], Shanghai Metro Line 9 [24], Hangzhou Metro Line 1 [25], and Hangzhou Yangtze River Crossing Tunnel, among others [26,27,28,29,30,31]. Numerous simulations have been performed to study the effect of unclosed waterproof curtains on dewatering [32,33].
The seepage mechanism associated with an unclosed waterproof curtain is more complex than that of a closed waterproof curtain. Combining partially penetrating wells with curtains results in a complex 3D seepage field, where coupled non-Darcy flow phenomena significantly contribute to seepage energy dissipation [34,35]. The anisotropy of aquifer permeability also enhances the effectiveness of dewatering methods [31]. The evolution of experimental methods has enabled a more in-depth examination of the coupled wall-well effect, facilitating a more comprehensive understanding of its attributes. Due to the hydraulic connection between the groundwater inside and outside of the unclosed waterproof curtain, a rapid drop in the water level inside the pit leads to the outside groundwater bypassing the curtain bottom. This water then enters the foundation pit directly due to pressure differences on both sides of the curtain. Moreover, the flow mode of the unclosed waterproof curtain can be analyzed in three dimensions due to the anisotropy of the curtain geometry and soil characteristics. Wu (1995) [34] conducted a field case study for Metro station dewatering engineering, where he examined the characteristics of groundwater seepage along diaphragm walls and proposed a mathematical model for 3D seepage flow in a viscoelastic leaky aquifer. More recent studies have explored the 3D seepage flow mechanism using numerical modeling [36,37,38,39,40,41,42]. For instance, a finite element numerical model was utilized to assess and quantify the impact of significant dewatering on fault-controlled regional groundwater flow in the Acque Albule basin [43]. The fluid-structure interaction model was employed to quantitatively investigate non-Darcy effects on natural convective flow and heat transmission in a square enclosure filled with porous media [44]. The study considered different flow models for porous media, such as Darcy’s law model and the Darcy–Forchheimer model. The importance of soil characterization and the need to perform a water tightness assessment test were emphasized before the excavation stage, as applied to the excavation of a deep shaft of a high-speed train tunnel in Barcelona. However, their study could not accurately predict pumping settlements. To model the soil behavior during dewatering, a 3D hydromechanical numerical model and prior knowledge of the initial stress distribution would have been necessary [19]. Furthermore, the blocking effect on groundwater seepage under varying insertion depths of retaining walls in the aquifer was investigated through laboratory tests and numerical simulation. The results demonstrated that the drawdown of the groundwater level decreases with an increase in the insertion depth ratio of retaining structures in an aquifer. The optimal value of the insertion depth ratio (approximately 70%) was obtained for the retaining wall [45].
In the context of a water-rich gravel layer within the aquifer, the potential for safety accidents is increased due to several factors. These include the limited compressibility, absence of cohesive forces, and high permeability of the gravel layer. Groundwater seepage in the pebble stratum of water-rich sand is likely to carry away fine sand particles, leading to substantial water inrush and consequent settlement of the surrounding strata. This settlement poses a direct threat to the safety of nearby structures. In the case of deep foundation pits situated in ancient riverbed areas with gravel-confined aquifers, the prominent hydraulic conductivity, distinct anisotropy, and the presence of 3D flow patterns require the implementation of strategies to regulate groundwater levels inside and outside the foundation pit. By using such measures, groundwater levels can be managed, thereby reducing the potential risks associated with the unstable characteristics of the gravel-confined aquifer.
However, most research conducted thus far has utilized numerical modeling techniques to study the 3D seepage flow of a deep excavation pit with an unclosed waterproof curtain. Few field test studies or physical experiments have been reported, implying that the seepage mechanism of a deep excavation pit with an unclosed waterproof curtain remains unclear and lacks concrete verification and evidence. Especially for the foundation pits constructed in gravel-confined aquifers, lowering groundwater levels in the aquifers with high permeability near a river is quite difficult. Pumping tests have been performed to verify whether the groundwater level can be lowered effectively in gravel-confined aquifer in a deep foundation pit near Qiantang jiang River in Hangzhou. Super large pumping rates and limited drawdowns were observed. The results indicated that the pumping well group with a long filter tube could not lower the groundwater level to the designed drawdown where groundwater flowed horizontally. The expensive and dangerous underwater-excavation method had to be used later. Whether the groundwater level in gravel-confined aquifer can be lowered to designed drawdown becomes a vital question for the underground engineering construction in Hangzhou.
In this paper, a three-floor underground land platform of Qianjiang Century City Station in Hangzhou Metro Line 6 was selected as the study site. Field tests were conducted to evaluate the 3D flow pattern of the dewatering of a deep foundation pit with an unclosed waterproof curtain. To understand the drawdown control mechanism of an unclosed waterproof curtain, two pumping and dewatering tests were carried out in an underground land platform pit.

2. Background Description

2.1. Engineering Introduction

Qianjiang Century City Station on Hangzhou Metro Line 6 is a three-floor underground island platform with an excavation depth ranging from 24.1 to 26.3 m. A 1200 mm thick diaphragm wall is employed as a waterproof curtain, reaching a depth of 52 m, with approximately 14 m penetrating the gravel-confined aquifer. The gravel layer is a characteristic alluvial-diluvial product formed by the ancient Qian Tang River, with high hydraulic conductivity, abundant water content, and spatially heterogeneous permeability (Figure 2). According to long-term observations, the confined water level is between 7.94 and 10.35 m deep, with its corresponding elevation varying from 1.14 to 4.35 m. The water level remains relatively stable across seasons. As confined water poses a direct risk to the foundation pit, this hazard needs to be controlled during excavation. Figure 3 displays the top-view geometry of the foundation pit at Qianjiang Century City Station. The foundation pit is divided into three sections: the transfer node (60 m × 25 m), Pit A (125 m × 21 m), and Pit B (101 m × 23 m). The evacuation depth of the foundation pit is presented in Table 1.

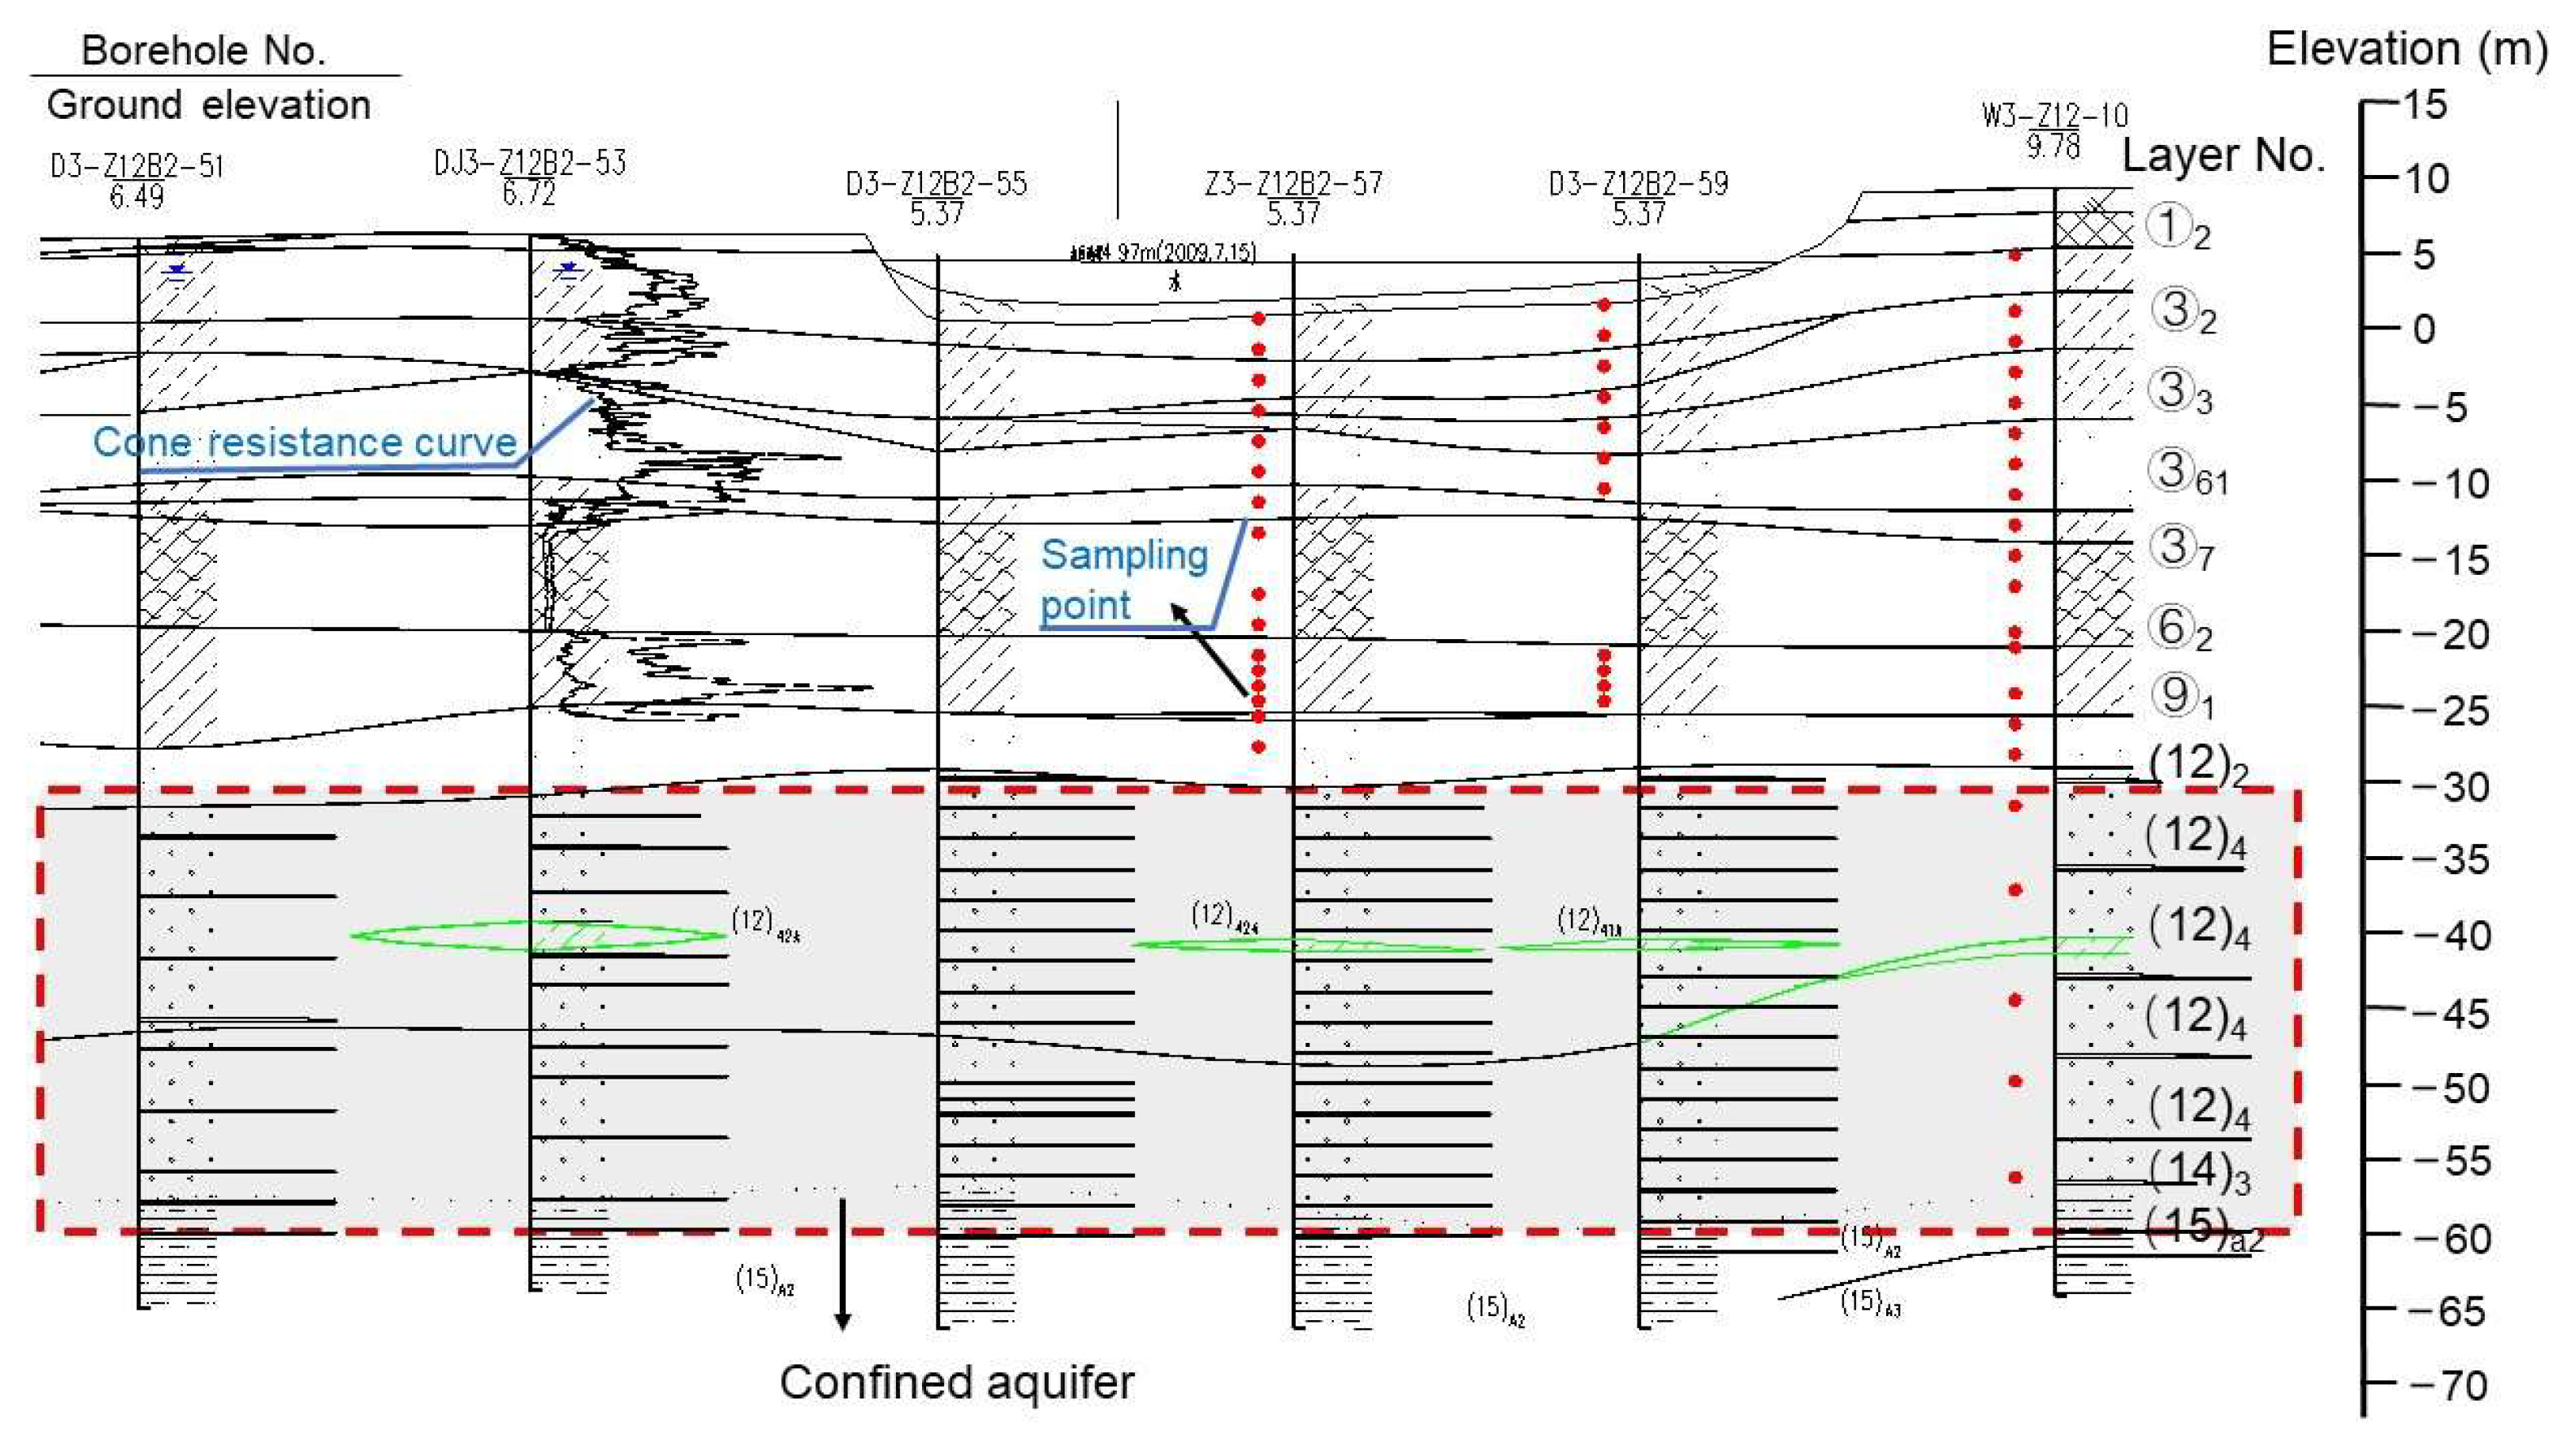
2.2. Engineering Geological Conditions

The foundation pit of Qianjiang Century City Station is situated in a Quaternary alluvial-marine sedimentary plain. The dynamics of sediment transportation are characterized by the interaction between rivers and tidal currents, with tidal currents being the dominant force, assisted by the silting of tidal flats and the merging and docking of sandbars. The topmost layer consists of 1–2 m thick plain fill and 15 m thick silt. The layer of high-compressibility, flow-plastic mucky soil is 17 m in depth and 12 m in thickness. The bottom-most layer is composed of plastic silty clay, pebbly sand, and round gravel (Figure 3 and Table 1). The groundwater at the site includes both phreatic and confined water. Phreatic water is found in the shallow plain fill, silt, and sand layer. The unconfined aquifers are low permeability layers, with a hydraulic conductivity of 4 ~ 65 × 10−5 cm/s. Confined water is distributed in the underlying silty sand, the conglomeratic silty sand of layer (12), and the gravel layer of layer (14). The overlying muddy soil and cohesive soil function as aquitards. The round gravel and sand mixture has a hydraulic conductivity of approximately 0.9 cm/s, based on pumping tests, making it a high-permeability layer (Table 2.). Long-term observations suggest that the depth of the confined water level lies between 7.94 and 10.35 m.

3. Field Experiments

To investigate the 3D flow and nonlinear flow phenomenon near the diaphragm wall and the pumping well, field multi-depth pumping tests were executed.
The pumping tests took place in the foundation pit of Qianjiang Century City Station. A total of 34 pumping wells were installed within the pit, with 19 of them located in Pit A (labeled YA1–19) and the remaining 15 in Pit B (labeled YB1–15). During the tests, one well was subjected to pumping, while the others, which had not been tested, served as observation wells. Additionally, observation wells (i.e., H2 and YW1) were established outside the foundation pit to monitor the impact of the pumping test on the nearby groundwater. Pore pressure gauges were also installed along the exterior of the observation well to track the changes in groundwater pore pressure at varying depths.
The KXR-3031 vibrating string pore pressure gauge was used in pore pressure monitoring. The measurement threshold was 0.4 MPa, and the precision was 0.05%F.S. Before installation, the pore pressure gauges were fully saturated with water. A borehole was drilled at the predetermined position, and the filter tube of the pumping well was inserted. Filter material was filled between the filter tube and the borehole wall and measured continuously up to the designated depth of a pore pressure gauge. The pore pressure gauge, covered in cotton cloth, was then installed down to its position. More filter material was filled in to cover the pore pressure gauge until reaching the second design depth for the next pore pressure gauge. Following these steps, the pore pressure gauges were installed at intervals of 3 m and 2 m. Filter material was filled to the design depth, and then the remaining space between the well tube and the borehole wall was backfilled using high-quality clay balls.
The pore pressure gauges were positioned outside the wells to monitor the pore pressure in the filter materials. The groundwater pressure head at the observation point can be calculated using Equation (1):
H = p γ w
where H is the piezometric head (m); p is the pore pressure (kN); and γ w is the unit weight of water (kN/m3).
The DT515 automatic data acquisition instrument was used to collect the data during the in-site pumping test. The time interval of data collection was 1 min. It can connect 30 group data simultaneously, and automatically store them in digital text format.
The piezometric head of an observation point can be calculated by adding the position elevation and the pressure head. Variations in pore pressure before and after dewatering can be observed and calculated as drawdown.
As the experimental pumping wells had been adequately flushed and the mud skin was torn off, the pore pressures were observed in the filter material outside the well casing and drain, rather than inside. The drawdown represented the aquifer drawdown near the pumping well rather than the drawdown inside the pumping well. Nonlinear effects occurred when groundwater entered the well pipe through the well casing and drain.
Two complete sets of single pumping tests were carried out in pits A and B. One set of tests (i.e., YA17) was performed in pit A, and two sets of tests (i.e., YB3 and YB8) were conducted in pit B. The arrangement for the pumping test is detailed in Table 3.
During field experiments, errors may occur because the observation is out of sync if the pumping rates and groundwater drawdown are not simultaneously observed at the designed interval, especially in the unsteady stage. Under extreme conditions, the pumping test site cannot represent all the foundation pits because of the variation of engineering conditions or the influence of existing underground structures. To solve the potential errors and limitations, automatic observation coupling with manual review technology was used to ensure simultaneous observation. The pumping test sites were verified during the detailed and supplementary investigation stage to avoid obvious variations in geological conditions.

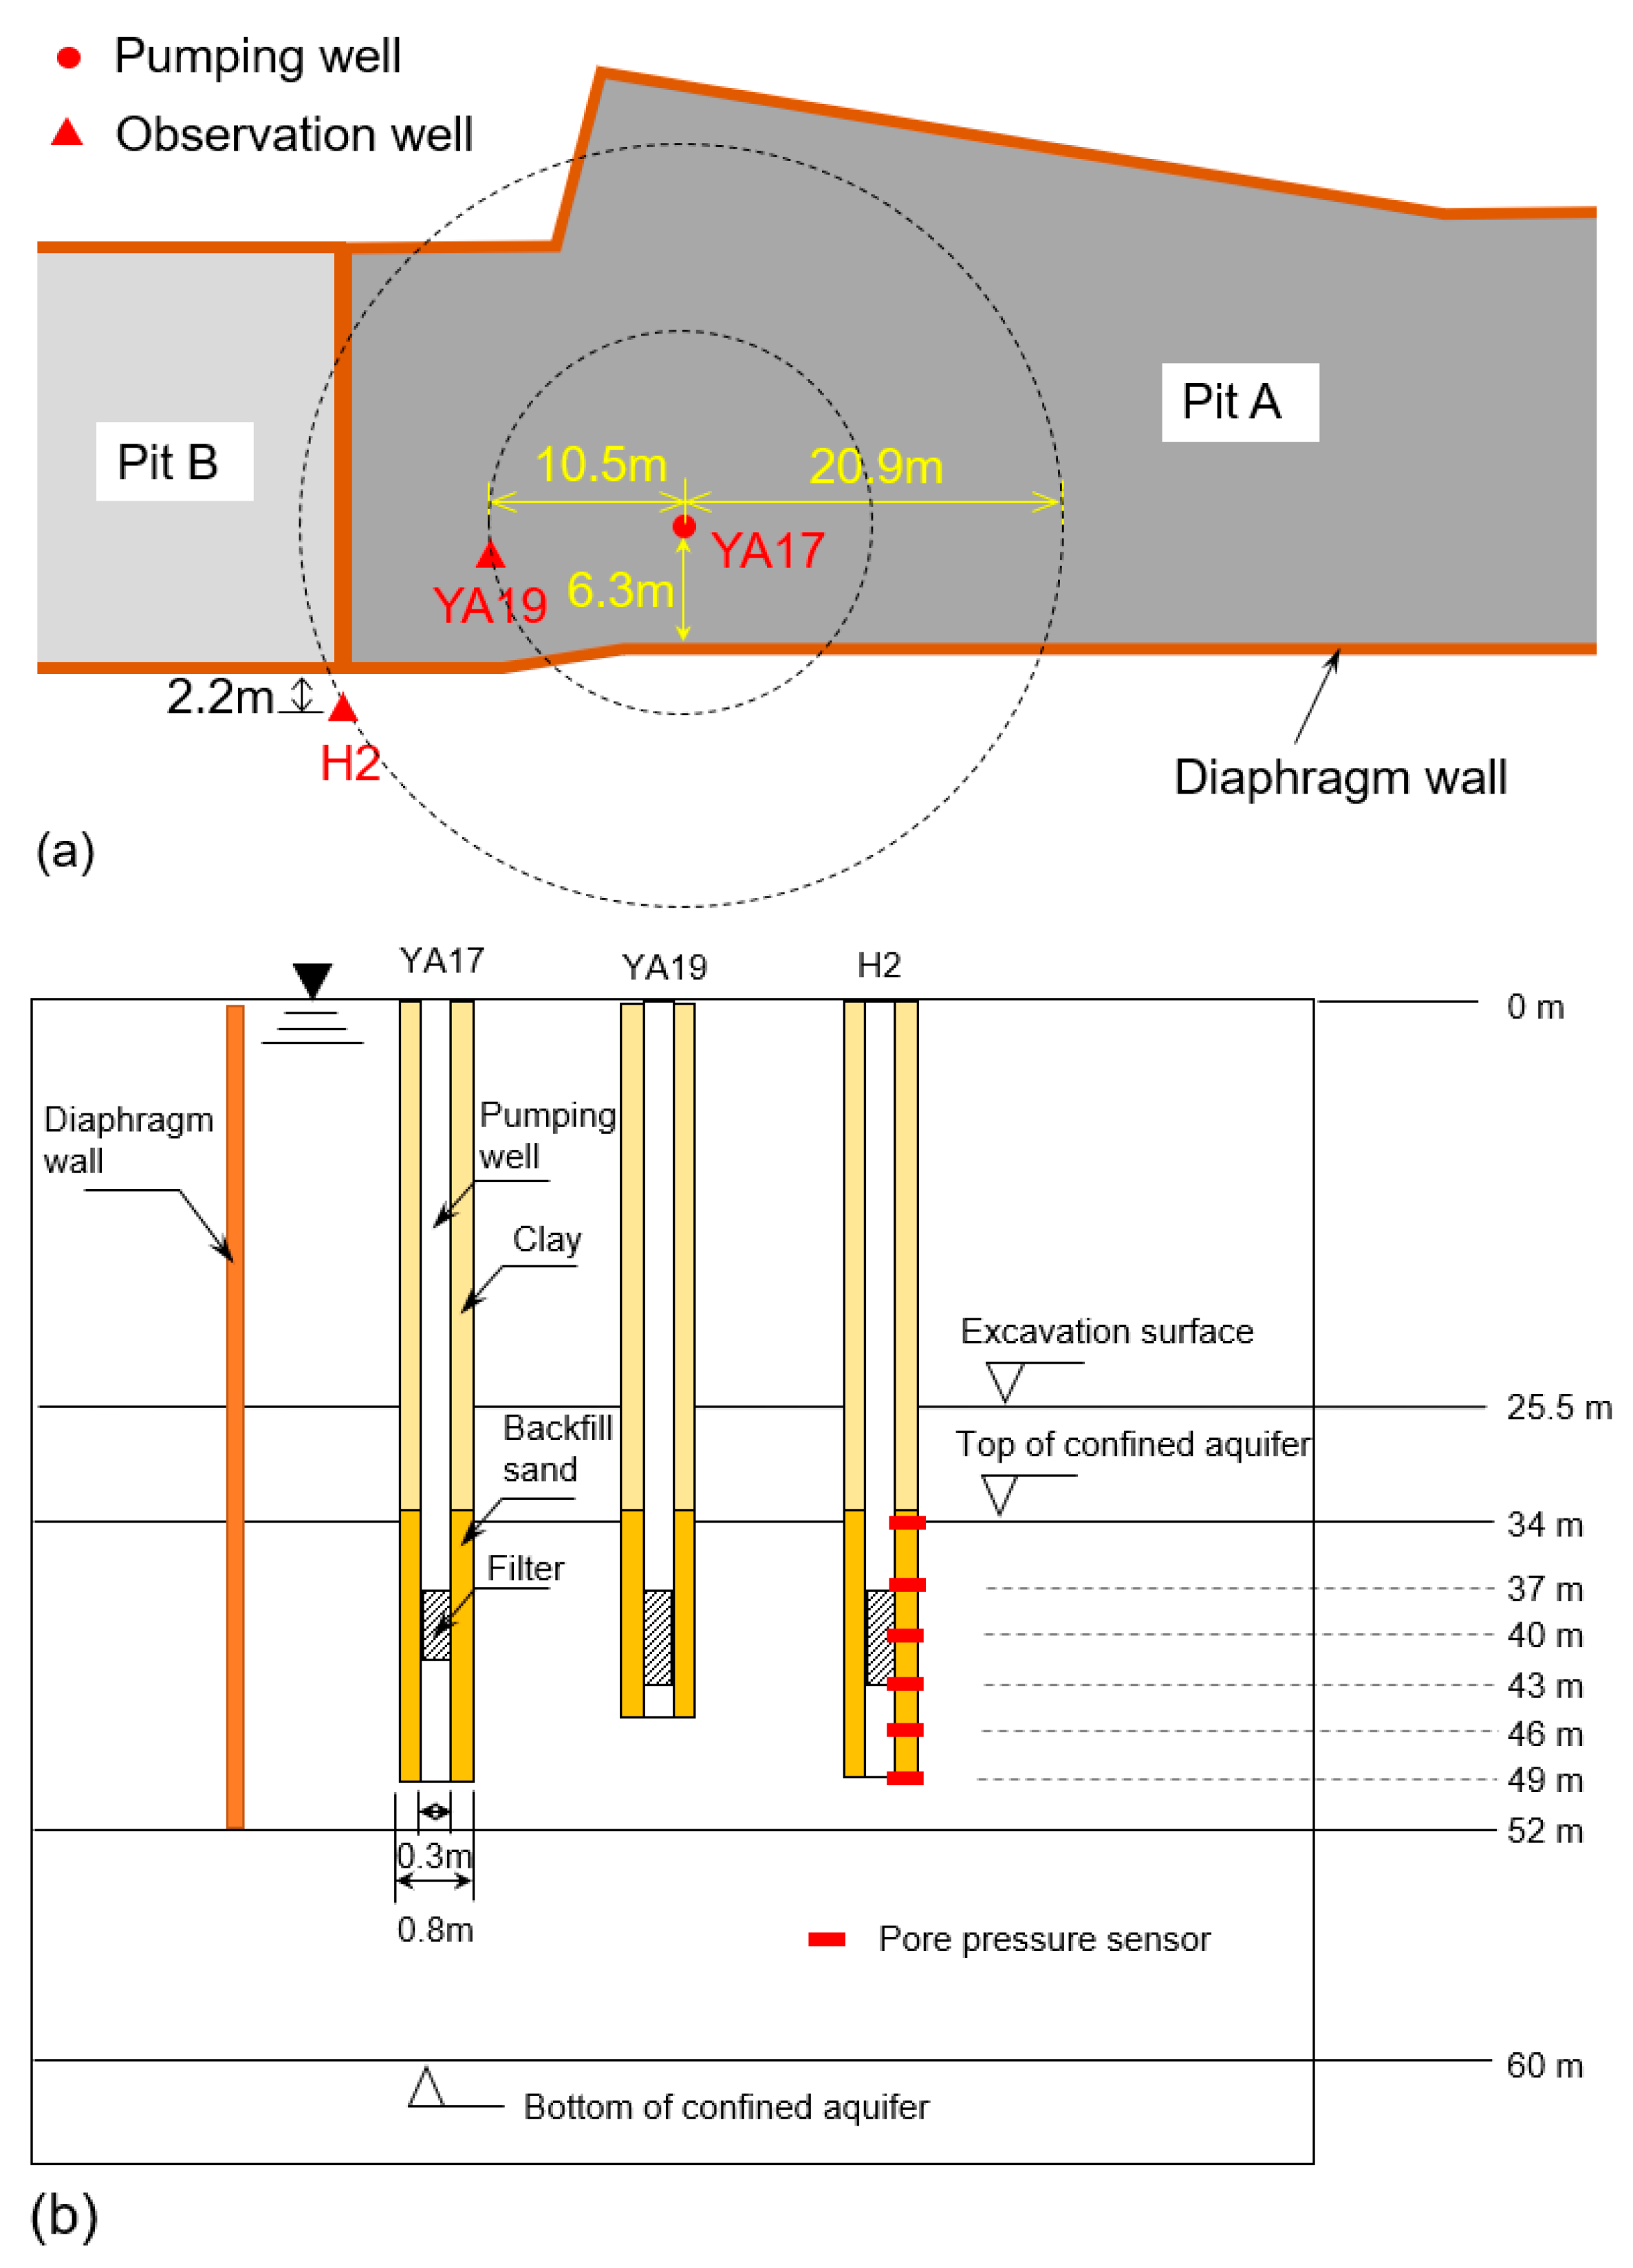
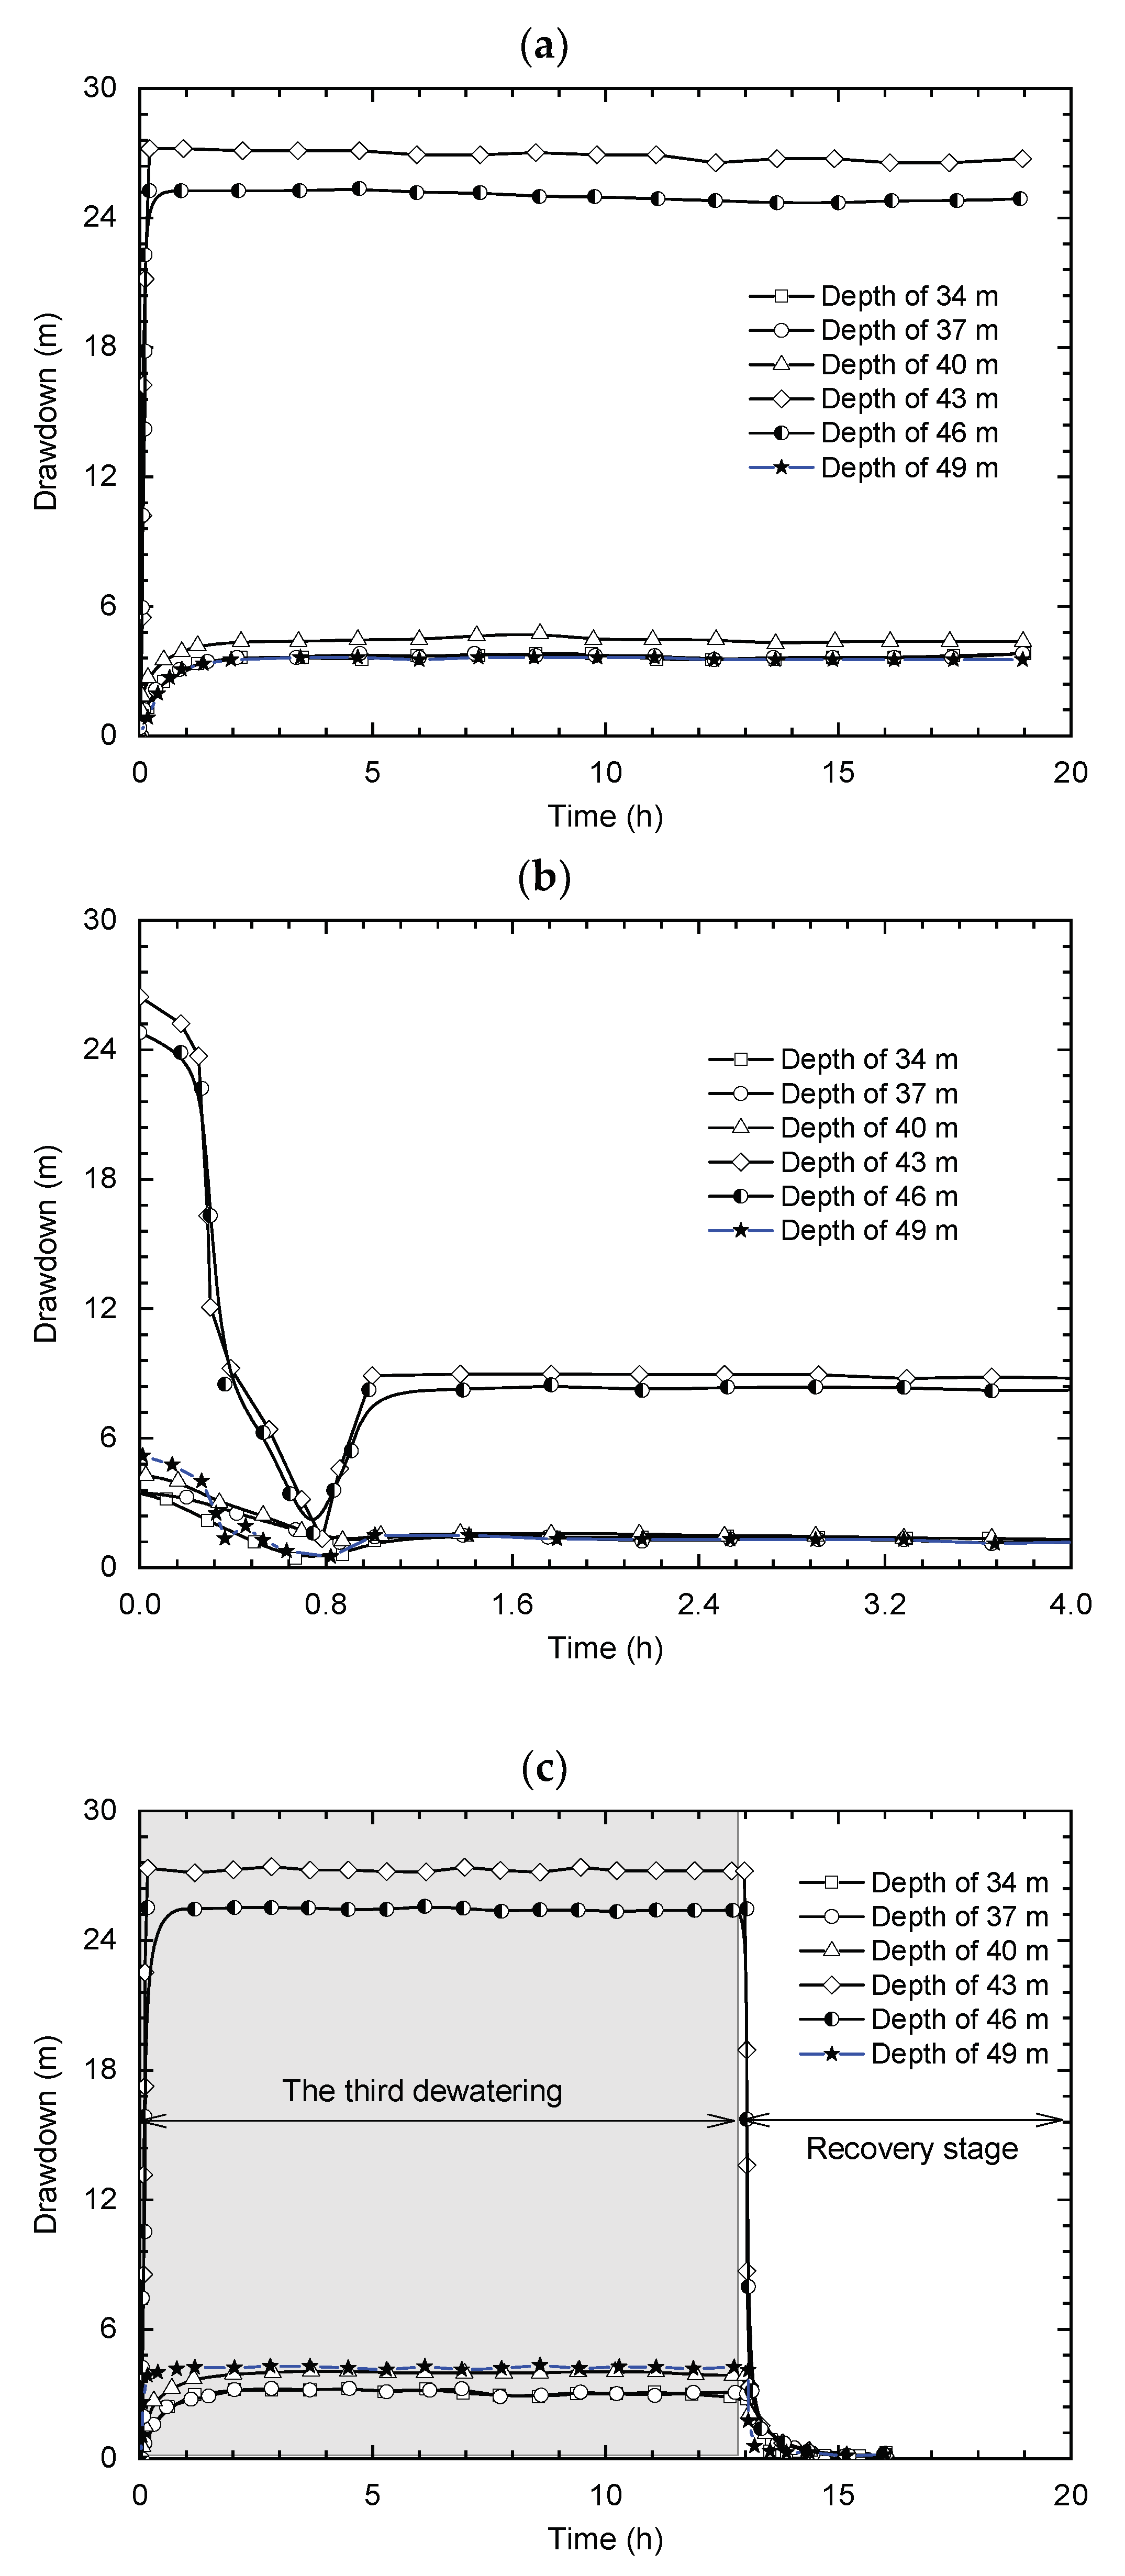
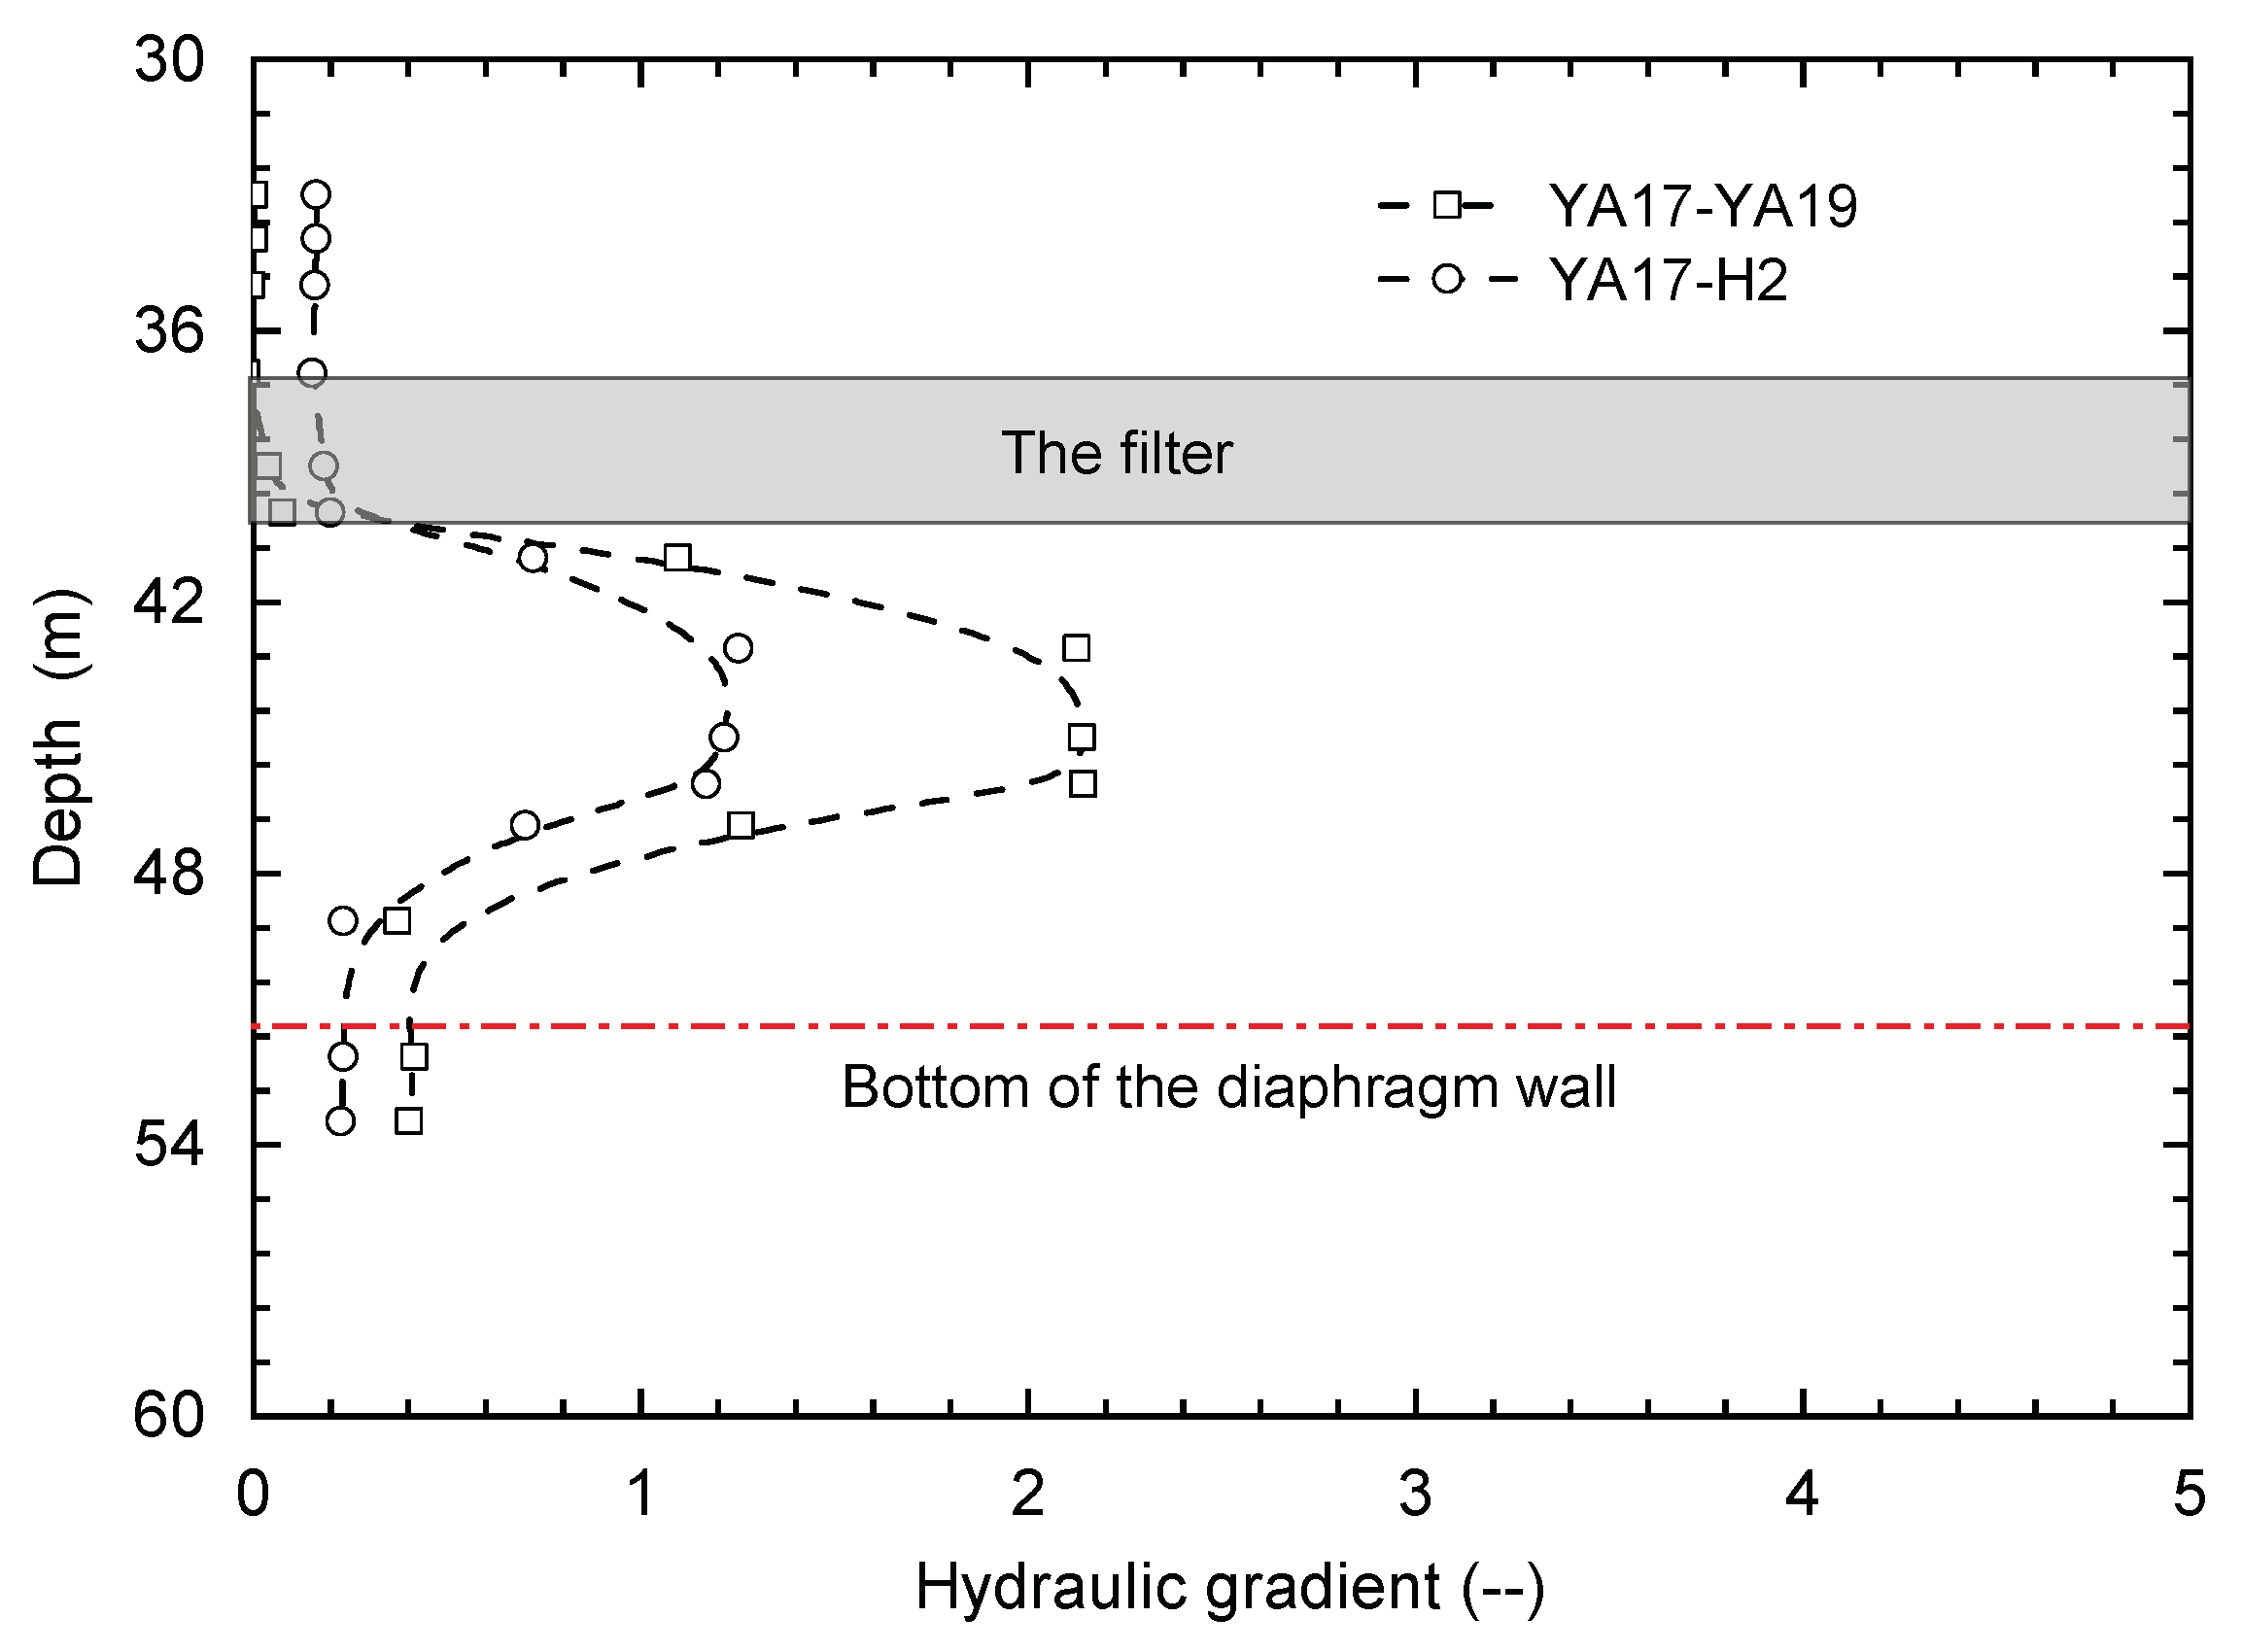
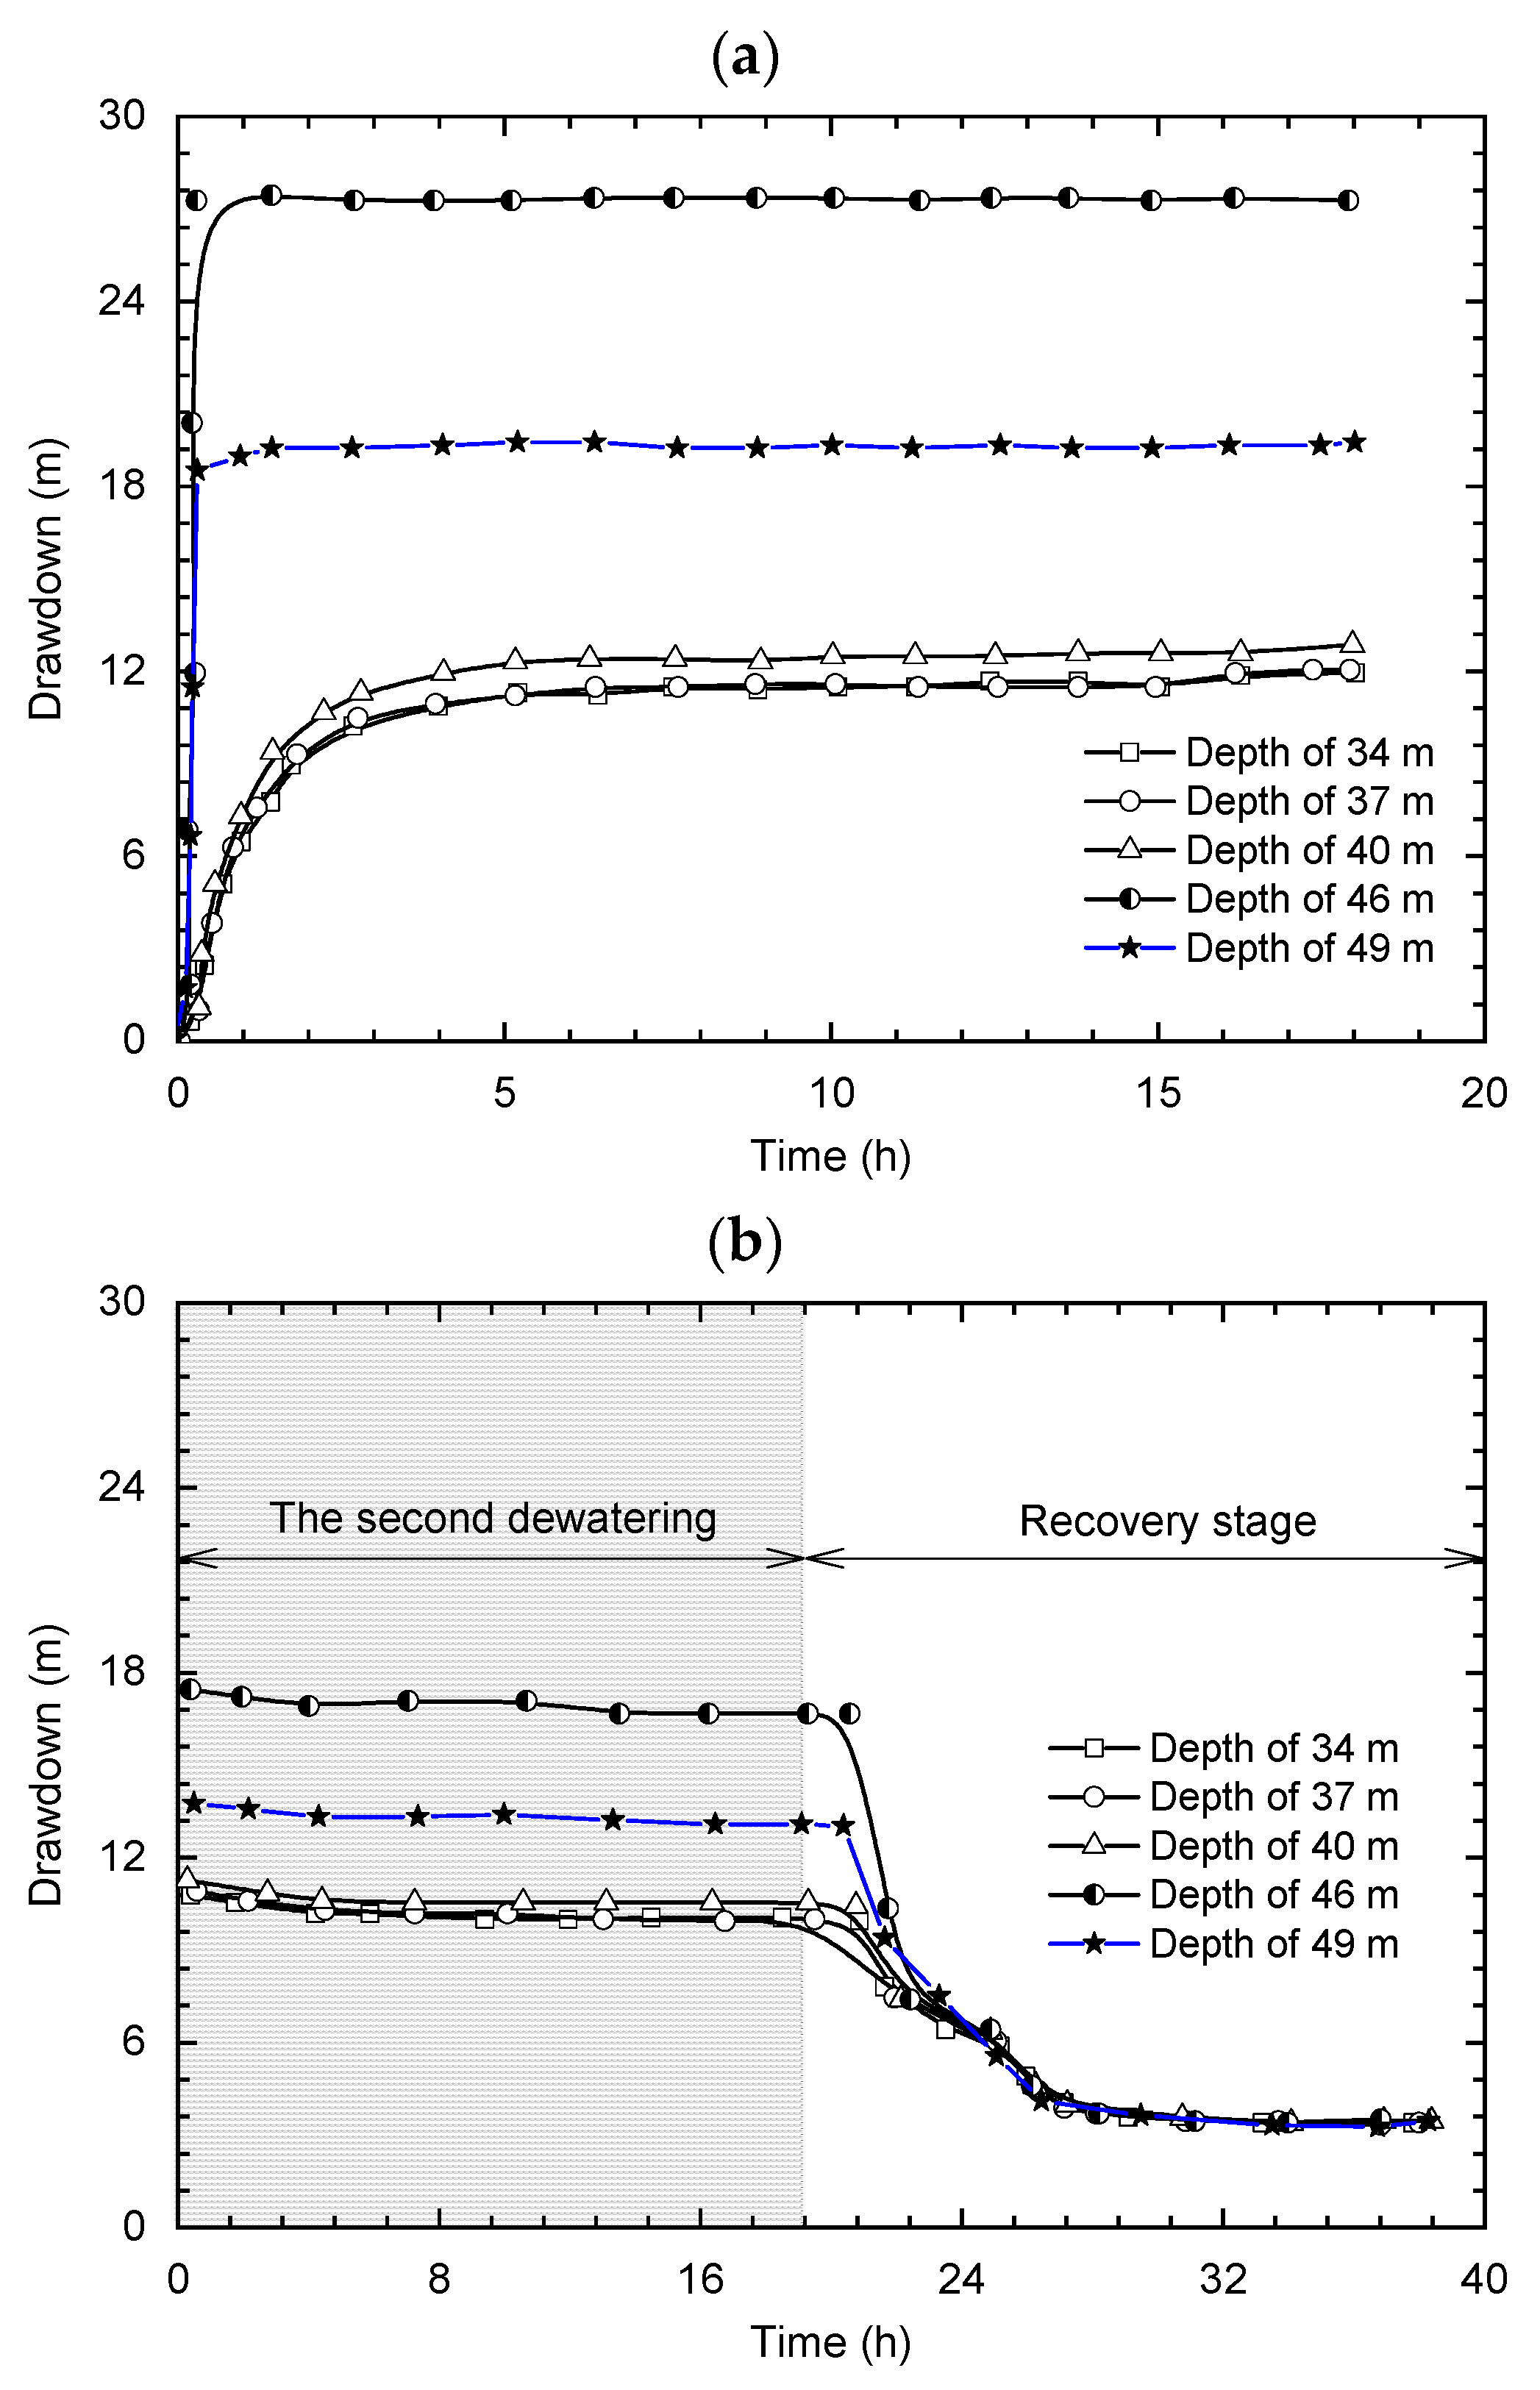
3.1. YA17 Pumping Test

The pumping test was carried out in Pit A, where pumping well YA17 was used for pumping, and two wells (i.e., YA19 and H2) were utilized as observation wells. Figure 4 illustrates the relative spatial positions of the diaphragm walls, the drainage well, and the observation wells. Pumping well YA17 was situated at the widened section of Pit A, 6.9 m away from the nearest diaphragm wall. Observation well YA19 was also located in Pit A, 10.5 m away from YA17. The second observation well, H2, was placed outside the pit, 20.9 m away from YA17. Additionally, the depth of the filter of well YA17 was above the bottom of the diaphragm wall, thereby obstructing the dewatering effect within the pit.
A three-step dewatering test was conducted through pumping well YA17, with the pumping time and pumping rate detailed in Table 3. Figure 5 shows the drawdown at varying depths of well YA17 in the three-step dewatering tests. For the first round of pumping (Figure 5a), the drawdowns at all monitoring points of the well significantly increased at the initial stage of pumping before stabilizing. The maximum drawdown, located near the bottom of the filter (i.e., at a depth of 43–46 m), reached 25 m. In the second-round pumping test (Figure 5b), the maximum drawdown was again located at a depth of 43–46 m, similar to the first-round pumping test. However, due to the reduced pump rate in the second-round pumping test, the drawdown at all monitoring points sharply decreased to zero initially before settling at a constant level. The maximum drawdown at the steady state of the second-round pumping test was approximately 9 m. Given that the pump rate of the third-round pumping test was close to that of the first dewatering step, the maximum drawdown in the third pumping test was the same as that of the first dewatering step.
The results indicate that a nonuniform water drawdown distribution was observed near the filter, with the maximum drawdown located near the bottom of the filter. This was attributed to the 3D flow around the pumping well, which was caused by the deep pit with an unclosed diaphragm wall and a highly permeable layer. The drawdown and hydraulic gradient were influenced by the position of the pump. For a pumping well, the well bottom was close to the unclosed diaphragm wall, which formed an impermeable hydraulic boundary. The recharge was cut off in the side direction. For the aquifer, the unclosed diaphragm partially penetrated the aquifer, which reduced the side seepage cross-section area for horizontal flow, and the seepage cross-section was lowered. Groundwater has to change direction and flow vertically to enter the partially penetrated aquifer before horizontally flowing into the filter tube of a pumping well. The vertical hydraulic conductivity was smaller than the horizontal one, larger potential energy represented by the piezometric head was consumed by the lower vertical permeable characteristic. The pumping rate decreased because of the decreasing cross-section area under the same hydraulic gradient around the bottom of the diaphragm wall. The groundwater flow around the diaphragm wall gradually migrated downward because of the hindering effect of the wall. A 3D flow pattern was then formed.
Figure 6 presents the drawdown distributions at various depths for wells YA17, YA19, and H2 during the first round of pumping. The drawdown in the pumping well was significantly larger than that in the observation well. The drawdown outside the pit was negligible, suggesting that the dewatering within the pit had minimal impact on the surrounding ground, likely due to the blocking effect of the diaphragm wall. The drawdown distribution in the observation well YA19 was also nonuniform, resulting from the pumping activity in YA17. The drawdown of YA19 mirrored that of YA17 near the top of the filter, following which the drawdowns in both wells increased with increasing burial depth. The maximum drawdown was located at a depth of 3 m below the bottom of the filter. However, the maximum drawdown of YA19 decreased by approximately 4.24 m. As such, the hydraulic gradient between YA17 and YA19 at a buried depth of 43 m was calculated as (26.55~4.24)/10.5 = 2, suggesting the presence of a cone of depression in the vicinity of the pumping well, accompanied by a hydraulic gradient of 2. Furthermore, the drawdown at the bottom of the diaphragm wall in pumping well YA17 was notably larger than that in well YA19. The drawdowns of wells YA17 and YA19 were 5 m and 1 m, respectively, resulting in a hydraulic gradient of 0.38 between YA17 and YA19 at the bottom of the diaphragm wall.
Figure 7 shows the hydraulic gradient between the pumping well (i.e., YA17) and observation wells YA19 and H2 during the first round of pumping. The hydraulic gradient between the pumping well and observation wells, referring to the slope of the drawdown (change in water level per unit distance along the flow direction), showed similar patterns for YA17–YA19 and YA17–H2. Above the filter, the hydraulic gradient remained constant with increasing burial depth. At a buried depth of 45 m, the gradient peaked, sharply decreased with a further increase in buried depth, and finally stabilized below the bottom of the diaphragm wall. These findings suggest that a 3D flow was induced by the pit with an unclosed diaphragm wall and that such a wall was effective in blocking the dewatering effect outside the pit.

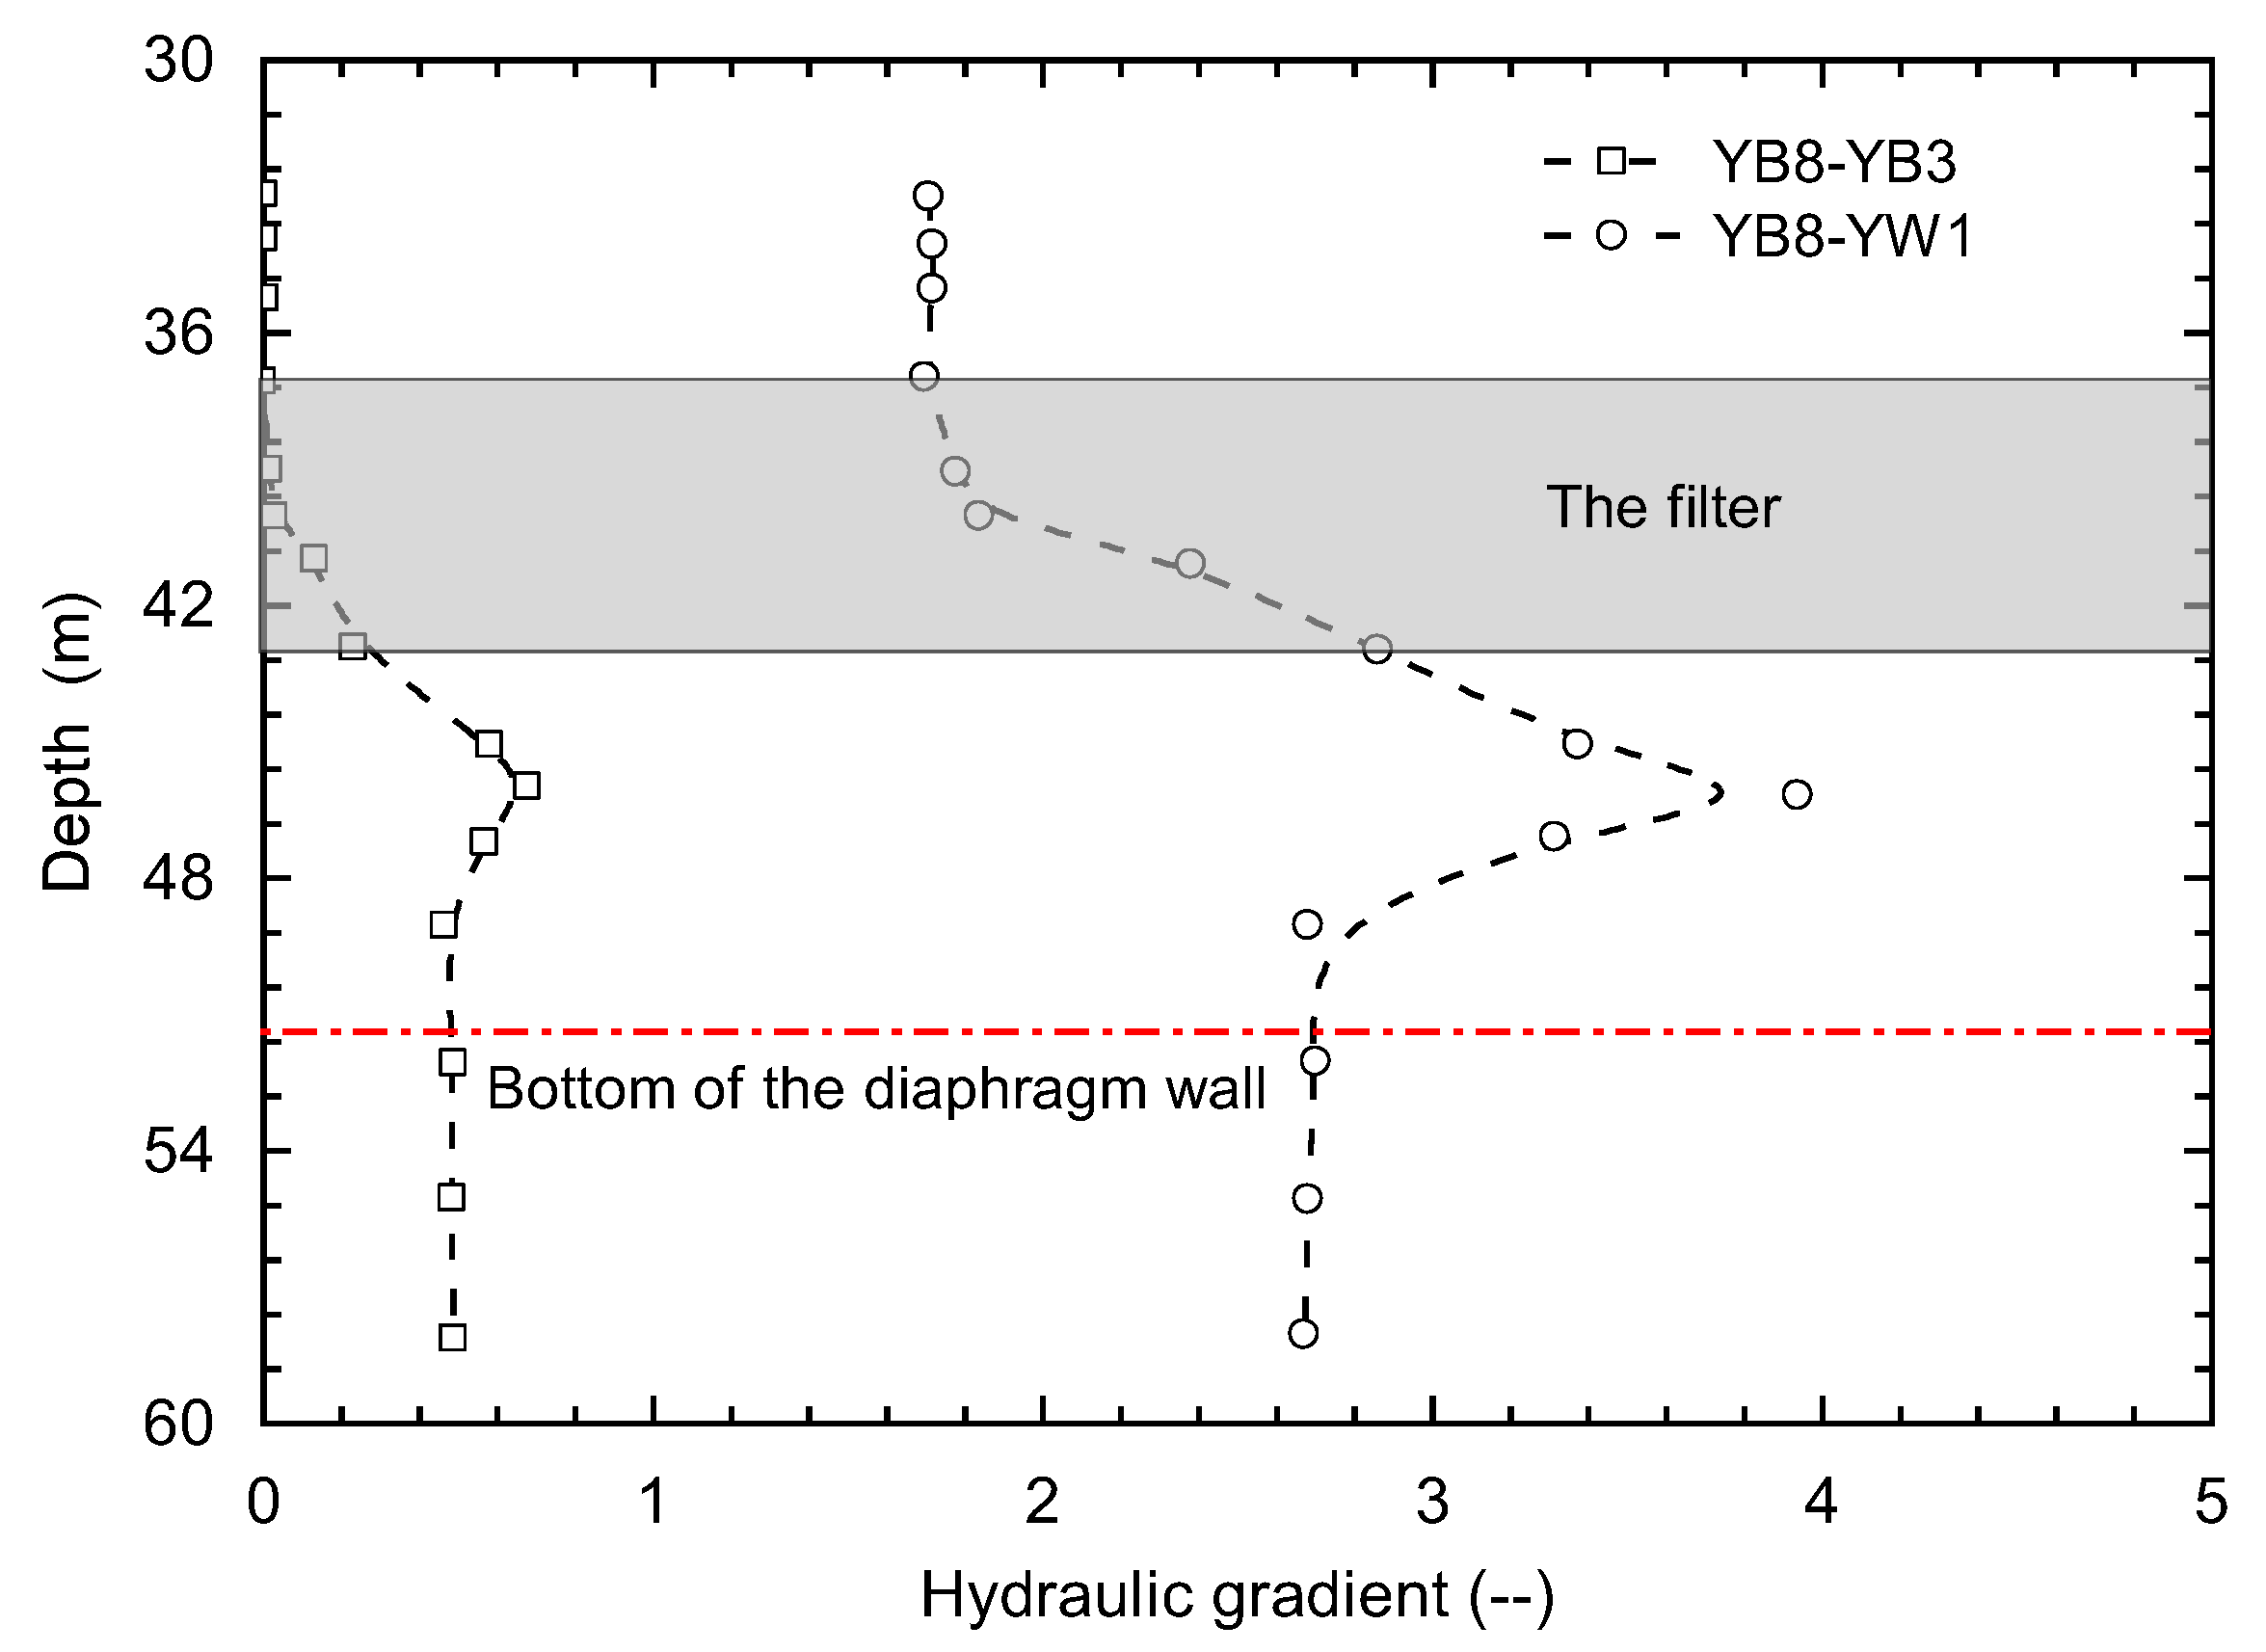
3.2. YB8 Pumping Test

Figure 8 presents the relative spatial positions of the diaphragm wall, the pumping well, and the observation well. Pumping well YB8 was installed in the middle of Pit B’s long side, flanked by a waterproof curtain on both sides. The shortest distance from the diaphragm wall was 4.89 m. Observation well YB3 was positioned at the corner of the pit wall, 4.5 m from the diaphragm wall, 14.42 m from the sealing wall, and 38.05 m from the pumping well. Another observation well, YW1, was located outside the pit, 1.01 m away from the diaphragm wall and 6.9 m away from the pumping well. In the vertical section, the filter tube of the pumping well was encased within the wall by 11 m.
Figure 9 shows the drawdown at various depths of well YB8 during the two-round pumping test. In the first round of pumping, the pump rate reached 60 m3/h, whereas in the second round, the pump rate decreased to 35 m3/h. Initially, the drawdown at all monitoring points increased sharply and later stabilized during the first round. The maximum drawdown reached 27 m, equivalent to the maximum drawdown of 25 m observed in the YA17 test, as the filter thickness of YB8 was shorter than that of YA17. The maximum drawdown was located near the filter’s bottom, mirroring the results from the YA17 test.
During the second round of pumping, the reduction in the pump rate did not affect the location of the maximum drawdown (still near the bottom of the filter). However, due to the pump rate reduction, the drawdown at all monitoring points decreased. After the cessation of pumping, the water level swiftly returned to its initial state.
Figure 10 displays the drawdown distributions at different depths for wells YB8, YB3, and YW1 during the initial dewatering. The drawdown of well YB8 closely matched that of well YB3 for burial depths less than 35 m (above the filter). The drawdown of well YB8 then increased with burial depth, peaking at 46 m. Conversely, the drawdown of observation well YB3 decreased with increasing burial depth and remained constant below the bottom of the diaphragm wall.
The maximum drawdown of pumping well YB8 was similar to that observed in the YA17 test. However, the maximum drawdown of observation well YB3 within the pit was 12 m, larger than the drawdown of observation well YA19 in the YA17 test due to the higher pump rate in the YB8 test. Moreover, the drawdown in the observation well YW1 was nearly zero, attributable to the blocking effect of the unclosed diaphragm wall. This result demonstrates that an unclosed diaphragm wall can effectively prevent groundwater reduction outside the foundation pit.
During construction, the large drawdown obtained in the pit can lower the groundwater level with higher efficiency, which can be referred to by similar engineering. In urban planning, the excavation and dewatering of the foundation pit of a new project have to be controlled to protect the existing buildings in a built-up area. The small drawdown obtained outside the pit can protect the nearby urban environment. The practical utilization of the effect can increase the bearing capacity of underground space and enlarge the exploitable land area.
A 3D groundwater flow pattern can be artificially formed by designing proper diaphragm walls and pumping wells. A retaining structure–dewatering coupling design procedure and method can be developed to utilize the diaphragm wall-pumping wells coupling effect. If the diaphragm wall had been installed, then the arrangement and structure of pumping wells can be optimized to reach the best effect.
Figure 11 depicts the profile of the hydraulic gradient between the drainage well (YB8) and observation wells (YB3 and YW1) during the first dewatering. The hydraulic gradient profiles for YB8–YB3 and YB8–YW1 displayed similar distributions. Above the filter, the hydraulic gradient remained constant with increasing buried depth, peaked at 46 m, sharply decreased with a further increase in buried depth, and finally reached a constant below the bottom of the diaphragm wall, mirroring the pattern of the YA17 test. The hydraulic gradient of YB8–YB3 was smaller than that of YA17–YA19 due to the larger distance between the pumping well and observation well YB3 in Pit B. However, due to the shorter horizontal distance between the pumping well and the observation well, the hydraulic gradient of YB8–YW1 was larger than that of YA17–H2. These findings suggest that the diaphragm wall can extend the seepage path due to its block effect.

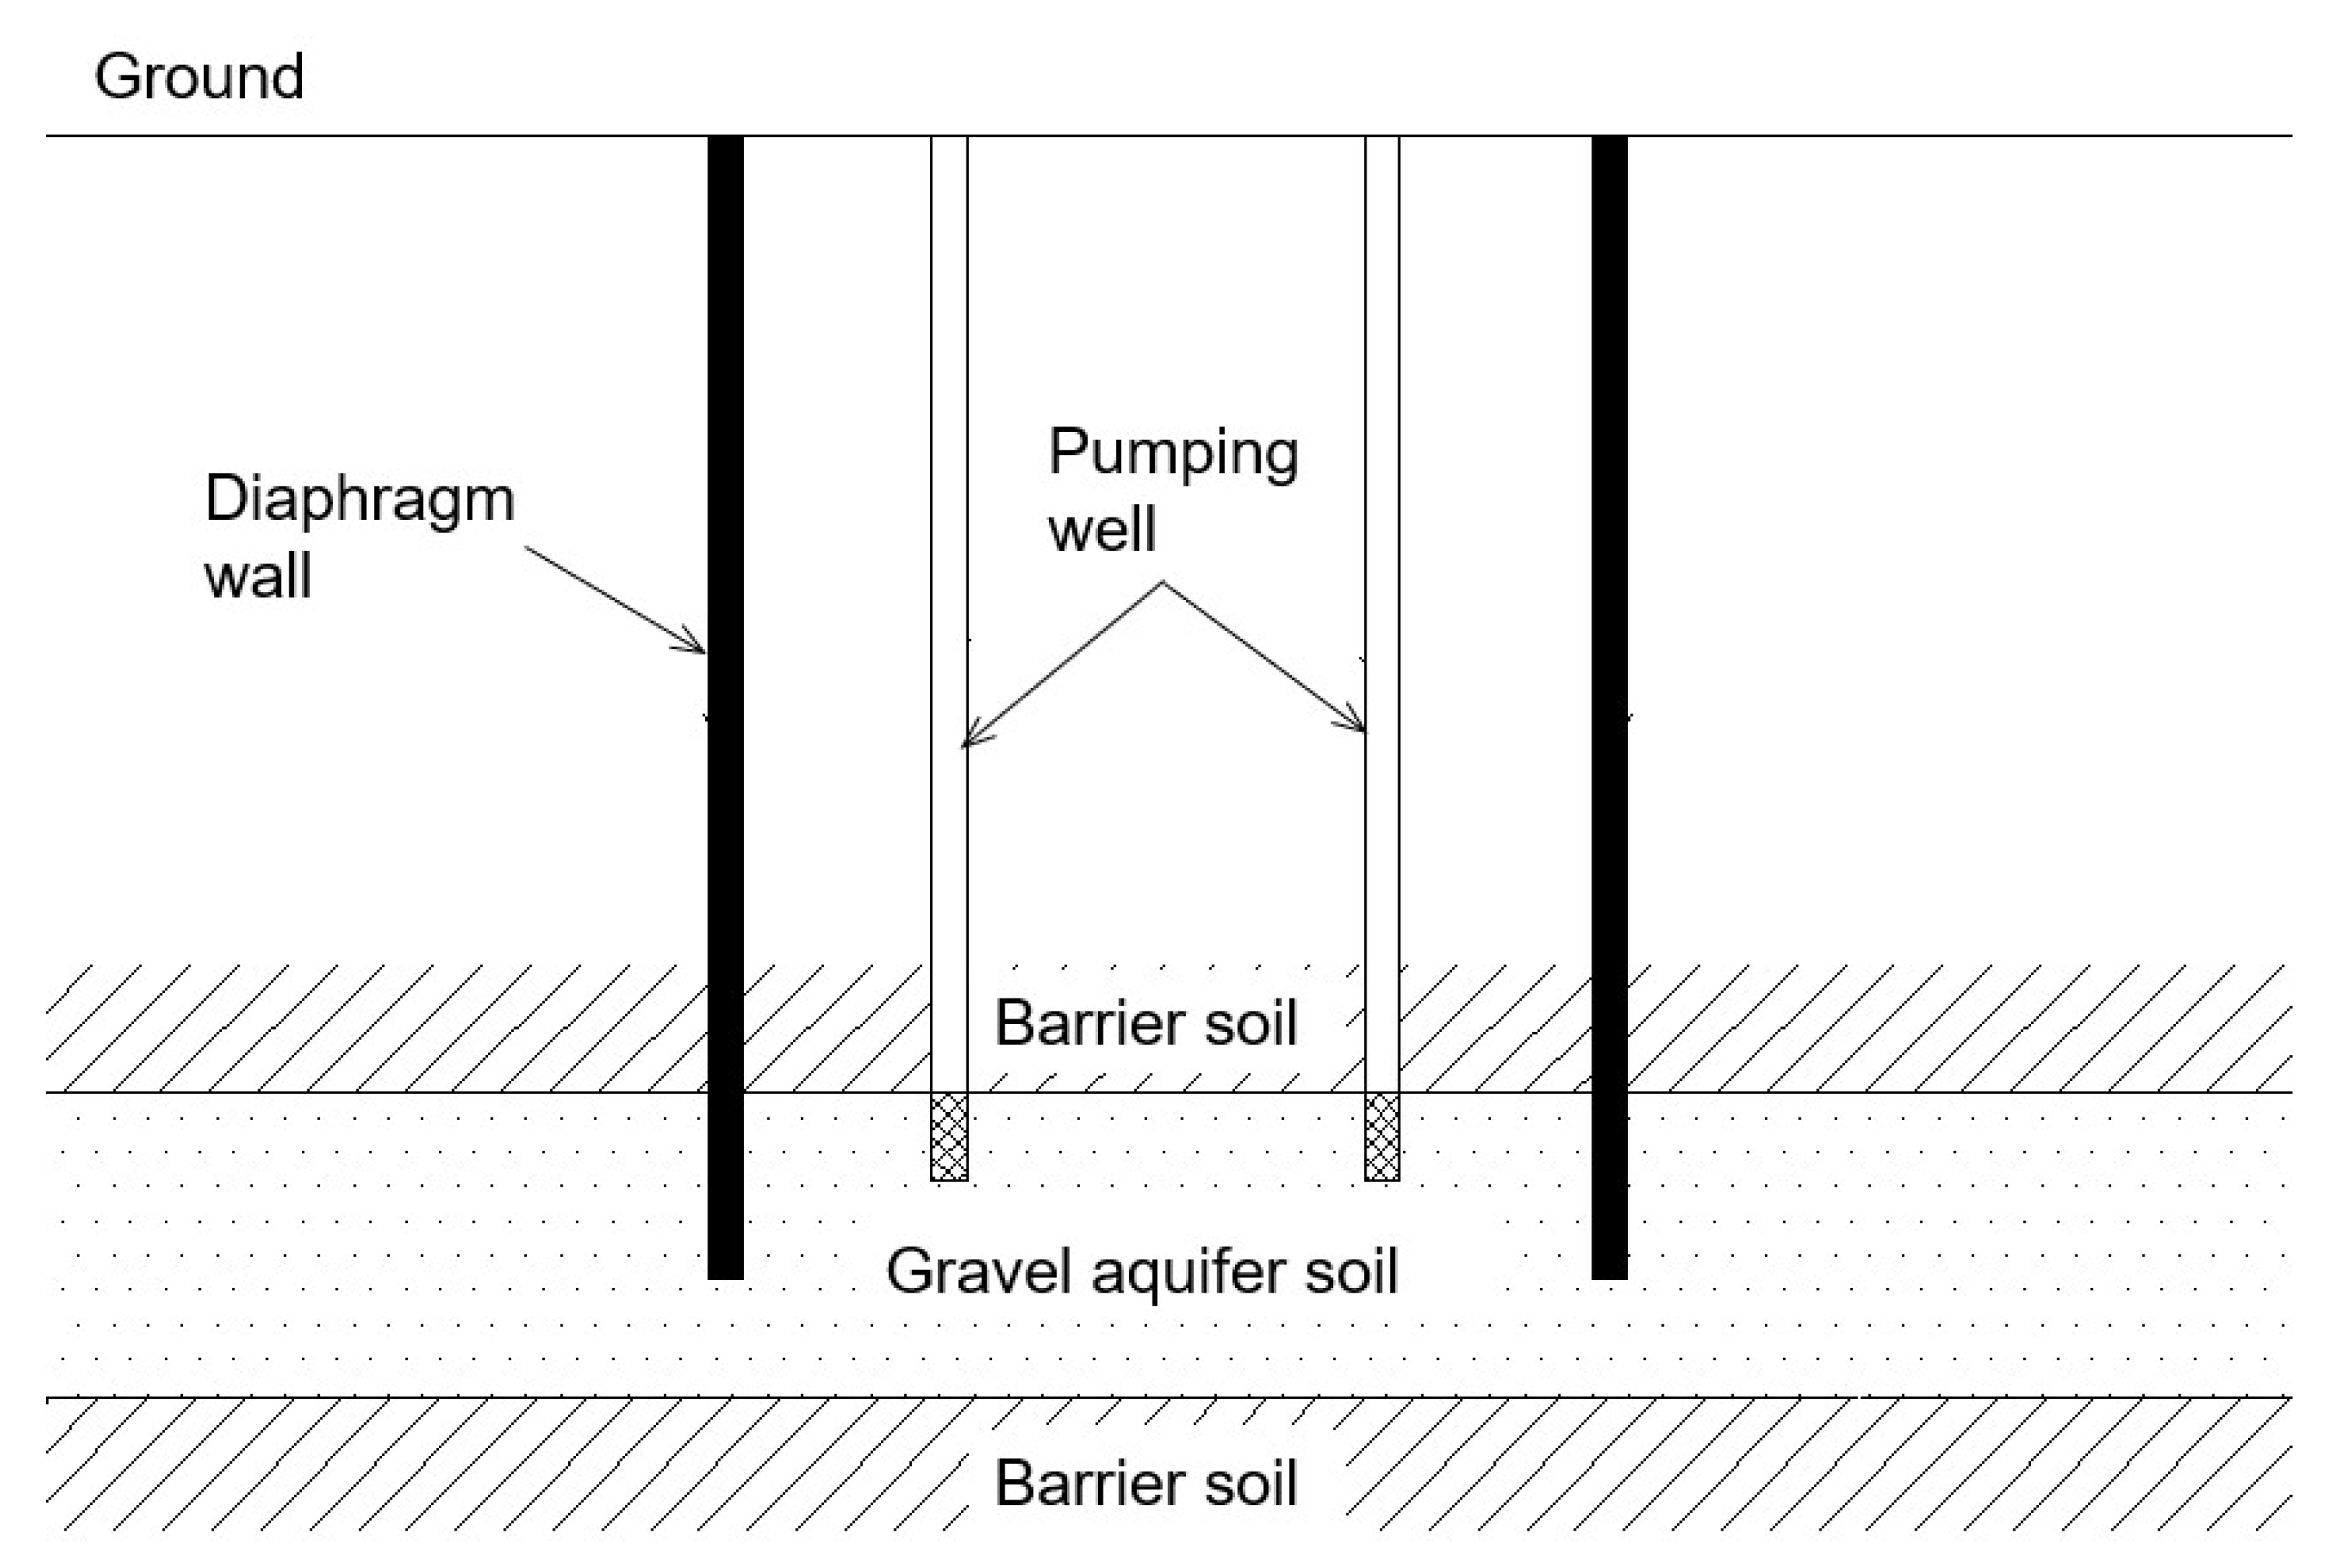
3.3. Diaphragm Wall–Pumping Well Coupling Effect Analysis

The seepage mode near waterproof curtains can be classified into three types based on balancing the dewatering in a deep foundation pit and the drawdown outside of the pit using waterproof curtains: (1) closed waterproof curtain seepage mode; (2) phreatic unclosed waterproof curtain seepage mode, and (3) confined unclosed waterproof curtain seepage mode. The third mode was employed in the dewatering of this foundation pit. The aforementioned tests demonstrated that groundwater assumes a 3D flow state during dewatering and is closely related to the wall-well effect.
(1) The curtain serves as a barrier, preventing groundwater from entering the filter directly along the horizontal direction. Instead, the groundwater must navigate through the curtain using a 3D flow, moving vertically initially and then horizontally into the filter.
As evidenced by the tests, when the pumping well maintained a nearly constant drawdown inside the pit, the drawdown outside the pit remained less than 0.45 m at all times and did not influence the external drawdown. The relative decrease in hydraulic conductivity helped to minimize the flow in the 3D direction around the vertical flow. In addition, maintaining the foundation pit at a constant drawdown adhered to Darcy’s principle of unsteady seepage. As a result, disturbances to the environment outside the pit during the dewatering process were minimal.
(2) According to the tests, the maximum drawdown in the pit during the first round of pumping for YA17 exceeded 25 m, with a pumping rate of 35 m3/h. However, the theoretically calculated pumping rate for dewatering without a waterproof curtain was significantly larger than that in the YA17 test. This is because the shortest path of underground seepage in the pit would increase (i.e., twice the distance from the top of the filter to the bottom of the wall) when the water head difference remained constant, which is consistent with Darcy’s law. Additionally, having the diaphragm wall penetrate to a certain depth into the gravel-confined aquifer reduced the cross-sectional area. Given certain conditions of the water head difference between the interior and exterior of the pit, as well as hydraulic conductivity, reducing the discharge flow cross-section decreased the flow of water, in accordance with Darcy’s law. As a result, an unclosed waterproof curtain could decrease the water flow, thereby saving time and money by reducing the need for additional pumping wells.
The observed results confirmed the physical model tests [46], numerical simulations [8,35,47], and hydrogeological theories [48], which anchored the current study within the broader scientific context. Further studies were necessary to connect the observed results with theoretical analysis.
(3) The natural hydro-geological conditions of pumping tests conducted in Pit A and Pit B were similar. However, the position of the pumping well corresponding to the diaphragm wall was different. The YA 17 was installed close to a middle cut-off wall. The aquifer was also cut off in that direction. The aquifer was partially cut off in three directions for the YB17. The YB 8 was installed far from the middle cut-off wall. The aquifer was partially cut off in two directions for the YB8. The 3D flow effect of YA17 was more obvious than that of YB8 for pumping wells. The drawdown in YA17 reached the maximum value with the help of the side cut-off boundary. A large drawdown was reached nearby pumping well above the diaphragm wall bottom, and a small drawdown downwards below the bottom of the diaphragm wall was observed, indicating that a perfect 3D diaphragm wall-pumping well effect was reached. The drawdown of YB8 also reached the maximum value with the help of the diaphragm wall. However, its drawdown below the diaphragm wall was over three times that observed in YA17 (Figure 6 and Figure 10), indicating that a large quantity of groundwater was pumped under a similar drawdown. The diaphragm wall influenced the 3D flow. The 3D flow pattern was influenced obviously by the positions of the diaphragm wall and pumping wells under similar natural conditions. Certain 3D flow patterns can be artificially produced by controlling the diaphragm wall and pumping wells during foundation pit dewatering.

4. Conclusions

After conducting two multi-depth pumping tests with different filter lengths to study the 3D flow mechanism during deep excavation within the gravel layer of Qianjiang Century City Station of Hangzhou Metro Line 6, the following conclusions can be drawn:
(1)
During the pumping tests, a robust 3D flow phenomenon was generated around the filter, forming a drawdown cone with a significant hydraulic gradient. The maximum drawdown and hydraulic gradient inside the pit were located 3 m below the bottom of the filter. The observed 3D flow confirmed the existence of 3D flow deduced in theoretical analysis. The 3D flow combined with anisotropic gravel-confined aquifers was significant in controlling drawdown during foundation pit dewatering.
(2)
The dewatering scheme using longer filters, larger pump rates, and filters situated closer to the aquifer roof could enhance the dewatering effectiveness while minimizing the impact on the surrounding geological environment. This conclusion is supported by the study conducted by Xu et al. [29], which found that the pumping volume inside a pit increased with increasing filter length.
(3)
The diaphragm wall-pumping well effect efficiently controlled the water head outside the pit and the subsidence, which aligns with the findings of Wang et al. [8,35,45,46,47]. This effect can regulate the drawdown of the deep foundation pit of a gravel-confined aquifer in an ancient river distribution area with an unclosed waterproof curtain.
(4)
The efficiency of the diaphragm wall-pumping well effect depended on the anisotropy of gravel-confined aquifers. For ellipsoid gravels, their long axis generally followed the horizontal direction to obtain the minimum potential energy during its sedimentation process, and the vertical hydraulic conductivity was at least one order of magnitude smaller than the horizontal direction, with significant anisotropy. The effect was obvious and can be utilized to control the drawdown inside and outside a foundation pit. For spherical gravels with less anisotropic, the diaphragm wall-pumping well effect was relatively weak. The penetrating depth of the diaphragm wall had to be improved to increase the length of the permeability path to reach the same effect.
(5)
When the penetrating depth of the diaphragm wall into gravel-confined aquifer was limited, a short filter with high strength and large porosity was necessary to reach the designed effect.

Author Contributions

Conceptualization, J.W., Y.W. and Z.Y.; methodology, J.W. and Y.W.; software, Y.W.; validation, J.W., Y.W. and N. X.; formal analysis, J.W., Y.W. and N. X.; investigation, J.L., Y.S., X.H, Z.Y. and R.Z.; resources, J.W. and J.L.; data curation, J.L., Y.S., X.H. and Z.Y.; writing—original draft preparation, N.X., J.W. and Y.W.; writing—review and editing, J.W. and N.X.; visualization, Y.W.; supervision, J.W.; project administration, J.L.; funding acquisition, J.W.,Y.S., X.H. and J.L. All authors have read and agreed to the published version of the manuscript.

Funding

This research was funded by the Shanghai Municipal Science and Technology Project (18DZ1201301; 19DZ1200900); Shanghai Institute of Geological Survey (2023(D)-003(F)-02); Key Laboratory of Land Subsidence Monitoring and Prevention, Ministry of Natural Resources of the People’s Republic of China (No. KLLSMP202101; KLLSMP202201); Shanghai Municipal Science and Technology Major Project (2021SHZDZX0100) and the Fundamental Research Funds for the Central Universities.

Data Availability Statement

The data presented in this study are available on request from the corresponding author.

Conflicts of Interest

The authors declare no conflict of interest.

References

  1. Wang, J.; Yang, T.; Wang, G.; Liu, X.; Xu, N.; Stouthamer, E.; Yin, Y.; Wang, H.; Yan, X.; Huang, X. Control and prevent land subsidence caused by foundation pit dewatering in a coastal lowland megacity: Indicator definition, numerical simulation, and regression. Environ. Earth Sci. 2023, 82, 66. [Google Scholar] [CrossRef]
  2. Liu, X.; Wang, J.; Yang, T.; Wang, L.; Xu, N.; Long, Y.; Huang, X. Dewatering-induced stratified settlement around deep excavation: Physical model study. Appl. Sci. 2022, 12, 8929. [Google Scholar] [CrossRef]
  3. Huang, M.; Wang, W.; Zheng, G. A review of recent advances in the underground engineering and deep excavations in soft soils. China Civ. Eng. J. 2012, 45, 146–161. [Google Scholar]
  4. Wang, X.; Xu, Y. Impact of the depth of diaphragm wall on the groundwater drawdown during foundation dewatering considering anisotropic permeability of aquifer. Water 2021, 13, 418. [Google Scholar] [CrossRef]
  5. Jiang, Y.; Zhou, P.; Zhou, F.; Lin, J.; Li, J.; Lin, M.; Qi, Y.; Wang, Z. Failure analysis and control measures for tunnel faces in water-rich sandy dolomite formations. Eng. Fail. Anal. 2022, 138, 106350. [Google Scholar] [CrossRef]
  6. Wang, J.; Wu, Y.; Zhang, X.; Liu, Y.; Yang, T.; Feng, B. Field experiments and numerical simulations of confined aquifer response to multi-cycle recharge–recovery process through a well. J. Hydrol. 2012, 464, 328–343. [Google Scholar] [CrossRef]
  7. Li, Y.; He, Z.; Yan, G.; Liao, Z.; Liang, S. Excavation dewatering and ground subsidence in dual structural stratum of Wuhan. Chin. J. Geotech. Eng. 2012, 34, 767–772. [Google Scholar]
  8. Wang, J.; Feng, B.; Liu, Y.; Wu, L.; Zhang, X.; Tang, Y.; Yang, P. Controlling subsidence caused by de-watering in a deep foundation pit. B Eng. Geol. Environ. 2012, 71, 545–555. [Google Scholar] [CrossRef]
  9. Asioli, C.; Agostini, M.; Minotti, T. Design and construction of anchored diaphragm walls and dewatering system for the excavation of a two-level basement car park at the Al Ghazala Hotel Intercontinental in Tripoli-Libya. In Geotechnical Aspects of Underground Construction in Soft Ground; CRC Press: Boca Raton, FL, USA, 2012; pp. 555–562. [Google Scholar]
  10. Badelow, F.; Wakefield, M.; Chandrasegaran, C.; Iseppi, G. Barangaroo south harbor side basement, Australia, challenges and solutions. P. I. Civil. Eng-Geotec. 2014, 167, 194–204. [Google Scholar] [CrossRef]
  11. Ervin, M.; Morgan, J. Groundwater control around a large basement. Can. Geotech. J. 2001, 38, 732–740. [Google Scholar] [CrossRef]
  12. Forth, R. Groundwater and geotechnical aspects of deep excavations in Hong Kong. Eng. Geol. 2004, 72, 253–260. [Google Scholar] [CrossRef]
  13. Bovolenta, R.; Brencich, A. Effect of deep excavations and deformable retaining structures on neighboring buildings: A case study. Eng. Fail. Anal. 2021, 122, 105269. [Google Scholar] [CrossRef]
  14. Korff, M.; Mair, R.; Van Tol, A.; Kaalberg, F. Building damage and repair due to leakage in a deep excavation. Proc. Inst. Civ. Eng-Fo. 2011, 164, 165–177. [Google Scholar] [CrossRef]
  15. Khosravi, M.; Ghoreishi Najafabadi, S. Determining the portion of dewatering-induced settlement in excavation pit projects. Int. J. Geotech. Eng. 2021, 15, 563–573. [Google Scholar] [CrossRef]
  16. Lyu, H.; Sun, W.; Shen, S.; Arulrajah, A. Flood risk assessment in metro systems of mega-cities using a GIS-based modeling approach. Sci. Total Environ. 2018, 626, 1012–1025. [Google Scholar] [CrossRef] [PubMed]
  17. Shaqour, F.; Hasan, S. Groundwater control for construction purposes: A case study from Kuwait. Environ. Geol. 2008, 53, 1603–1612. [Google Scholar] [CrossRef]
  18. Roy, D.; Robinson, K. Surface settlements at a soft soil site due to bedrock dewatering. Eng. Geol. 2009, 107, 109–117. [Google Scholar] [CrossRef]
  19. Pujades, E.; Vàzquez-Suñé, E.; Carrera, J.; Jurado, A. Dewatering of a deep excavation undertaken in a layered soil. Eng. Geol. 2014, 178, 15–27. [Google Scholar] [CrossRef]
  20. Wu, Y.; Zhou, X.; Lei, M.; Yang, J.; Ma, J.; Qiao, P.; Chen, T. Migration and transformation of arsenic: Contamination control and remediation in realgar mining areas. Appli. Geochem. 2017, 77, 44–51. [Google Scholar] [CrossRef]
  21. Sun, W. Cutoff Mechanism of Retaining Structure on Groundwater Seepage during Dewatering of Excavation in Soft Deposit. Ph.D. Thesis, Shanghai Jiao Tong University, Shanghai, China, 2010. [Google Scholar]
  22. Qu, C. Dewatering of the Dongjiadu tunnel restoration on Shanghai metro line 4. Chin. J. Geotech. Eng. 2010, 32, 339–342. [Google Scholar]
  23. Ding, Z.; Cheng, W.; Hu, Z.; Zhang, S.; Yu, X. Research on dewatering of deep foundation pit of Hangzhou Metro People’s Square Station. J. Railw. Eng. 2014, 184, 89–94. [Google Scholar]
  24. Luan, C.; Kan, H.; Tang, Y. Settlement caused by dewatering at Yishanlu Metro Station in Shanghai. Chin. J. Geotech. Eng. 2010, 12, 1961–1968. [Google Scholar]
  25. Wang, G.; Yan, P.; Gong, X.; Wang, C. Research on the seepage field of excavation with waterproof structure. Ind Constr. 2001, 31, 43–45. [Google Scholar]
  26. Shen, S.; Xu, Y. Numerical evaluation of land subsidence induced by groundwater pumping in Shanghai. Can. Geotech. J. 2011, 48, 1378–1392. [Google Scholar] [CrossRef]
  27. Shen, S.; Wu, Y.; Misra, A. Calculation of head difference at two sides of a cut-off barrier during excavation dewatering. Comput. Geotech. 2017, 91, 192–202. [Google Scholar] [CrossRef]
  28. Xu, Y.; Wu, H.; Wang, Z.; Yang, T. Dewatering induced subsidence during excavation in a Shanghai soft deposit. Environ. Earth Sci. 2017, 76, 351–365. [Google Scholar] [CrossRef]
  29. Xu, Y.; Yan, X.; Shen, S.; Zhou, A. Experimental investigation on the blocking of groundwater seepage from a waterproof curtain during pumped dewatering in an excavation. Hydrogeol. J. 2019, 27, 1–14. [Google Scholar] [CrossRef]
  30. Zhang, Y.; Wang, J.; Chen, J.; Li, M. Numerical study on the responses of groundwater and strata to pumping and recharge in a deep confined aquifer. J. Hydrol. 2017, 548, 342–352. [Google Scholar] [CrossRef]
  31. Li, P.; Gong, Q.; Yuan, X. Research on decompression and dewatering measures for a deep foundation pit of Hangzhou Metro. J. Undergr. Sp. Eng. 2014, 10, 213–219. [Google Scholar]
  32. Kaleris, V.; Ziogas, A. The effect of cutoff walls on saltwater intrusion and groundwater extraction in coastal aquifers. J. Hydrol. 2013, 476, 370–383. [Google Scholar] [CrossRef]
  33. Paris, A.; Teatini, P.; Venturini, S.; Gambolati, G.; Bernstein, A. Hydrological effects of bounding the Venice (Italy) industrial harbor by a protection cutoff wall: Modeling study. J. Hydrol. Eng. 2010, 15, 882–891. [Google Scholar] [CrossRef]
  34. Wu, L.; Yao, Y. The characteristics of the groundwater seepage around barrier-wall and its numerical modeling. Shanghai Geol. 1995, 55, 8. [Google Scholar]
  35. Wang, J.; Feng, B.; Guo, T.; Wu, L.; Lou, R.; Zhou, Z. Using partial penetrating wells and curtains to lower the water level of confined aquifer of gravel. Eng. Geol. 2013, 161, 16–25. [Google Scholar] [CrossRef]
  36. Wang, J.; Liu, X.; Wu, Y.; Liu, S.; Wu, L.; Lou, R.; Lu, J.; Yin, Y. Field experiment and numerical simulation of coupling non-Darcy flow caused by curtain and pumping well in foundation pit dewatering. J. Hydrol. 2017, 549, 277–293. [Google Scholar] [CrossRef]
  37. Wu, Y.; Shen, S.; Yuan, D. Characteristics of dewatering induced drawdown curve under blocking effect of retaining wall in aquifer. J. Hydrol. 2016, 539, 554–566. [Google Scholar] [CrossRef]
  38. Wang, K.; Hu, L.; Lu, K. Analysis for seepage characteristic of deep foundation pit with hanging in pervious Purdah. Chin. Build. Sci. 2010, 26, 81–84. [Google Scholar]
  39. Wu, S. Seepage Analysis of pensile curtain for deep pit. Fujian Constr. Sci. Technol. 2009, 108, 4–5. [Google Scholar]
  40. Cao, J.; Zhang, B.; Liu, H. Conformal mapping of unclosed cut-off curtain seepage in the foundation pit. Geotech. Invest. Surv. 2014, 42, 34–38. [Google Scholar]
  41. Mendomo Meye, S.; Li, G.; Shen, Z.; Gan, L.; Xu, L. Research on seepage field and slope stability considering heterogeneous characteristics of waste piles: A less costly way to reduce high leachate levels and avoid accidents. Adv. Civ. Eng. 2022, 2022, 9069991. [Google Scholar] [CrossRef]
  42. Lv, C.; Wang, D.; Shuai, F.; Sun, H.; Shang, Y. A three-dimensional numerical method for siphon drainage process simulation. P. I. Civil. Eng. Geotec. 2022, 175, 631–646. [Google Scholar] [CrossRef]
  43. Brunetti, E.; Jones, J.; Petitta, M.; Rudolph, D. Assessing the impact of large-scale dewatering on fault-controlled aquifer systems: A case study in the Acque Albule basin (Tivoli, central Italy). Hydrogeol. J. 2013, 21, 401–423. [Google Scholar] [CrossRef]
  44. Khanafer, K. Fluid–structure interaction analysis of non-Darcian effects on natural convection in a porous enclosure. Int. J. Heat. Mass. Tran. 2013, 58, 382–394. [Google Scholar] [CrossRef]
  45. Xu, Y.; Shen, S.; Ma, L.; Sun, W.; Yin, Z. Evaluation of the blocking effect of retaining walls on groundwater seepage in aquifers with different insertion depths. Eng. Geol. 2014, 183, 254–264. [Google Scholar] [CrossRef]
  46. Wang, J.; Hu, L.; Wu, L.; Tang, Y.; Zhu, Y.; Yang, P. Hydraulic barrier function of the underground continuous concrete wall in the pit of subway station and its optimization. Environ. Geol. 2009, 57, 447–453. [Google Scholar] [CrossRef]
  47. Wang, J.; Liu, X.; Liu, S.; Zhu, Y.; Pan, W.; Zhou, J. Physical model test of transparent soil on coupling effect of cut-off wall and pumping wells during foundation pit dewatering. Acta Geotech. 2019, 14, 141–162. [Google Scholar] [CrossRef]
  48. Wang, J.; Wu, L.; Zhu, Y.; Tang, Y.; Yang, P.; Lou, R. Mechanism of dewatering-induced ground subsidence in deep subway station pit and calculation method. Chin. J. Rock Mech. Eng. 2009, 28, 1010–1019. [Google Scholar]
Figure 1. The schematic diagram of the deep excavation pit with an unclosed waterproof.
Applsci 13 10438 g001
Figure 2. Geological section of the foundation pit of Qianjiang Century Station, metro line 6, Hangzhou, China.
Applsci 13 10438 g002
Figure 3. Top view of the foundation pit of Qianjiang Century City Station.
Applsci 13 10438 g003
Figure 4. Spatial relative positions of the diaphragm walls, drainage well, and observation wells for the YA17 test: (a) Top view; (b) Section view.
Applsci 13 10438 g004
Figure 5. The drawdown at different depths of well YA17 in the three steps: (a) first dewatering; (b) second dewatering; (c) third dewatering and recovery stage.
Applsci 13 10438 g005
Figure 6. Drawdown profile of the three wells in the first dewatering.
Applsci 13 10438 g006
Figure 7. Hydraulic gradient between the drainage well (i.e., YA17) and observation well (i.e., YA19 and H2) profiles in the first dewatering.
Applsci 13 10438 g007
Figure 8. Spatial relative positions of the diaphragm walls, the drainage well, and the observation wells for the YB8 test: (a) Top view; (b) Section view.
Applsci 13 10438 g008aApplsci 13 10438 g008b
Figure 9. The drawdown at different depths of well YB8 in the two steps: (a) first dewatering; (b) second dewatering and recovery stage.
Applsci 13 10438 g009
Figure 10. Drawdown profiles of the three wells in the first dewatering.
Applsci 13 10438 g010
Figure 11. The hydraulic gradient between the drainage well (i.e., YB8) and observation (i.e., YB3 and YW1) in the first dewatering.
Applsci 13 10438 g011
Table 1. Evacuation depth of the foundation pit.
Engineering SiteGround Face
Elevation
/m
Excavation Face
Elevation
/m
Excavation
Depth
/m
Curtain
Depth
/m
Pit A+7.0−18.525.552
Pit B+7.0−17.124.152
Table 2. Soil parameters obtained by laboratory and field tests.
ParametersDepth of Sampling (m)
Miscellaneous Fill
1–2
Silt
2–17
Muddy Soil
17–29
Gravel
>29
Es, (MPa)38430
V0.310.310.420.2
γ, (kN/m)1919.117.6N/A
Kv, (m/s)4.0 × 10−47.0 × 10−51.4 × 10−70.9
Kh, (m/s)5.0 × 10−48.5 × 10−52.0 × 10−70.9
EN/A0.821.22N/A
Note: Es, Compression modulus; v, Poisson ratio; γ, Unit weight; Kv, Vertical hydraulic conductivity; Kh, Horizontal hydraulic conductivity; e, Void ratio.
Table 3. Pumping test scheme.
Pumping WellTest OperationTime (h)Pump Rate
m3/h
YA17First round pumping1935
Second round pumping411
Water level recovery17--
Third round pumping1231
Water level recovery12--
YB8First round pumping1860
Second round pumping2035
Water level recovery11.5--
Disclaimer/Publisher’s Note: The statements, opinions and data contained in all publications are solely those of the individual author(s) and contributor(s) and not of MDPI and/or the editor(s). MDPI and/or the editor(s) disclaim responsibility for any injury to people or property resulting from any ideas, methods, instructions or products referred to in the content.

