Article

Simulation and Experimental Studies of Optimization of σ-Value for Block Matching and 3D Filtering Algorithm in Magnetic Resonance Images

by
Minji Park
1,
Seong-Hyeon Kang
2,
Kyuseok Kim
2,*,‡,
Youngjin Lee
3,*,‡ and
for the Alzheimer’s Disease Neuroimaging Initiative
1
Department of Health Science, General Graduate School of Gachon University, 191, Hambakmoe-ro, Yeonsu-gu, Incheon 21936, Republic of Korea
2
Department of Biomedical Engineering, Eulji University, 533, Sanseong-daero, Sujeong-gu, Gyeonggi-do, Seongnam-si 13135, Republic of Korea
3
Department of Radiological Science, Gachon University, 191, Hambakmoe-ro, Yeonsu-gu, Incheon 21936, Republic of Korea
*
Authors to whom correspondence should be addressed.
Data used in the preparation of this article were obtained from the Alzheimer’s Disease Neuroimaging Initiative (ADNI) database (https://adni.loni.usc.edu). As such, the investigators within the ADNI contributed to the design and implementation of the ADNI and/or provided data but did not participate in the analysis or writing of this report. A complete listing of the ADNI investigators can be found at: https://adni.loni.usc.edu/wpcontent/uploads/how to apply/ADNI Acknowledgement List.pdf.
These authors contributed equally to this work.
Appl. Sci. 2023, 13(15), 8803; https://doi.org/10.3390/app13158803
Submission received: 9 July 2023 / Revised: 27 July 2023 / Accepted: 27 July 2023 / Published: 30 July 2023
(This article belongs to the Special Issue Advances in Image and Video Processing: Techniques and Applications)

Abstract

:
In this study, we optimized the σ -values of a block matching and 3D filtering (BM3D) algorithm to reduce noise in magnetic resonance images. Brain T2-weighted images (T2WIs) were obtained using the BrainWeb simulation program and Rician noise with intensities of 0.05, 0.10, and 0.15. The BM3D algorithm was applied to the optimized BM3D algorithm and compared with conventional noise reduction algorithms using Gaussian, median, and Wiener filters. The clinical feasibility was assessed using real brain T2WIs from the Alzheimer’s Disease Neuroimaging Initiative. Quantitative evaluation was performed using the contrast-to-noise ratio, coefficient of variation, structural similarity index measurement, and root mean square error. The simulation results showed optimal image characteristics and similarity at a σ-value of 0.12, demonstrating superior noise reduction performance. The optimized BM3D algorithm showed the greatest improvement in the clinical study. In conclusion, applying the optimized BM3D algorithm with a σ-value of 0.12 achieved efficient noise reduction.

1. Introduction

The medical system in the past focused on the treatment of diseases, but with the significant advancements in medical technology today, the focus has shifted to early diagnosis and treatment-oriented medical services to prevent diseases in advance and maintain a healthy body for a long time. Along with the increased life expectancy in modern times, the prevalence of human beings is also increasing, and rapid visual diagnosis using medical imaging is required in the case of high prevalence and fatality rates such as cancer [1,2]. Therefore, the need for high-performance medical imaging equipment for precise diagnosis is increasing [3]. However, X-rays and gamma rays, which are commonly used to examine the human body, use ionizing radiation. Ionizing radiation consists of high-energy electromagnetic waves and is used in the medical field for human imaging. Unfortunately, ionizing radiation can cause minor side effects like radiation sickness and more severe potential genetic issues by affecting DNA in the process of penetrating cells [4]. To defend against harmfulness from ionizing radiation, the concept of nuclear magnetic resonance was first established by Bloch and Purcell. The modern magnetic resonance imaging (MRI) was developed through continuous research based on the concept. It is now possible to obtain high-resolution medical images with reduced radiation [5].
The non-ionizing radiation used in MR apparatuses has significantly lower energy than ionizing radiation and has been verified to have no harmful effects on the human body. Moreover, imaging using a magnetic field directly stimulates hydrogen nuclei present in each tissue allowing the acquisition of high-resolution images unlike the ionizing radiation that exploits interactions with tissues [6,7]. In addition, compared with CT, MRI is more effective in observing areas surrounded by air or bones and is widely used in clinical practice for a precise diagnosis.
However, noise inevitably occurs in the resulting magnetic resonance (MR) images because of coil malfunction or disturbance of the external magnetic field [8]. MR images were corrupted by a zero-means Gaussian noise distribution, namely, Rician noise, with equal variance. Rician noise arises in MRI primarily during the generation of frequency by RF coils and the amplification of signals in pre-amplifiers. The raw data of MR images inherently possess complex values and are corrupted due to a zero-mean Gaussian distribution with equal variance [9]. Although similar to Gaussian noise in having tails on both sides of the mean, Rician noise differs in that its means is non-zero and distribution is asymmetric. MR images, typically in magnitude format, are formed by a non-linear transformation that involves taking the square root of the sum of squares of two independent Gaussian random variables at each pixel. This transformation leads to MR images having a Rician distribution, which can be described by the amplitude of periodic signals and the standard deviation of Gaussian noise. Noise occurring in all medical images, including MRI, has a detrimental impact on observing irregular tissues within the human body. The small distortions can lead to different interpretations particularly in regions like the abdomen or brain, where various tissues with different contrasts are densely interconnected. Therefore, noise reduction from medical images has been a persistent issue and is actively researched to achieve accurate diagnoses [10].
Noise-reduction methods can be classified into two types. First, it improves the performance of medical imaging apparatus [11]. Increasing the magnetic field strength can reduce noise and simultaneously improve the resolution of MR images. High-performance superconducting magnets are required to generate a strong magnetic field [12]. The modeling and development of the magnets involve significant time and cost. Moreover, even with a high-performance coil capable of generating a strong magnetic field and signal, appropriate detectors and partial coils that can accommodate them are also necessary.
Noise can be removed by applying algorithms to acquired images and restoring damaged signals based on the principles of signal recovery due to the drawbacks of hardware development mentioned above [13]. Software application is straightforward and requires less time compared to hardware development. Additionally, using the same parameters allows for reproducibility control. However, this method involves mathematical computations to calculate already acquired signals, and applying incorrect parameters can cause image distortion. Hence, the appropriate implementation is necessary to efficiently reduce noise and restore image quality.
Among the noise reduction algorithms, linear filtering, which was initially developed, is a basic image-processing method. Linear filters remove noise through convolution operations that have a linear function with respect to the input signal. Although linear filters are computationally efficient and easy to implement, they have the disadvantage of not detecting complex noise patterns or edge information in images effectively. The Gaussian and median filters used in this study belong to the category of linear filters. On the other hand, non-linear filters reduce noise using non-linear operations and thresholding. The Wiener filter and BM3D algorithm used in this study are examples of non-linear filters [14,15]. Non-linear filters possess characteristics opposite to those of linear filters. Therefore, selecting an appropriate filter that suits the specific task in essential in their application.
With the development of algorithms for noise reduction, various modified methods have been devised and used to obtain improved results. Among them, the block-matching and 3D filtering (BM3D) algorithm is a noise reduction method in the frequency domain that uses sparse representation [16]. The sparse representation is a method of expressing a signal or data as a linear combination of basis vectors where the key idea is to estimate the original signal using only a subset of the basis vectors. As a result, most of the weights become zeros, and only a few basis vectors play a significant role. Consequently, sparse representation simplifies the representation compared to operating on the entire pixel values, reducing the required computational values and speeding up the processing. From the perspective of noise reduction, sparse representation restores images in a way that minimizes the impact of noise by making the weights of basis vectors affected by the noise close to zero.
The concept of the BM3D algorithm was first introduced as a wide-range scanning approach for motion estimation in video compression. Attempts to apply the BM3D algorithm to the field of medical image processing are gradually increasing, and it is being used in various fields, such as nuclear medicine and CT [17,18].
However, optimization of the σ-value, which determines the degree of smoothing for noise reduction, has not been performed in the field of MR image processing. Therefore, in this study, Rician noise was arbitrarily added to a brain T2-weighted image (T2WI) acquired using a simulation to derive the σ-value representing the optimal image characteristics. In addition, the results of the application were compared with those of conventional noise reduction algorithms using open-access data for clinical MR images to confirm the effectiveness of the BM3D algorithm with optimized σ-values in clinical images.

2. Materials and Methods

2.1. Application of Noise Reduction Algorithms

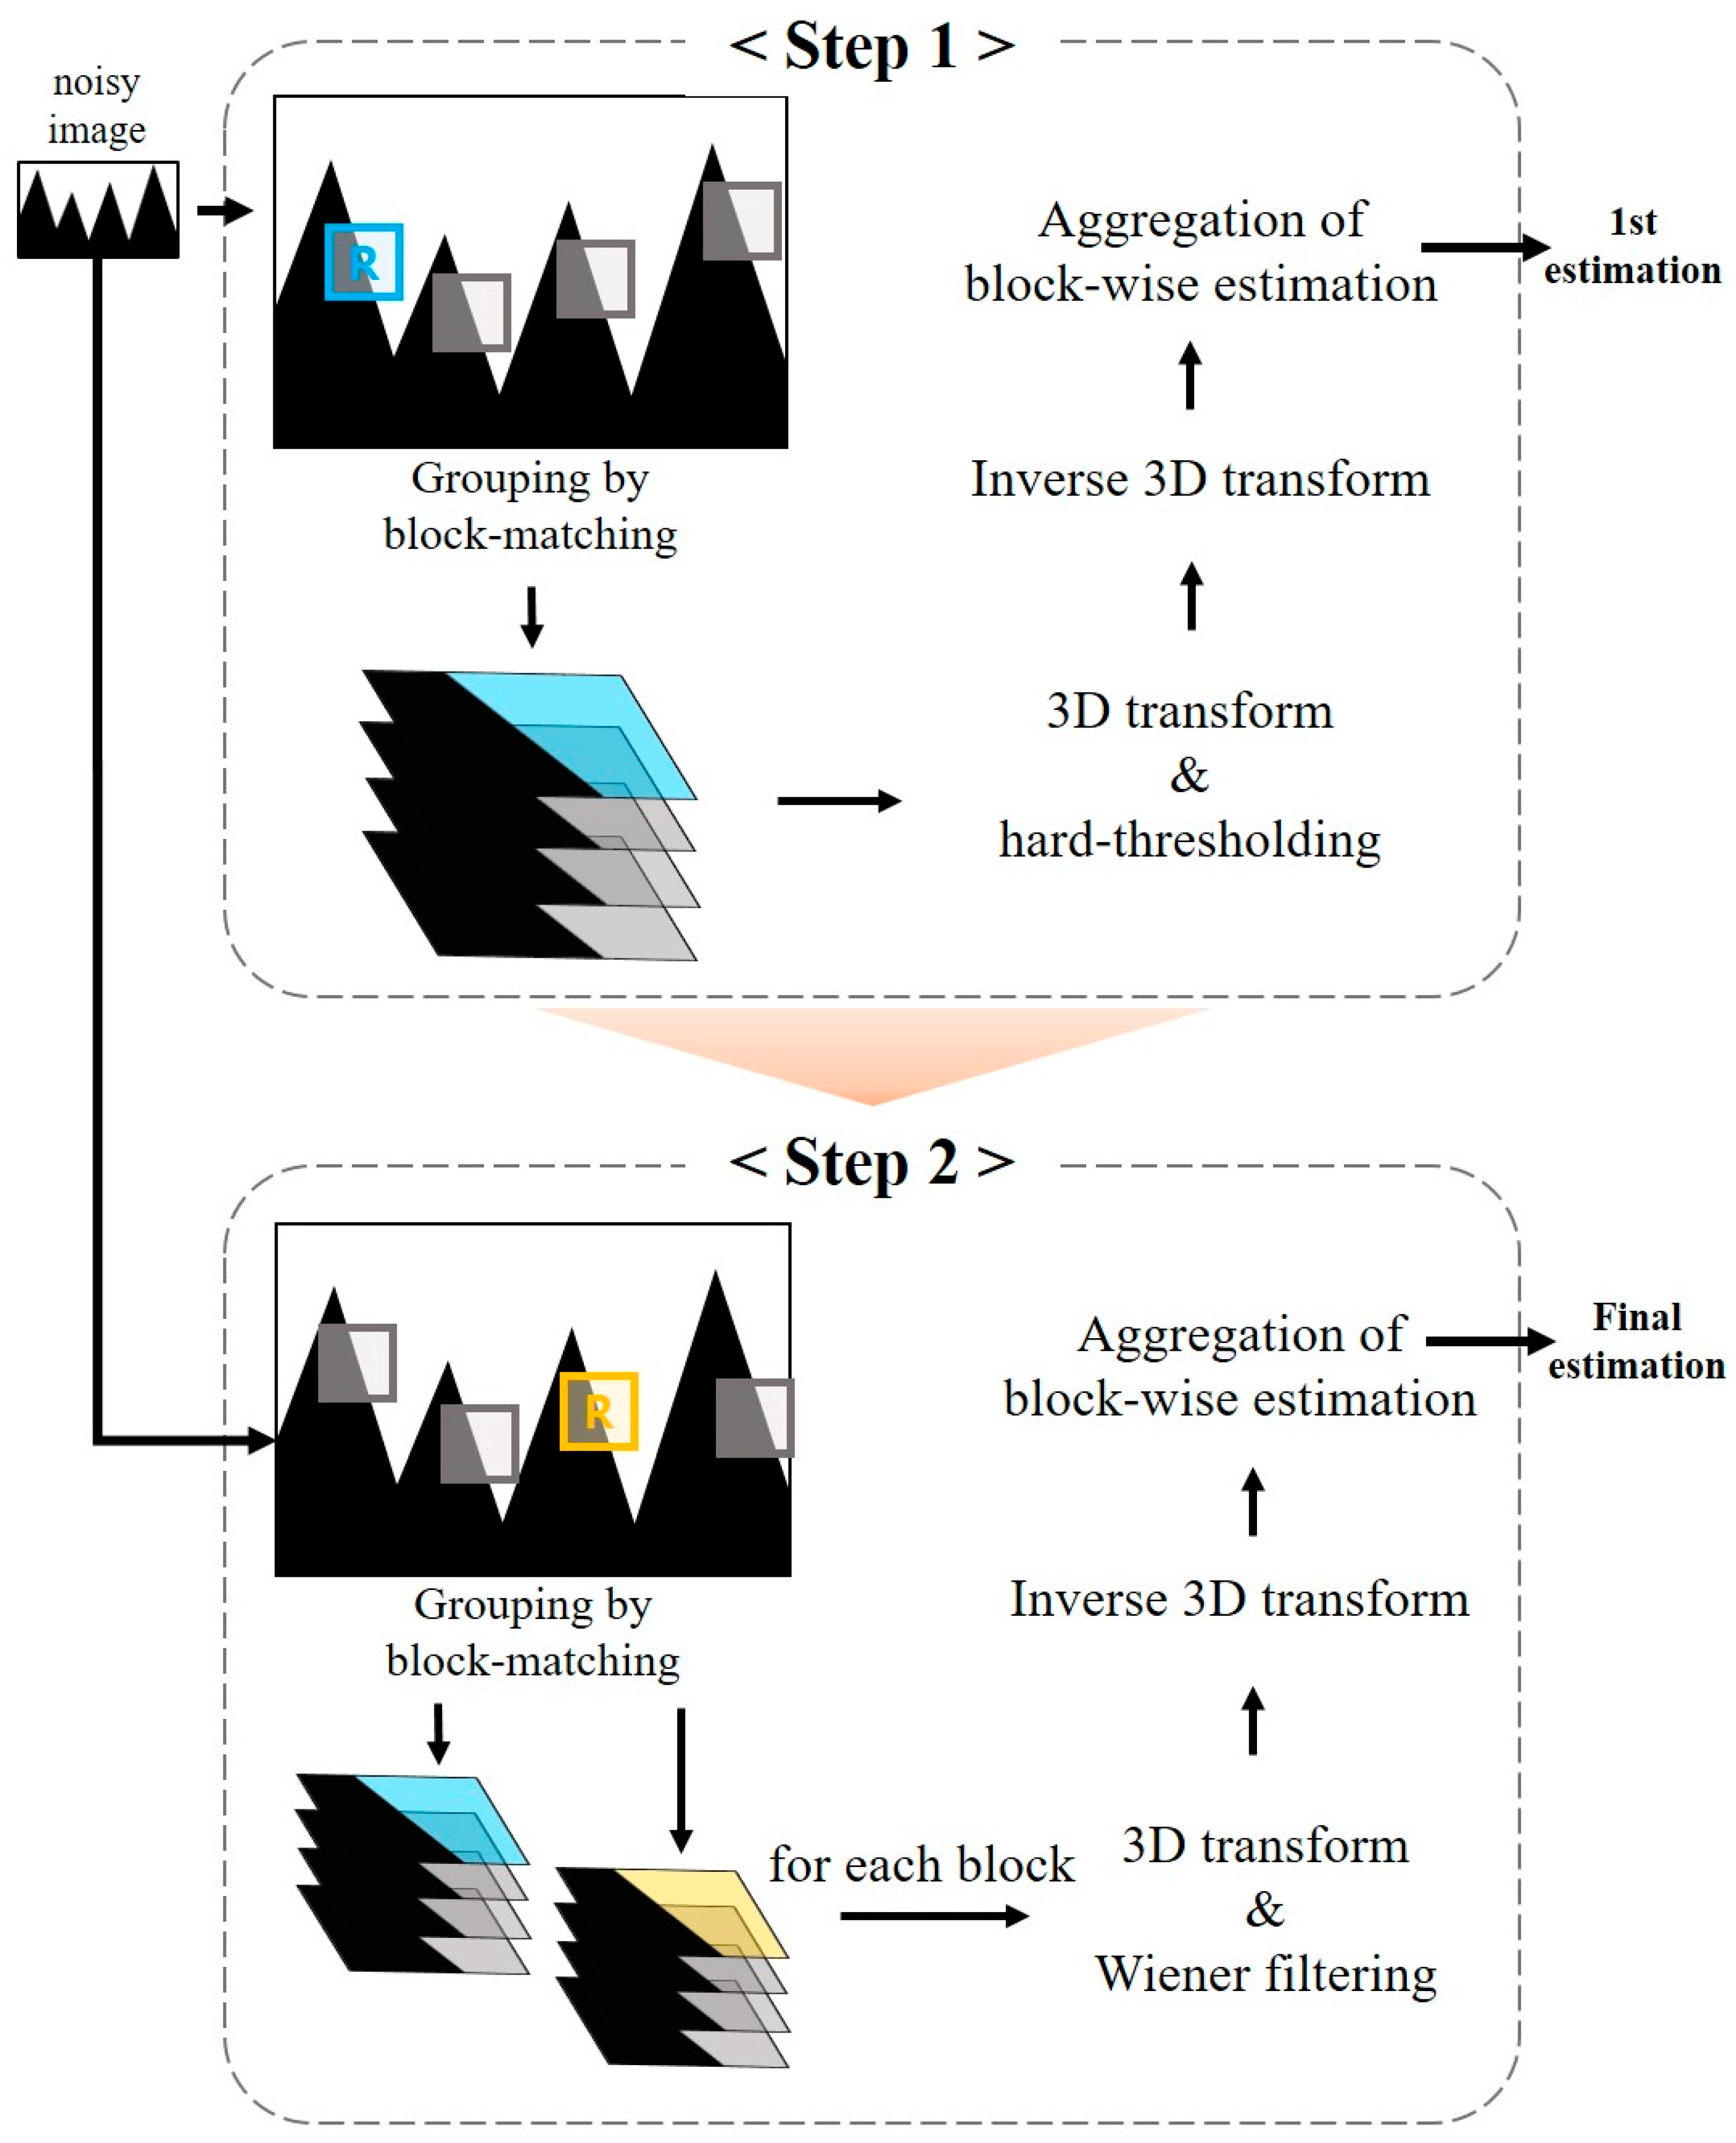
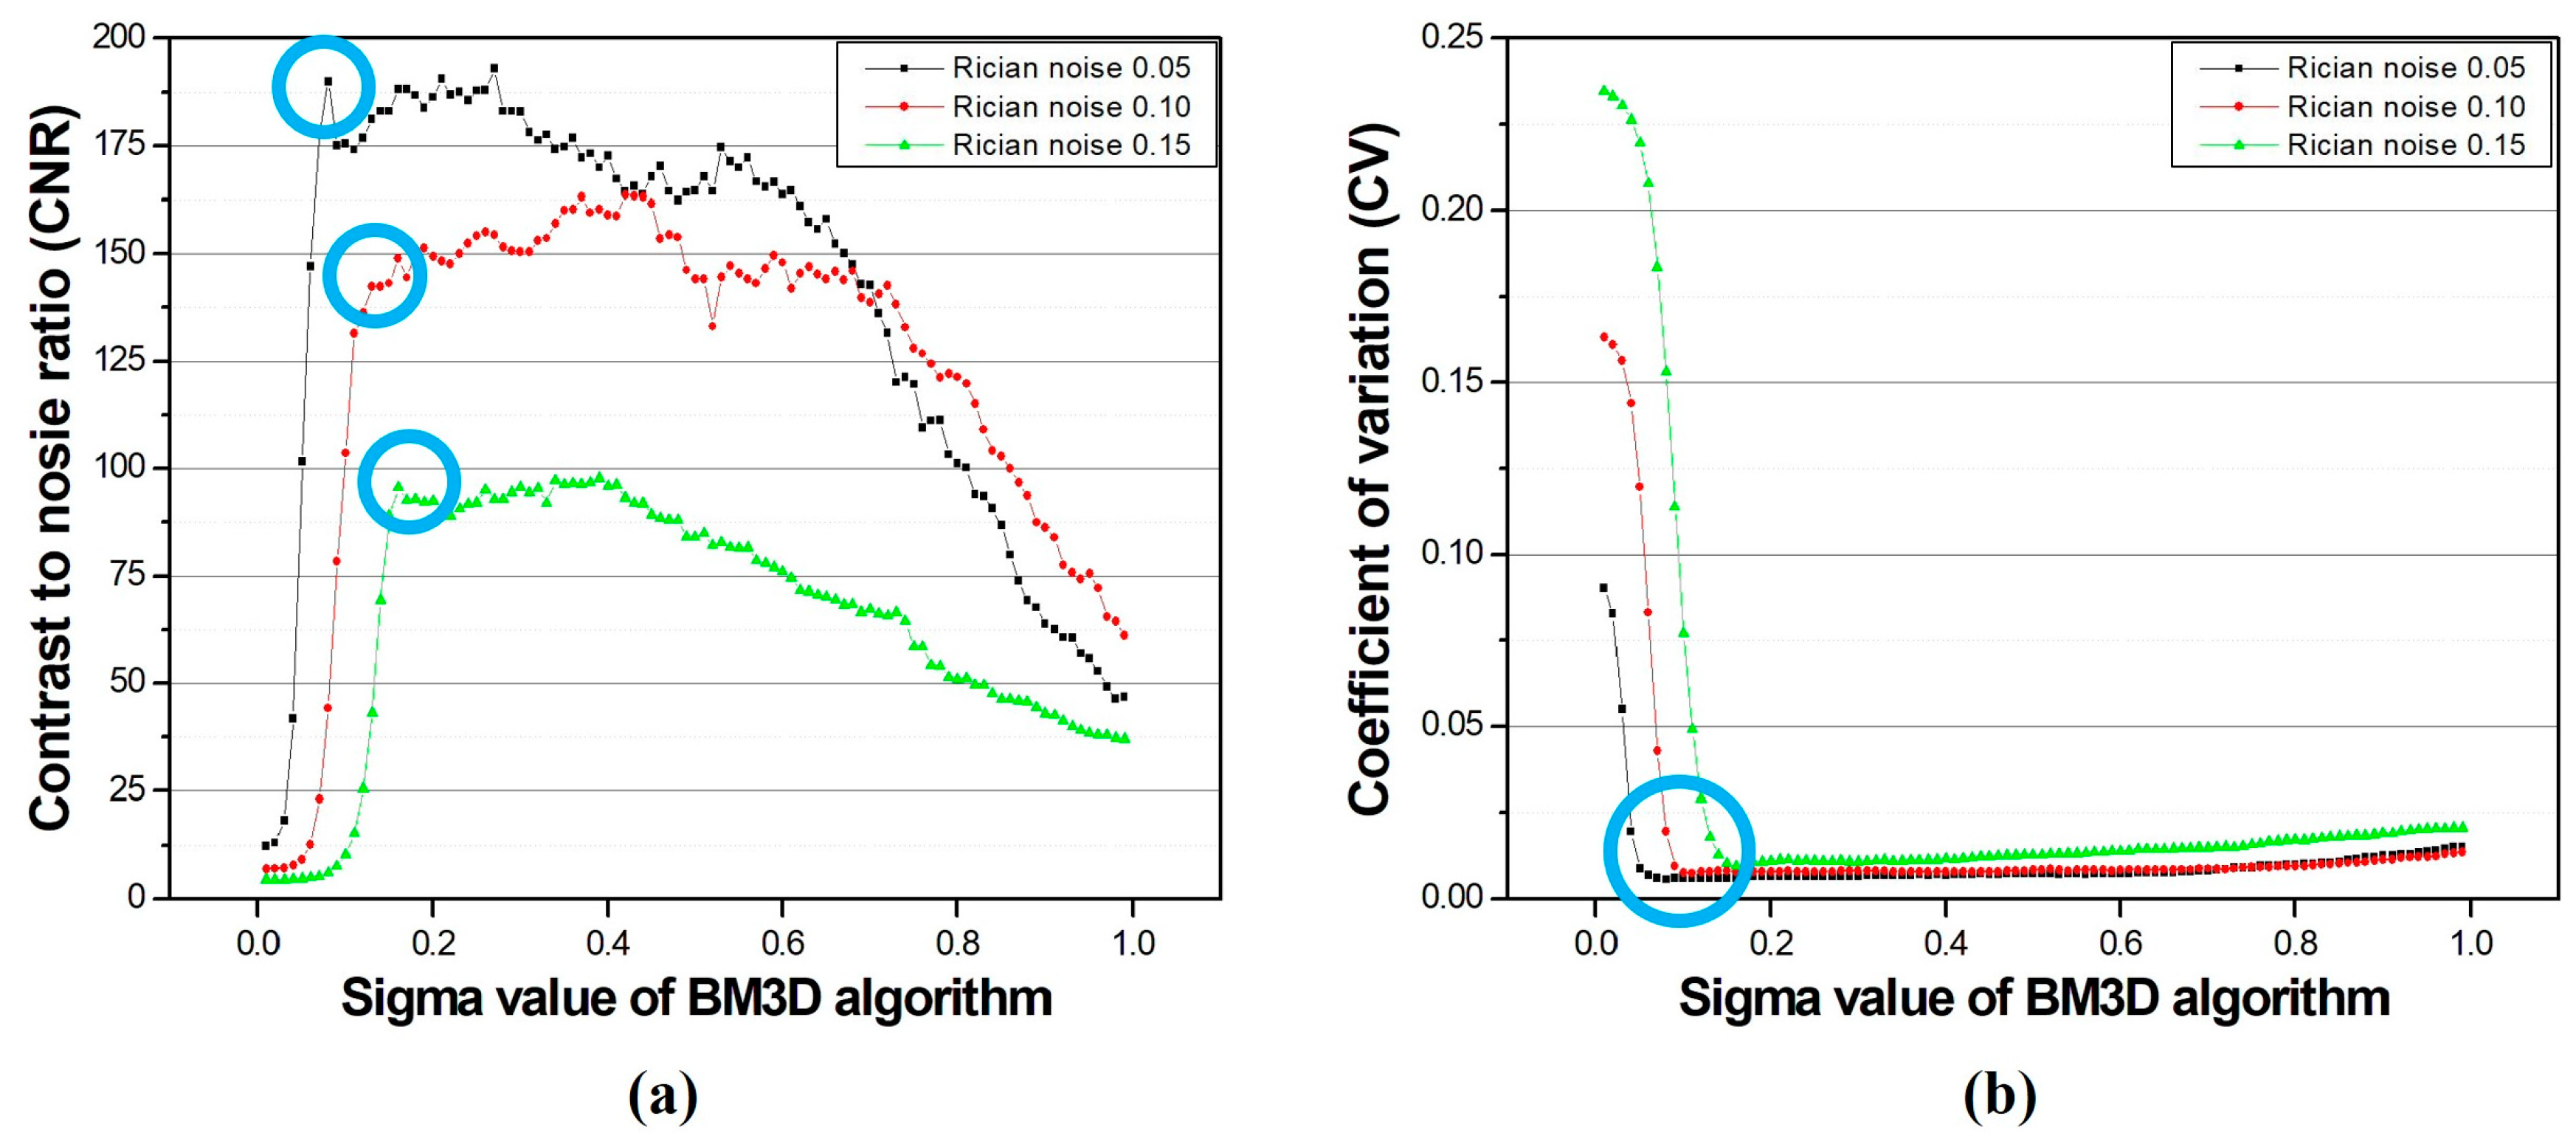
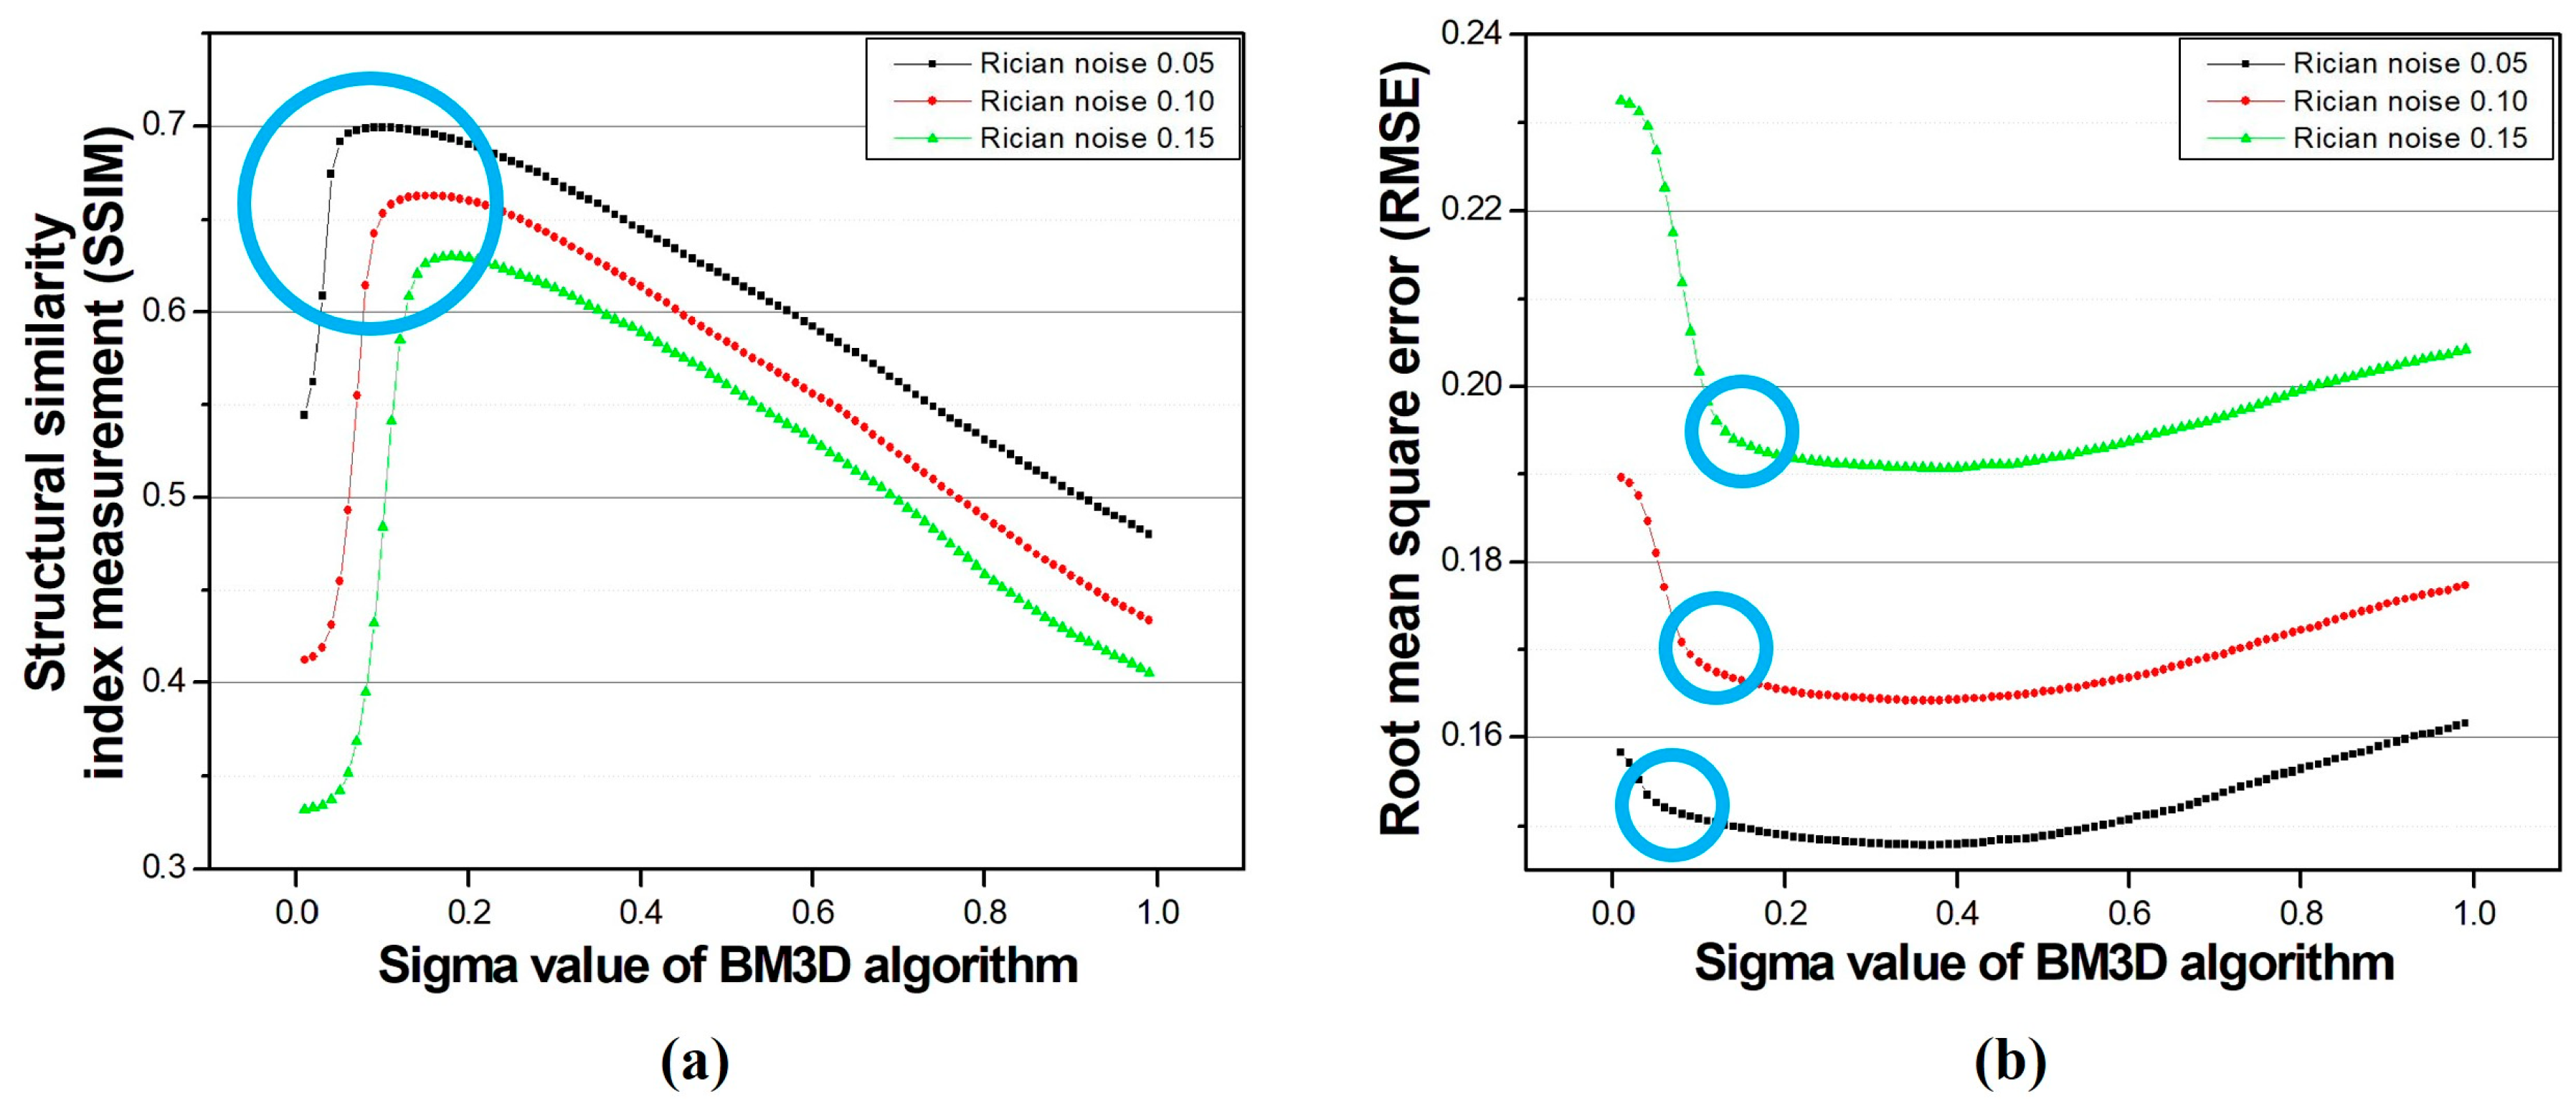
2.1.1. Optimization of σ-Value for the Block Matching and 3D Filtering Algorithm

The BM3D algorithm is one of the fusion-type noise reduction methods based on non-local means (NLM) [19]. The process of the BM3D algorithm can be largely divided into two steps, and in each step, noise reduction is performed through the wavelet transform-based hard-thresholding technique and Wiener filtering, respectively. The wavelet transform-based hard-thresholding technique treats pixel values below a set threshold value as 0 to increase sparsity, enabling simple and rapid calculation during algorithm processing. In addition, Wiener filtering is an adaptive filter commonly used to remove noise in medical images and has the advantage of less boundary information loss than other linear filters because it is adjusted appropriately for regional variance. Below is the equation for hard-thresholding [20].
h t x = x    i f   x λ 0    o t h e r w i s e ,
Here, x and λ denote the input pixel value and the threshold.
NLM is a noise reduction algorithm that is the basis of the grouping principle in the BM3D algorithm. The processing of entire image with the same weights or parameters is inefficient and inaccurate, since the noise distribution in a general image is not uniform. To compensate for this problem, NLM was devised [21]. NLM works on the principle of evaluating the similarity between kernels within the search window, and noise is removed by averaging similar image pixels according to the distance to the center pixel of each kernel. The entire image is divided into search windows since the pixel which is the most similar to the given pixel is not absolutely close. The weight for the center pixel p of the kernel set within the search window is equally applied to all pixels in the same kernel. The weights are determined by the square of the Euclidean distance and introduced to average similar kernels.
N L M = 1 C ( p ) f ( d B p , B q u q d q ,
where d B p ,   B q denotes the Euclidean distance of the two kernels centered at p and q ; f and C ( p ) mean the decreasing function and the normalization factor, respectively.
The BM3D algorithm works through two key principles: grouping and collaborative filtering [22]. Grouping means collecting n-dimensional patches similar to the given signal (reference) in the original image in n+1 dimensions. In this study, it was used in the process of forming a 3D block by stacking patches extracted from 2D images. The similarity between patches is judged through the reciprocal of the distance measurement value using the L2 norm. If the distance is less than the predefined threshold, the patches are considered to be mutually similar and grouped together as a single 3D block. The patches in the 3D block are listed in descending or ascending order in a similar order.
P 2 D h t = x X : Y τ 2 D h t P x R Y τ 2 D h t P x 2 2 ( N 1 h t ) 2 τ m a t c h h t ,
where P x R and P x denote the reference block and similar block in the noisy image X , Y is the hard-threholding factor, τ 2 D h t means the 2D linear transform, N 1 h t represents the block size of the first step, and P 2 D h t is the set of coordinates of all blocks similar to P x R .
E P 2 D h t h t = τ 3 D h t 1 Y τ 3 D h t A P 2 D h t ,
where E P 2 D h t h t denotes the estimate acquired through inverse 3D transform, τ 3 D h t and τ 3 D h t 1 mean the 3D transform and inverse 3D transform, respectively. Y is the 3D hard-threholding factor, and A P 2 D h t represents the formed 3D block. The BM3D algorithm goes through a process of transforming from the spatial domain to the frequency for processing. Therefore, an inverse 3D transform is utilized to convert the noise reduced frequencies back to the spatial domain in order to derive final denoised image.
After the grouping process, each 3D block is subjected to a denoising procedure using collaborative filtering, which produces an estimation for each constituent patch in the block. The reference patch determining the basis for block grouping can be redundantly processed, since the patches are randomly selected from the whole region of the image. In order to compensate for this, the weighted average removes repeated estimates and obtains a final estimate.
y ^ s t e p 1 = X R X x m x m P 2 D h t w x R h t E P 2 D h t h t ( x ) X R X x m x m P 2 D h t w x R h t χ x m ( x ) ,
where y ^ s t e p 1 represents the estimate acquired through the first step of the BM3D algorithm, w x R h t is the weight, and χ x m denotes the square support function located in x m X .
In Equations (3)–(5), the superscript h t of the modifiers means that the hard-thresholding technique is used in the first step as the noise reduction method. Replacing h t with w i e results in a equation that means the second stage of removing noise using Wiener filtering, since the process of grouping and collaborative filtering in each stage is identical. The first estimate obtained after completing the first step is used as a pilot signal for Wiener filtering to improve the performance. Figure 1 is the flowchart of the noise reduction process of the BM3D algorithm.

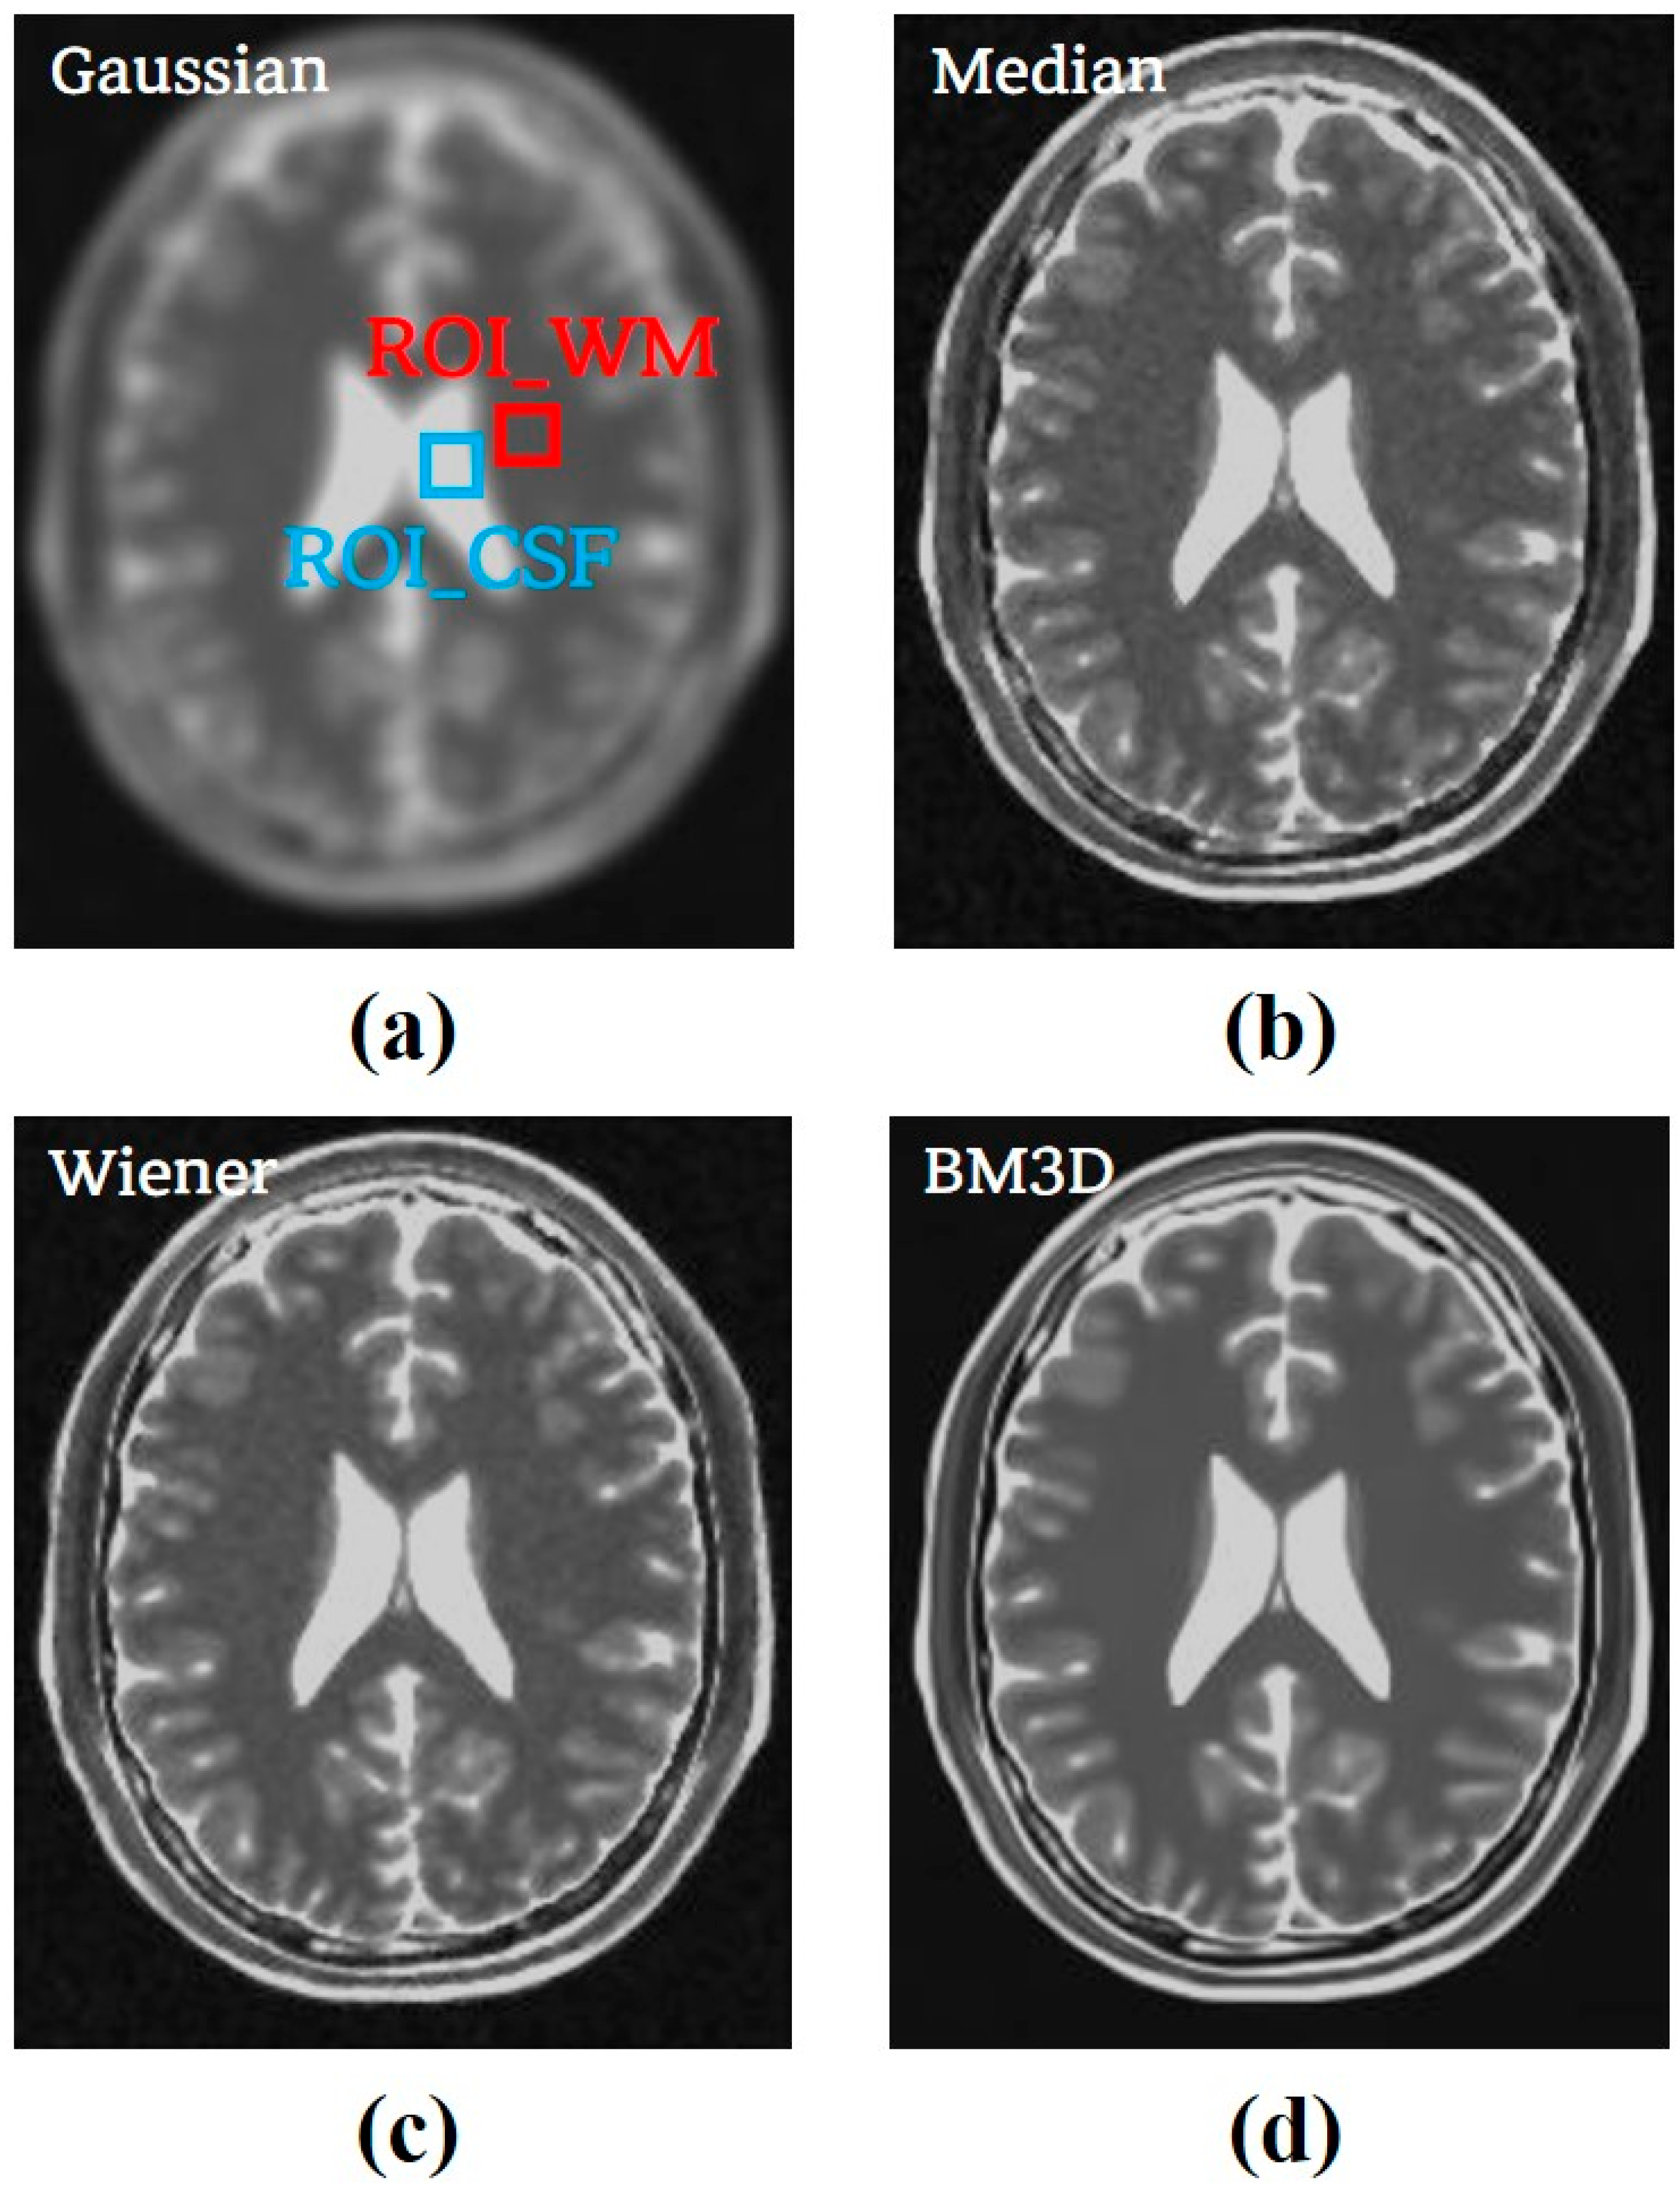
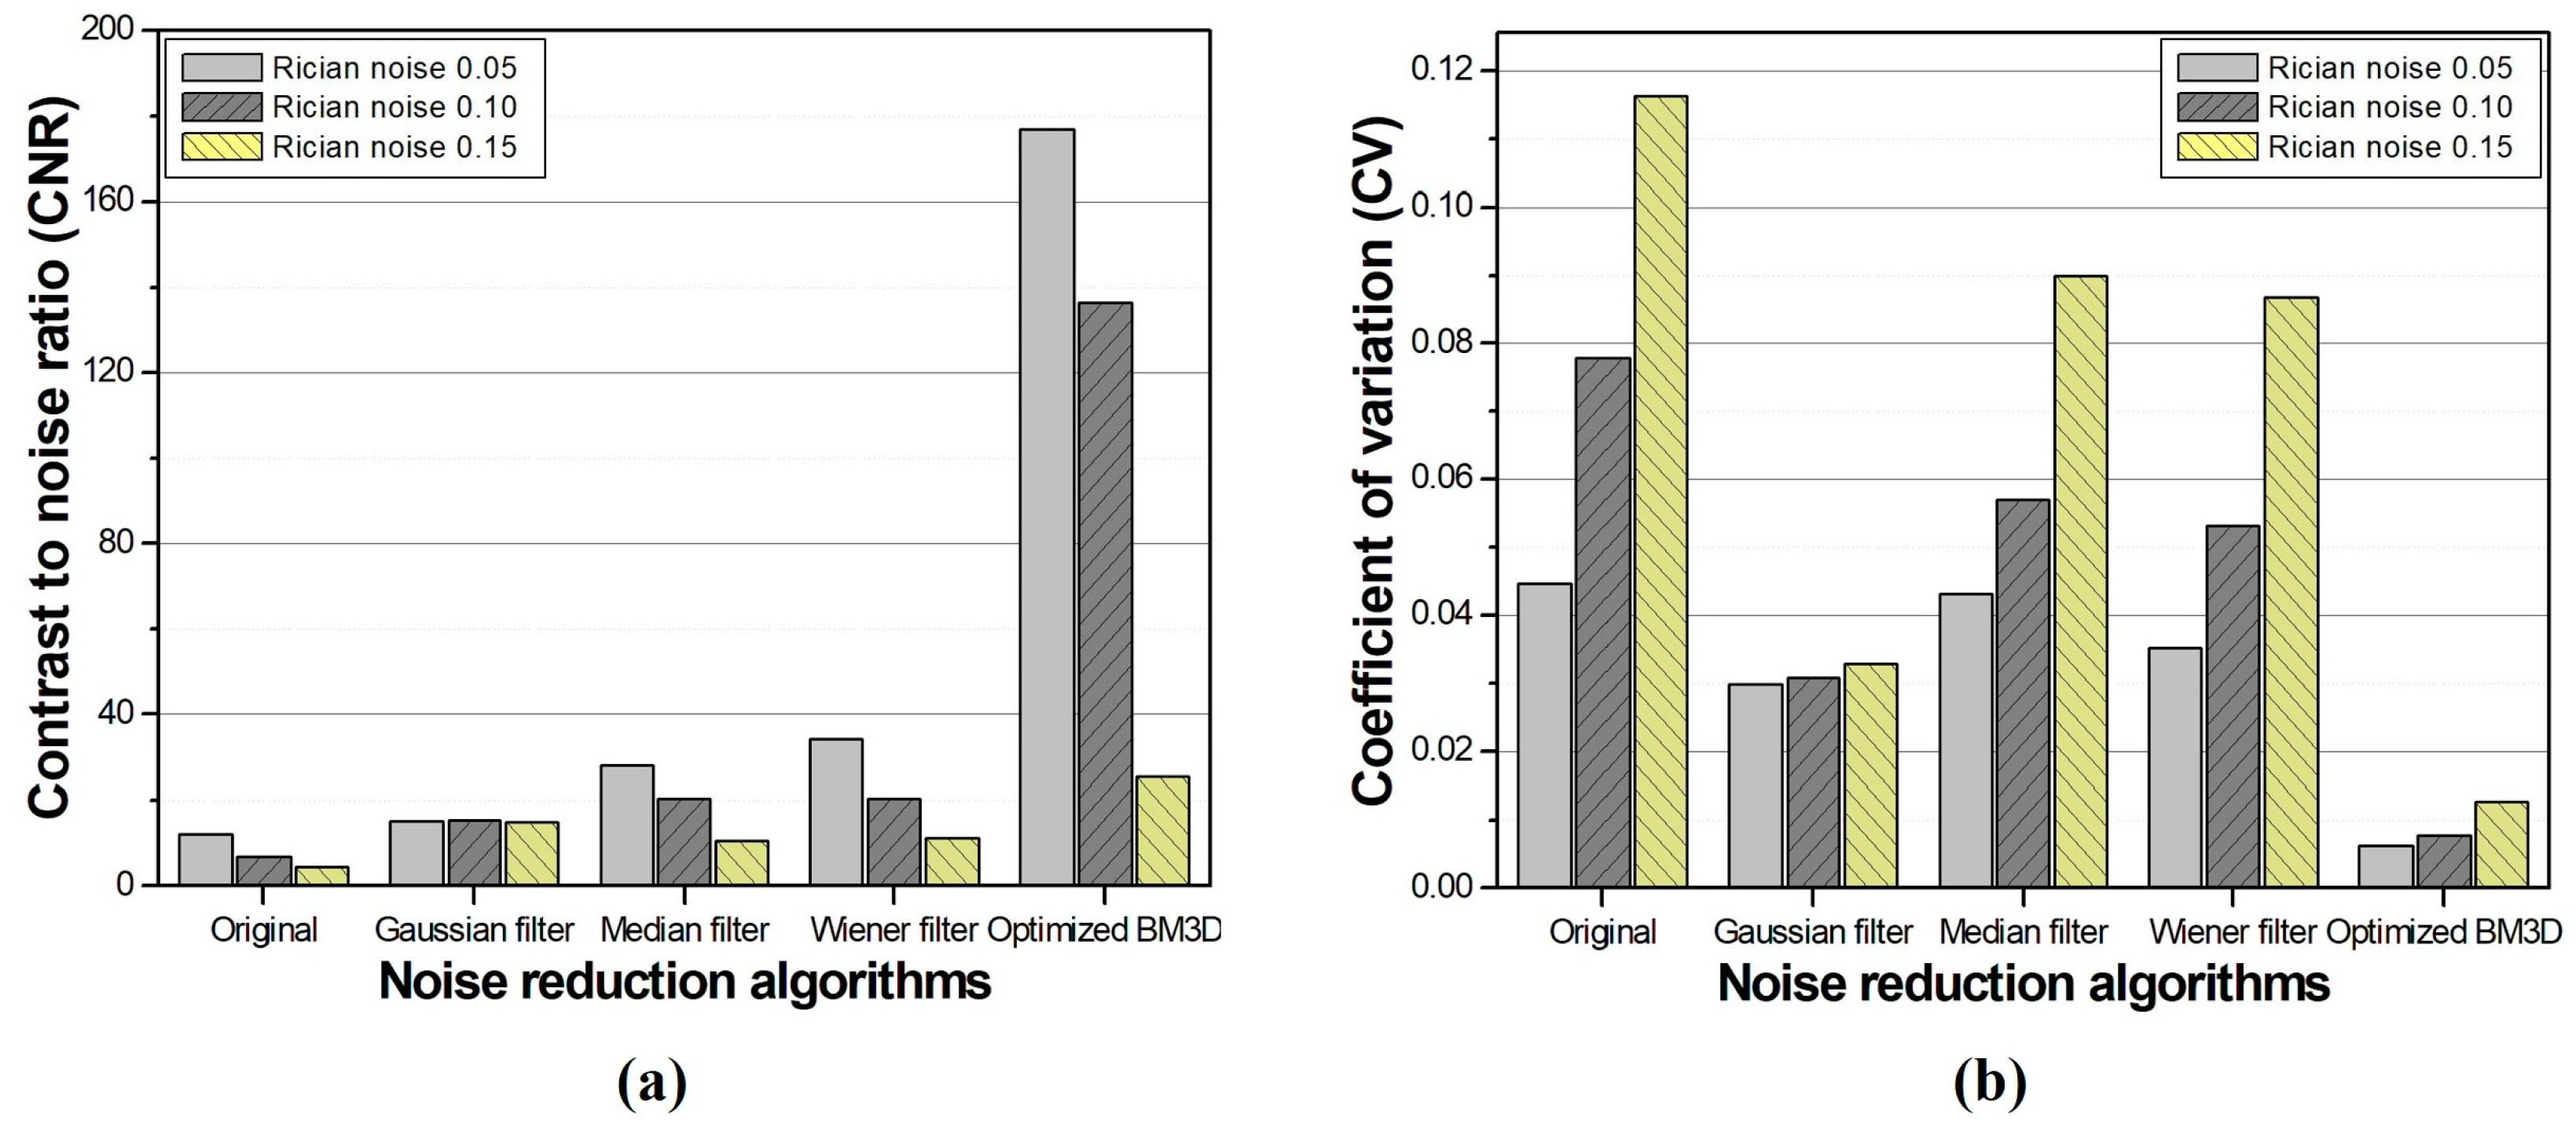
2.1.2. Relative Performance Evaluation of the Optimized BM3D Algorithm

To compare the performance efficiency of the BM3D algorithm, conventional noise reduction algorithms referred to as Gaussian, median, and Wiener filters were applied [23,24,25]. These conventional noise reduction algorithms were developed in the very early stages of image processing history, and various modified approaches with adaptive techniques have been applied in the medical imaging field. However, the noise reduction performance of conventional algorithms is proved with various studies. Therefore, we employed the above-mentioned filters for comparison with the optimized BM3D algorithm aiming to assess the performance of the optimized BM3D algorithms. The following are the equations for each conventional noise reduction algorithm. The kernel size was set to be the same as the BM3D algorithm. Entire noise reduction algorithms were modeled and applied using the MATLAB program (MathWorks, Boston, MA, USA).
G a u x = 1 2 π s e x 2 2 s 2 ,
where x denotes the distance from the center pixel of the kernel and s is the standard deviation of the noise in the kernel.
M e d n = M E D [ Y n k ,   Y n k + 1 ,   ,   X n ,   X n + k ] ,
where when the length of the median filter is satisfied as n = 2 k + 1 ,  X ( n ) , and Y n denote n t h elements of the input and output images, respectively.
W i e m ,   n = μ + v 2 σ 2 v 2 ( a m ,   n μ ) ,
where μ denotes the mean value of the Wiener filter with the kernel size of m × n , v means the variance of the input image, and σ is the setting of noise variance.

2.2. The Acquisition of the Magnetic Resonance Images

2.2.1. Acquisition of Simulated Brain T2-Weighted Image Using BrainWeb Program

Simulated brain MR T2WIs were acquired using the BrainWeb simulation program [26,27]. The BrainWeb simulation program generates images using an MRI simulator developed by the McConnel Brain Imaging Center, and it implements the MR signal generation process based on the Bloch equation. The Bloch equation represents the changes in nuclear magnetic moments over time and explains the phenomenon of materials absorbing and emitting magnetic fields. MR imaging also utilizes signals generated by the precession and relaxation of hydrogen nuclei within the human body. Thus, in the BrainWeb simulation program, the Bloch equation is employed to simulate MR signals. One of the significant advantages of the BrainWeb simulation program is its ability to easily modify imaging acquisition parameters and its accessibility through the internet, allowing users to utilize it from anywhere without locational constraints. Additionally, the program maintains high reproducibility as external variables are excluded.
Among the 181 slices of the acquired 3D data, the 95th slice was extracted and used because it could clearly represent the ventricles and surrounding tissues, making it easy to set a region of interest (ROI) for quantitative evaluation. The intensity of Rician noise was set from 0.05 to 0.15 by 0.05 increments using the MATLAB program, as shown in Figure 2.

2.2.2. Clinical Brain T2-Weighted Image Using the Alzheimer’s Disease Neuroimaging Initiative

The results of optimizing the σ-value of the BM3D algorithm derived from the simulation study were reviewed using clinical MR images acquired using actual MRI to confirm its effectiveness. The clinical T2WI used in this study was obtained from the Alzheimer’s Disease Neuroimaging Initiative (ADNI), which is an open-access database that provides MR images for diagnosing brain diseases, particularly Alzheimer’s disease [28,29]. We obtained a T2WI with a matrix size of 256 × 256 using a 1.5T MR machine to acquire images of conditions commonly acquired for Alzheimer’s disease diagnosis. The acquired clinical brain T2WI is shown in Figure 3, and specific information is available online “https://adni.loni.usc.edu (accessed on 22 March 2023)”.
Similar to the simulation study, to verify the applicability of the BM3D algorithm with the optimized σ-value set in a clinical brain MR T2WI, we compared it with the widely used noise reduction algorithm, including Gaussian, median, and Wiener filters.

2.3. Quantitative Evaluation for the Results of Applying Noise Reduction Algorithms

We measured the contrast-to-noise ratio (CNR) and coefficient of variation (CV) to quantitatively evaluate the results of optimization and application of the BM3D algorithm in this simulation study [30,31]. ROIs for the quantitative evaluation were set in cerebrospinal fluid (CSF) and white matter (WM).
The CNR is a factor representing the contrast ratio between adjacent tissues and is one of the methods for evaluating contrast resolution in medical images. It represents the similar results to visual evaluation and is often used as an index for quantitative evaluation such as image quality control and equipment performance comparison. The CNR can be obtained by dividing the signal intensity by the noise standard deviation, and the value decreases as the image contains more noise. The set ROIs in CSF and WM were used to calculate the CNR. The CV is a metric that quantitatively assesses the amount of noise present in an image by dividing the standard deviation within the defined ROI by the signal value. Therefore, CV was employed to measure the noise reduction rate after restoring the noisy image in this study. A smaller value means that the image contains less noise. The final value used for quantitative evaluation was acquired by averaging the CV of the two ROIs.
C N R = S C S F S W M σ C S F 2 + σ W M 2 ,
C V = σ R O I S R O I ,
where S C S F and S W M denote the signal intensity in the ROIs of the CSF and WM, σ C S F and σ W M represent the standard deviations.
In addition, the structural similarity index measurement (SSIM) and root mean square error (RMSE), which are similarity evaluation factors, were measured to evaluate how closely the degraded image was reconstructed from the noise-free reference [32,33]. The characteristic of simulation studies lies in the ability to obtain an ideal reference image with zero noise. The objective of noise reduction research is to make the degraded image most similar to the reference through algorithms. For this purpose, the structural similarity index measure (SSIM) was utilized to compare the reference and resulting images. SSIM enables a quantitative evaluation similar to human vision in terms of brightness, contrast, and structure. In addition, the RMSE is also for evaluating the similarity between the reference and noisy image. The difference is measured by calculating the pixels in the corresponding coordinates in both images. The RMSE is used as an index to determine the degree of distortion in the entire image. As the SSIM and RMSE assess the similarity between the restored noisy images and the reference images, the entire region of the images was utilized to evaluate the overall structure and pixel values.
S S I M ( x ,   y ) = 2 μ x μ y + c 1 2 σ x y + c 2 μ x 2 + μ y 2 + c 1 σ x 2 + σ y 2 + c 2   ,
where given the images x and y , μ x and μ y denote the mean value of x and y , σ x and σ y represent the standard deviation, c 1 and c 2 represent the stabilization variables.
R M S E = 1 N i = 1 N I 1 m ,   n I 2 ( m ,   n ) 2 ,
where N denotes the number of pixels; I 1 and I 2 denote the reference and noisy images, respectively; and ( m ,   n ) are the coordinates of the pixel.

3. Results

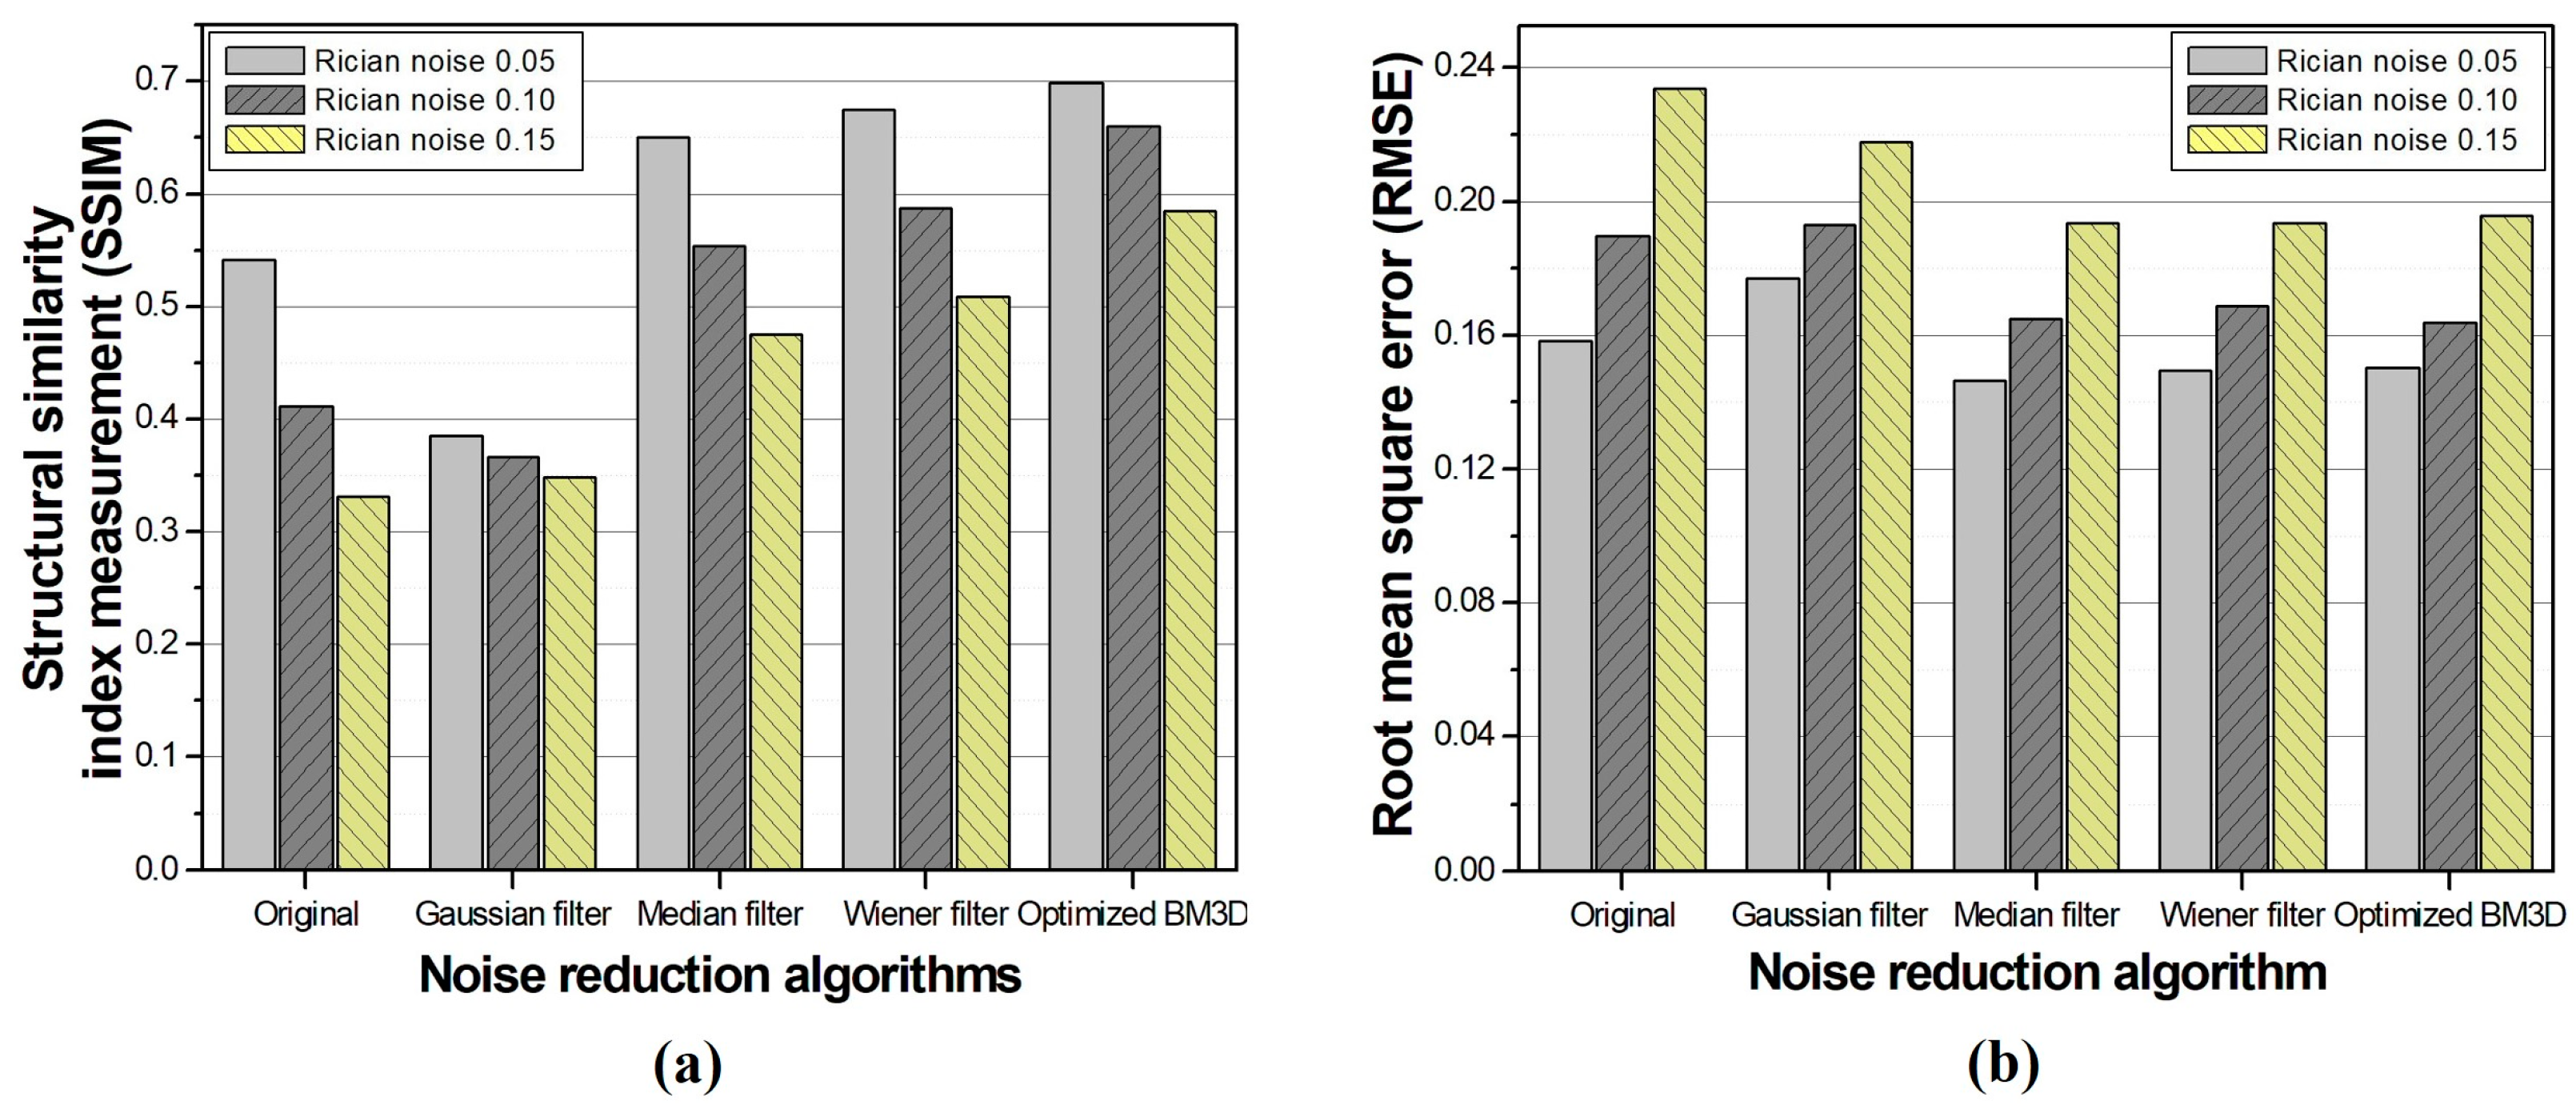
3.1. Simulation Study
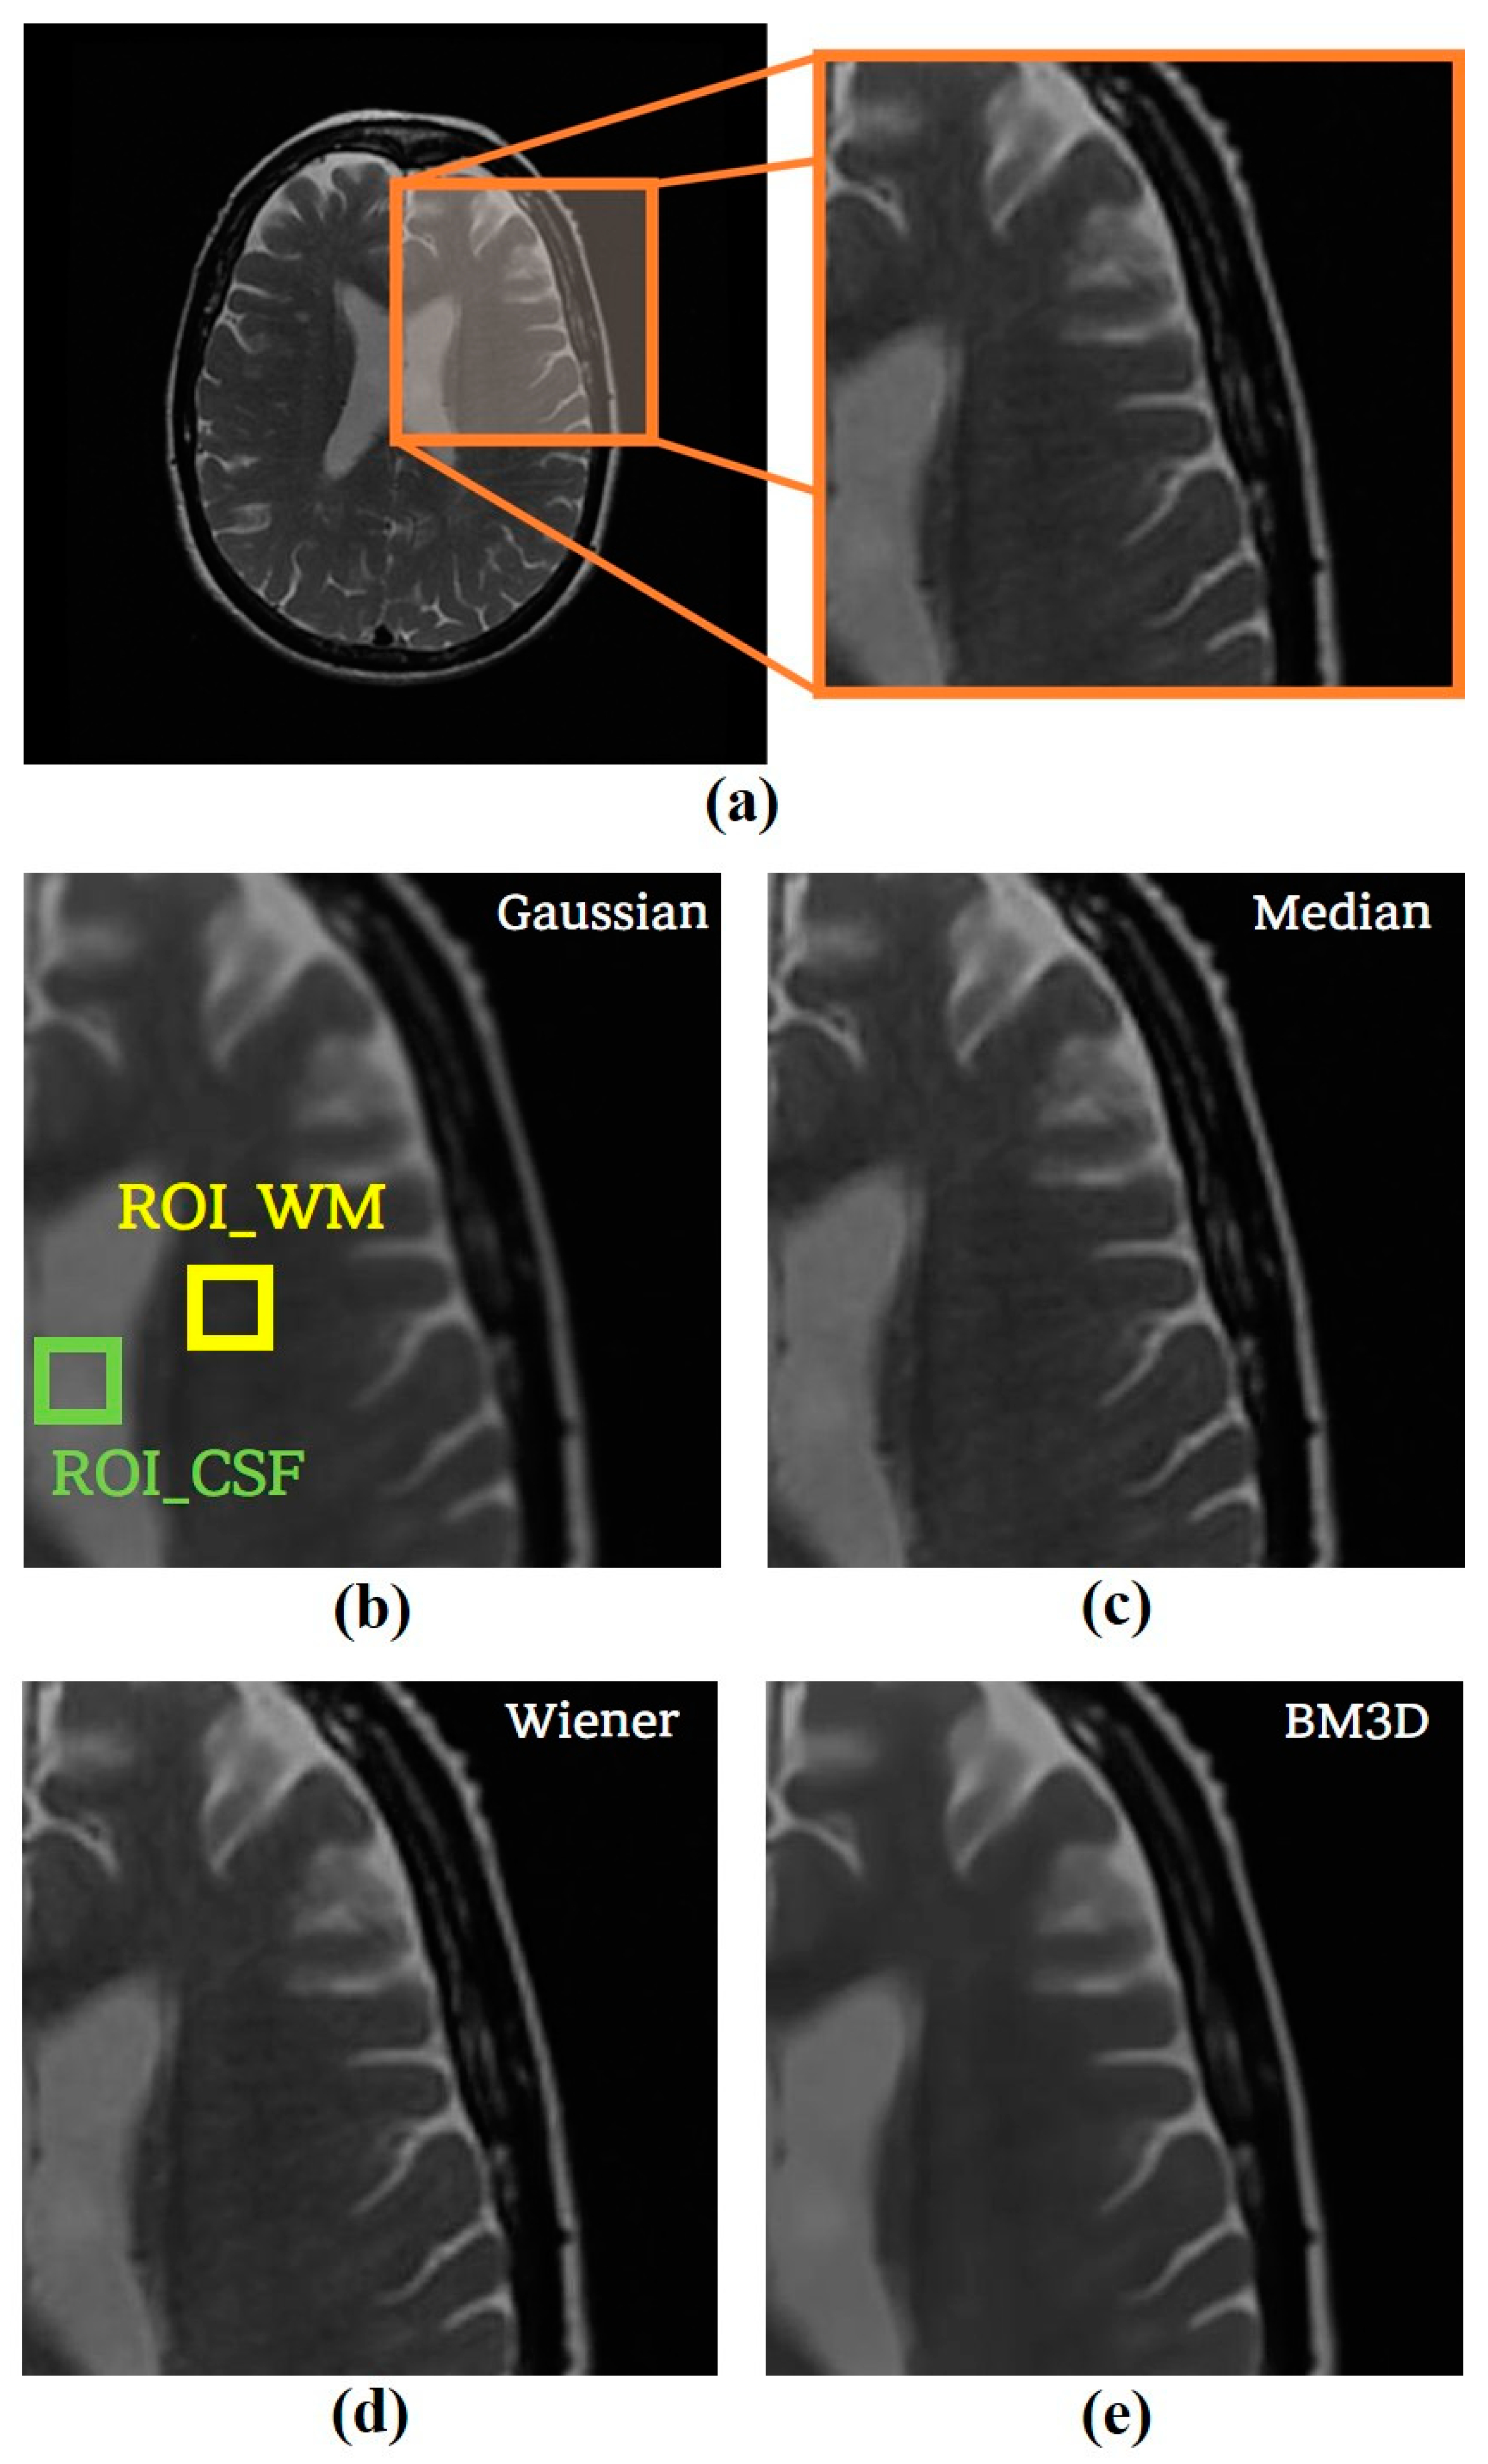
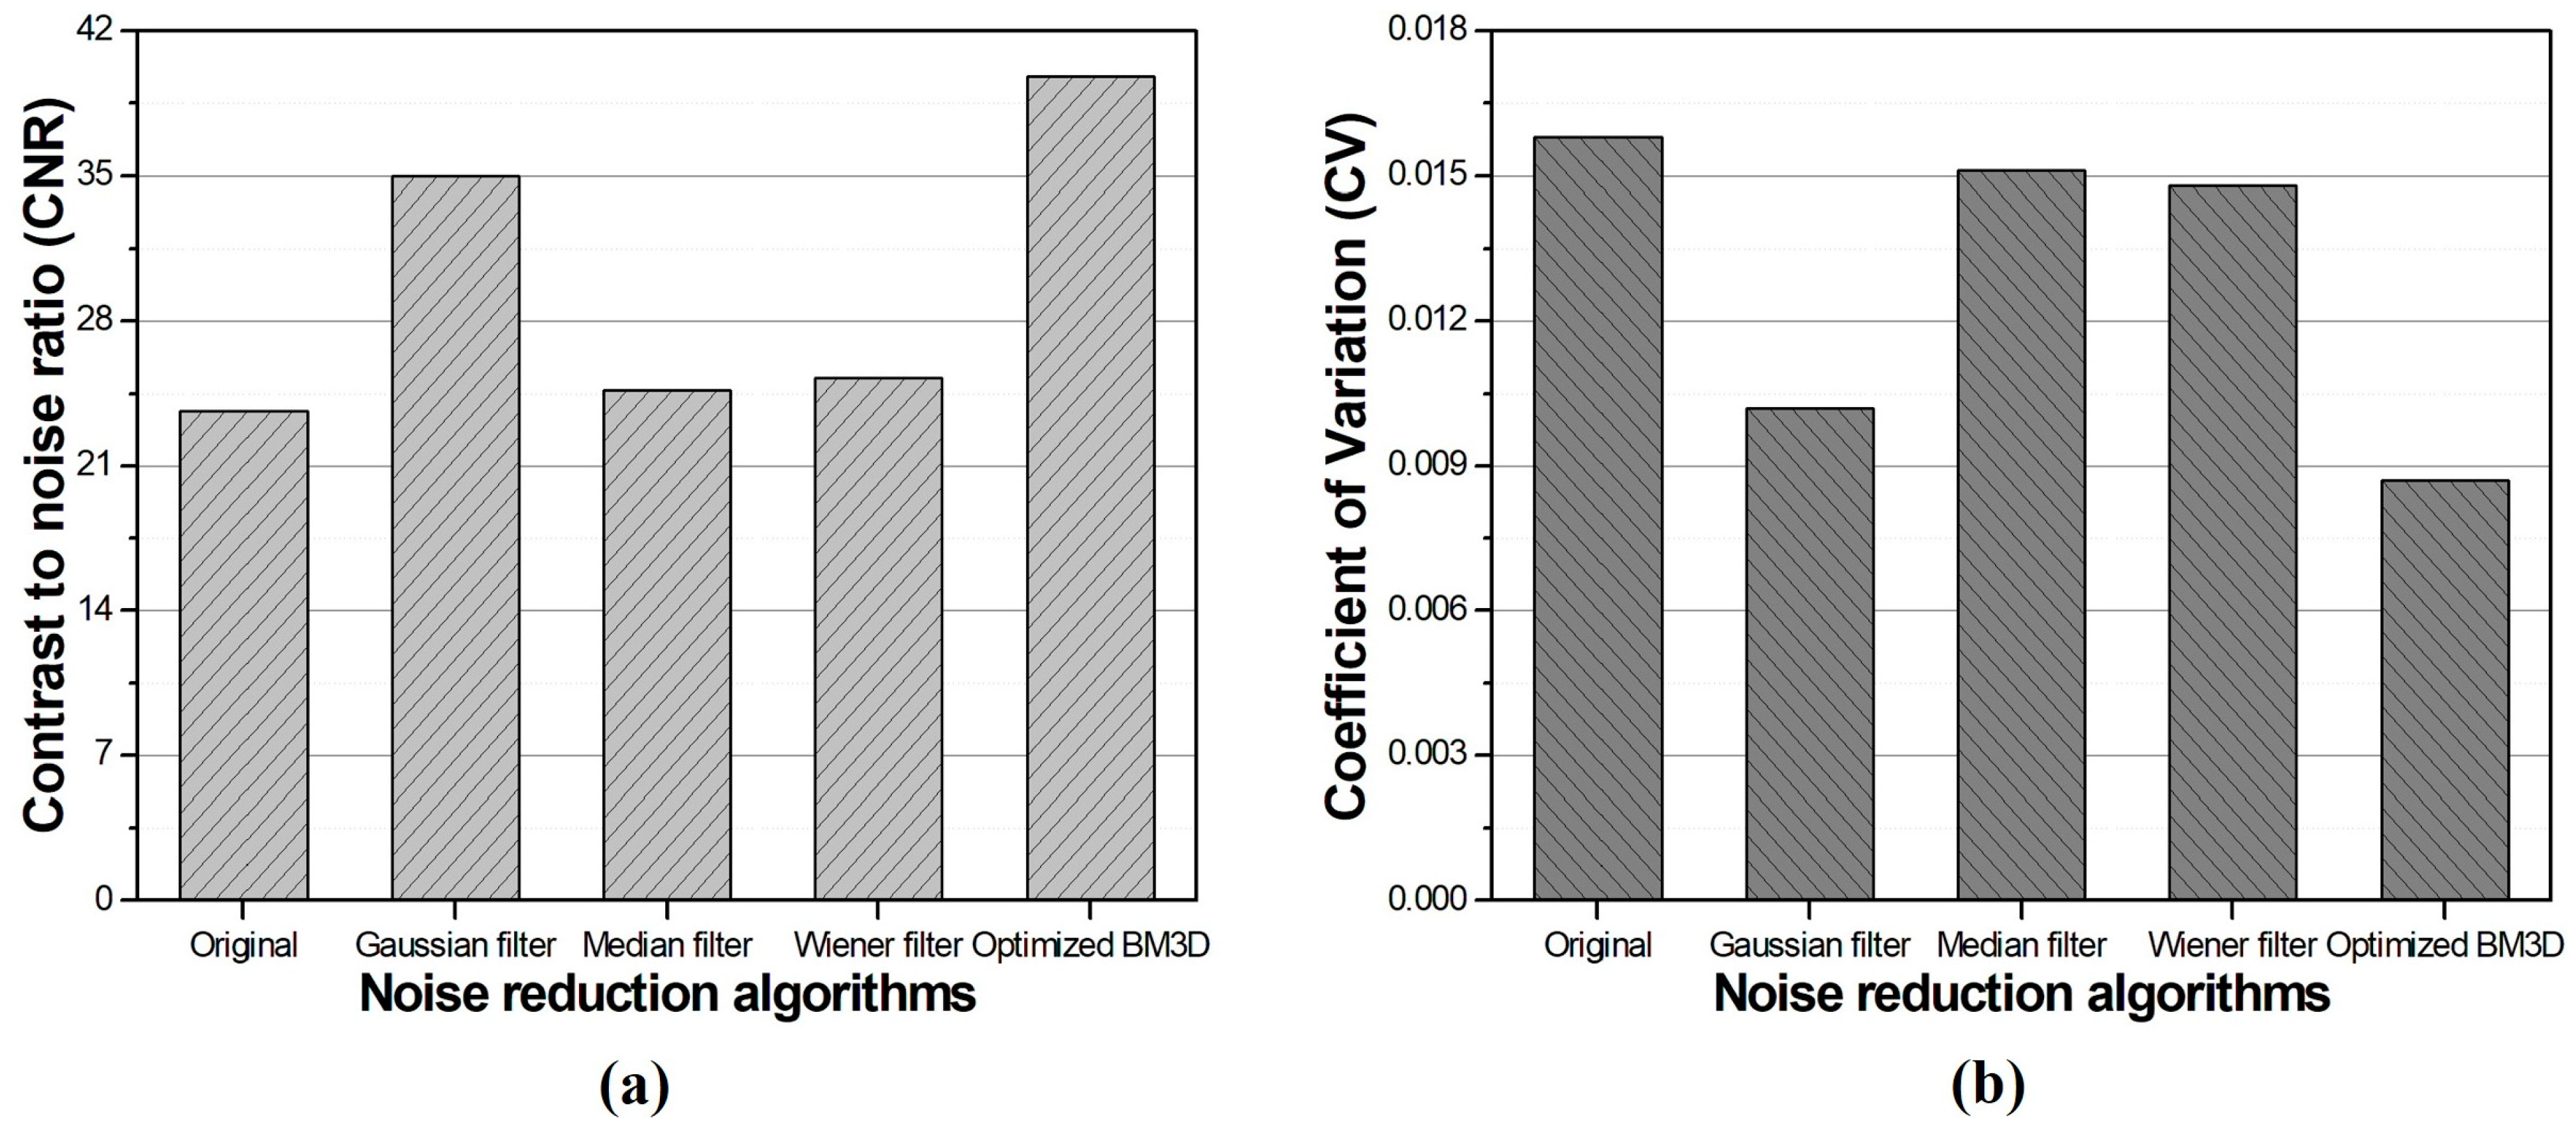
In order to derive the noise reduction effect with the most reasonable image characteristics, the σ-value of the BM3D algorithm was increased in the interval of 0.01 to 0.99 and applied to the simulated brain T2WI with three noise intensities of 0.05, 0.10, and 0.15 set. Among the images to which the BM3D algorithm was applied, σ-values of 0.01, 0.05, 0.10, 0.15, 0.20, 0.50, and 0.99 were set to extract the results to analyze the change in image quality from the image with 0.05 Rician noise added, as shown in Figure 4.
Consequently, we confirmed that as the σ -value increased, the noise of the image decreased. Specifically, it was observed that blurring was also intensified at values of 0.20 or higher. Figure 5 shows the results of the CNR and CV measurements of the images obtained through the σ-value optimization experiment. When the σ-values were 0.08, 0.13, and 0.16 according to the noise intensity, which is shown by the values blue circled in Figure 5 and Figure 6, the CNR was measured as approximately 190.03, 142.49, and 95.65 for each noise intensity, respectively. In addition, the calculated CV values were 0.0058, 0.0079, and 0.0095, respectively.
Additionally, the SSIM and RMSE were measured to quantitatively determine the difference between the reference and resulting images of optimizing the σ-value of the BM3D algorithm. As shown in Figure 6, when the σ -values for each noise intensity were 0.08, 0.13, and 0.16, the SSIM values were approximately 0.6989, 0.6621, and 0.6287, respectively. The RMSE values were calculated to be approximately 0.1513, 0.1670, and 1931 for the same σ-values, respectively. We estimated the optimized σ-value as 0.12 based on the average value derived from the quantitative evaluation results of the simulation.
Subsequently, a comparison was conducted between the BM3D algorithm with the σ-value of 0.12, the optimization value derived from the simulation study, and the conventional noise reduction algorithm. The application results of each algorithm were evaluated by calculating quantitative evaluation factors. Figure 7 shows the results of applying the Gaussian, median, Wiener filters, and optimized BM3D algorithms to the image with 0.05 Rician noise added.
From the CNR and CV measurements used to observe the change in the noise intensity, a significant improvement was confirmed in the optimized the BM3D algorithm, as shown in Figure 8. In addition, the similarity with the reference image was the highest when the optimized BM3D algorithm was applied, as shown in Table 1 and Figure 9.

3.2. Clinical Study

For the optimization of the σ-value confirmed in the simulation study, it was applied to the brain T2WI obtained from the ADNI dataset to examine its applicability to the clinical MR image. In addition, we attempted to prove the superiority of the BM3D algorithm with an optimized σ-value in comparison to conventional noise reduction algorithms. The results of applying the algorithms were quantitatively evaluated by comparing the CNR and CV from the perspective of noise level due to the unavailability of a noise-free reference image in clinical experiments. Figure 10 shows the resulting images for each applied algorithm.
The CNR values were approximately 34.99, 24.65, 25.26, and 39.74 when the Gaussian, median, Wiener filters, and optimized BM3D algorithms were applied, respectively. The calculated CV values were approximately 0.0102, 0.0151, 0.0148, and 0.0086, respectively. Figure 11 shows a graph of the CNR and CV measured from the images obtained using conventional noise reduction algorithms and the optimized BM3D algorithm.

4. Discussion

The importance of noise reduction algorithms for medical imaging is significantly increased. Therefore, the appropriate parameters are considered as a key to acquire reasonable image quality for diagnosis [34,35,36]. The performance of the BM3D algorithm is influenced by various modifier factors; however, among them, σ-value is a factor that determines the degree of smoothing of the signal values and serves as a criterion for discriminating and eliminating noise [22]. In this study, we aimed to determine the optimal σ-value of the BM3D algorithm by adjusting the σ-value from 0.01 to 0.99 and applying it to simulated and clinical MR images, thereby attempting to identify the σ-value that could yield the optimal image characteristics.
The results of applying the BM3D algorithm to the simulated brain T2WI acquired using the BrainWeb simulation program were evaluated using quantitative evaluation factors of CNR, CV, SSIM, and RMSE. Quantitative evaluation demonstrated that when the three intensities of Rician noise of 0.05, 0.10, and 0.15 were added, the CNR initially exhibited a sharp increase with an increase in the σ-values up to 0.08, 0.13, and 0.15, respectively. Subsequently, irregular fluctuations without a clear pattern were observed. Similarly, the CV also displayed a rapid decrease until the above-mentioned σ-value, following which it exhibited a minimal difference.
Overall, we confirmed that the CNR and CV increased and decreased exponentially up to a certain σ-value for all three noise intensities; however, thereafter, the quantitative evaluation results demonstrated fluctuation patterns that were not consistent. This means that excessive smoothing was achieved by applying a σ-value higher than the noise intensity contained in the image. As a result of the similarity evaluation, both SSIM and RMSE rapidly increased until a certain σ-value and then decreased. The σ-values that exhibited these trends were found to be 0.08, 0.13, and 0.16 for images with Rician noise intensities of 0.05, 0.10, and 0.15, respectively. These values were aligned with the σ-values that showed optimal image characteristics in the assessment of noise-level variations.
The images acquired using the BrainWeb simulation program and the T2WI from the ADNI dataset are obtained using different methods. In particular, the T2WIs from the ADNI dataset are actual clinical images with unknown noise distribution. Despite this, the reason why the optimized sigma value derived from the simulation study could be applied is that the additional noise introduced during the simulation study was modeled as Rician noise, considering that MR signals exhibit a complex form. Rician noise distribution is similar to the noise encountered in clinical settings; there are practical limitations in measuring and applying the noise distribution of each acquired image. Therefore, the final optimized sigma value of 0.12 was derived as the average of the sigma values that demonstrated excellent quantitative evaluation results at various levels of additional noise in the simulation study. As a result, we consider that this optimized sigma value maintains consistency even in a blind state of noise estimation.
Clinical MR images of brain T2WIs were obtained from the ADNI dataset. The BM3D algorithm with a σ-value of 0.12 was obtained from the simulation study and applied to confirm its usability. We attempted to compare and evaluate the performance by applying conventional noise reduction algorithms: Gaussian, median, and Wiener filters. Consequently, the CNR and CV were calculated as 39.74 and 0.0086, respectively, when the optimized BM3D algorithm was applied. In comparison with the original noise-added and conventional noise-reduction algorithms, the optimized BM3D demonstrated substantial improvements in CNR by approximately 1.68, 1.13, 1.61, and 1.57-fold compared with noisy image, Gaussian, median, and Wiener filters, respectively. Additionally, the optimized BM3D demonstrated the best performance in terms of CV, increasing by approximately 1.83, 1.18, 1.75, and 1.72-fold, respectively. Through a comprehensive evaluation of the simulation and clinical study results, it was demonstrated that the BM3D algorithm with the optimized σ-value had superior performance compared to that of the conventional noise reduction algorithms used in this study. However, our results were conducted by applying a commonly available σ-value at different noise levels through simulation studies. Thus, the optimized σ-value may not show “perfect” performance under all equipment and shooting conditions.
Additionally, MRI requires an expeditious image-processing technique. In this study, the time required for image processing using the BM3D algorithm was measured as follows: first, in optimizing the BM3D algorithm using simulated brain T2Wis, it took approximately 0.11 sec per image for a matrix size of 217 × 181. In comparison, for clinical MR images with a matrix size of 256 × 256, it took approximately 0.86 s.
The BM3D algorithm has a relatively fast processing speed, but they actually have a considerable amount of processing time compared to that of conventional noise reduction algorithms because the BM3D algorithm does not perform image processing by simple calculations. This process involves converting 2D patches into 3D blocks; the signal in the spatial domain is converted to the frequency domain, and noise reduction is performed twice through hard thresholding and Wiener filtering. The proposed model used in this study achieved significant noise reduction performance compared to conventional noise reduction algorithms based on quantitative evaluation. However, improvement is necessary to shorten the time required for using the BM3D algorithm. Therefore, we plan to compensate for the processing time by adopting machine learning techniques that can simplify the image processing step while preserving the noise reduction performance along with the optimization of the BM3D algorithm in further study.
Brain MR images and numerous cognitive ability indicators are used to diagnose Alzheimer’s disease (AD) [37,38]. In particular, the expansion of the ventricles, which is considered important for visually evaluating the progress of AD, can be observed in brain MR images. No prominent difference was found between conventional noise reduction algorithms in clinical studies, while the quantitative image quality of the optimized BM3D algorithm was observed to be the most superior among all. In future studies, to secure reliability for versatility, we plan on applying the BM3D algorithm with optimized σ -values to clinical MR images acquired using various pulse sequences, such as echo planar imaging, to evaluate the algorithm’s performance across different sequences and establish its effectiveness in noise reduction and image quality improvement in diverse clinical scenarios.

5. Conclusions

In this study, we aimed to optimize the σ-value of the BM3D algorithm to achieve efficient noise reduction. For this purpose, we obtained brain T2WIs acquired using the BrainWeb simulation program and clinical MR images from the ADNI dataset. Rician noise with intensities of 0.05, 0.10, and 0.15 was added to these images, and the σ-values of the BM3D algorithm were incrementally increased from 0.01 to 0.99 with a step size of 0.01. Furthermore, in the simulation study of the optimized BM3D algorithm, we observed that sigma values of 0.08, 0.13, and 0.15 demonstrated the most improved image characteristics for each noise level. The optimal σ-value was derived from the average of these values.
Additionally, to verify its performance on actual clinical images, we applied the optimized BM3D algorithm to brain T2WIs obtained from the ADNI dataset. The results demonstrated a trend similar to the simulation findings, and the optimized BM3D algorithm exhibited superior similarity to the conventional noise reduction algorithms.
In conclusion, applying the BM3D algorithm with a σ-value of 0.12 to brain T2WIs can provide excellent noise reduction effects, despite the relatively longer processing time compared to that of conventional noise reduction algorithms. The purpose of medical image processing is to acquire clear medical images with noise excluded, enabling accurate and rapid diagnosis. The results of this study demonstrate that the optimized sigma value derived from the BM3D algorithm effectively suppresses excessive smoothing, allowing for efficient noise reduction. It is inferred that this approach can be effectively applied in practical clinical settings.

Author Contributions

Conceptualization, M.P. and Y.L.; Methodology, S.-H.K. and K.K.; Software, M.P. and S.-H.K.; Validation, Y.L.; Formal analysis, M.P. and Y.L.; Investigation, M.P., S.-H.K., K.K. and Y.L.; Data curation, M.P. and K.K.; Writing—original draft preparation, M.P. and S.-H.K.; Writing—review and editing, K.K. and Y.L.; Project administration, Y.L. All authors have read and agreed to the published version of the manuscript.

Funding

This research received no funding.

Institutional Review Board Statement

The study was conducted according to the guidelines of the Declaration of Helsinki and approved by the Institutional Review Board of Gachon University (1044396-202303-HR-031-01).

Informed Consent Statement

A benchmark dataset, the Alzheimer’s Disease Neuroimaging Initiative (ADNI), which was used in our work, obtained informed consent from the participants. More information can be found in the following link: “http://adni.loni.usc.edu/study-design/(accessed on 29 June 2023)”.

Data Availability Statement

Data used in the preparation of this article were obtained from the ADNI database (adni.loni.usc.edu). The ADNI was launched in 2003 as a public–private partnership led by Principal Investigator Michael W. Weiner, MD. The primary goal of the ADNI has been to test whether serial magnetic resonance imaging (MRI), positron emission tomography (PET), other biological markers, and clinical and neuropsychological assessments can be combined to measure the progression of mild cognitive impairment (MCI) and early Alzheimer’s disease (AD). For up-to-date information, see www.adni.loni.info.org.

Acknowledgments

Data collection and sharing for this project was funded by the Alzheimer’s Disease Neuroimaging Initiative (ADNI) (National Institutes of Health Grant U01 AG024904) and DOD ADNI (Department of Defense award number W81XWH-12-2-0012). ADNI is funded by the National Institute on Aging, the National Institute of Biomedical Imaging and Bioengineering, and through generous contributions from the following: AbbVie, Alzheimer’s Association; Alzheimer’s Drug Discovery Foundation; Araclon Biotech; BioClinica, Inc.; Biogen; Bristol-Myers Squibb Company; CereSpir, Inc.; Cogstate; Eisai Inc.; Elan Pharmaceuticals, Inc.; Eli Lilly and Company; EuroImmun; F. Hoffmann-La Roche Ltd. and its affiliated company Genentech, Inc.; Fujirebio; GE Healthcare; IXICO Ltd.;Janssen Alzheimer Immunotherapy Research & Development, LLC.; Johnson & Johnson Pharmaceutical Research & Development LLC.; Lumosity; Lundbeck; Merck & Co., Inc.; Meso Scale Diagnostics, LLC.; NeuroRx Research; Neurotrack Technologies; Novartis Pharmaceuticals Corporation; Pfizer Inc.; Piramal Imaging; Servier; Takeda Pharmaceutical Company; and Transition Therapeutics. The Canadian Institutes of Health Research is providing funds to support ADNI clinical sites in Canada. Private sector contributions are facilitated by the Foundation for the National Institutes of Health (www.fnih.org). The grantee organization is the Northern California Institute for Research and Education, and the study is coordinated by the Alzheimer’s Therapeutic Research Institute at the University of Southern California. ADNI data are disseminated by the Laboratory for Neuro Imaging at the University of Southern California.

Conflicts of Interest

The authors declare no conflict of interest.

References

  1. Jahangirimehr, A.; Honarmandpour, A.; Khalighi, A.; Najafi, M.; Kalantar, M.; Shahvali, E.A.; Hemmatipour, A.; Heydarheydari, S. Prognostic Factors for Predicting COVID-19 Severity and Mortality. Shariz E-Med. J. 2023, 24, e129546. [Google Scholar] [CrossRef]
  2. Salmanpour, M.; Rezaeijio, S.M.; Hosseinzadeh, M.; Rahmim, A. Deep versus Handcrafted Tensor Radiomics Features: Prediction of Survival in Head and Neck Cancer Using Machine Learning and Fusion Techniques. Diagnostics 2023, 13, 1696. [Google Scholar] [CrossRef] [PubMed]
  3. Bruno, F.; Arrigoni, F.; Mariani, S.; Splendiani, A.; Cesare, E.D.; Masciocchi, C.; Barile, A. Advanced magnetic resonance imaging (MRI) of soft tissue tumors: Techniques and applications. La Radiol. Medica 2019, 124, 243–252. [Google Scholar] [CrossRef]
  4. Goodhead, D.T. Initial Events in the Celluar Effects of Ionizing Radiations: Clustered Damage in DNA. Int. J. Radiat. Biol. 1994, 65, 7–17. [Google Scholar] [CrossRef]
  5. Chalian, M.; Li, X.; Guermazi, A.; Obuchowki, N.A.; Carrino, J.A.; Oei, E.H.; Link, T.M. The QIBA Profile for MRI-based Compositional Imaging of Knee Cartilage. Radiology 2021, 301, 423–432. [Google Scholar] [CrossRef] [PubMed]
  6. Nawaz, M.; Nazir, T.; Masood, M.; Mehmood, A.; Mahum, R.; Khan, M.A.; Kadry, S.; Thinnukool, O. Analysis of Brain MRI Images Using Improved CornerNet Approach. Diagnostics 2021, 11, 1856. [Google Scholar] [CrossRef]
  7. Sowa, P.; Rutkowska-Talipska, J.; Sulkowska, U.; Rutkowski, K.; Rutkowski, R. Ionizing and non-ionizing electromagnetic radiation in modern medicine. Pol. Ann. Med. 2012, 19, 134–138. [Google Scholar] [CrossRef]
  8. Ali, H.M. MRI medical image denoising by fundamental filters. High-Resolut. Neuroimaging-Basic Phys. Princ. Clin. Appl. 2018, 14, 111–124. [Google Scholar] [CrossRef] [Green Version]
  9. Bhujle, H.V.; Chaudhuri, S. Laplacian based non-local means denoising of MR images with Rician noise. Magn. Reson. Imaging 2013, 31, 1599–1610. [Google Scholar] [CrossRef]
  10. Sagheer, S.V.M.; George, S.N. A review on medical image denoising algorithms. Biomed. Signal Process. Control 2020, 61, 102036. [Google Scholar] [CrossRef]
  11. Ali, H.M. A new method to remove salt & pepper noise in Magnetic Resonance Images. In Proceedings of the 11th International Conference on Computer Engineering & Systems (ICCES), Cairo, Egypt, 20–21 November 2016; pp. 155–160. [Google Scholar] [CrossRef]
  12. Chen, J.; Wang, Q.; Zhang, H.; Yang, X.; Wang, J.; Berkowitz, B.A.; Wickline, S.A.; Song, S.-K. In vivo quantification of T1, T2 and apparent diffusion coefficient in the mouse retina at 11.74T. Magn. Reson. Med. 2008, 59, 731–738. [Google Scholar] [CrossRef]
  13. Wei, Y.; Zhou, J.; Liu, Y. A review of algorithm & hardware design for AI-based biomedical applications. IEEE Trans. Biomed. Circuits Syst. 2020, 14, 145–463. [Google Scholar]
  14. Patil, R.; Bhosale, S. Medical image denoising techniques: A review. Int. J. Eng. Sci. Technol. 2022, 4, 21–33. [Google Scholar] [CrossRef]
  15. Brownrigg, D.R.K. The weighted median filter. Commun. ACM 1984, 27, 807–818. [Google Scholar] [CrossRef]
  16. Feruglio, P.F.; Vinegoni, C.; Sbarbati, A.; Weissleder, R. Block matching 3D random noise filtering for absoption optical projection tomography. Inst. Phys. Eng. Med. 2010, 55, 5401. [Google Scholar] [CrossRef] [Green Version]
  17. Bojorquez, J.Z.; Bricq, S.; Acquitter, C.; Brunotte, F.; Walker, P.M.; Lalande, A. What are normal relaxation time of tissues at 3T? Magn. Reson. Imaging 2017, 35, 69–80. [Google Scholar] [CrossRef] [PubMed]
  18. Henkelman, R.M.; Stanisz, G.J.; Graham, S.J. Magnetization transfer in MRI: A review. NMR Biomed. 2001, 14, 57–64. [Google Scholar] [CrossRef] [PubMed]
  19. Heo, Y.C.; Kim, K.; Lee, Y. Image Denoising Using Non-Local Means (NLM) Approach in Magnetic Resonance (MR) Imaging: A Systematic Review. Appl. Sci. 2020, 10, 7028. [Google Scholar] [CrossRef]
  20. Dixit, A.; Sharma, P. A Comparative Study of Wavelet Thresholding for Image Denoising. I. J. Image Graph. Signal Process. 2014, 12, 39–46. [Google Scholar] [CrossRef] [Green Version]
  21. Buades, A.; Coll, B.; Morel, J.M. A non-local algorithm for image denoising. In Proceedings of the 2005 IEEE Computer Society Conference on Computer Vision and Pattern Recognition, San Diego, CA, USA, 20–25 June 2005; Volume 2, pp. 60–65. [Google Scholar] [CrossRef]
  22. Dabov, K.; Foi, A.; Katkovnik, V.; Egiazarian, K. Image Denoising by Sparse 3-D Transform-Domain Collaborative Filtering. IEEE Trans. Image Process. 2007, 16, 2080–2095. [Google Scholar] [CrossRef]
  23. Nasor, M.; Obaid, W. Segmentation of osteoscarcoma in MRI images by K-means clustering, Chan-Vese segmentation, and iterative Gaussian filtering. IET Image Process. 2020, 15, 1310–1318. [Google Scholar] [CrossRef]
  24. Verma, K.; Singh, B.K.; Thoke, A.S. An Enhancement in Adaptive Median Filter for Edge Preservation. Procedia Comput. Sci. 2015, 48, 29–36. [Google Scholar] [CrossRef] [Green Version]
  25. Naimi, H.; Adamou-Mitiche, A.B.H.; Mitiche, L. Medical image denoising using dual tree compolex thresholding wavelet transform and Wiener filter. J. King Saud Univ.-Comput. Inf. Sci. 2015, 27, 40–45. [Google Scholar] [CrossRef] [Green Version]
  26. Kwan, R.K.-S.; Evans, A.C.; Pike, G.B. MRI simulation-based evaluation of image-processing and classification methods. IEEE Trans. Med. Imaging 1999, 18, 1085–1097. [Google Scholar] [CrossRef] [PubMed]
  27. Collins, D.L.; Zijdenbos, A.P.; Kollokian, V.; Sled, J.G.; Kabani, N.J.; Holmes, C.J.; Evans, A.C. Design and construction of a realistic digital brain phantom. IEEE Trans. Med. Imaging 1998, 17, 463–468. [Google Scholar] [CrossRef] [PubMed]
  28. Pmilio, C.; Pérez, N.G.; Calandri, I.; Crivelli, L.; Allegri, R.; The ADNI Alzheimer’s Disease Neuroimaging Initiative; Sevlever, G.; Saravia, F. Diabetic patients treated with metformin during early stages of Alzheimer’s disease show a better integral performance: Data from ADNI study. GeroScience 2022, 44, 1791–1805. [Google Scholar] [CrossRef]
  29. Mubeen, A.M.; Asaei, A.; Bachman, A.H.; Sidtis, J.J.; Ardekani, B.A. A six-month longitudinal evaluation significantly improves accuracy of predicting incipient Alzheimer’s disease in mild cognitive impairment. J. Neuroradiol. 2017, 44, 381–387. [Google Scholar] [CrossRef] [PubMed] [Green Version]
  30. Li, X.; Huang, W.; Rooney, W.D. Signal-to-noise ratio, contrast-to-noise ratio and pharmacokinetic modeling considerations in dynamic contrast-enhanced magnetic resonance imaging. Magn. Reson. Imaging 2012, 30, 1313–1322. [Google Scholar] [CrossRef] [Green Version]
  31. Sneag, D.B.; Zochowski, K.C.; Tan, E.T.; Queler, S.C.; Burge, A.; Endo, Y.; Lin, B.; Fung, M.; Shin, J. Denoising of diffusion MRI improves peripheral nerve conspicuity and reproducibility. J. Magn. Reson. Imaging 2019, 51, 1128–1137. [Google Scholar] [CrossRef]
  32. Saladi, S.; Prabha, N.A. Analysis of denoising filters on MRI brain images. Int. J. Imaging Syst. Technol. 2017, 27, 201–208. [Google Scholar] [CrossRef]
  33. Yousefi, M.N.; Tabatabaeefar, M.; Mostaar, A. Biomedical Image Denoising Based on Hybrid Optimization Algorithm and Sequential Filters. J. Biomed. Phys. Eng. 2020, 10, 83. [Google Scholar] [CrossRef] [Green Version]
  34. Anand, C.S.; Sahambi, J.S. Wavelet domain non-linear filtering for MRI denoising. Magn. Reson. Imaging 2010, 28, 842–861. [Google Scholar] [CrossRef]
  35. Bhadauria, H.S.; Dewal, M.L. Medical image denoising using adaptive fusion of curvelet transform and total variation. Comput. Electr. Eng. 2013, 39, 1451–1460. [Google Scholar] [CrossRef]
  36. Goyal, B.; Gupta, A.; Dogra, A.; Koundal, D. An adaptive bitonic filtering based edge fusion algorithm for Gaussian denoising. Int. J. Cogn. Comput. Eng. 2022, 3, 90–97. [Google Scholar] [CrossRef]
  37. Xie, L.; Das, S.R.; Wisse, L.E.M.; Ittyerah, R.; de Flores, R.; Shaw, L.M.; Yushkevich, P.A.; Wolk, D.A. For the Alzheimer’s Disease Neuroimaging Initiative. Alzheimer’s Res. Ther. 2023, 15, 1–14. [Google Scholar] [CrossRef]
  38. Bartlett, E.; DeLorenzo, C.; Parsey, R.; Huang, C. Noise contamination from PET blood sampling pump: Effects on structural MRI image quality in simultaneous PET/MR studies. Med. Phys. 2018, 45, 678–686. [Google Scholar] [CrossRef]
Figure 1. The flowchart illustrating the principle of the noise reduction process of the block matching and 3D filtering algorithm.
Applsci 13 08803 g001
Figure 2. (a) The obtained simulated brain T2-weighted image and the noisy images with intensities of (b) 0.05, (c) 0.10, (d) 0.15 of Rician noise.
Applsci 13 08803 g002
Figure 3. The acquired clinical brain T2 weighted image from the Alzheimer’s Disease Neuroimaging Initiative.
Applsci 13 08803 g003
Figure 4. The representative results of applying the BM3D algorithm with a σ-value of (a) 0.01, (b) 0.05, (c) 0.10, (d) 0.15, (e) 0.20, (f) 0.50, and (g) 0.99 in the simulated brain T2-weighted image of noise 0.05 with regions of interest.
Applsci 13 08803 g004
Figure 5. The results of (a) contrast-to-noise ratio and (b) coefficient of variation for a simulated brain T2-weighted image with respect to the σ-value of the BM3D algorithm. The blue circle represents the important value according to σ-value.
Applsci 13 08803 g005
Figure 6. The results of (a) structural similarity index measurement and (b) root mean square error for a simulated brain T2-weighted image in accordance with the σ-value of the BM3D algorithm. The blue circle represents the important value according to σ-value.
Applsci 13 08803 g006
Figure 7. The results of applying (a) Gaussian filter, (b) median filter, (c) Wiener filter, and (d) optimized BM3D algorithm to an image with 0.05 Rician noise.
Applsci 13 08803 g007
Figure 8. The results of (a) contrast-to-noise ratio and (b) coefficient of variation for comparison between conventional noise reduction algorithms and the optimized BM3D in the simulation study.
Applsci 13 08803 g008
Figure 9. The results of (a) structural similarity index measurement and (b) root mean square error for comparison between conventional noise and the optimized BM3D algorithms.
Applsci 13 08803 g009
Figure 10. (a) The original ADNI image with an enlarged region for the observance of changes as algorithms and the resulted images after applying (b) Gaussian filter, (c) median filter, (d) Wiener filter, and (e) the optimized BM3D algorithm.
Applsci 13 08803 g010
Figure 11. The results of the (a) contrast-to-noise ratio and (b) coefficient of variation in the optimized BM3D and conventional noise reduction algorithms.
Applsci 13 08803 g011
Table 1. The results of quantitative evaluation of applying Gaussian filter, median filter, Wiener filter and the optimized BM3D algorithm for each noise level.
Noise Level 0.05Noise LevelSimilarity
CNRCOVSSIMRMSE
Gaussian15.170.29800.38580.1772
Median28.000.04320.65000.1464
Wiener34.020.03520.67480.1494
Optimized BM3D182.990.00610.69740.1499
Noise Level 0.10Noise LevelSimilarity
CNRCOVSSIMRMSE
Gaussian15.420.03070.36610.1931
Median20.390.05700.55400.1649
Wiener20.470.05310.58760.1689
Optimized BM3D142.390.00800.66280.1667
Noise Level 0.15Noise LevelSimilarity
CNRCOVSSIMRMSE
Gaussian15.000.03290.34910.2178
Median10.600.09000.47550.1924
Wiener11.160.08680.50940.1984
Optimized BM3D69.340.01270.62060.1940
Disclaimer/Publisher’s Note: The statements, opinions and data contained in all publications are solely those of the individual author(s) and contributor(s) and not of MDPI and/or the editor(s). MDPI and/or the editor(s) disclaim responsibility for any injury to people or property resulting from any ideas, methods, instructions or products referred to in the content.

