Article

Upstream and Downstream Changes in the Channel Width and Sinuosity Due to Dam Construction in Tropical Rivers: The Case of Colombia

by
Diana C. Alvarado
,
Andrés Vargas-Luna
* and
Juan Diego Giraldo-Osorio
Civil Engineering Department, Engineering School, Pontificia Universidad Javeriana, Cra. 7a # 40-62, Bogotá 110231, Colombia
*
Author to whom correspondence should be addressed.
Appl. Sci. 2023, 13(12), 7109; https://doi.org/10.3390/app13127109
Submission received: 18 April 2023 / Revised: 19 May 2023 / Accepted: 29 May 2023 / Published: 14 June 2023
(This article belongs to the Special Issue Sediment Transport)

Abstract

:
In Colombia, most of the energy is produced by using water resources. However, the morphological impact of damming has not been thoroughly studied yet. Therefore, upstream and downstream changes in the channel width and sinuosity along the river due to the Betania, Prado, Salvajina, and Urrá I Dams, four of the oldest hydroelectric projects, were estimated. These changes were reported by using aerial photographs and satellite images to compare the river before and after dam construction. The analysis was complemented by including hydrological trends and geological characteristics of the areas to evaluate their relevance on the impacts on channel morphology. It was shown that factors such as valley confinement and the bank’s composition are key to determining the magnitude of the impact downstream of the dam. Upstream of the dam, contrastingly, the influence of the reservoir geometry controls the magnitude of the morphological changes, marking the boundaries of affected areas. The impacts of dam construction on river morphology vary notably, but including the geological characteristics of the river reach can be useful to improve predictions of the channel morphology response. The proposed methodology can be used to identify biotic compensation measures for new projects, a task that is not well defined in several countries.

1. Introduction

The construction of dams is an anthropic practice that provides economic benefits for our society but has also caused significant changes to riverine landscapes worldwide. Around 800,000 dams have been built around the world with different objectives: irrigation, flow control, navigation, and hydropower, among others [1]. Inevitably, dam construction and operation have immediate and long-term effects on river morphology [2,3,4] both upstream [5,6] and downstream [7,8] of those structures. Thus, predicting the effects of dams is key to maintaining biodiversity and ecosystem services [9,10].
Upstream of dams, the aggradation processes in the alluvium along reservoir reaches are dominant due to the reduction in flow velocities, responsible for sediment transport, and the backwater effects following impoundment [11,12,13,14,15,16]. Bed aggradation in these regions generates a water level rise, increasing the flood frequency and the vulnerability of the existent infrastructure, imposing an additional risk to human settlements located in the surroundings and considerable challenges for managers [17,18]. Therefore, predicting the extent of the morphological changes in the upstream area of a reservoir can benefit flood risk estimations. Morphological changes upstream of dams are evaluated in varied ways by measuring different morphological parameters. For example, by using aerial photographs, Liro [6] determined changes due to the Czorstyn reservoir at a control distance of 2.2 km, reporting an increase in bar areas and the river channel, and changes in bank erosion due to flooding, highlighting the importance of the material present in the confining valley. Evans et al. [11] also used aerial photographs to define the length of the upstream influence area (4 km) based on increased bar and sand areas. However, no previous studies have considered the importance of geology in upstream areas, except for Escudero et al. [5], who made an approximation at a regional scale. There is also a lack of studies dealing with the changes in the channel width in these areas.
The downstream morphological long-term changes depend on site-specific drivers, such as the altered flow and sediment regimes, and geological controls [19]. Clear water released from reservoirs is expected to increase bed degradation and erosion rates in the downstream reaches [20,21]. Nevertheless, this trend is not universal and varies with the distance from the dam [22], ranging from tens to hundreds of kilometers [23,24]. This variation may be dominated by the lithological and structural controls of the downstream valley that determine channel geometry [25] and the interaction between the main channel and its floodplains [26]. Including the surface geological settings in morphological analyses may contribute to developing more effective methods to predict such changes, but this practice has not yet been addressed.
Upstream and downstream morphological evolution is commonly expressed with changes in variables such as the channel width, water depth, slope, and sediment characteristics through time. Moreover, a few studies have shown that damming can even alter bar patterns [27] and river planforms [28]. With a few studies carried out in the tropics, the morphological changes reported in the literature are mainly collected from temperate and Mediterranean environments. The impacts due to dam construction and operation in tropical rivers may have different magnitudes than those observed in other regions because of the differences observed in [29]: (1) the degree of discharge alteration, (2) sediment loads and dynamics, and (3) the nature and pace of post-disturbance adjustments. Considering the ecological value of tropical systems, it is important to perform studies in these regions to assess similitudes and differences in the morphological response. Morphological effects due to dam construction are commonly reported based on hydrological series of discharges and sediment loads, and historical bathymetries at limited gauging stations [7,23,24,28,30,31,32]. Recent advances in geographic information systems (GIS) have resulted in a wider use of GIS tools for estimating morphological changes in rivers due to damming [4,11,33]. However, these applications have also been focused on specific areas without considering the analysis of geological records. In this paper, GIS tools are used to analyze post-dam trends and to quantify the evolution of the channel width and sinuosity over time by correlating the magnitude of those changes with the hydrological and geological settings of each river reach.
The river width is adopted in this research as the reference parameter to establish the magnitude of the morphological changes, considering its key relevance in channel geometry and the river character [34,35,36,37]. In addition to the channel width, sinuosity is also included in this work to consider possible planform changes. The channel width and sinuosity are obtained using all the information available for the study sites, including their planform from remote sensing (satellite images, aerial photographs), hydrology (gauging stations), and geology. The geology was analyzed from a regional to a local scale, considering confinement, composition (formations), and erodibility of the banks to understand the magnitude of the morphological changes that each river reach experiences after dam construction.
Compensatory mitigation is intended to look for a way to repay the negative effects of development projects [38]. The definition of biodiversity offsets focuses on restoring the altered functions of the intervened ecosystem [39]. This analysis is important to establish the extent of the alteration in the ecosystem, defining a clear application of this work. Considering that our interest is to identify the elements that are relevant to delimiting the expected morphological changes due to dam construction in a simplified manner, other important factors, such as land use changes, are not included.
This paper aims at identifying and discussing the changes in the channel width and sinuosity upstream and downstream of four large dams located in Colombia (South America), considering this region as an appropriate representative of tropical systems. The work also explores the integration of hydrological and geological information in the analysis to establish a way to identify the areas that are more susceptible to those changes. Our results can help in setting the extent of the affectations and the biotic compensation areas due to new projects to be considered in the definition of biodiversity offsets.

2. Materials and Methods

2.1. Study Sites

The selected reservoirs are located in the Colombian Caribbean hydrographic basin, which is irrigated by the main rivers of the country and houses around 85% of its population [40,41]. This study considers dams constructed across three rivers of this hydrographic basin: the Magdalena River, the Cauca River, and the Sinú River. The dams built across the selected rivers are located on the fall line, with an upstream bedrock reach and a downstream alluvial bed. Anthropogenic interventions in these areas have generated severe changes in land use, which have resulted in increased sediment loads [42,43]. However, the morphological impacts of damming in this hydrographic area have not yet been studied in detail; therefore, understanding the morphological trends and the magnitude of their changes due to dam construction is a useful task in the future planning and management of water resources.
Spatial and temporal criteria were considered to define the study sites. The spatial criterion was limited by the fact that in this work, we use free satellite images with a lowest spatial resolution of 30 m; therefore, river reaches upstream and downstream of each dam must have a minimum width of 60 m. Considering the temporal resolution and to be able to identify morphological changes, images before and after the construction of the selected dam are required, with a minimum operating time of 5 years. The dams that satisfy the selection criteria are presented in Table 1 and Figure 1. In the case of Betania and Prado Dams, both structures affect the Magdalena River and are separated by a river reach of, approximately, 178 km (see Table 1).
At the dates of construction of the Prado, Salvajina, and Betania projects (see Table 1), environmental impact studies were not mandatory according to Colombian regulations. Therefore, existing documents [44,45,46] only include technical recommendations, excluding the analysis of ecological and morphological impacts on the intervened river reaches. The Urrá I project was conceived after the installation of environmental law in the country [47]; however, the possible morphological effects due to dam construction were not addressed in its environmental impact study.

2.2. Data

2.2.1. Average Monthly Precipitation Data within the Basins

The precipitation data within the basins were obtained from the total precipitation product of ERA5-Land. ERA5-Land is a reanalysis that provides a consistent evolution of land variables over several decades using a spatial resolution of 10 km. This reanalysis produces data that go back several decades in time, providing an accurate description of the climate of the past [48]. This last feature was particularly useful in our research, since the precipitation station network was limited during the Betania project pre-dam period (1960–1984). Seeking coherence in the analysis, the same product was used for the Salvajina (pre-dam period 1976–1983) and Urrá I (pre-dam period 1991–1998) projects, even though for those dates, the precipitation station network had improved.
Using the monthly total precipitation product from ERA5-Land, the average precipitation for each month was calculated within the basins that supply the reservoirs. So, each basin had a monthly precipitation series between 1950 and 2020. For precipitation change analysis, the pre-dam and post-dam periods were forced to coincide with the selected periods in the discharge stations closest to the dams, since these are assumed to be the stations whose records are more affected (see Section 2.2.2 and Table 2).

2.2.2. Discharge and Sediment Data

River width changes are directly related to the flow regime; the discharge information was provided free of charge by the Instituto de Hidrología, Meteorología y Estudios Ambientales (IDEAM; http://dhime.ideam.gov.co/atencionciudadano/; accessed on 30 April 2023) and the Corporación Autonoma Regional del Valle del Cauca (CVC; https://www.cvc.gov.co/; accessed on 28 February 2023). Gauging stations were chosen for their location in the main channel and recorded time before and after dam construction (see Table 2). In this table, identificatory numbers of each station (ID) are the same as in Figure 1. Gauging stations were only selected downstream of the dams because upstream stations do not have information prior to dam construction.
The hydrological regime in the influence area of each selected dam was analyzed for selecting the images in the summer or with similar summer discharges, avoiding years under the influence of El Niño–Southern Oscillation (ENSO) phenomena extreme phases (El Niño or La Niña years), in which the river can exhibit abrupt width changes. After dam construction and according to the design criteria, the natural discharge regime of a river can be maintained, decreased, or increased throughout the year [49,50,51]. As the spatial information was taken in the summer season, it was necessary to estimate the magnitude of change with statistical tests. We used Student’s t-test [52,53] to evaluate the mean change, and Fisher’s [54] F-test to evaluate the variance change, for the pre- and post-dam periods. Although the literature describes a general tendency due to dam operation (increased discharges during the dry period, medium discharges maintained, and decreased high discharges [51,55,56]), the influence of a dam is also observed in annual values. Therefore, minimum, medium, and maximum annual flow time series were built, and the differences (in percentage) between the pre-dam and post-dam periods for all stations were evaluated. The Kolmogorov–Smirnov [57,58] and Mann–Whitney [59] non-parametric tests were performed to evaluate changes in the distribution before and after dam construction.
In Colombia, only a few gauging stations count with a record of suspended sediment transport. Nevertheless, we also included suspended sediment measurements from available reports and theses in our analysis [60,61,62,63,64]; a summary of the reduction trend in this parameter is shown in Table 3. The gathered data allowed us to establish an approximate distance downstream of the dams at which the suspended sediment load was almost fully recovered.

2.2.3. Remote Sensing Data

To define the morphological changes in the selected river reaches, it is important to gather information before and after dam construction. For this purpose, three different types of spatial information were collected: aerial photographs, spectral images, and radar images. For the dams built between 1972 and 1986 (i.e., Prado, Salvajina, and Betania), the acquisition of aerial photographs supplied by the Instituto Geográfico Agustín Codazzi (IGAC; https://www.igac.gov.co/; accessed on 15 April 2023) was required. A total of 85 aerial photographs were purchased to characterize the pre-dam morphology (see Appendix B). Aerial photographs are acquired following flight lines that coincide with the river alignment, but several flights of the same year or nearly a year (not more than 5 years) may be needed. In the case of the Betania and Prado projects, the predominant spatial information is from 1969 (most photographs), so this year was used as a general reference. For the Salvajina project, a similar behavior was observed for the year 1961.
The satellite images chosen for this study were obtained from (1) Landsat missions provided by the United States Geological Survey (USGS; https://earthexplorer.usgs.gov/; accessed on 30 March 2023), with a spatial resolution of 30 m (Landsat 4–5 TM, between 1982 and 2012; Landsat 7 ETM+, between 1999 and 2003; and Landsat 8, from 2013 to the present), and (2) Aster images provided by the National Aeronautics and Space Administration (NASA; https://earthdata.nasa.gov/; accessed on 30 March 2023), with a spatial resolution between 10 and 30 m, available from 2000 to the present. In areas with high cloudiness, Sentinel 1-GDR radar images from the European Spatial Agency (ESA; https://scihub.copernicus.eu/; accessed on 30 March 2023), with 10 m spatial resolution, were used.
Spatial uncertainty in measurements of the river width depends on adequate delimitation of the water body borders [65]. These uncertainties appear when channels are digitized from aerial photographs and satellite images with vegetation, clouds, and shadows. The images used in this study are of a different type and year; therefore, river alignments may exhibit considerable changes. These errors are, however, not easy to estimate; therefore, only the uncertainty in the spatial resolution of each image and how this affects the river width estimation [66] were considered. Because most images considered in this study were Landsat images with a 30 m pixel size, all spatial information was worked on with this resolution to avoid error propagation. From our selected sites, the Cauca River is most sensitive to this aspect, with a width of 86 m (36% of possible variation), followed by the Sinú River with a width of 112 m (26.7% of possible variation). As the Magdalena River is the widest (channel width from 236 m to 302 m), it exhibits less uncertainty, from 10% to 13%.

2.3. Morphological Parameter Estimation

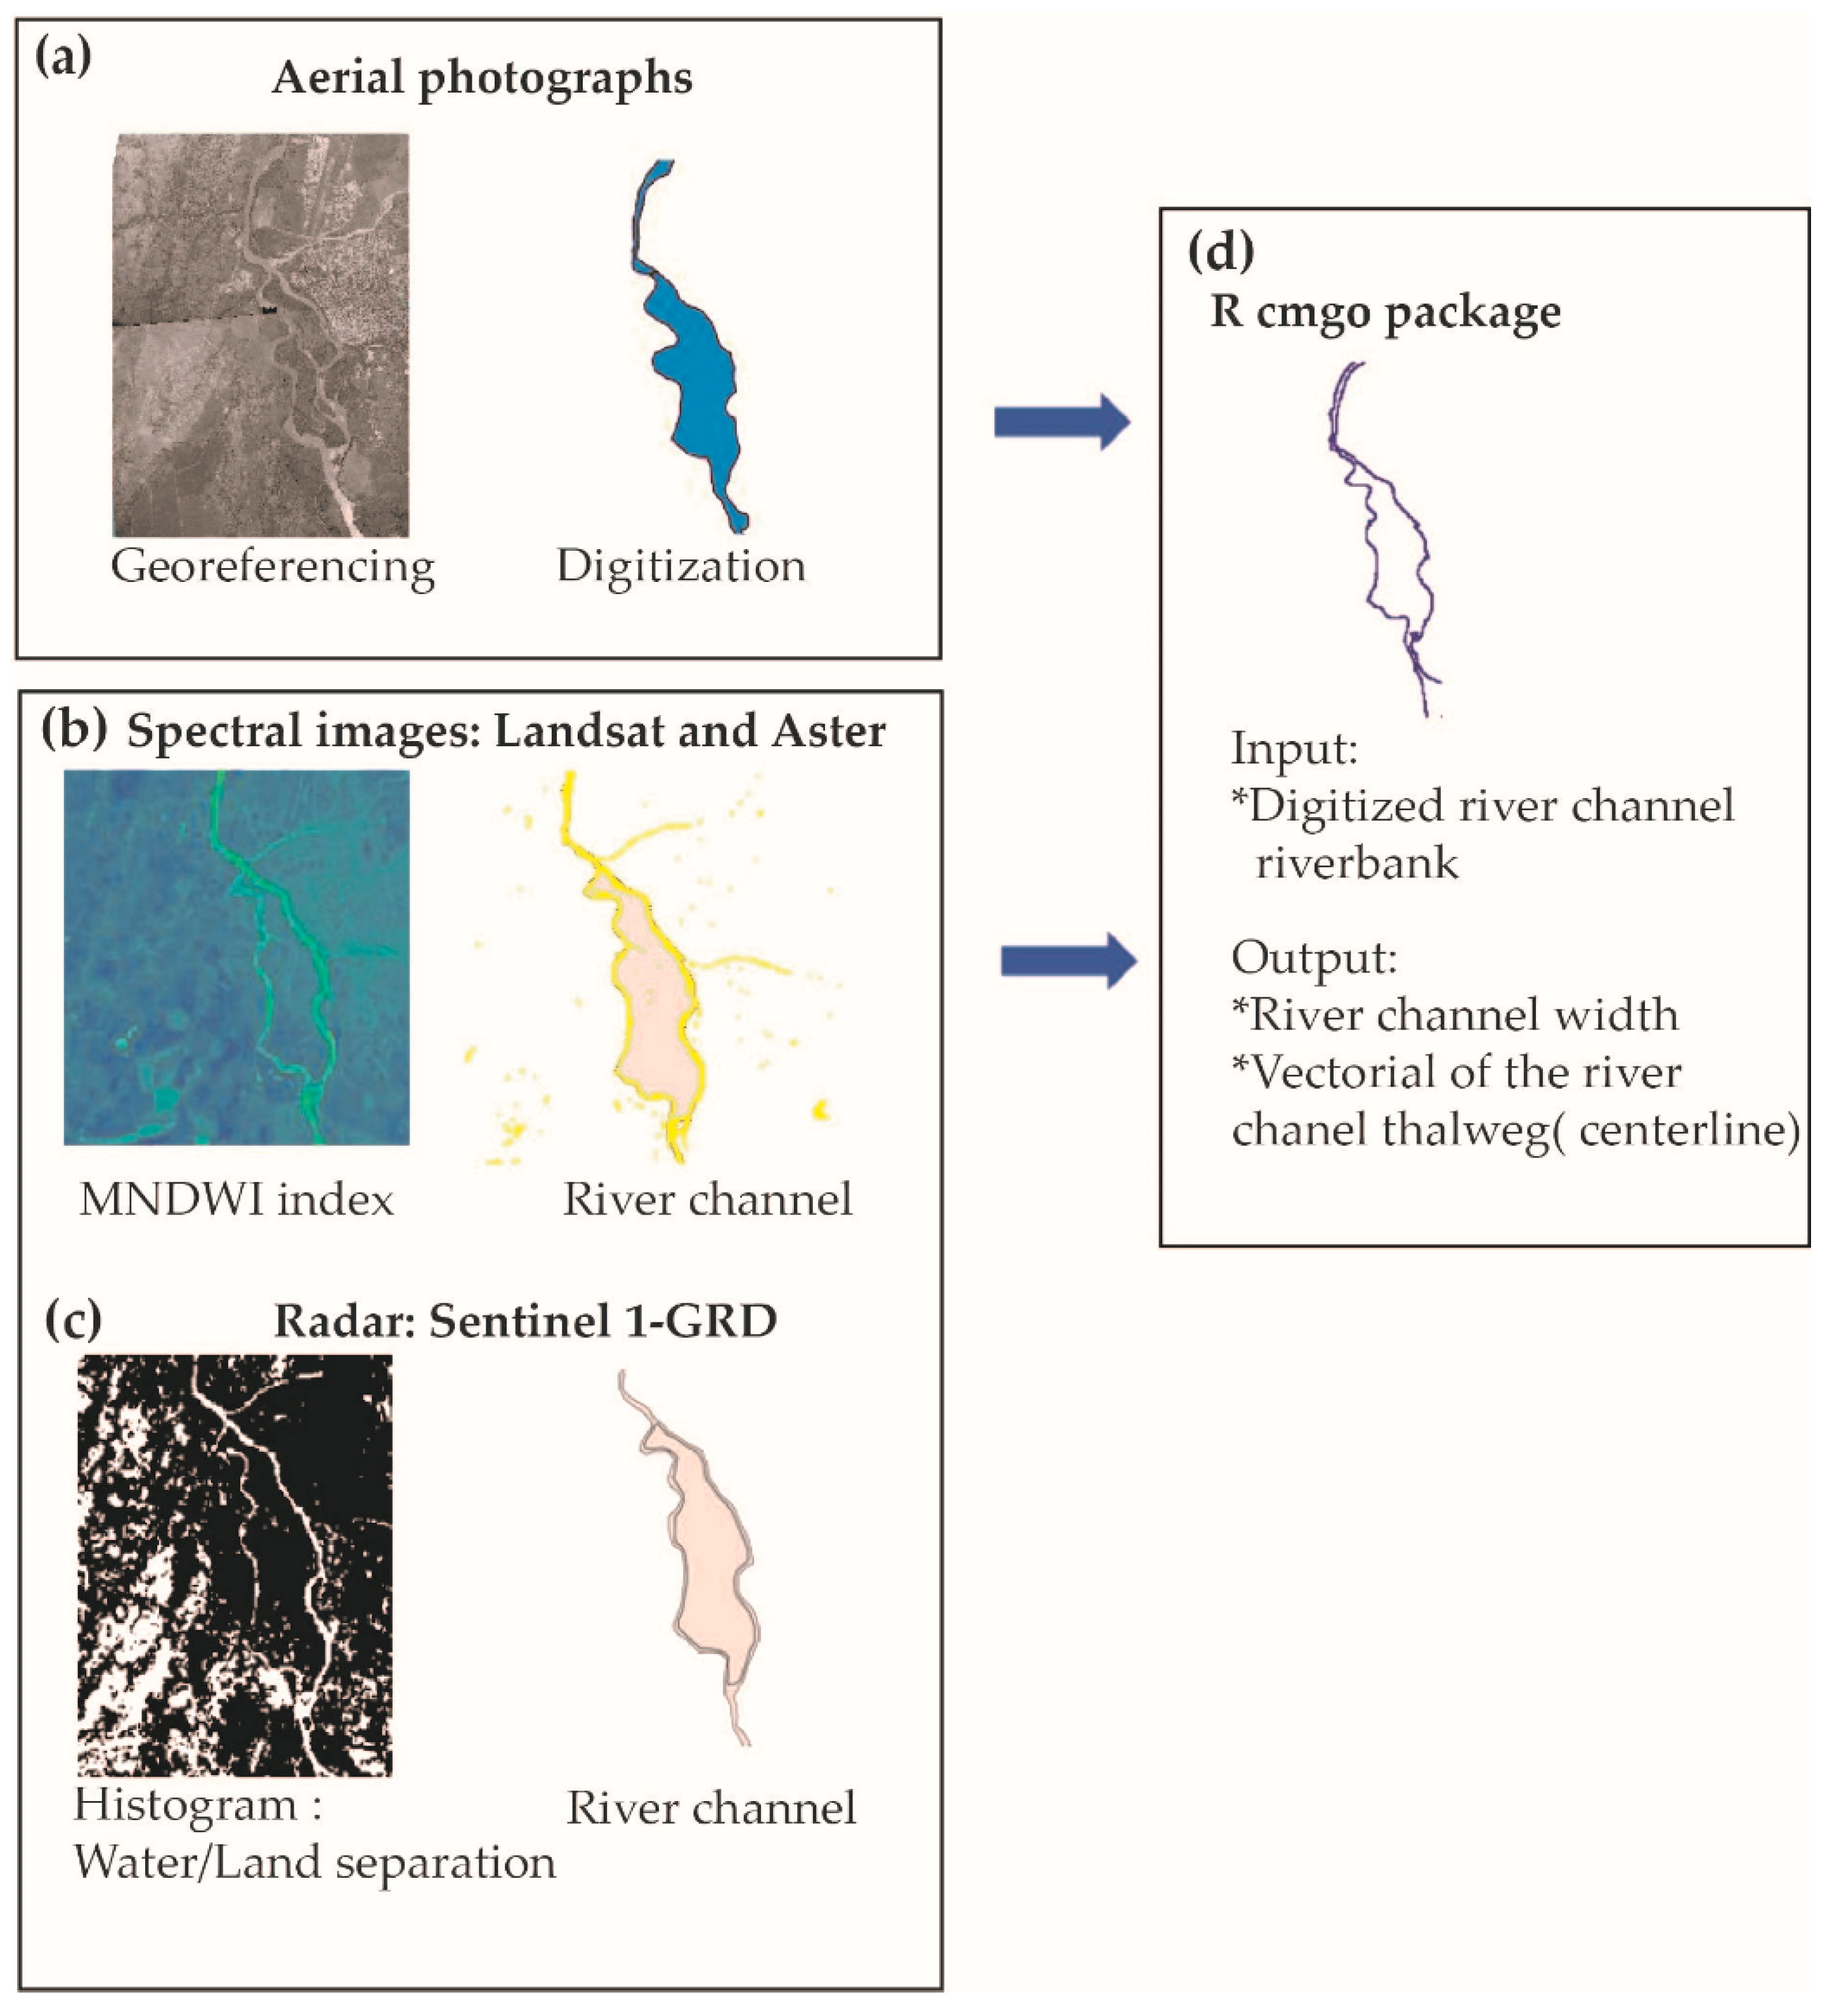
Aerial photographs and satellite images were integrated into GRASS [67] for estimating morphological characteristics. The methodology used in this study for processing the images is presented in Figure 2. The aerial photos were georeferenced and the river channels digitized with a maximum root mean square error (RMSE) of 10 m with the settings of the GRASS GIS (see Figure 2a).
Satellite images with a spectral range were processed to identify the river channel width. Based on their spectral characteristics, different indices have been developed for the extraction of water bodies [68]. Considering the geomorphology of the study areas (i.e., high mountain ranges and piedmont plains), the Modified Normalized Difference Water Index (MNDWI; see Figure 2b) was chosen, defined by:
M N D W I = G R E E N M I R G R E E N + M I R
where the M I R and G R E E N bands must be selected for the different Landsat and Aster images since the band numbers change among missions. All water body extraction methods add additional bodies to the main channel, such as tributaries and effluents, swamps, clouds, and rock bodies, such as outcrops, which need to be removed or cleaned, leaving only one channel. In Colombia, the cloud cover is high, especially in the mountainous areas of all selected dams. Although the extraction of water bodies with the MNDWI, in general, is for values greater than 0 in the cloudy areas, the selection value may vary between −0.2 and 0, so a constant threshold check is necessary for each image.
In the Urrá I project sector, due to its high cloudiness, a Sentinel 1-GRD image was used for 2020 (Figure 2c) and corrected by following the procedures proposed by Filipponi (2019) [69], a methodology available in the free Sentinel Applications Platform (SNAP) tool (https://step.esa.int/main/download/snap-download/; accessed on 30 October 2022). The image was converted from digital pixel values to calibrated SAR backscatter values, which were analyzed with the histogram setting of SNAP, using the low return signal behavior of open water [70], allowing us to differentiate water and land. This information was processed in a similar way to the Landsat and Aster images, only leaving the main channel of the river.
After obtaining the channel using the methods previously described, the morphological parameters were calculated with the R package cmgo (see Figure 2d) [71]. This open-source code package is versatile and easy to use. The package gives channel metrics such as width, sinuosity, and slope. The R package cmgo requires separating the channel banks on the left and right sides, information that is used for calculating the width, centerline, and slope of the channel. Considering the purpose of this study, only the width and centerline were used in the analysis.
The downstream and upstream changes for each dam were measured using sections selected based on the tributaries, the changes in relief, and the river’s slope (verification realized with an SRTM DEM obtained from the United States Geological Service (USGS; https://earthexplorer.usgs.gov/; accessed on 15 October 2022)). The channel width of each section was averaged and compared during the temporal window for each case.

2.4. Geological Information

Considering that one of our hypotheses was that morphological changes are conditioned by the geological characteristics and relief of the river reach, this information was gathered for each study site. The geological information was relevant to define the erodibility of the banks of the analyzed river reaches. This information was obtained from the Servicio Geológico Colombiano (SGC [72]) that allows free access to the Colombian geology through a viewer (http://srvags.sgc.gov.co/JSViewer/Atlas_Geologico_colombiano_2015; accessed on 30 September 2022) and geological reports from different areas (https://recordcenter.sgc.gov.co; accessed on 30 September 2022).
From more resistant (less erodible) to more erodible, the materials can be listed in the following order: metamorphic rocks, igneous rocks and limestone, and sedimentary rocks. Erodibility varies according to grain size and intercalation for the latter, in which the more erodible materials are the unconsolidated ones, such as alluvium, colluvium, and recent-origin fans [73,74]. In this study, only the outcropping chronostratigraphic units (CUs) close to the river were considered, and a detailed description of these units can be found in Appendix A.
To determine the erodibility in the riverbanks of each study reach, we regionally applied the Global Erodibility Index [75], which is based on the subjacent rock type (see Appendix A). This index varies from 1.0 (the hardest rocks) to 3.2 (unconsolidated sediments that do not suffer the effects of pressure and temperature).
Relief changes are reflected in the valley confinement, which is related to the geological and geomorphological environment: high relief areas exhibit high confinement, wide valleys and plains offer low confinement, and the transition zone (between high and low zones) defines the medium confinement regions. The confinement controls the mobility of a river channel, affecting the morphological changes [76]. These transitional changes (from a confined valley to a valley with floodplains) were classified in three confinement degrees: low confinement (where the width of the floodplain or vast valleys is larger than 20 km), medium confinement (with narrow valleys, in which their width varies between 3 and 20 km), and highly confined (extremely narrow valleys with a width less than 3 km).

3. Geological Context of Each Study Site

For each study site, the geology was evaluated upstream and downstream of the dam from a regional to a local scale based on the information available from geological maps, topography, hydrography, and various studies. A geological conceptual map of each study site was produced.

3.1. The Urrá I Project

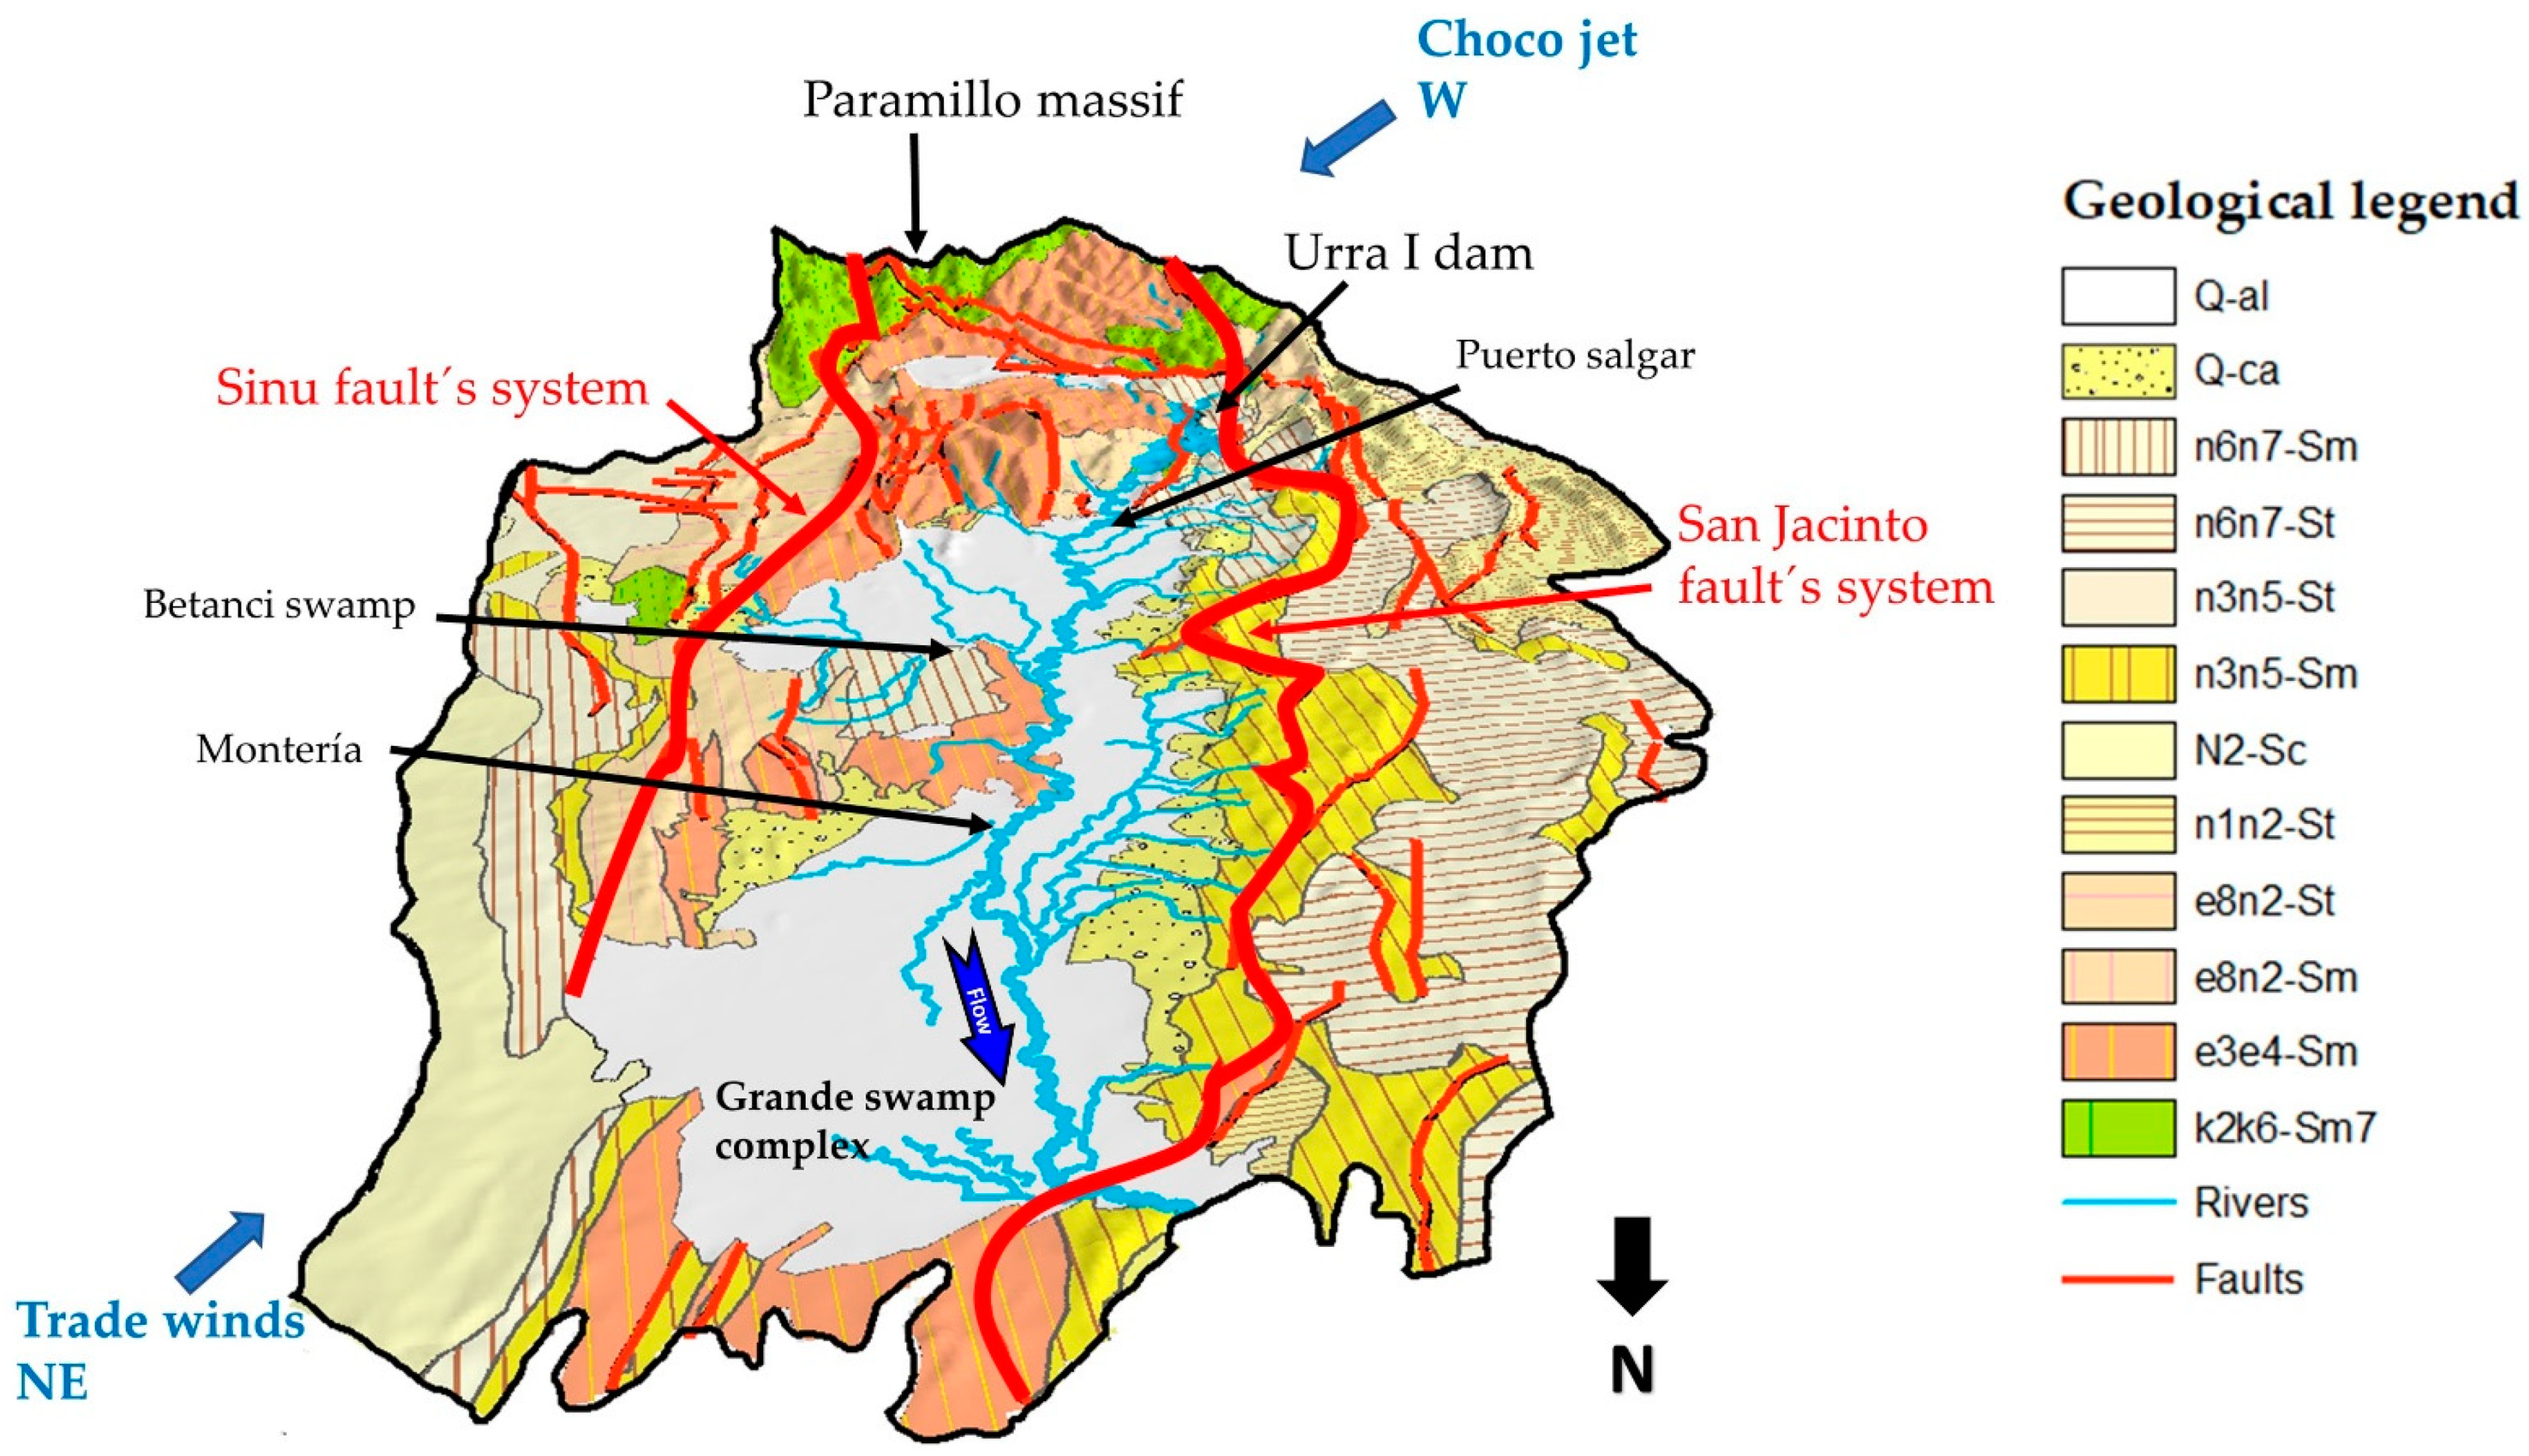
The Sinú River basin is in the Western Andes Mountain Range. The tributaries come from the Paramillo massif (Verde and Sinú Rivers; see Figure 3), feeding the reservoir of the Urrá I Dam. This area has high humidity due to the interaction between the NE trade winds and the Choco jet current from the west, causing high rainfall in the upper area of the Sinú River basin and the nearby regions [77]. The quaternary alluvium (Q-al) is the chronostratigraphic unit (CU) that mainly interacts with the Sinú River in this vast valley, except between 118 km and 156 km, where the e3e4-Sm CU appears [78]. The Betanci swamp and the Grande swamp complex stand out in the basin for their characteristics and water interchange with this river (see Figure 3).

3.2. The Salvajina Project

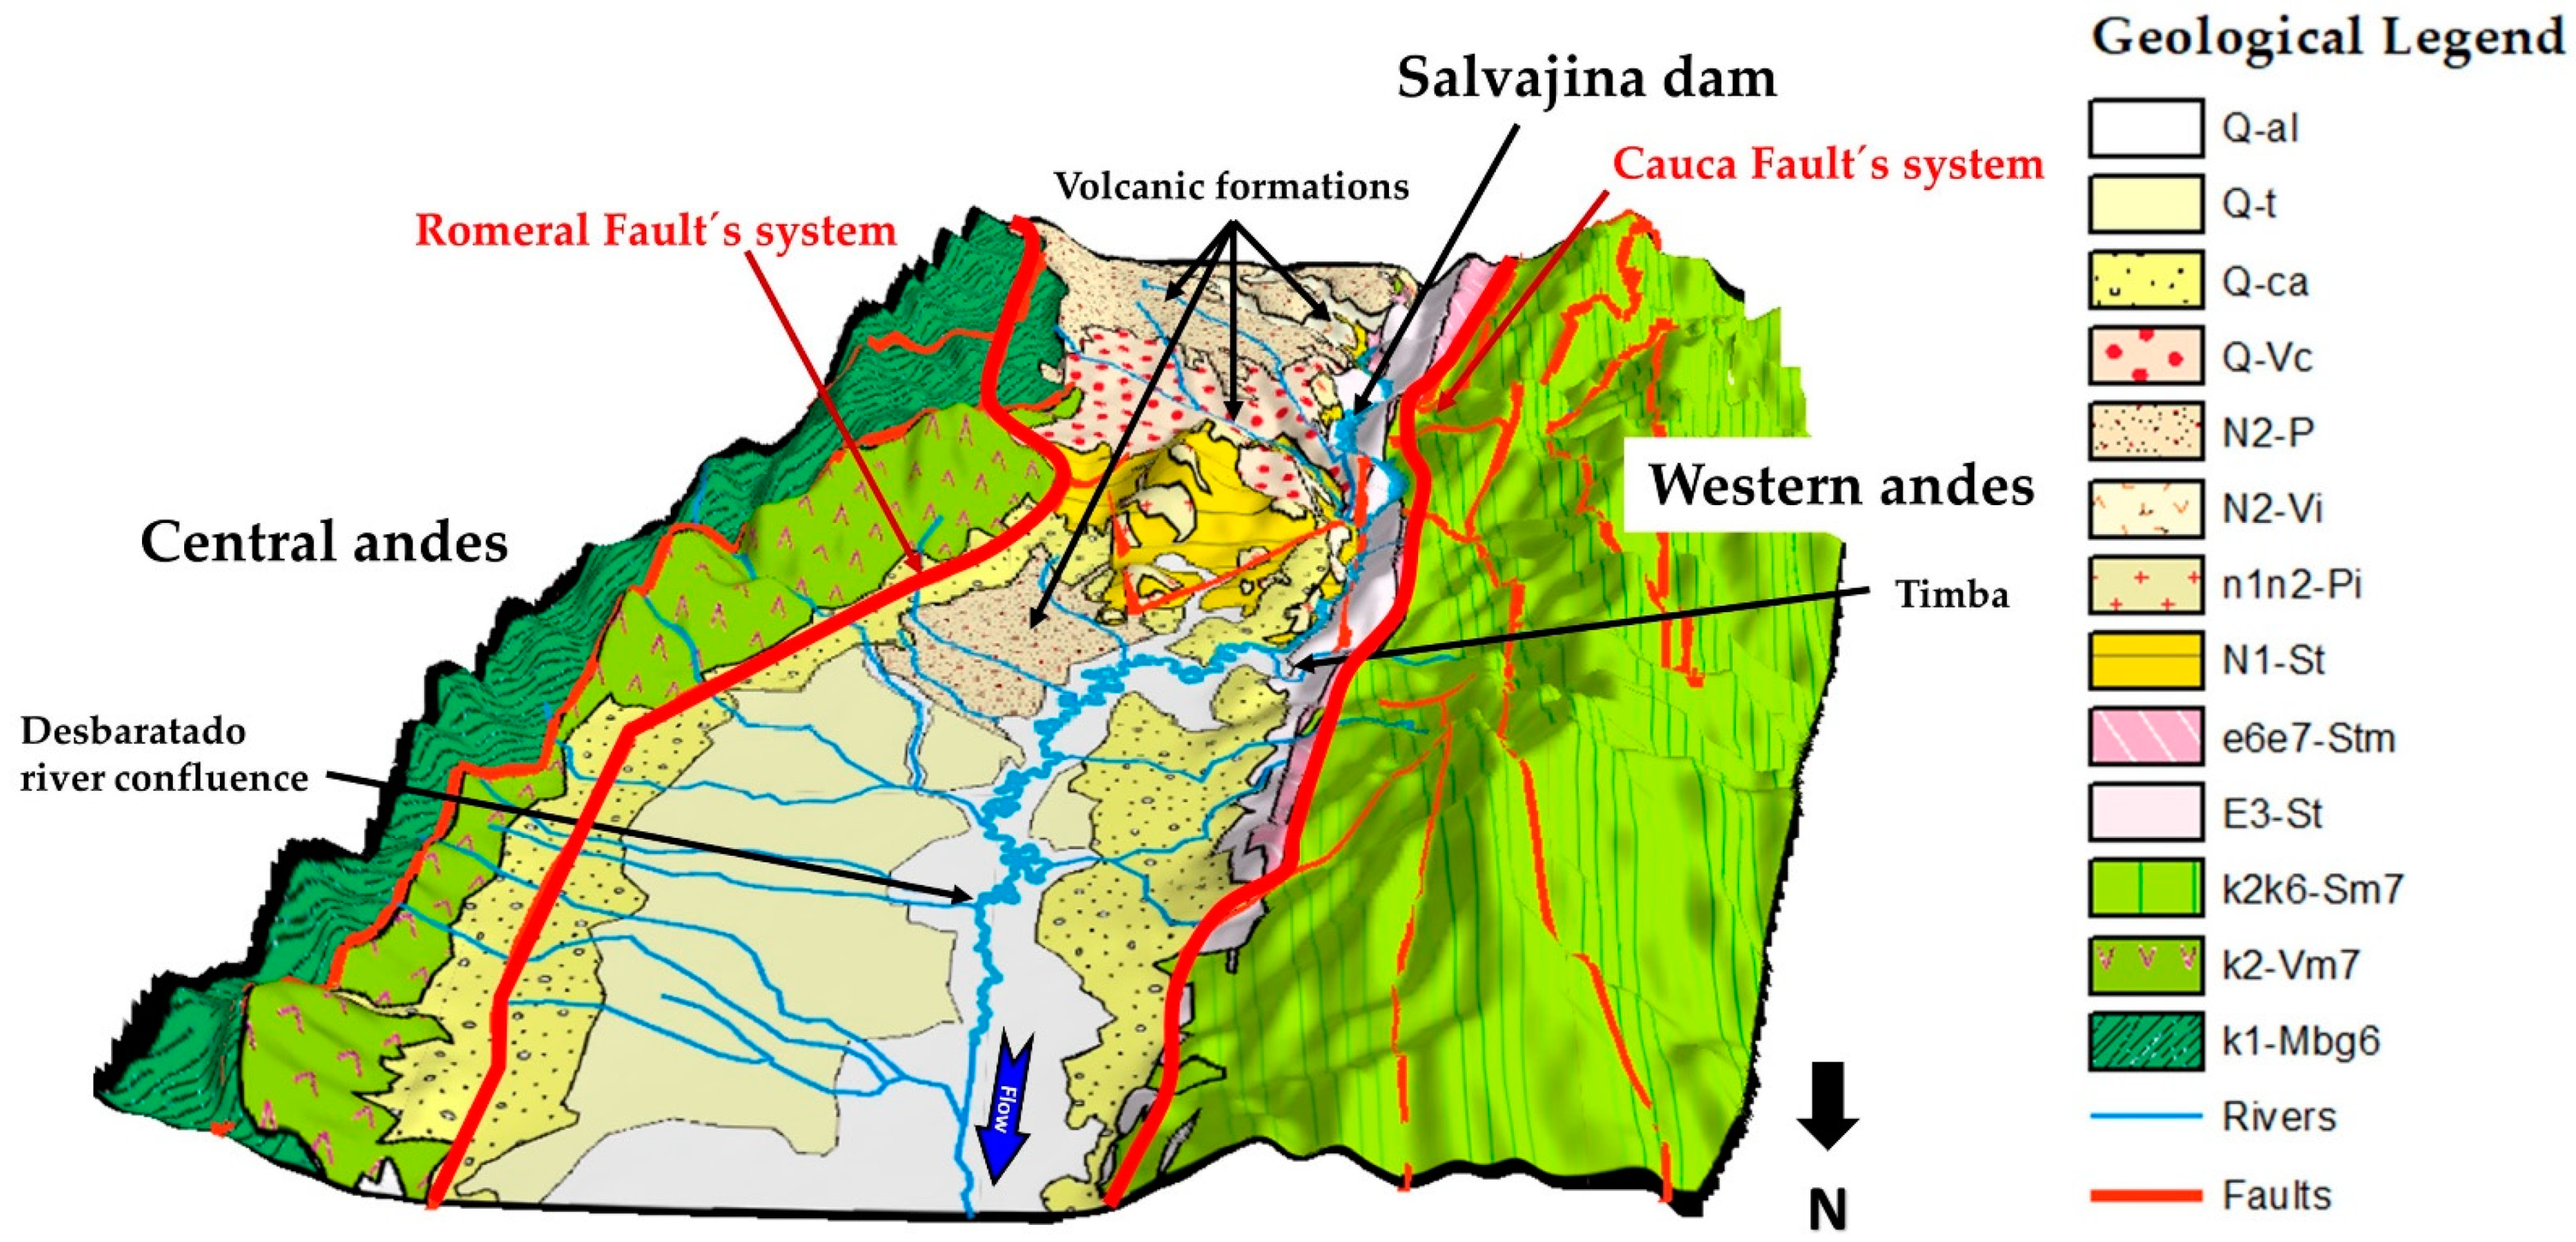
The Cauca River basin is located between the Central and Western Andes Mountain Ranges; its valley is the inter-Andean graben [79] and is limited by the Romeral and Cauca fault systems (see Figure 4). There are volcanic-type formations in the upper part of the basin or high mountain: lavas, tuffs, and basalts [72]. Downstream of the Salvajina Dam, the river goes through a transition from a high mountain to an extensive alluvial valley following a parallel course and close to the Cauca fault system, near the site of Timba.
Between Timba and the confluence of the Desbaratado River, the planform exhibits high sinuosity. From this confluence, the river stops being sinuous when it is near Cali, and the river’s course tends toward the Cauca fault system and the western mountain range. These changes in sinuosity and the river course respond to the underlying geological structure. The river is confined by the terraces (Q-t CU, see Figure 4) coming from the central mountain range (this cordillera is 1400 m higher than the western one).

3.3. The Betania and Prado Projects

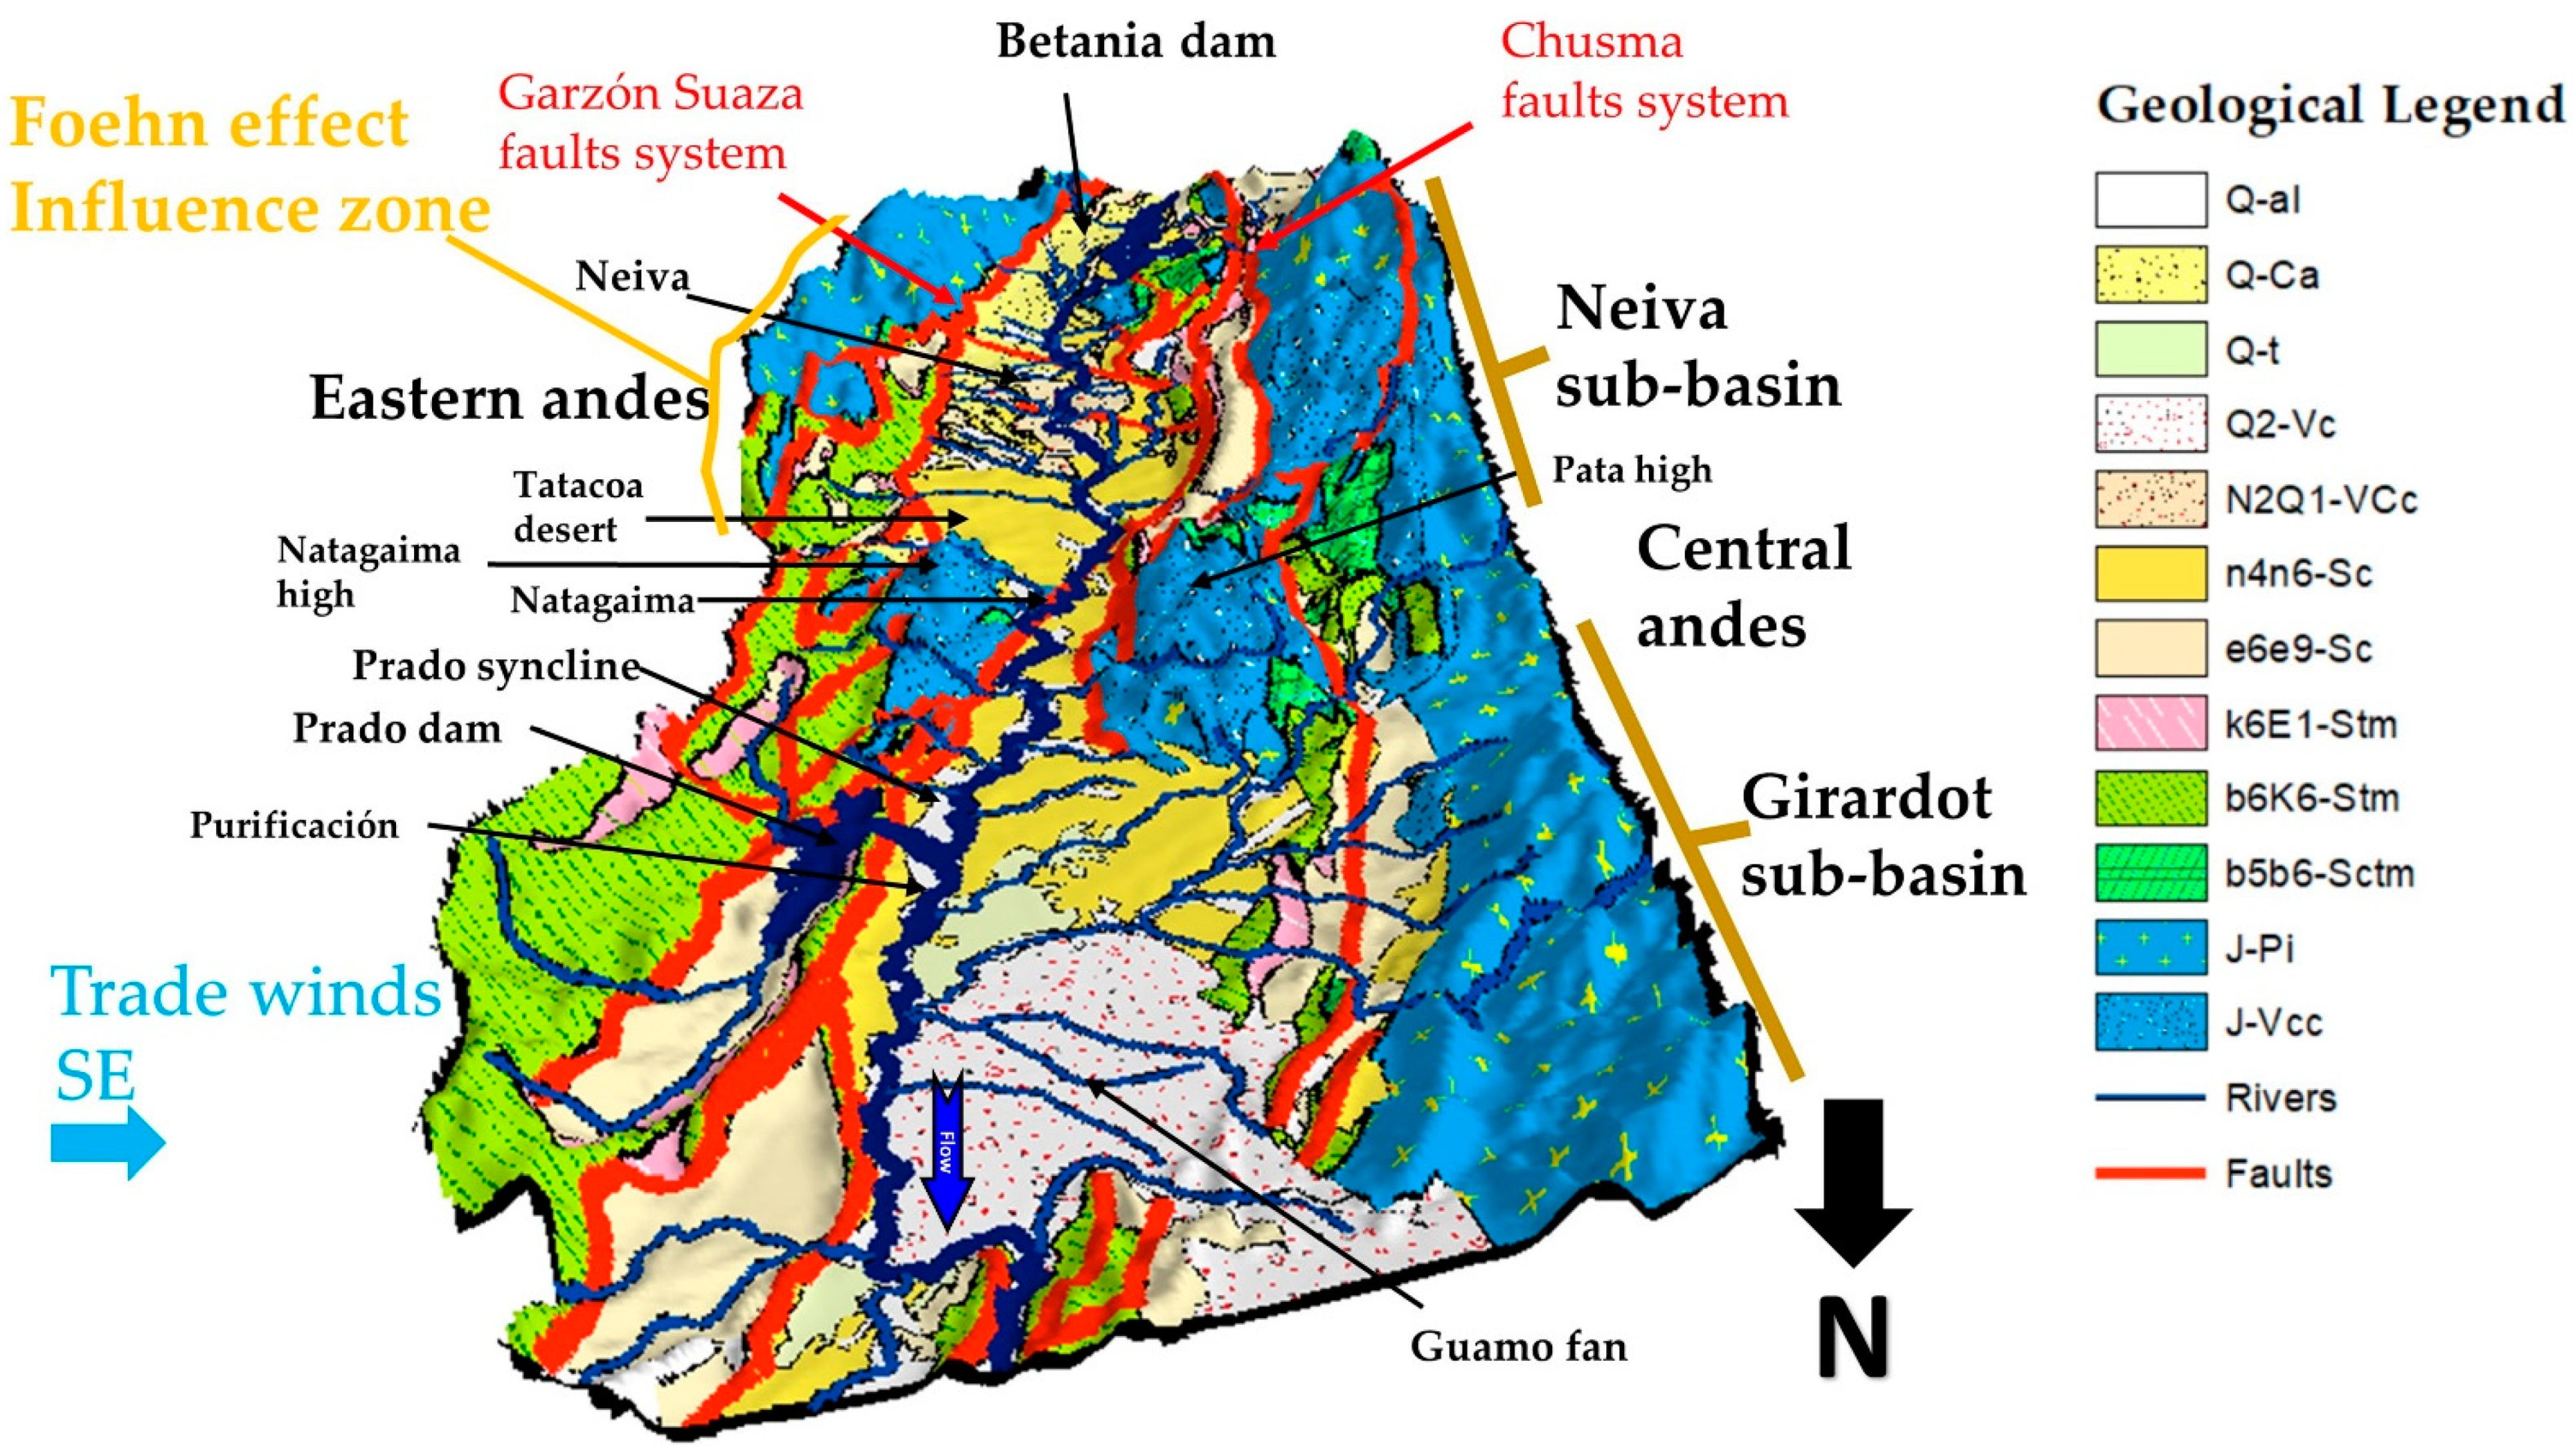
The Magdalena River basin is located between the Central and Eastern Andean Mountains Ranges; the Garzón Suaza and Chusma fault systems limit this basin (see Figure 5). Betania is the first dam that affects the Magdalena River, and downstream 178 km is an affluent (Prado River) that is dammed for the Prado Dam. The basin is divided into two sub-basins, Neiva and Girardot, separated by a valley or transition zone [80,81]; a lithologic formation n4n6-Sc CU (Honda group) is the base of the basin and overlying different kinds of quaternary materials, such as volcanic, colluvial, terraces, and alluvial.
In the Neiva sub-basin from 0 km to 90 km, it is possible to identify the Foehn-effect-generated Tatacoa Desert [82,83]. The repercussions of this effect are present throughout the year (poor vegetation, little soil weathering). The climate of this area is classified as a tropical wet and dry or savanna climate, with the driest month having a precipitation of less than 60 mm during the dry summer [84].
The transition to the Girardot sub-basin occurs in a narrow valley from 90 km to 158 km, which ends at the Pata and Natagaima highs [85]. In the Girardot sub-basin from 158 km to 244 km, the Magdalena River follows a north-south trend closer to the Eastern Andes and Prado fault (Garzón Suaza fault system). From 178 km to 244 km, quaternary terraces and the Guamo fan are predominant on the left bank, confining the Magdalena River against the Eastern Mountain Range and rectifying the river.

4. Results

4.1. Hydrology

For each discharge time series at the available gauging stations (see Table 2), a 3-year period was removed and was not considered in the later analysis: from 1 year earlier to 1 year after the start of dam operation.

4.1.1. Hydrological Regime

The hydrological regime for the pre- and post-dam periods was evaluated at each flow gauging station. In addition, we calculated the changes in monthly precipitation within the basins of each project in order to identify whether the changes in discharge are influenced by the precipitation change within the basins.
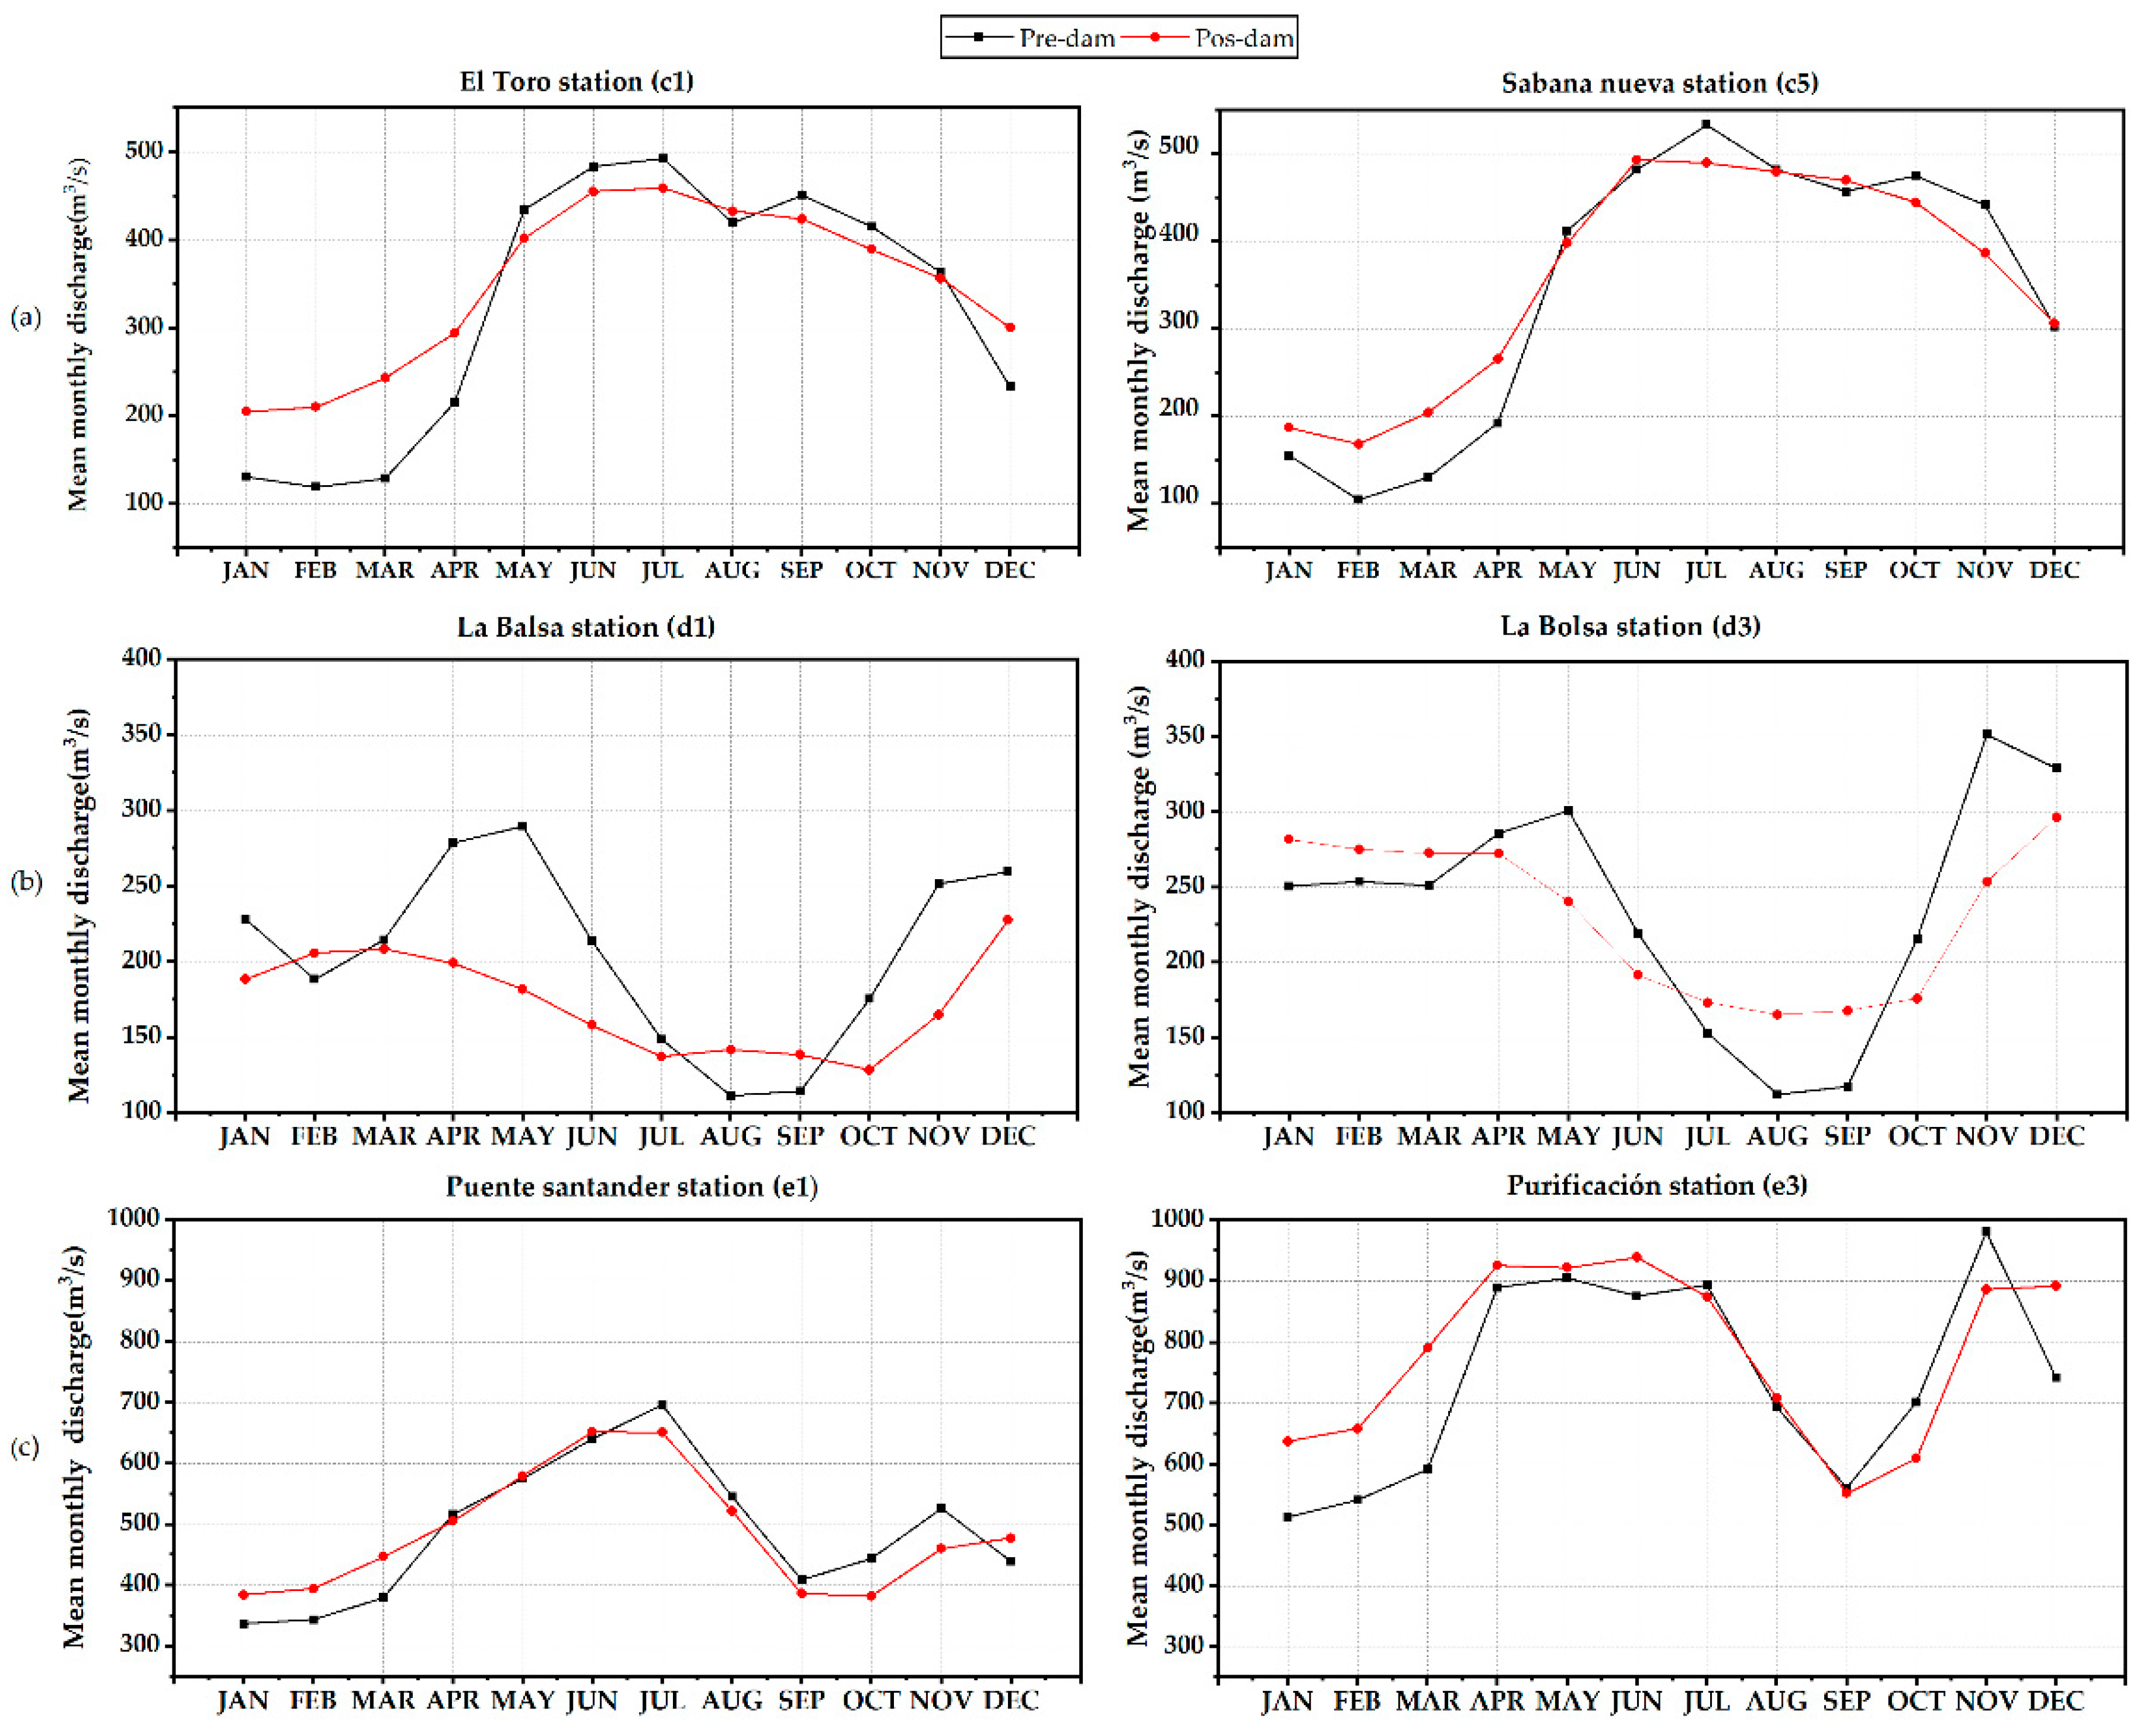
In Figure 6, the hydrological regime for both periods in two gauging stations downstream of each dam is shown. In Appendix C, the test results (Student’s t-test and Fisher’s F-test) applied on the average monthly discharge and precipitation within the basins in the pre-dam and post-dam periods are summarized. According to the statistical results presented in Appendix C, no significant changes in the mean or variance values of the monthly precipitation within the basins were observed, except for some specific months. Therefore, those precipitation changes do not explain the monthly mean flow changes in the downstream gauging stations.
The hydrological effect due to dam construction is similar in the four selected study sites: increased low discharges during the dry period and decreased high discharges during the rainy period (see Figure 6). Downstream of the Urrá I Dam (see Figure 6a and Table 4), the differences between the pre- and post-dam periods occur in the means during the dry period, while differences in the variances are more significant in the rainy season.
Downstream of the Salvajina Dam (see Figure 6b and Table 4), the discharges decrease significantly in the rainy period compared to the other dams; this is reflected in the lower values (t-test) before and after dam construction. We also observed a considerable increase in discharges during the dry season, from August to September (see Figure 6b).
The hydrological effects due to the Betania Dam construction are reflected by the discharge series at the Puente Santander and Angostura stations, while the hydrological effects observed downstream of the Purificación station reflect the combined effects of the Betania and Prado Dams. It was impossible to identify the affectation of only the Prado Dam, which started operation in 1972, since the gauging station records are only available from 1975, so the combined effect of both dams was considered. In the area affected only by the Betania Dam (until the Angostura station), attenuated discharges are observed during the rainy season and increased discharges are present during the dry period (January to April). The discharges during the same dry period at the Purificación station were higher in the post-dam period than the ones observed before dam construction. The percentages of the difference between the low discharges pre- and post-dam in this station were larger than those observed in the gauging stations that are only influenced by the Betania Dam. Of the three studied areas, this one has the slightest changes in the mean and variance, which implies a lower impact of these dams on the hydrological regime.

4.1.2. Annual Discharges

The changes in the annual discharge (minimum, mean, and maximum annual flow) were evaluated by calculating the difference (as a percentage) between the pre- and post-dam periods (see Figure 7). The Kolmogorov–Smirnov and Mann–Whitney non-parametric tests were also applied to test the hypothesis of no difference at a 5% significance level between the distributions of the annual discharge values from the pre- and post-dam periods. The results of these tests are presented in Appendix C. The general effect of the studied dams in all areas was to increase the minimum annual discharges and decrease the maximum annual discharges. For the studied reservoirs, dam operation focuses on retaining the water excess during the wet period, decreasing the peak discharges to release it later in a controlled way during the dry period, increasing the minimum discharges for maintaining water consumption. At the same time, the medium annual discharges tend to remain constant.
Downstream of the Urrá I Dam (see Figure 7a), all stations exhibit an increase in minimum annual discharges and show a different trend in medium annual discharges. In the Palma central station, all annual differences in discharges are positive, indicating that there is no influence of the dam on this station but, rather, an increase in discharges due to the tributaries. Downstream of the Salvajina Dam, the maximum and medium annual discharges decrease and the minimum annual discharges increase up to 54% (see Figure 7b). After dam construction, the distribution changed for the minimum annual discharges at the La Bolsa station and the maximum annual discharges at the La Balsa station. Downstream of the Betania Dam, the minimum discharges do not have a single trend (see Figure 7c). The maximum and medium annual discharges decreased after dam construction, except at the Purificación station (influenced by the Betania and Prado Dams), where the minimum and medium annual discharges increased. Only at the Purificación station in the post-dam period did the distribution of the minimum annual discharges change.

4.2. Erodibility Index

Based on the geological information, bank material was classified and ranked by using the Global Erodibility Index (EI) according to the recommendations found in the literature [75]. In this work, the EI demonstrated its applicability and its capacity to be applied in morphodynamic modeling. This classification is shown with the morphological changes described in the next section.

4.3. Morphological Changes

4.3.1. Downstream Morphological Changes

The channel width and sinuosity per section were calculated for all years, considering the pre- and post-dam periods. The values were averaged by river reach, and to identify the effects due to dam construction, the differences in the channel width and sinuosity were presented as a percentage, considering the pre-dam condition. A river reach is defined by the affluence of tributaries or changes in the river morphology. These values are schematically arranged in plots that include the confinement degree, the chronostratigraphic units, the erodibility index, and the main tributaries downstream of the dam. In the next sections, the main changes in the channel morphology of each selected dam are presented.
  • Morphological changes downstream of the Urrá I Dam
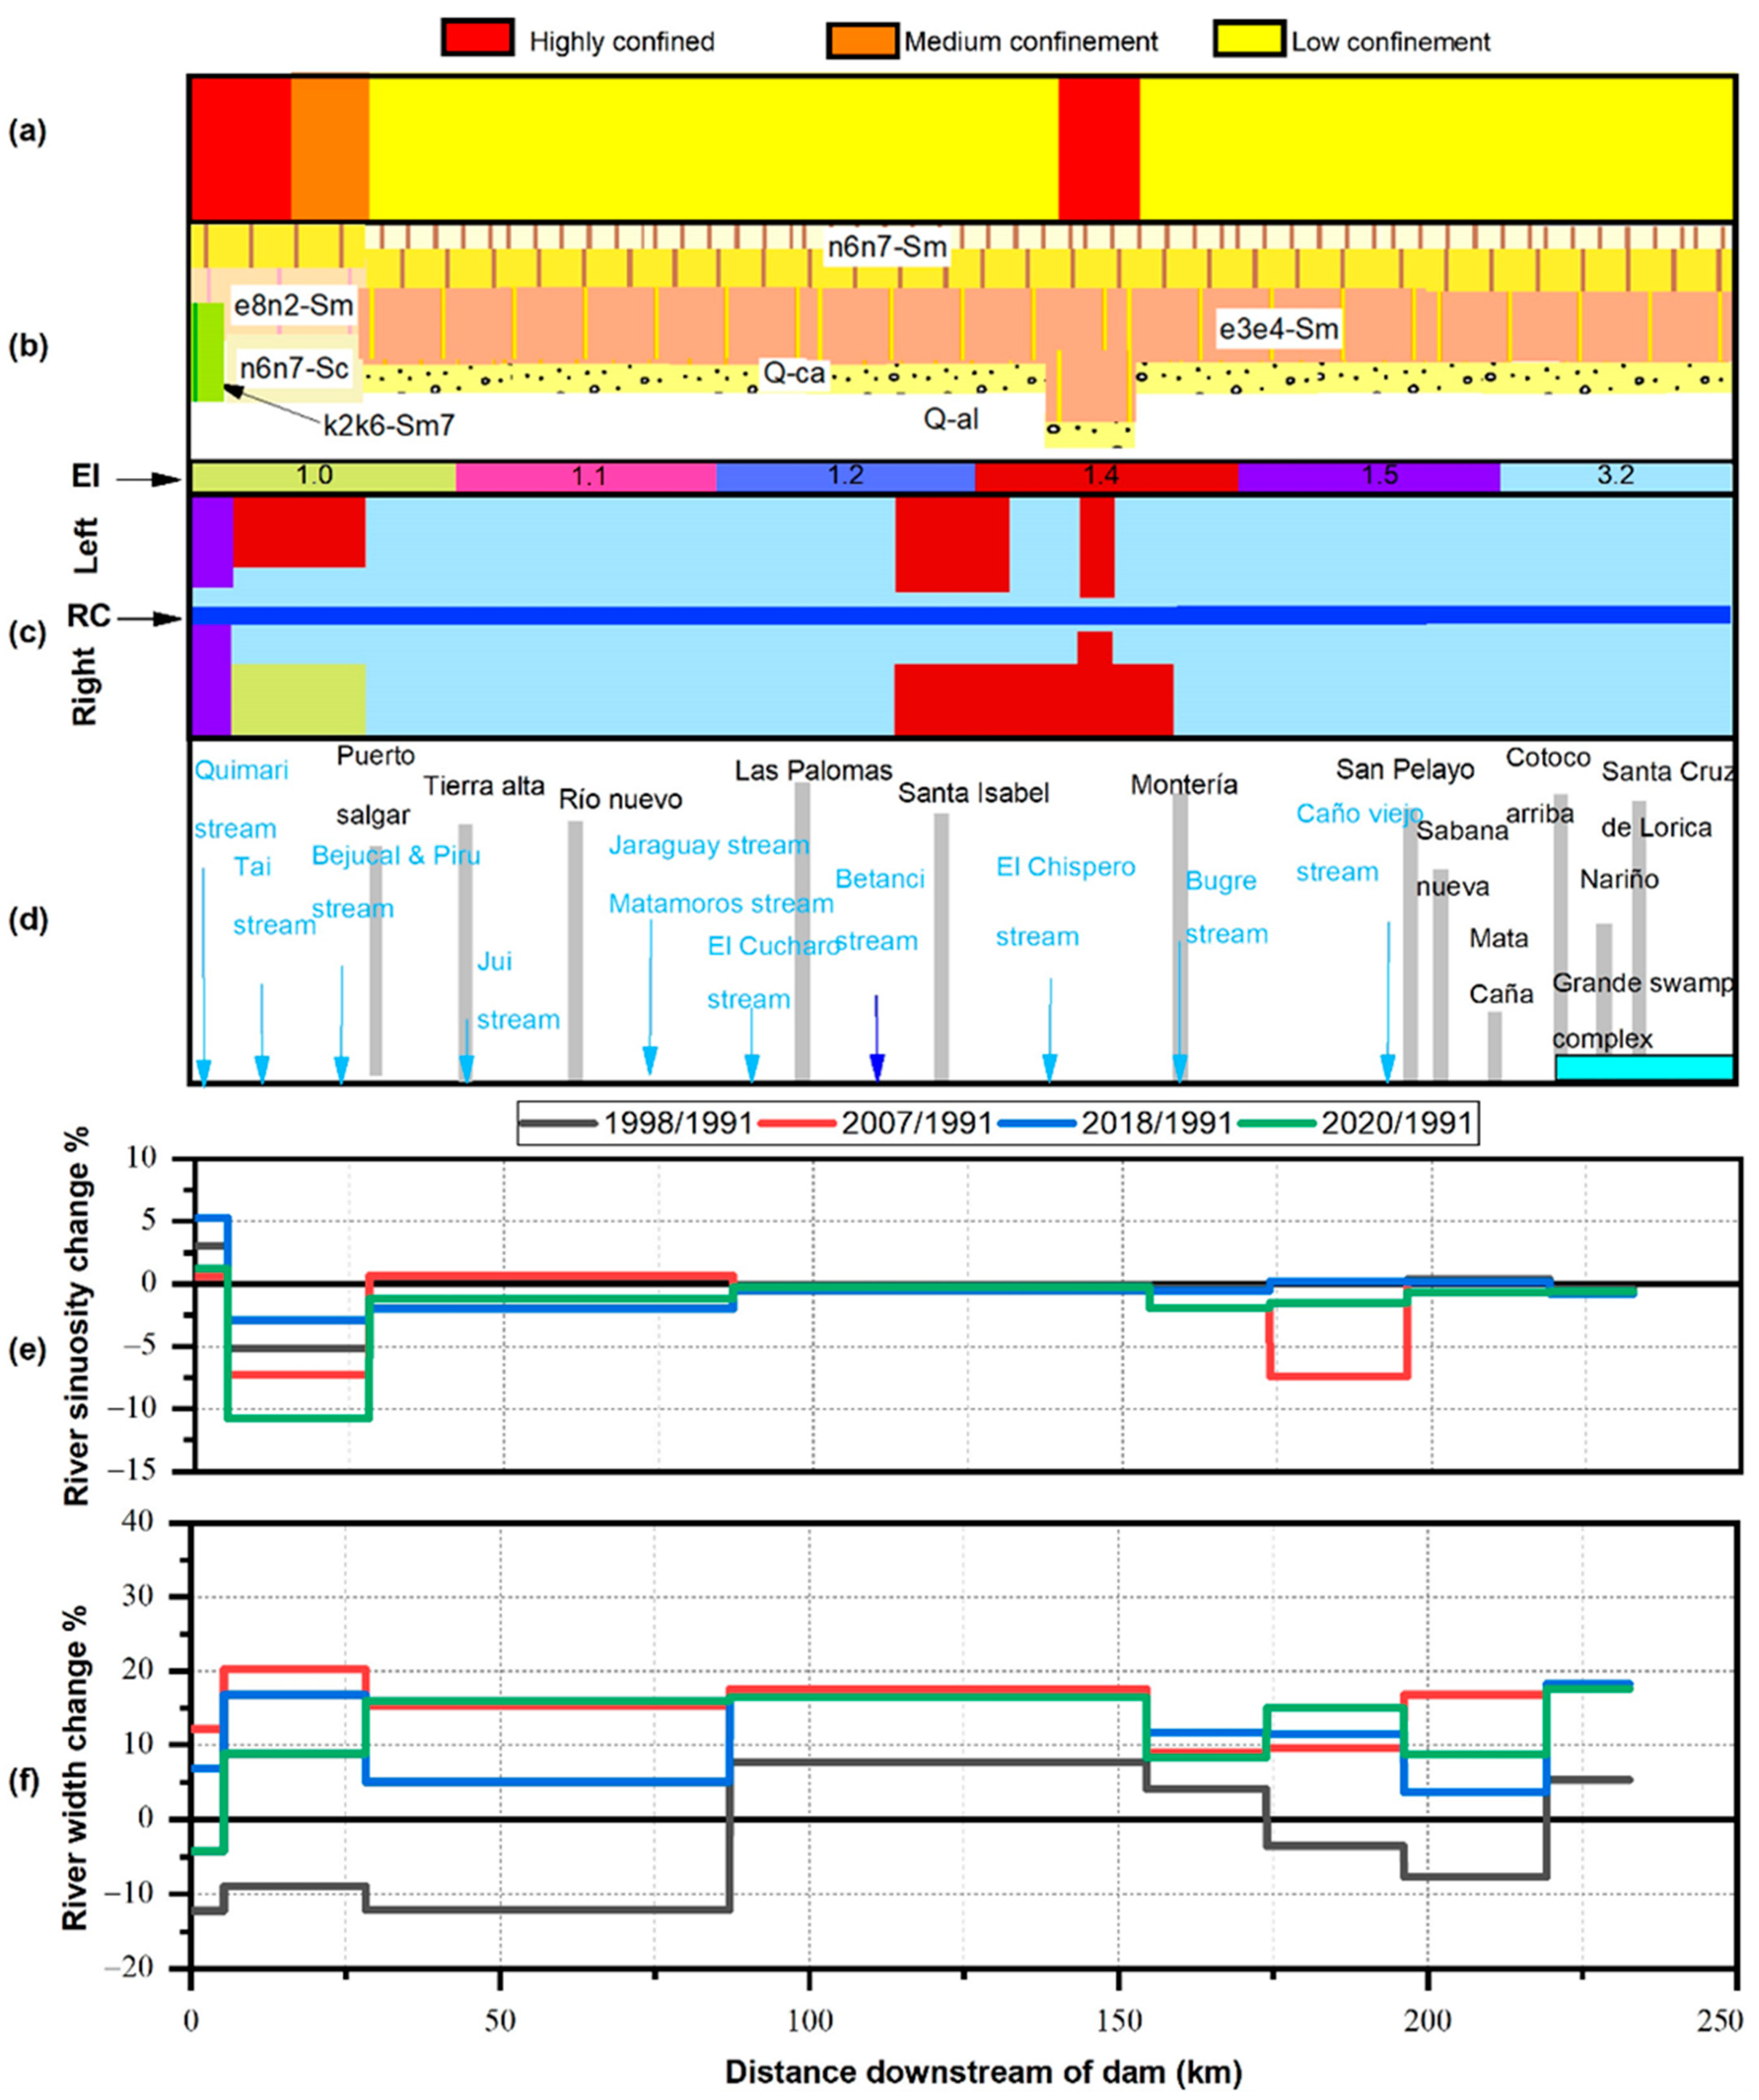
The spatial information available for this study site is distributed as follows: pre-dam years (1991 and 1998) and post-dam years (2007, 2018, and 2020). The percentage of change in the channel width and sinuosity referring to the pre-dam year of 1991 for this study site as a function of the downstream distance is presented in Figure 8. This figure emphasizes that downstream of the Urrá I Dam, the general trend of the channel width after dam construction was to increase (see Figure 8f). After the construction of the dam, the Sinú River increased its width by 17% on average; meanwhile, sinuosity only decreased to −1.31% on average. This general trend is consistent with the increase in low discharges and the sediment retention in the reservoir. However, these changes in the channel width are not correlated with the modifications to channel sinuosity. Figure 8e allows identifying areas with the changing channel width that almost maintain a constant sinuosity. These areas coincide with the location of the Betanci stream affluence and the Grande complex swamps (Figure 8d).
In the high mountains, the river dynamic is driven by changes in lithology, because of the less thickness of the quaternary alluvium. This can be seen in the first 5 km downstream of the dam (see Figure 8), where one of the banks is dominated by rock, so the change in the channel width is less than that observed in quaternary-alluvium dominant areas.
In Figure 8, it is also observed that in the year 2007, the channel width exhibited the maximum observed values (close to an increase of 20%). Areas with this high percentage of increase in the channel width are concordant with more erodible zones, where the quaternary alluvium is on both sides of the channel (see Figure 8b,c). In 2020 (the last year of comparison), some reaches had a reduced channel width in comparison with the maximum channel width observed during the study period; this negative trend indicates bed erosion and channel incision, a behavior that can be clearly identified near the city of Montería. The morphological changes drastically reduced 219 km downstream of the dam, near the Cotoco site; therefore, this length can be assumed as the extent of the morphological impact due to dam construction.
  • Morphological changes downstream of the Salvajina Dam
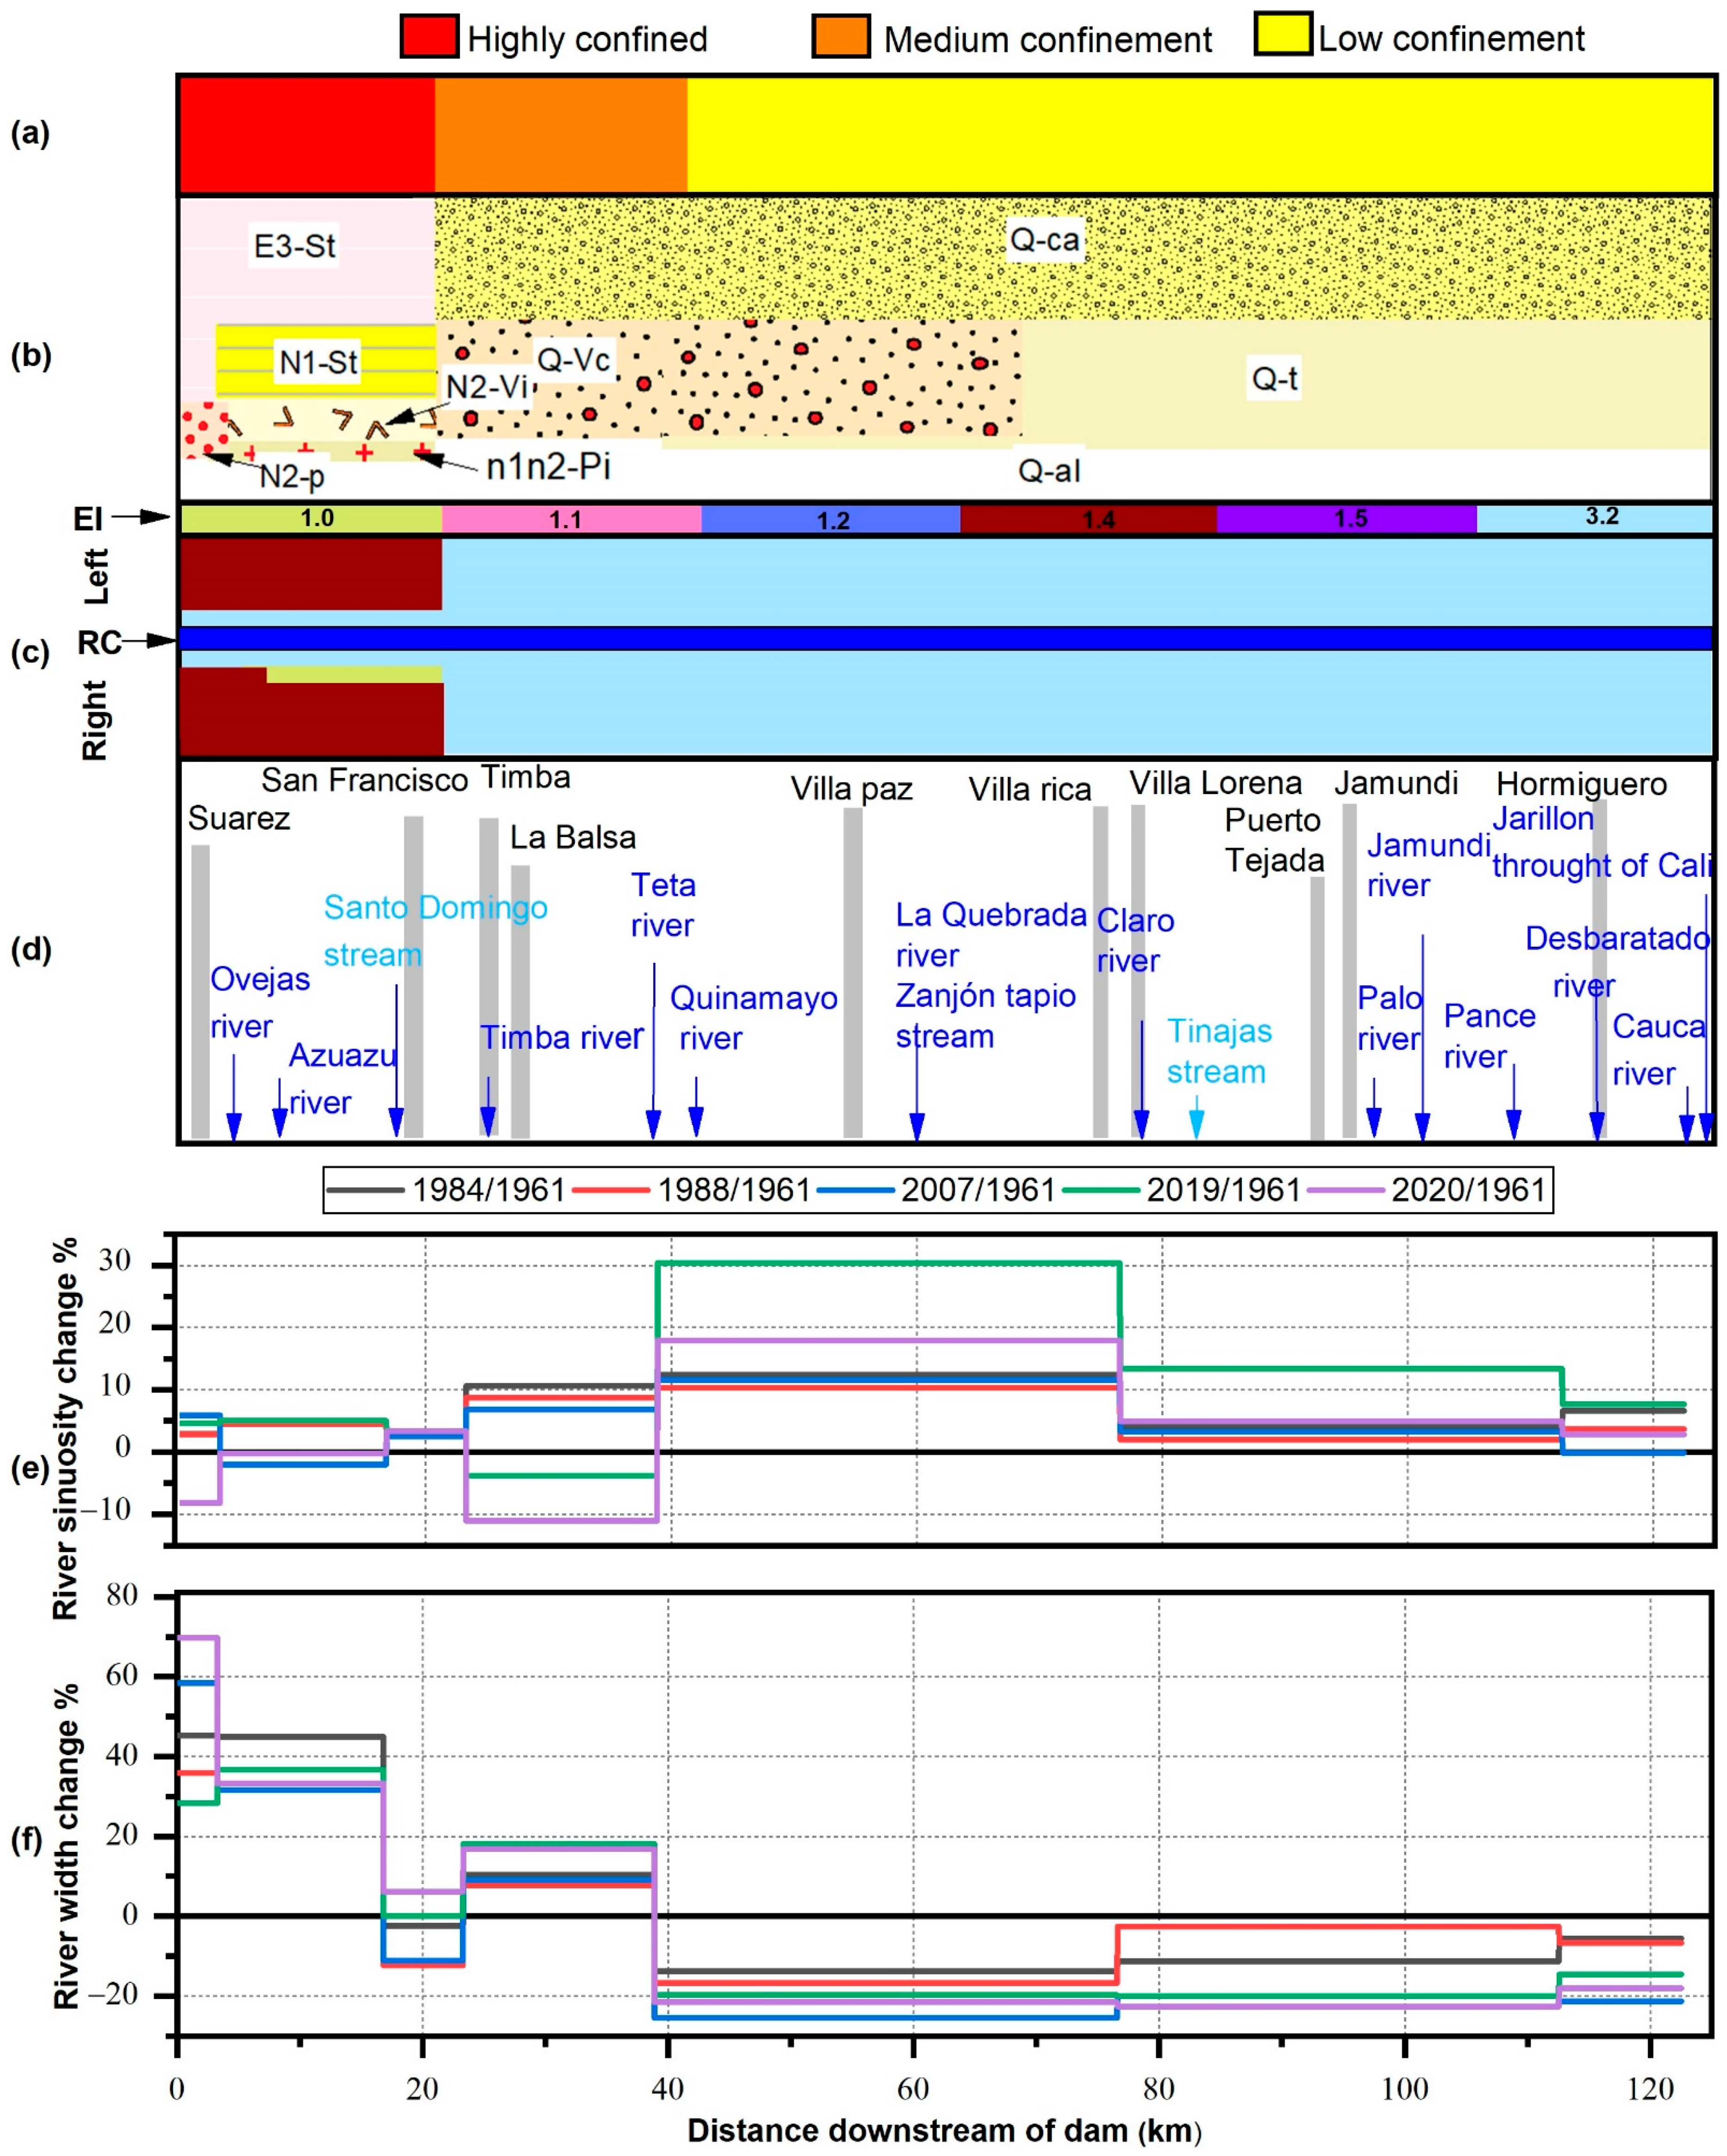
For this study site, the pre-dam years are 1961 (obtained from aerial photographs) and 1984, while the post-dam years are 2007, 2019, and 2020. The percentage of change in the channel width and sinuosity referring to the pre-dam year of 1991 for this study site as a function of the downstream distance is presented in Figure 9.
Figure 9 shows that downstream of this dam, the morphological changes had two contrasting behaviors, observed in the high mountain area and the alluvial valley. In the high mountain area (between 0 km and 39 km) with high-to-medium confinement, the tendency of the channel was to increase its width, with some changes in sinuosity, during the post-dam period, with a short reach in which the channel width decreased between 1984 and 2019. The most recent year, 2020, presented an increase in the channel width in most areas. The first 17 km of the Cauca River downstream of the Salvajina Dam exhibit a similar behavior to that reported for the Sinú River: the channel width and sinuosity respond to the bank composition; fewer changes are observed in areas with low erodibility, and vice versa. The transition from high mountain to alluvial valley (see Figure 4 and Figure 9a,b) occurs between 17 km and 23 km, where the channel width increases but sinuosity remains constant. From 23 km to 39 km, the channel width increases, which coincides with the transition zone toward the vast valley, where medium confinement is found with quaternary materials (Q- Vc and Q-ca CUs). In the alluvial valley area, from 39 km to 123 km, low confinement and quaternary lithology are observed. In this zone, the Erodibility Index is the highest for the studied river reach (with values up to 3.2). However, there are different quaternary alluvium types (Q-Vc, Q-Ca, Qt, and Q-al) and the river is sinuous. The general tendency of the channel width is to decrease, increasing channel sinuosity. This increase in sinuosity implies a decrease in the river slope, which is reflected in a reduction in the erosive capacity.
The quaternary terraces (Q-t CU) dominate on the right side of the valley, between 70 km and 123 km, confining the river to the left side or pulling it toward the Western Andes. The river stops being sinuous exactly in confluence with the Desbaratado River, approximately 118 km downstream of the dam. From 118 km to 123 km, the channel width and sinuosity did not significantly change in the post-dam period. This narrowing trend of the river channel combined with an increase in discharges during the dry period may indicate the existence of an incision process in this area. This aspect is contrary to the expected increase in bank erosion processes, which emphasizes the relevance of the composition of the alluvial valley materials. In general, before the construction of the dam, the Cauca River width increased by 3.5 m (4.33%) and its sinuosity by 0.1 (6.5%). During the post-dam period, the channel width decreased by −0.17 m (−0.21%) and the sinuosity by 0.09 (4.74%). The morphological changes drastically reduced 118 km downstream of the dam, near the Desbaratado River; therefore, this length can be assumed as the extent of the morphological impact due to dam construction.
  • Morphological changes downstream of the Betania and Prado Dams
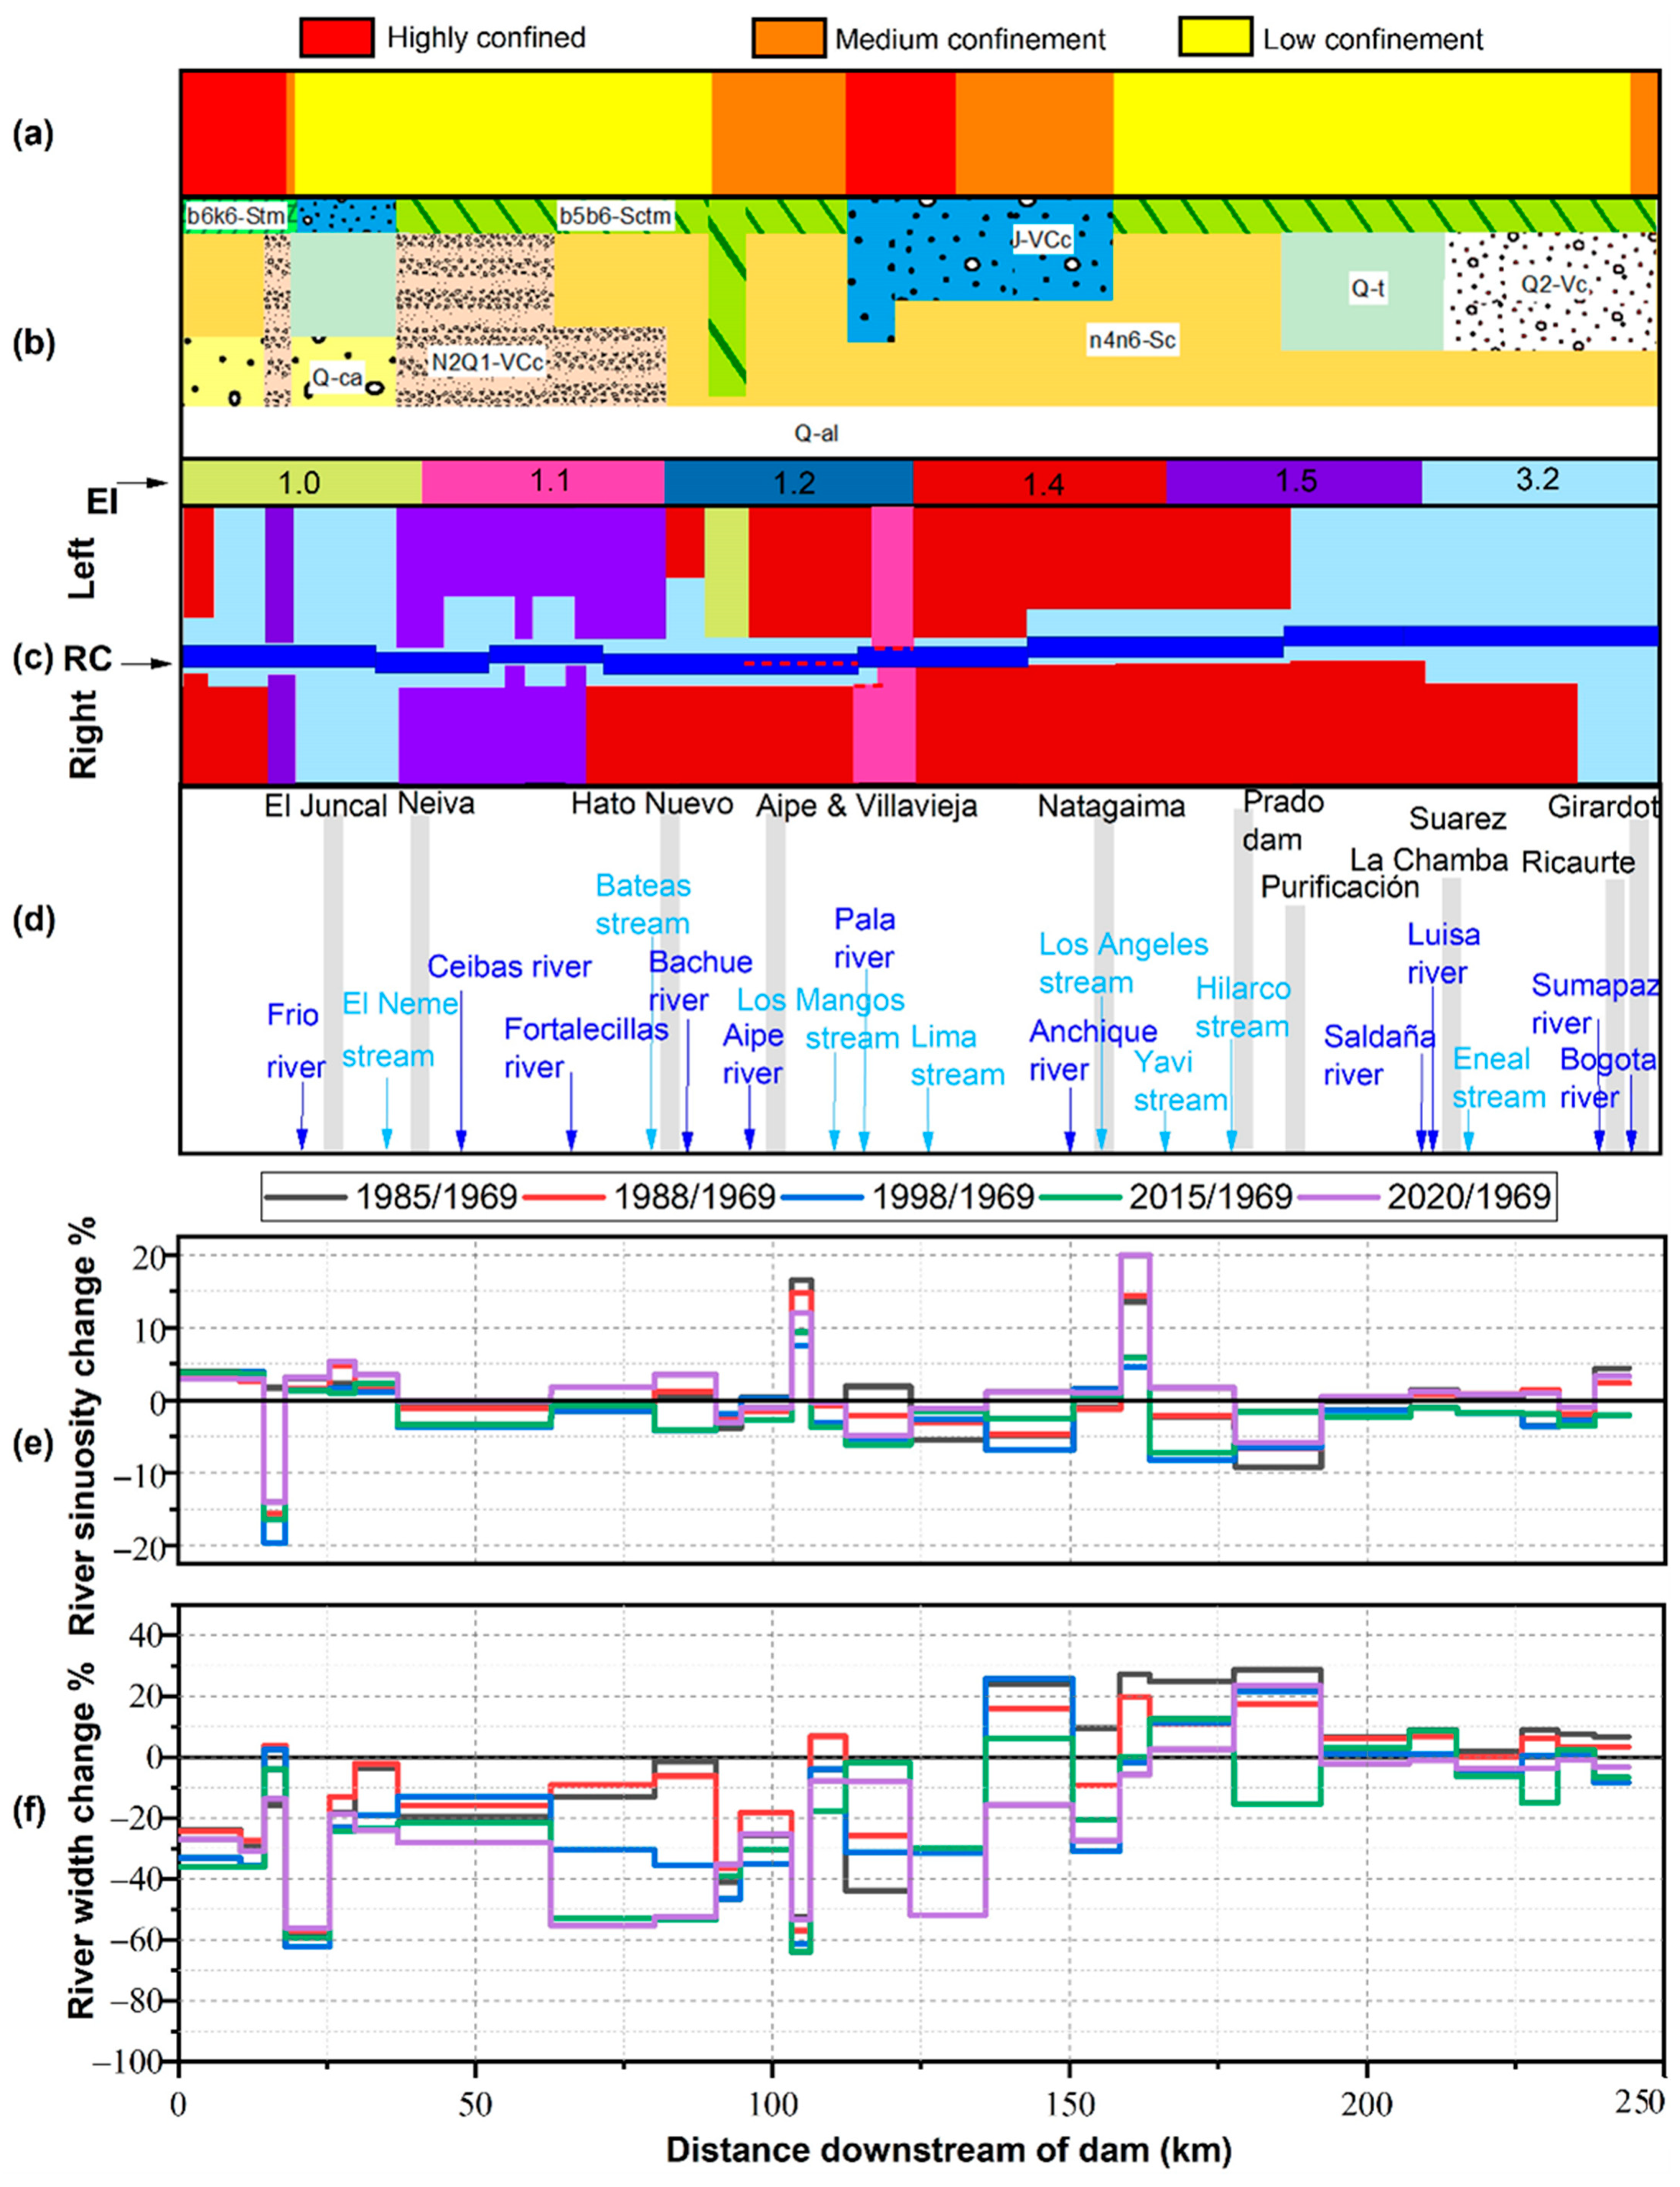
The pre-dam years are 1969 (obtained from aerial photographs) and 1984 for the Betania and Prado Dams, respectively, while the post-dam years are 1988, 1998, 2015, and 2020. The percentage of change in the channel width and sinuosity referring to the pre-dam year of 1969 for this case as a function of the downstream distance is presented in Figure 10.
The Magdalena River crosses different confinements and lithologies, separated into three areas according to the area’s geology: the Neiva sub-basin, the Girardot sub-basin, and the transition zone between them (valley). In the Neiva sub-basin, from 0 km to 90 km, the narrowing trend of the river was kept in the pre-dam and post-dam periods without important changes in sinuosity. After dam construction, the decrease in the channel width intensified. There is, however, no general trend, because the banks present contrasting lithologies. Two areas are highlighted with unique geological characteristics:
-
Between 14–18 km, there is an erodible volcanic lithology (EI = 1.5) on a high-confinement area. Then, an increase in the channel width was observed in the post-dam period.
-
From 18 to 25 km, the channel width was reduced by about −62% between pre- and post-dam periods. This is a Magdalena River transition area from high- to low-confinement. The transition area is close to where the Frío River flows into the Magdalena River.
The transition zone, a valley with medium-to-high confinement, between 90 km and 158 km presents a thinner alluvial quaternary deposit. The general trend of the channel width is to decrease. That decreasing trend was enhanced in the post-dam period. Some sections are highlighted: For example, the river reach located between 103 km and 106 km exhibits the lowest channel width change throughout the Magdalena River in the post-dam period (−64%) and a maximum sinuosity of 16%. This reach corresponds to the confluence zone of four streams into the Magdalena River. Between 112 km and 123 km, the channel width increases due to the presence of a fault zone (sheared rocks), which makes this zone erodible.
In the Girardot sub-basin, with low confinement from 158 km to 244, there was a channel-widening trend during the pre-dam period. After dam construction, a general narrowing trend is observed until 192 km downstream of the dam. This trend is primarily associated with bars that decrease its channel width, delimited by the n4n6-SC CU formation. From 192 km to 244 km, quaternary formations, such as Q-t, alluvial terraces, and the Q2-Vc CU Guamo fan appear, which confine the river, generating an almost straight planform. In this area, there are no significant changes in sinuosity and width, but precisely between 215 km to 226 km, the channel width shows no change during the pre-dam period. The post-dam period maintains a value of −6% for all years, defining the extent of the morphological impact due to dam construction, which occurs until 215 km downstream of the dam (near the city of Suárez).
In this study site, it was not possible to differentiate the changes due to each dam (Betania and Prado), because the gauging station installation date does not coincide with the starting of the operation of the Prado Dam. The hydrological regime in this area presents increased discharges during the dry period, but those are not reflected in the observed changes in the channel width. This aspect also shows the relevance of the resistance of the riverbanks, which coincide with more consolidated formations.

4.3.2. Upstream Morphological Changes

The morphological changes upstream of the selected dams are presented schematically in a similar way to that used for the downstream areas; however, these plots do not include the tributaries of the main river. The morphological changes upstream of the selected dams showed similar trends, and the obtained results are summarized in Table 4, while the schematic plots are included in Appendix D. To identify the extent of the morphological effects upstream of the reservoir, two reaches were adopted: (1) the length of the channel until the influence of the reservoir was identified and (2) the length of the channel upstream of the previous one in which the effect of the reservoir vanished.
The morphological changes in the reach upstream of the reservoir (identified by reach 1 in Table 4) are related to the increased water levels in the reservoir with the correlated increase in the channel width. The magnitude of the increase in the channel width varies among the study sites, but it is possible to emphasize that upstream changes in the channel width are 1 order of magnitude larger than those observed downstream of the dam.
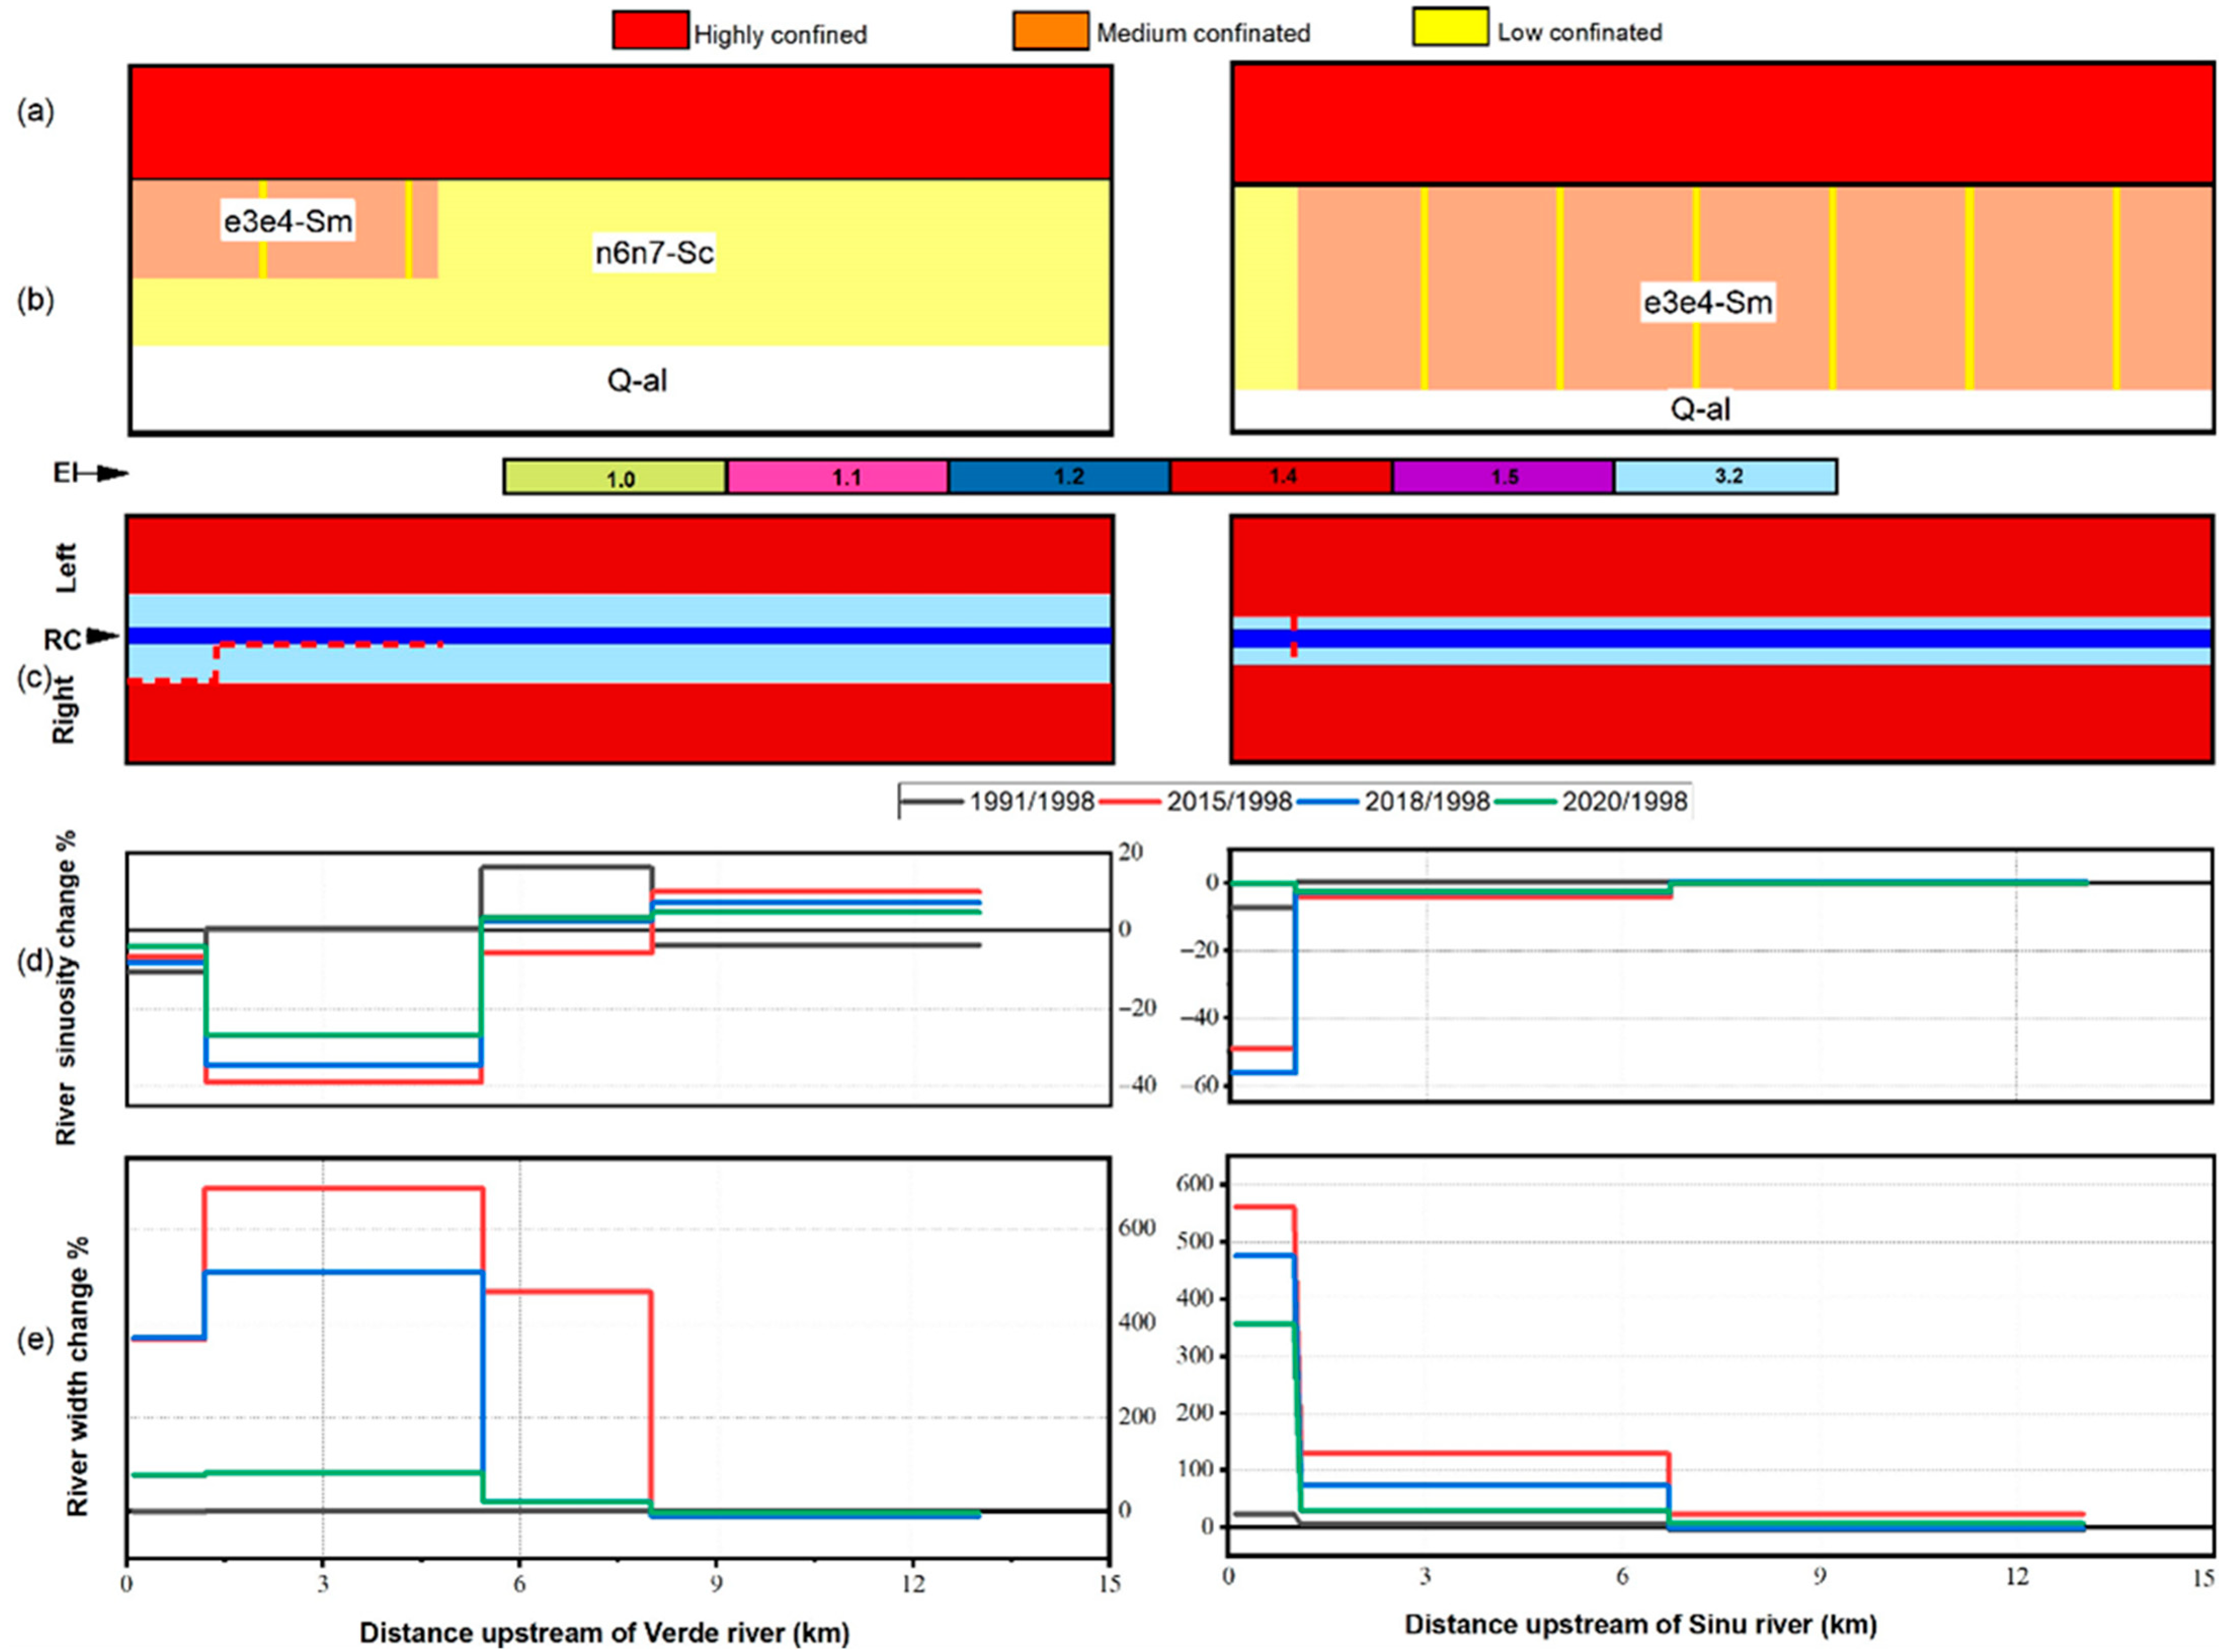
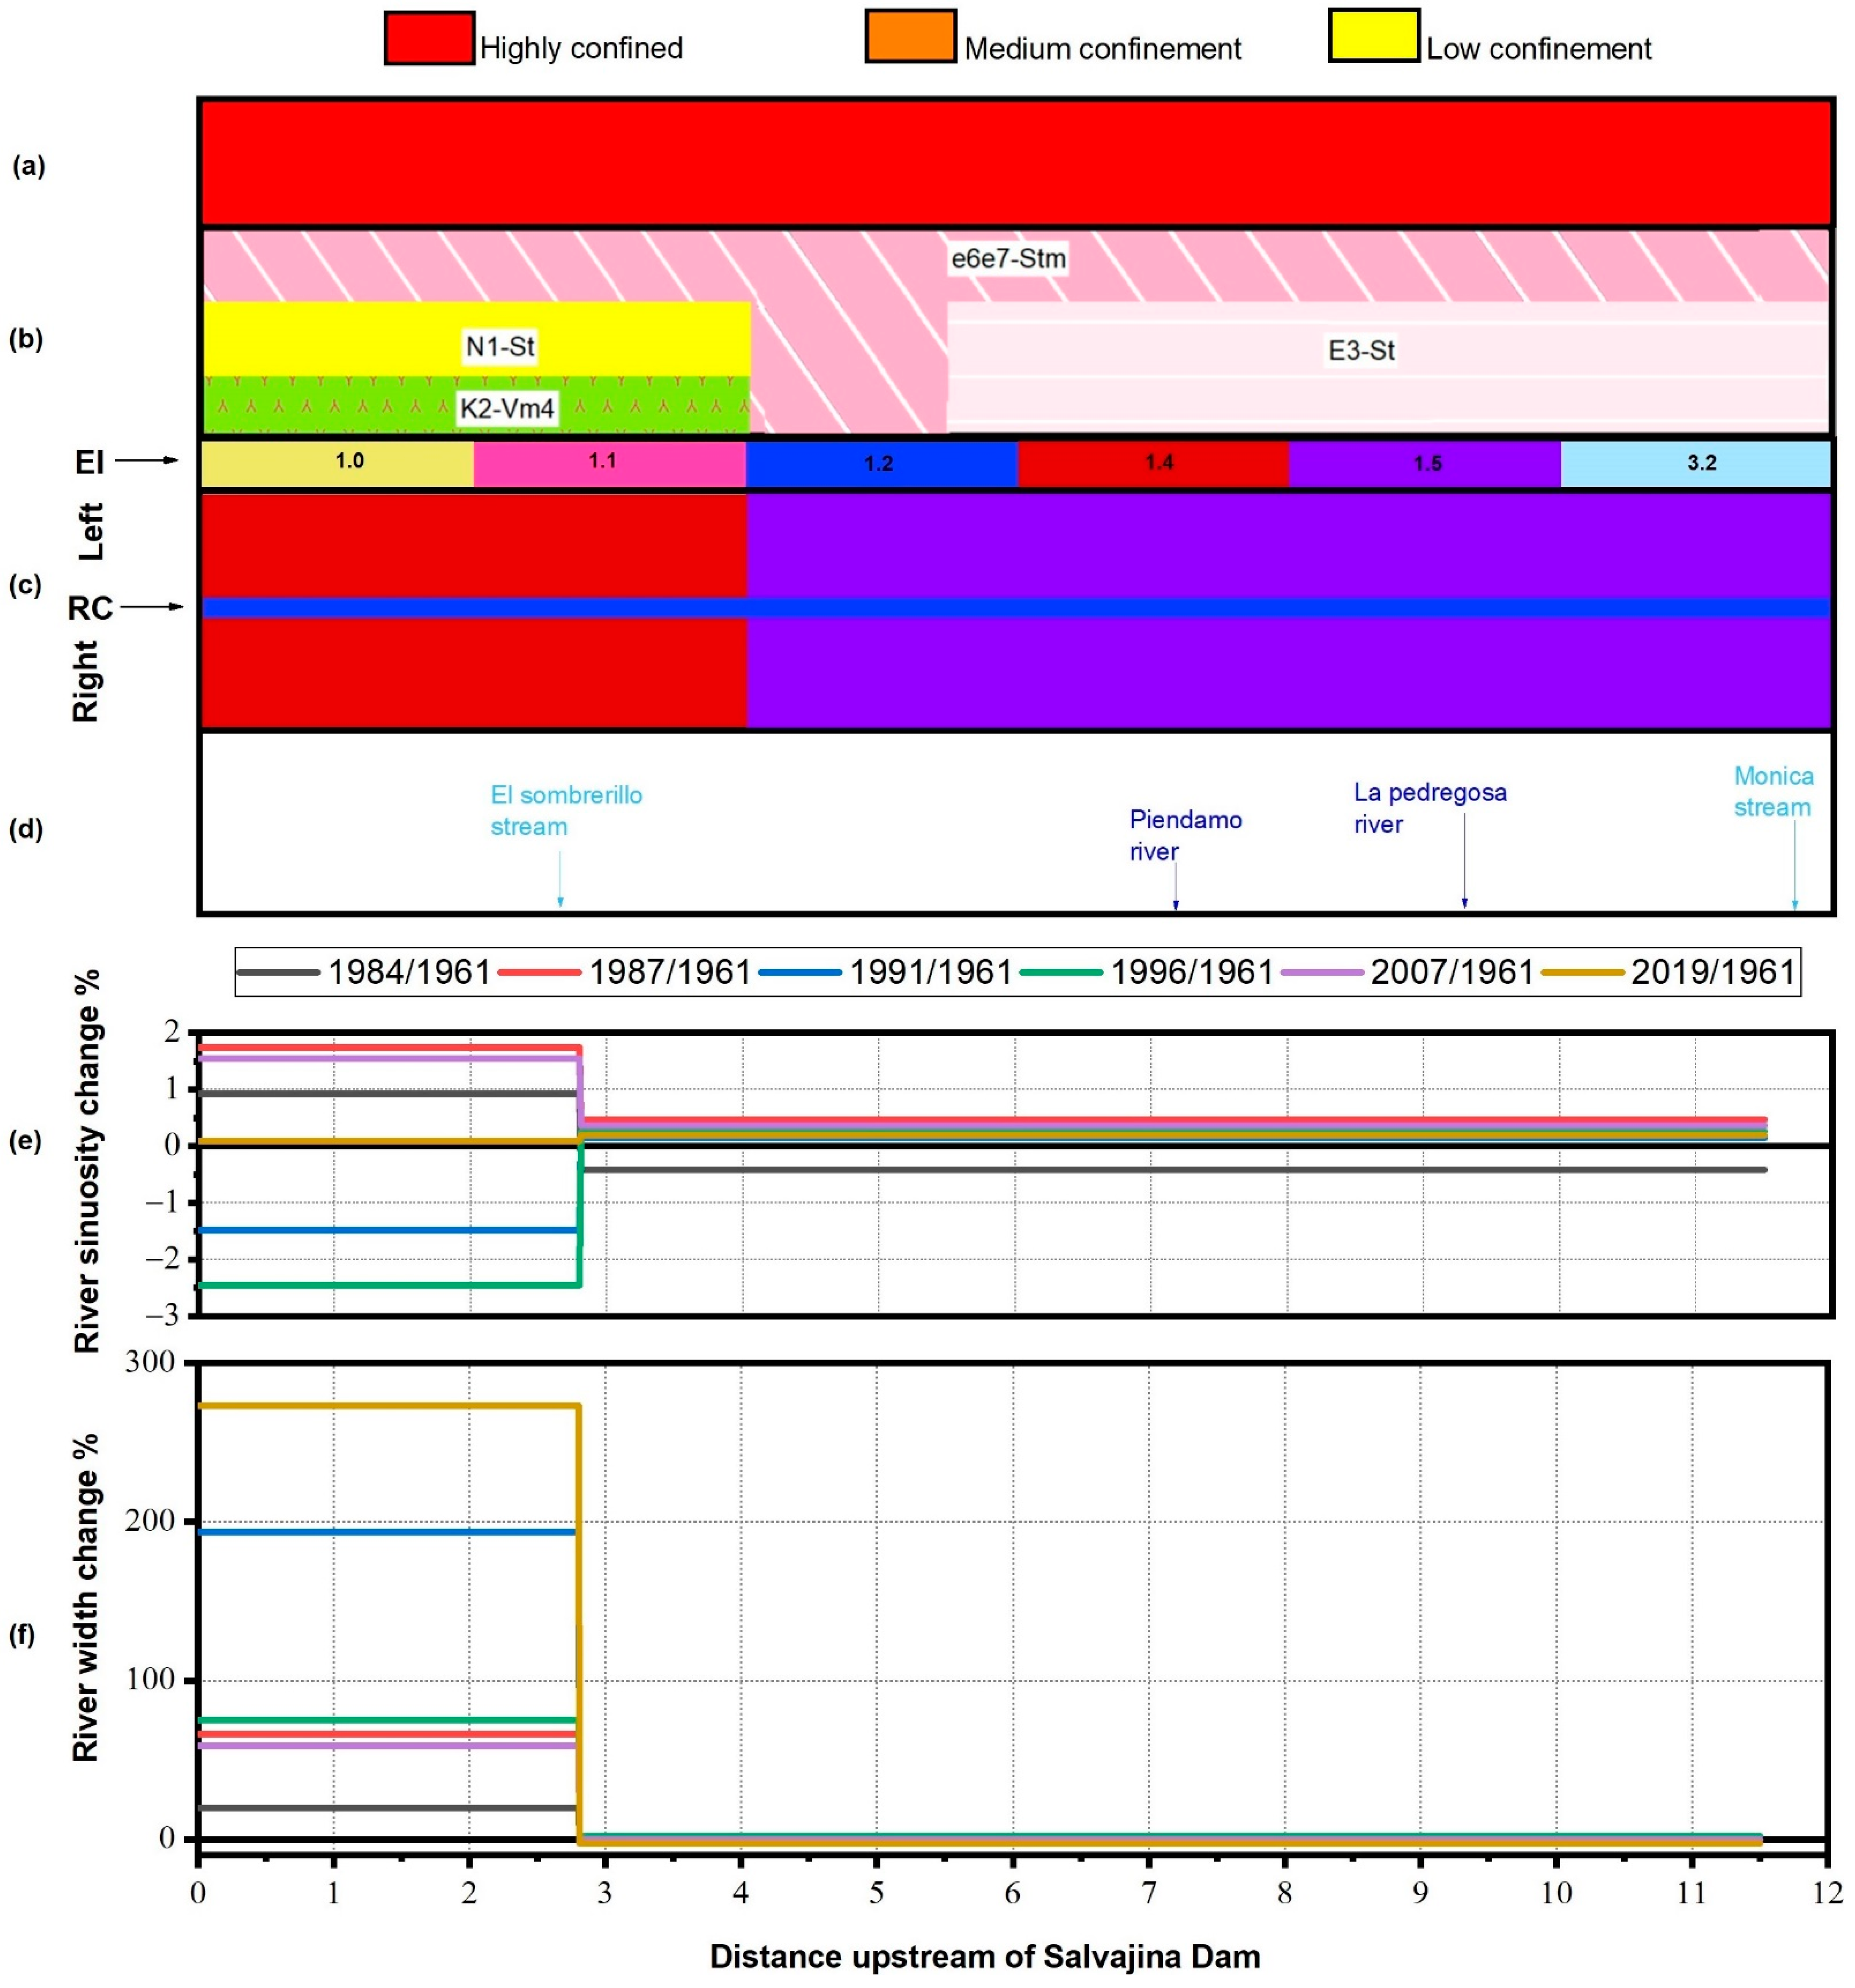
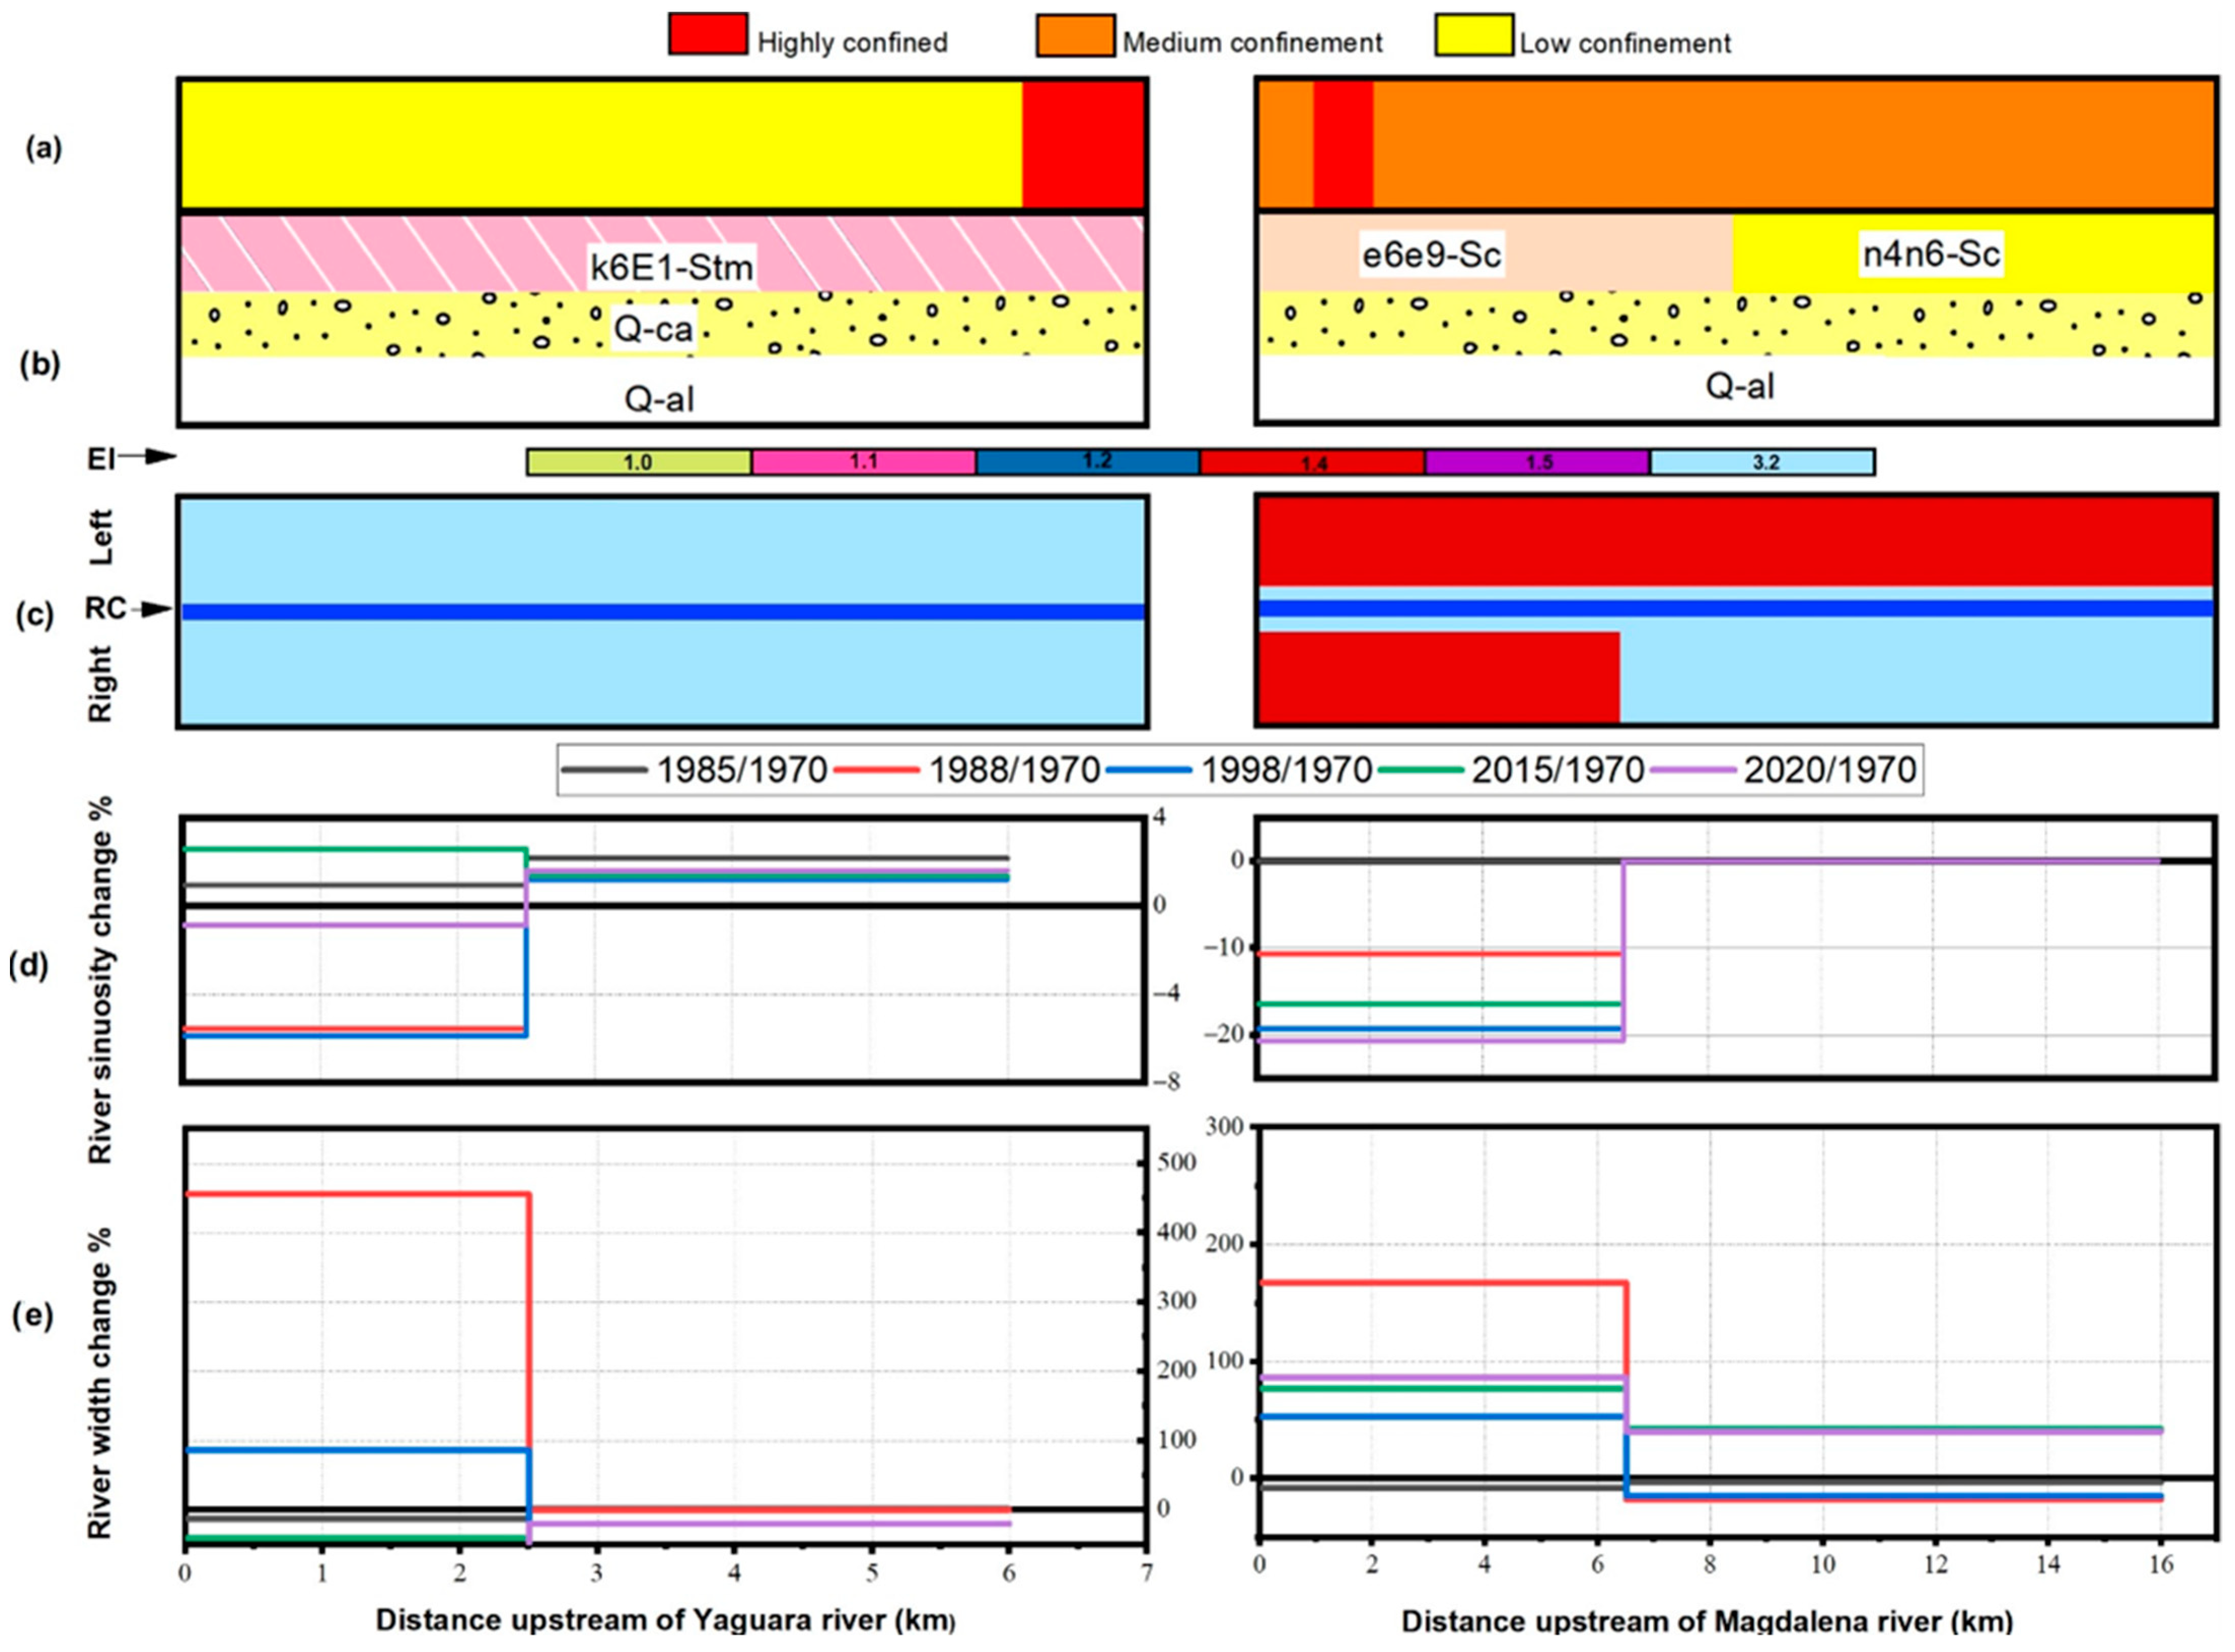
Upstream of the Urrá I Dam, an increase in the channel width of 600% and 562% was observed along the Verde and Sinú Rivers, respectively—a situation that occurs in zones with high confinement and medium erodibility but that are affected by the presence of faults that increase instability. Upstream of the Betania Dam, the Yagura River has low confinement and high erodibility and presents an increase in the channel width of up to 456%. Contrastingly, the zone of the Magdalena River with medium confinement and medium erodibility exhibits an increase up to 167%. Upstream of the Salvajina Dam, the channel width increases up to 123% in zones with high confinement and medium erodibility. The sinuosity, however, remains almost constant for the cases of Salvajina and Betania Dams, while in the Urrá I Dam, it presents high variability.
Considering the results presented in Table 4 and the plots presented in Appendix D, it is possible to identify that the magnitude of the morphological changes upstream of the studied sites depends on the hydrological variability of the water levels in the reservoir and the geometrical settings of the reservoir vase, such as the confinement degree and the valley lateral slope. The geological characteristics of the forming materials seem to have an influence on the morphological changes as high erodibility generates an increase in the channel width. The coincidence of the channel course with fault chains modifies the behavior of certain zones from low to high erodibility. Due to the changing morphology, the zones identified as reach 1 in each study site should be considered in risk reduction activities because of the increased water levels and channel widths.

5. Discussion

5.1. Downstream Dam Effects

Although geology is considered essential in influencing river morphology, a few studies have considered the riverbank’s composition in the study of the morphological effects of dams. It is more common to use the geological information to define the right place to build a dam, analyzing, for instance, the rock type and geological structure [86]. Studies dealing with the morphological effects of dams use geologic information to obtain a context of the area of interest with lithological descriptions at a regional scale, but this information is not included in the morphodynamic analysis. Geology determines the spatial variation of riverbank materials (formations) and their associated resistance [73]. Grant et al. [30], for example, distinguished the importance of geology as a primary control, determining valley and landscape configurations and creating a relationship between sediment flows and post-dam changes. It is important to mention that due to the Colombian topography, the selected dams are built on the fall line (with an upstream bedrock reach and a downstream alluvial bed). Therefore, our analyses focused on this high–low intervention type.
Downstream of a dam, it is expected to find narrower channels through time [2,33]; however, a few authors have reported other trends during the post-dam period. Williams and Wolman [8] reported contrasting trends based on data from 21 dams in the United States. They explained these different responses due to the resistance of the alluvial bank materials, identified through field campaigns. In the Snake River, Nelson et al. [87] reported wider channel widths after dam construction, associated with large tributary floods. The results of our study suggest that including the geological framework and confinement degree of the selected area may clarify the possible channel width response, allowing identification of the more susceptible areas. This information is valuable in defining the extent of the biotic compensation measures in environmental impact studies. In mountainous areas (regions with high-to-medium confinement) near a dam, there is a general trend to have increased widths, even though the thickness of the alluvial quaternary area is thinner than in the alluvial valley. Moreover, in some sectors, the riverbanks can be in direct contact with the geological formations. Just downstream of the dams of the selected projects, a high-confinement zone is found. However, the high mountain area downstream of the Betania Dam (Magdalena River) is composed of more erodible materials (feldespathic sandstones and conglomerates rich in lithics). These low-resistance riverbanks explain the wider channels observed after dam construction (see Figure 10). In the other two cases (Salvajina and Urrá I projects), narrower channels are present, an aspect that can be attributed to incision processes induced by high-resistance banks (see Figure 8 and Figure 9).
In contrast, in the alluvial valley region (area with low confinement), quaternary formations predominate, and it is there where the trend may vary. The valley composition of the selected sites determines the channel width response. The Sinú and Cauca River valleys present the quaternary alluvium in both riverbanks; however, downstream of the Salvajina project, a graben structure (i.e., distinct escarpment on each riverbank caused by downward displacement) composed of terraces and colluvial exists. These material sequences generate channel confinement, a configuration that is not present downstream of the Urrá I project. This difference in the geological structure generates channel narrowing in the Cauca River valley and channel widening in the Sinú River valley (see Figure 8 and Figure 9). Downstream of the Betania project, the Magdalena River exhibits decreased channel widths through the valley up to 160 km, where the alluvial material interacts with consolidate rocks. The increased presence of unconsolidated materials and the end of a confined area, at 160 km downstream of the dam, determine the wider channels in that zone (see Figure 10). In Figure 11, three moments with similar discharges of a sector of the Magdalena River in which the channel width reduced by more than 50% are presented. Besides channel width reduction, in this figure, it is possible to identify how the dynamics of the reach considerably reduced, while maintaining a low-impacted flow regime (see the Purificación station regime in Figure 6).
Generally, in morphological studies downstream of dams, the information about the river width is measured at selected cross sections [7,23,24,28,30,31,32], but the morphological impacts due to dams cannot be analyzed in short distances [87,88]. Therefore, the use of GIS tools, as the one selected for this study (R package cmgo), allows covering long distances (until 240 km downstream in our case) to identify the real extent of the impacts. The geological information at a regional scale is compatible with the spatial resolution of free available imagery and DEMs, allowing identification of areas more susceptible to change and defining the extent of morphological alterations [76,89].

5.2. Upstream Dam Effects

Studies addressing the quantification of morphological changes upstream of dams are scarce and geographically limited. These studies have mainly developed conceptual models to identify the upstream effects of dams; among these, studies by Liro [12] and Lu et al. [16] were mainly based on the relationship between deposition and erosion. Specifically, Liro [12] described the effects of morphological changes on flooding. In general, morphological studies summarize upstream effects as bed aggradation and changes in the river profile (e.g., Csiki and Rhoads [90]). Our results suggest that reservoir operation and its geometrical characteristics, such as the valley confinement degree and slope, determine the magnitude and extent of the changes in channel morphology upstream of dams. Therefore, the geology of the forming materials seems to have an influence on the morphological long-term changes: wider and less sinuous channels were observed in zones with high erodibility as quaternary materials and fault zones (see Figure A1, Figure A2 and Figure A3 in Appendix D). However, we also showed that the change in the channel width in the upstream zone is 1 order of magnitude larger than in the downstream areas (see Table 4 and Appendix D).
In Figure 12, an example of these changes in the Magdalena River upstream of the Betania Dam is presented. This figure emphasizes that the geomorphology of the dam area is of paramount importance for determining long-term morphological effects. The drastic reduction in the reservoir levels observed in this figure between 1988 and 2020 allows us to see the important planform changes recorded in this area. Our methodology, and the morphological studies of these areas in general, is found to be highly relevant in flood risk reduction analyses.

5.3. Limitations

It is important to mention that our study addresses the downstream morphological impacts of dams at the reach scale, which can be useful in regional analyses; however, our approach is motivated but limited at the same time by information scarcity. Detailed data on sediment transport characteristics, land use, and land cover changes, as well as the channel shape and slope evolution, would have allowed us to reach more quantitative results. Additionally, the Global Erodibility Index (EI) used in this work was adjusted to a global scale, but the Colombian geological formations are slightly different. Field visits and laboratory tests may reinforce the application of the EI in the Colombian region. We assumed that all quaternary formations (unconsolidated materials) have the same EI, neglecting the sediment characteristics. Therefore, the quaternary formations must be better described for identifying lithologies and evaluating fluvial erodibility in morphology [28,91,92].

6. Conclusions

The magnitudes and trends of upstream and downstream morphological changes due to dam construction vary widely. In this contribution, the relationship between the geology of each river reach and the channel width and sinuosity response was addressed. For that purpose, the geology of the areas close to the river channel was correlated to the riverbank resistance through the Erodibility Index (EI). The selected dams are built on the fall line of Colombian rivers, considered an appropriate representative of tropical systems.
Although the hydrological alteration reported in the tropical rivers considered in this contribution is relatively low, the observed morphological changes are of considerable magnitude. The magnitude of these morphological changes can be related to the high sedimentological alteration, considering that none of the studied dams includes a sediment bypass. Therefore, the reduction in both the suspended and bed loads is almost complete downstream of the dam.
Downstream of dams, the geomorphological settings define the degree of confinement and riverbank resistance, key characteristics of defining the morphological trends and future behavior of river channels. Therefore, including the geological framework of the selected area may clarify the possible morphological response of the channel width, allowing identification of the more susceptible zones. This delimitation may be valuable in setting the study area for biotic compensation measures and environmental impact studies.
Upstream of dams, the geology of the forming materials also influences the morphological changes. The geometrical characteristics of the reservoir tail (valley confinement degree and transversal slope) and its operation determine the magnitude and extent of the changes in channel morphology.
Despite the high sediment transport rates of Colombian rivers (and tropical systems in general), which allow quick recovery of sediment loads, the morphological impacts downstream of dams can reach considerable lengths. This fact demonstrates the relevance of conducting morphological studies before dam construction, including the geological characteristics of the underlying materials, to consider the possible negative effects of such interventions.
The use of the geological information about the area of interest and its relationship with the Erodibility Index (EI) used in this research to estimate the riverbank resistance demonstrated its usefulness. This approach can also be used in the calibration of the erodibility coefficients required in morphodynamic modeling exercises to predict morphological changes upstream and downstream of dams.

Author Contributions

D.C.A. collected the data, performed calculations, analyzed the data, and wrote the main text of the manuscript. D.C.A., J.D.G.-O. and A.V.-L. prepared the layout of the research work. A.V.-L. supervised the overall activity and the progress of the manuscript construction. J.D.G.-O. and A.V.-L. commented on the manuscript and improved the language. All authors have read and agreed to the published version of the manuscript.

Funding

The authors express their gratitude to Pontificia Universidad Javeriana, which supported this research through the APC fundind (VRI support to promote the scientific paper writing). Also, Pontificia Universidad Javeriana gave financial support to purchase the aerial photos.

Institutional Review Board Statement

Not applicable.

Informed Consent Statement

Not applicable.

Data Availability Statement

Not applicable.

Acknowledgments

The authors thank the Corporación del Valle del Cauca (CVC) for supplying information about the hydrological stations downstream of the Salvajina Dam. The Pontificia Universidad Javeriana is also acknowledged for financial support to purchase the aerial photos used in this research.

Conflicts of Interest

The authors declare no conflict of interest.

Appendix A

Chronostratigraphic units’ description:
The chronostratigraphic units’ description was obtained from the Servicio Geológico Colombiano [45], and the unit coding is presented here:
k2k6Sm7
Age + Lithology + Terrain *
TuronianMaastrichtiense + Sedimentary marine + 7
* Terrain: Geological provinces of Colombia [72].
  • Urrá I dam area:
  • Q-al: Alluvial deposits and floodplains
  • Q-ca: Alluvial fans and colluvial deposits
  • n6n7-Sm: Intercalations of mudstones, calcareous arenites, and coarse-grained–conglomeratic quartz sandstone
  • n6n7-St: Conglomerate intercalations, medium–conglomerate lithic–sublithic arenites, calcareous arenites, and mudstones
  • n3n5-Sm: Fine–coarse-grained lithic and feldspathic sandstones with glauconite and calcareous shale intercalation with mudstones
  • n1n2-St: Medium-grained lithic–sublithic sandstones interstratified with mudstones, locally peat, charcoal, and sandy conglomerate lenses
  • e8n2-Sm: Limestone, sandstone, and calcareous mudstone
  • e8n2-St: Ferruginous fine-grained–conglomeratic sandstone intercalation with calcareous siltstone and coal
  • e3e4-Sm: Grain-decreasing lithic sandstones to conglomeratic–fine-grained sandstone intercalation with mudstones and micritic limestones
  • k2k6-Sm7: Claystones, muddy and lithic sandstones, cherts, limestone, tuffs and agglomerates, local cataclassites
  • Salvajina dam area:
  • Q-al: Alluvial deposits and floodplains
  • Q-ca: Alluvial fans and colluvial deposits
  • Q-t: Alluvial terraces
  • Q-Vc: Volcanoclastic flows made up of pyroclasts and epiclasts of andesitic composition
  • N2-P: Ash tuffs and lapilli intercalation with lavas of andesitic composition
  • N2-Vi: Lavas and ignimbrites of andesitic composition
  • n1n2-Pi: Quartzodiorites, tonalites, diorites, and granodiorites
  • N1-St: Claystones, siltstones, sandstones, and conglomerates
  • e6e7-Stm: Conglomerates, lithic muddy sandstones, quartz sandstones, siltstones, claystones, and coals
  • E3-St: Fine-grained quartz sandstones to conglomerate intercalation with conglomerates, mudstones, and coals
  • k2-Vm7: Tholeiitic basalts, dolerites, picrites, basics tuff, and volcanic breccias
  • k2k6-Sm7: Claystones, muddy and lithic sandstones, cherts, limestone, tuffs and agglomerates, local cataclassites
  • K1-Mbg6: Amphibolite schists and quartzites
  • Betania and Prado projects:
  • Q-al: Alluvial deposits and floodplains
  • Q-ca: Alluvial fans and colluvial deposits
  • Q-t: Alluvial terraces
  • Q2-Vc: Volcanoclastic flows constituted of pyroclasts and epiclasts of andesitic and dacitic composition
  • N2Q1-VCc: Felspathic sandstones, claystones, and conglomerates rich in lithics of andesites and dacites
  • n4n6-Sc: Lithic sandstones with intercalation of gray–green claystones and conglomerates
  • e6e9-Sc: Intercalations of red beds of conglomerates, lithic conglomeratic sandstones, and claystones
  • k6E1-Stm: Red claystones with intercalations of fine quartz sandstones, coal beds in the basin
  • b6k6-Stm: Intercalations of shales, limestones, sandstones, cherts, and phosphorites
  • b5b6-Sctm: Red conglomerates, feldesphatic sandstones and claystones, quartz sandstones, limestones and shales; in the top, ferruginous quartz and glauconites sandstones
  • J-Pi: Monzogranite from Algeciras and Stock of Ibagué
  • J-VCc: Tuffs, agglomerates, and lavas, occasionally intercalations of red beds of lithic sandstones and siltstones
Global Erodibility Index (EI):
  • 1.0—acid plutonic rocks, metamorphic rocks, and carbonate sedimentary rocks
  • 1.1—acid volcanic rocks
  • 1.2—mixed sedimentary rocks
  • 1.4—basic volcanic rocks; siliciclastic rocks of fine–medium grain sizes
  • 1.5—basic plutonic rocks, siliciclastic rocks of high variability in grain sizes
  • 3.2—unconsolidated sediments

Appendix B

Table A1. Images used in the study for the selected dams.
ProjectAerial PhotographsSatellite Images
FlightDateNameMissionDate
BetaniaC143112 September 1971
C18661 March 1973LT05_L1TP_008058_19850322Landsat 522 March 1985
C13439 December 1970LT04_L1TP_008058_19880322Landsat 422 March 1988
C151811 September 1974LT05_L1TP_008058_19981004Landsat 54 October 1998
C15645 March 1975LC08_L1TP_008058_20151019Landsat 819 October 2015
C125622 March 1969LC08_L1TP_008058_20200322Landsat 822 March 2020
C147017 November 1973
PradoC125622 March 1969LT05_L1TP_008057_19850322Landsat 522 March 1985
M139324 February 1966LT04_L1TP_008057_19880322Landsat 422 March 1988
M15229 March 1957LT05_L1TP_008057_19981004Landsat 54 October 1988
M15330 March 1957LC08_L71TP_008057_20151019Landsat 819 October 2015
LC08_L1TP_008057_20200322Landsat 822 March 2020
Urrá INo flightsLT05_L1TP_010054_19910321Landsat 521 March 1991
LT05_L1TP_010054_19980103Landsat 53 January 1998
AST_L1T_00301132007153521Aster13 January 2007
LC08_L1TP_010054_20181228Landsat 828 December 2018
S1B_IW_GRDH_1SDV_20200Sentinel 1B11 January 2020
111T104920
SalvajinaC142116 March 1972LT05_L1TP_009057_19840902Landsat 52 September 1984
C151811 September 1974LT04_L1TP_009058_19880516Landsat 416 May 1988
M109814 August 1961AST_L1T_00301292007153659Aster29 January 2007
M146714 August 1961LC08_L1TP_009058_20190818Landsat 818 August 2019

Appendix C

Table A2. Comparison of monthly discharges in pre-dam and post-dam periods at each flow gauging station. The values are the p-values of Student´s t-test and Fisher´s F-test. The p-values below α = 0.05 are bolded.
IDTESTJanuaryFebruaryMarchAprilMayJuneJulyAugustSeptemberOctoberNovemberDecember
b1T0.010.000.000.130.570.660.910.570.900.630.900.25
F0.910.740.740.890.390.020.390.020.340.370.020.31
b2T0.010.010.000.150.550.670.680.840.610.690.910.21
F0.920.660.770.960.440.020.030.230.090.350.000.26
b3T0.100.060.020.090.530.870.360.810.680.480.040.68
F0.720.640.410.810.980.630.540.180.530.000.820.46
b4T0.530.000.000.010.760.700.120.250.110.000.000.49
F0.040.390.150.430.970.690.320.370.280.000.280.18
b5T0.630.040.000.000.490.620.870.620.820.060.040.59
F0.560.010.760.020.470.970.720.020.140.020.600.05
b6T0.000.020.000.010.250.020.240.360.300.900.930.17
F0.950.420.200.980.530.030.130.470.440.190.700.43
c1T0.710.430.850.000.000.030.750.050.080.160.020.48
F0.940.960.350.190.250.600.480.000.410.260.730.19
c2T0.470.230.750.190.020.130.350.000.010.980.420.63
F0.310.360.670.740.340.690.230.020.450.920.510.03
c3T0.410.560.560.660.020.180.20.000.000.050.000.45
F0.760.500.830.930.650.000.260.500.070.030.600.38
d1T0.250.290.150.820.960.650.270.500.510.020.070.44
F0.890.810.420.250.070.760.020.590.370.080.140.01
d2T0.950.590.820.150.110.380.440.720.060.000.280.88
F0.150.980.860.710.730.730.530.920.690.820.660.29
d3T0.070.120.010.660.800.300.700.610.780.040.240.08
F0.900.910.320.200.470.340.080.720.550.180.420.06
d4T0.770.990.180.520.320.700.310.470.080.010.000.29
F0.880.470.300.730.620.730.500.990.710.020.680.08
Table A3. Comparison of monthly precipitation in pre-dam and post-dam periods at each project basin. The values are the p-values of Student´s t-test and Fisher´s F-test. The p-values below α = 0.05 are bolded.
BASINTESTJanuaryFebruaryMarchAprilMayJuneJulyAugustSeptemberOctoberNovemberDecember
BetaniaT0.330.960.800.640.580.690.010.530.440.350.730.05
F0.740.150.390.680.100.250.270.070.780.490.070.82
SalvajinaT0.360.660.110.250.890.650.000.260.460.060.100.40
F0.070.340.650.900.700.080.010.100.780.010.420.39
Urrá IT0.950.110.480.880.300.480.150.540.000.780.220.61
F0.420.290.490.020.800.970.930.510.460.270.500.43
Table A4. Comparison of downstream gauging station annual flow. The flow values are the average of minimum (MIN), median (MED), and maximum (MAX) annual discharges at each station. In addition, the p-values of Kolmogorov–Smirnov (KS) and Mann–Whitney (MW) tests are shown. The p-values below α = 0.05 are bolded.
ProjectStationAnnual ValueAverage
Discharge (m³/s)
KS
p-Value
MW
p-Value
Pre-DamPost-Dam
Urrá IEl ToroMin71810.060.16
Med3483280.960.48
Max9537590.060.04
CarrizolaMin791170.490.24
Med3293530.700.92
Max8468030.880.72
Nueva
Colombia
Min74890.010.05
Med3473540.910.98
Max8208020.440.70
MonteríaMin69970.010.02
Med3763570.900.57
Max8767810.010.01
Sabana NuevaMin78920.040.22
Med3523480.800.87
Max7146860.760.89
Palma
Central
Min721130.000.01
Med3524120.070.05
Max6206420.860.42
SalvajinaLa BalsaMin67660.7980.592
Med2041770.9830.817
Max5424240.1440.023
TablancaMin58770.8580.654
Med1981940.440.196
Max5764470.2770.793
La BolsaMin681050.0080.02
Med2332320.4580.313
Max6355370.2120.062
Betania and PradoPuente
Santander
Min1531620.7980.592
Med4884870.9830.817
Max179614960.1440.023
AngosturaMin2352180.8580.654
Med6576030.440.196
Max200718290.2770.793
PurificaciónMin2162730.0080.02
Med7447900.4580.313
Max259123920.2120.062
NariñoMin4564040.6250.486
Med115311380.9770.986
Max356331470.2790.093

Appendix D

Schematic plots showing upstream morphological changes due to the reservoir construction in each study site.
Figure A1. Morphological changes upstream of the Urrá I Dam across Verde and Sinú Rivers: (a) confinement grade, (b) geological units near the rivers, (c) Erodibility Index (EI) on the left and right sides of the river channel (RC) and faults (----), (d) river sinuosity change as a percentage with respect to the pre-dam year 1998, and (e) river width change as a percentage with respect to the pre-dam year 1998.
Applsci 13 07109 g0a1
Figure A2. Morphological changes upstream of the Salvajina Dam: (a) confinement grade, (b) geological units near the Cauca River, (c) Erodibility Index (EI) on the left and right sides of the river channel (RC), (d) sites near the river, (e) river sinuosity change as a percentage with respect to the pre-dam year 1961, and (f) river width change as a percentage with respect to the pre-dam year 1961.
Applsci 13 07109 g0a2
Figure A3. Morphological changes upstream of the Betania Dam across the Yaguara River and the Magdalena River: (a) confinement grade, (b) geological units near the rivers, (c) Erodibility Index (EI) on the left and right sides of the river channel (RC), (d) river sinuosity change as a percentage with respect to the pre-dam year 1970, and (e) river width change as a percentage with respect to the pre-dam year 1970.
Applsci 13 07109 g0a3

References

  1. Friedl, G.; Wüest, A. Disrupting Biogeochemical Cycles—Consequences of Damming. Aquat. Sci. 2002, 64, 55–65. [Google Scholar] [CrossRef]
  2. Csiki, S.; Rhoads, B.L. Hydraulic and Geomorphological Effects of Run-of-River Dams. Prog. Phys. Geogr. Earth Environ. 2010, 34, 755–780. [Google Scholar] [CrossRef]
  3. Gordon, E.; Meentemeyer, R.K. Effects of Dam Operation and Land Use on Stream Channel Morphology and Riparian Vegetation. Geomorphology 2006, 82, 412–429. [Google Scholar] [CrossRef]
  4. Skalak, K.J.; Benthem, A.J.; Schenk, E.R.; Hupp, C.R.; Galloway, J.M.; Nustad, R.A.; Wiche, G.J. Large Dams and Alluvial Rivers in the Anthropocene: The Impacts of the Garrison and Oahe Dams on the Upper Missouri River. Anthropocene 2013, 2, 51–64. [Google Scholar] [CrossRef]
  5. Baena-Escudero, R.; Guerrero-Amador, I.C.; Rinaldi, M.; González-Sayago, A. Hydrological and Geomorphic Effects Upstream of the Cantillana Dam along the Guadalquivir River (Southern Spain). Geomorphology 2021, 388, 107786. [Google Scholar] [CrossRef]
  6. Liro, M. Development of Sediment Slug Upstream from the Czorsztyn Reservoir (Southern Poland) and Its Interaction with River Morphology. Geomorphology 2016, 253, 225–238. [Google Scholar] [CrossRef]
  7. Brandt, S.A. Classification of Geomorphological Effects Downstream of Dams. CATENA 2000, 40, 375–401. [Google Scholar] [CrossRef]
  8. Williams, G.P.; Wolman, M.G. Downstream Effects of Dams on Alluvial Rivers; United States Geological Survey (USGS): Washington, DC, USA, 1984; pp. 1–94.
  9. Liu, X.; Wu, R.; Chen, X.; Zhou, Y.; Yang, L.; Ouyang, S.; Wu, X. Effects of Dams and Their Environmental Impacts on the Genetic Diversity and Connectivity of Freshwater Mussel Populations in Poyang Lake Basin, China. Freshw. Biol. 2020, 65, 264–277. [Google Scholar] [CrossRef]
  10. Stanley, E.H. Chapter 15—Understanding Ecosystem Effects of Dams. In Fundamentals of Ecosystem Science, 2nd ed.; Weathers, K.C., Strayer, D.L., Likens, G.E., Eds.; Academic Press: Cambridge, MA, USA, 2021; pp. 287–291. ISBN 978-0-12-812762-9. [Google Scholar]
  11. Evans, J.E.; Huxley, J.M.; Vincent, R.K. Upstream Channel Changes following Dam Construction and Removal Using a GIS/Remote Sensing Approach. J. Am. Water Resour. Assoc. 2007, 43, 683–697. [Google Scholar] [CrossRef]
  12. Liro, M. Conceptual Model for Assessing the Channel Changes Upstream Form Dam Reservoir. Quaest. Geogr. 2014, 33, 61–74. [Google Scholar] [CrossRef] [Green Version]
  13. Liro, M. Dam Reservoir Backwater as a Field-Scale Laboratory of Human-Induced Changes in River Biogeomorphology: A Review Focused on Gravel-Bed Rivers. Sci. Total Environ. 2019, 651, 2899–2912. [Google Scholar] [CrossRef] [PubMed]
  14. Maddock, T., Jr. Behaviour of Channels Upstream from Reservoirs. Int. Assoc. Sci. Hydrol. Publ. 1966, 71, 812–823. [Google Scholar]
  15. Petts, G.E. Long-Term Consequences of Upstream Impoundment. Environ. Conserv. 1980, 7, 325–332. [Google Scholar] [CrossRef]
  16. Lu, Y.; Zuo, L.; Ji, R.; Liu, H. Deposition and Erosion in the Fluctuating Backwater Reach of the Three Gorges Project after Upstream Reservoir Adjustment. Int. J. Sediment Res. 2010, 25, 64–80. [Google Scholar] [CrossRef]
  17. Grant, G.E. The Geomorphic Response of Gravel-Bed Rivers to Dams: Perspectives and Prospects. In Gravel-Bed Rivers; John Wiley & Sons, Ltd.: Hoboken, NJ, USA, 2012; pp. 165–181. ISBN 978-1-119-95249-7. [Google Scholar]
  18. Kondolf, G.M.; Gao, Y.; Annandale, G.W.; Morris, G.L.; Jiang, E.; Zhang, J.; Cao, Y.; Carling, P.; Fu, K.; Guo, Q.; et al. Sustainable Sediment Management in Reservoirs and Regulated Rivers: Experiences from Five Continents. Earths Future 2014, 2, 256–280. [Google Scholar] [CrossRef]
  19. Graf, W.L. Downstream Hydrologic and Geomorphic Effects of Large Dams on American Rivers. Geomorphology 2006, 79, 336–360. [Google Scholar] [CrossRef]
  20. Surian, N.; Cisotto, A. Channel Adjustments, Bedload Transport and Sediment Sources in a Gravel-Bed River, Brenta River, Italy. Earth Surf. Process. Landf. 2007, 32, 1641–1656. [Google Scholar] [CrossRef]
  21. Surian, N.; Rinaldi, M. Morphological Response to River Engineering and Management in Alluvial Channels in Italy. Geomorphology 2003, 50, 307–326. [Google Scholar] [CrossRef]
  22. Lu, X.X.; Siew, R.Y. Water Discharge and Sediment Flux Changes over the Past Decades in the Lower Mekong River: Possible Impacts of the Chinese Dams. Hydrol. Earth Syst. Sci. 2006, 10, 181–195. [Google Scholar] [CrossRef] [Green Version]
  23. Hadley, R.F.; Emmett, W.W. Channel Changes Downstream from a Dam. JAWRA J. Am. Water Resour. Assoc. 1998, 34, 629–637. [Google Scholar] [CrossRef]
  24. Yang, S.L.; Milliman, J.D.; Xu, K.H.; Deng, B.; Zhang, X.Y.; Luo, X.X. Downstream Sedimentary and Geomorphic Impacts of the Three Gorges Dam on the Yangtze River. Earth-Sci. Rev. 2014, 138, 469–486. [Google Scholar] [CrossRef]
  25. Rennie, C.D.; Church, M.; Venditti, J.G. Rock Control of River Geometry: The Fraser Canyons. J. Geophys. Res. Earth Surf. 2018, 123, 1860–1878. [Google Scholar] [CrossRef]
  26. Jain, V.; Fryirs, K.; Brierley, G. Where Do Floodplains Begin? The Role of Total Stream Power and Longitudinal Profile Form on Floodplain Initiation Processes. GSA Bull. 2008, 120, 127–141. [Google Scholar] [CrossRef] [Green Version]
  27. Słowik, M.; Dezső, J.; Marciniak, A.; Tóth, G.; Kovács, J. Evolution of River Planforms Downstream of Dams: Effect of Dam Construction or Earlier Human-Induced Changes? Earth Surf. Process. Landf. 2018, 43, 2045–2063. [Google Scholar] [CrossRef]
  28. Jiongxin, X. Channel Pattern Change Downstream from a Reservoir: An Example of Wandering Braided Rivers. Geomorphology 1996, 15, 147–158. [Google Scholar] [CrossRef]
  29. Chong, X.Y.; Vericat, D.; Batalla, R.J.; Teo, F.Y.; Lee, K.S.P.; Gibbins, C.N. A Review of the Impacts of Dams on the Hydromorphology of Tropical Rivers. Sci. Total Environ. 2021, 794, 148686. [Google Scholar] [CrossRef]
  30. Grant, G.E.; Schmidt, J.C.; Lewis, S.L. A Geological Framework for Interpreting Downstream Effects of Dams on Rivers. In A Peculiar River; American Geophysical Union (AGU): Washington, DC, USA, 2003; pp. 203–219. ISBN 978-1-118-66573-2. [Google Scholar]
  31. Smith, N.D.; Morozova, G.S.; Pérez-Arlucea, M.; Gibling, M.R. Dam-Induced and Natural Channel Changes in the Saskatchewan River below the E.B. Campbell Dam, Canada. Geomorphology 2016, 269, 186–202. [Google Scholar] [CrossRef] [Green Version]
  32. Takahashi, M.; Nakamura, F. Impacts of Dam-Regulated Flows on Channel Morphology and Riparian Vegetation: A Longitudinal Analysis of Satsunai River, Japan. Landsc. Ecol. Eng. 2011, 7, 65–77. [Google Scholar] [CrossRef]
  33. Cluett, L.J.; Radford, B.T.M. Downstream Morphological Change in Response to Dam Construction: A GIS Based Approach for the Lower Ord River, Western Australia. Water Sci. Technol. 2003, 48, 1–8. [Google Scholar] [CrossRef]
  34. Leopold, L.B.; Maddock, T., Jr. The Hydraulic Geometry of Stream Channels and Some Physiographic Implications; United States Geological Survey: Washington, DC, USA, 1953; pp. 1–57.
  35. Leopold, L.B.; Wolman, M.G. River Channel Patterns: Braided, Meandering, and Straight; United States Geological Survey: Washington, DC, USA, 1957; pp. 39–85.
  36. Booker, D.J. Predicting Wetted Width in Any River at Any Discharge. Earth Surf. Process. Landf. 2010, 35, 828–841. [Google Scholar] [CrossRef]
  37. Vargas-Luna, A.; Crosato, A.; Byishimo, P.; Uijttewaal, W.S.J. Impact of Flow Variability and Sediment Characteristics on Channel Width Evolution in Laboratory Streams. J. Hydraul. Res. 2019, 57, 51–61. [Google Scholar] [CrossRef] [Green Version]
  38. Gardner, T.A.; Von Hase, A.; Brownlie, S.; Ekstrom, J.M.M.; Pilgrim, J.D.; Savy, C.E.; Stephens, R.T.T.; Treweek, J.; Ussher, G.T.; Ward, G.; et al. Biodiversity Offsets and the Challenge of Achieving No Net Loss. Conserv. Biol. J. Soc. Conserv. Biol. 2013, 27, 1254–1264. [Google Scholar] [CrossRef] [PubMed]
  39. Harman, W.; Starr, R.; Carter, M.; Tweedy, K.; Clemmons, M.; Suggs, K.; Miller, C. A Function-Based Framework for Stream Assessment and Restoration Projects; United States Environmental Protection Agency (EPA), Office of Wetlands, Oceans and Watersheds: Washington, DC, USA, 2012; p. 344.
  40. Baez-Villanueva, O.M.; Zambrano-Bigiarini, M.; Ribbe, L.; Nauditt, A.; Giraldo-Osorio, J.D.; Thinh, N.X. Temporal and Spatial Evaluation of Satellite Rainfall Estimates over Different Regions in Latin-America. Atmos. Res. 2018, 213, 34–50. [Google Scholar] [CrossRef]
  41. Giraldo-Osorio, J.D.; Trujillo-Osorio, D.E.; Baez-Villanueva, O.M. Analysis of ENSO-Driven Variability, and Long-Term Changes, of Extreme Precipitation Indices in Colombia, Using the Satellite Rainfall Estimates CHIRPS. Water 2022, 14, 1733. [Google Scholar] [CrossRef]
  42. Restrepo, J.D.; Kettner, A.J.; Syvitski, J.P.M. Recent Deforestation Causes Rapid Increase in River Sediment Load in the Colombian Andes. Anthropocene 2015, 10, 13–28. [Google Scholar] [CrossRef]
  43. Restrepo, J.D.; Escobar, H.A. Sediment Load Trends in the Magdalena River Basin (1980–2010): Anthropogenic and Climate-Induced Causes. Geomorphology 2018, 302, 76–91. [Google Scholar] [CrossRef]
  44. Gutiérrez Rodríguez, H. Central Hidroeléctrica del río Prado: Nota Preliminar; Instituto de Aprovechamiento de Aguas y Fomento Eléctrico—Servicio Geológico Colombiano (SGC): Bogotá, Colombia, 1959; p. 15.
  45. ICEL. Propuesta para la Ejecución de la Central Hidroeléctrica de Betania; Instituto Colombiano de Energía Eléctrica (ICEL)—Ministerio de Minas y Energía: Bogotá, Colombia, 1978; p. 66.
  46. Mazuera González, Ó.E. Proyecto de Regulación del río Cauca; Corporacion Autonoma Regional del Valle del Cauca (CVC): Cali, Colombia, 1972; p. 219.
  47. Congreso de Colombia. Fundamentos de la Política Ambiental Colombiana; República de Colombia: Bogotá, Colombia, 1993; p. 47.
  48. Muñoz-Sabater, J. ERA5-Land Monthly Averaged Data from 1950 to Present. Copernicus Climate Change Service (C3S) Climate Data Store (CDS) 2019. Available online: https://cds.climate.copernicus.eu/cdsapp#!/dataset/reanalysis-era5-land-monthly-means (accessed on 15 May 2023).
  49. Zuo, Q.; Liang, S. Effects of Dams on River Flow Regime Based on IHA/RVA. Proc. IAHS 2015, 368, 275–280. [Google Scholar] [CrossRef] [Green Version]
  50. Šarauskienė, D.; Adžgauskas, G.; Kriaučiūnienė, J.; Jakimavičius, D. Analysis of Hydrologic Regime Changes Caused by Small Hydropower Plants in Lowland Rivers. Water 2021, 13, 1961. [Google Scholar] [CrossRef]
  51. Song, X.; Zhuang, Y.; Wang, X.; Li, E.; Zhang, Y.; Lu, X.; Yang, J.; Liu, X. Analysis of Hydrologic Regime Changes Caused by Dams in China. J. Hydrol. Eng. 2020, 25, 05020003. [Google Scholar] [CrossRef]
  52. Meitzen, K.M. Stream Flow Changes across North Carolina (USA) 1955–2012 with Implications for Environmental Flow Management. Geomorphology 2016, 252, 171–184. [Google Scholar] [CrossRef]
  53. Yaghmaei, H.; Sadeghi, S.H.; Moradi, H.; Gholamalifard, M. Effect of Dam Operation on Monthly and Annual Trends of Flow Discharge in the Qom Rood Watershed, Iran. J. Hydrol. 2018, 557, 254–264. [Google Scholar] [CrossRef]
  54. Dahmen, E.R.; Hall, M.J. Screening of Hydrological Data: Tests for Stationarity and Relative Consistency; ILRI Publication; International Institute for Land Reclamation and Improvement: Wageningen, The Netherlands, 1990; ISBN 978-90-70754-23-5. [Google Scholar]
  55. Mathias Kondolf, G.; Batalla, R.J. Chapter 11 Hydrological Effects of Dams and Water Diversions on Rivers of Mediterranean-Climate Regions: Examples from California. In Developments in Earth Surface Processes; Catchment Dynamics and River Processes; Garcia, C., Batalla, R.J., Eds.; Elsevier: Amsterdam, The Netherlands, 2005; Volume 7, pp. 197–211. [Google Scholar]
  56. Zhang, W.; Mu, S.; Zhang, Y.; Chen, K. Seasonal and Interannual Variations of Flow Discharge from Pearl River into Sea. Water Sci. Eng. 2012, 5, 399–409. [Google Scholar] [CrossRef]
  57. Ali, R.; Ismael, A.; Heryansyah, A.; Nawaz, N. Long Term Historic Changes in the Flow of Lesser Zab River, Iraq. Hydrology 2019, 6, 22. [Google Scholar] [CrossRef] [Green Version]
  58. Cunnane, C. Statistical Distributions for Flood Frequency Analysis; Operational Hydrology Report (OHR); Secretariat of the World Meteorological Organization: Geneva, Switzerland, 1989; ISBN 978-92-63-10718-3. [Google Scholar]
  59. Da Silva, R.M.; Santos, C.A.G.; Moreira, M.; Corte-Real, J.; Silva, V.C.L.; Medeiros, I.C. Rainfall and River Flow Trends Using Mann–Kendall and Sen’s Slope Estimator Statistical Tests in the Cobres River Basin. Nat. Hazards 2015, 77, 1205–1221. [Google Scholar] [CrossRef]
  60. Barajas Ibañez, H.; Leiva Fonseca, P.A. Evaluación del Cambio Morfológico y Sedimentológico del Cauce del Río Sinú Aguas Abajo de la presa del Embalse Urrá Asociados a su Construcción y Operación. Bachelor’s Thesis, Universidad de La Salle, Bogotá, Colombia, 2016. [Google Scholar]
  61. Arandia Suárez, A. Estimación de los Cambios Hidrológicos, Sedimentológicos y Morfológicos en ríos Aluviales Intervenidos por Presas de Gran Altura. Master’s Thesis, Universidad de Los Andes, Bogotá, Colombia, 2018. [Google Scholar]
  62. Laverde Mesa, L. Evaluación del Impacto de los Embalses por Retención de Sedimentos Sobre la Morfología del Cauce del Río Magdalena Mediante el Análisis de Tramos Representativos en el Comportamiento Sedimentológico Entre el Embalse de Betania y el Municipio de Regidor. Bachelor’s Thesis, Universidad de La Salle, Bogotá, Colombia, 2016. [Google Scholar]
  63. Ramírez Callejas, C.A.; Bocanegra Vinasco, R.A.; Sandoval García, M.C. La carga sedimentaria en el río Cauca en su alto valle geográfico. Ing. Recur. Nat. Ambiente 2009, 8, 68–82. [Google Scholar]
  64. CVC; Universidad del Valle. Caracterización del río Cauca y Tributarios: Tramo Salvajina—La Virginia; Universidad del Valle: Santiago de Cali, Colombia; Corporación Autónoma Regional del Valle del Cauca (CVC): Santiago de Cali, Colombia, 2001; p. 116. [Google Scholar]
  65. Donovan, M.; Belmont, P.; Notebaert, B.; Coombs, T.; Larson, P.; Souffront, M. Accounting for Uncertainty in Remotely-Sensed Measurements of River Planform Change. Earth-Sci. Rev. 2019, 193, 220–236. [Google Scholar] [CrossRef]
  66. Pogson, M.; Smith, P. Effect of Spatial Data Resolution on Uncertainty. Environ. Model. Softw. 2015, 63, 87–96. [Google Scholar] [CrossRef] [Green Version]
  67. Bruno, L.O. GRASS: A Free and Open Source Solution for Hydrographic Body Analysis. Nativa 2017, 5, 24–30. [Google Scholar] [CrossRef]
  68. Xu, H. Modification of Normalised Difference Water Index (NDWI) to Enhance Open Water Features in Remotely Sensed Imagery. Int. J. Remote Sens. 2006, 27, 3025–3033. [Google Scholar] [CrossRef]
  69. Filipponi, F. Sentinel-1 GRD Preprocessing Workflow. Proceedings 2019, 18, 11. [Google Scholar] [CrossRef] [Green Version]
  70. Zhang, W.; Hu, B.; Brown, G.S. Automatic Surface Water Mapping Using Polarimetric SAR Data for Long-Term Change Detection. Water 2020, 12, 872. [Google Scholar] [CrossRef] [Green Version]
  71. Golly, A.; Turowski, J.M. Deriving Principal Channel Metrics from Bank and Long-Profile Geometry with the R Package Cmgo. Earth Surf. Dyn. 2017, 5, 557–570. [Google Scholar] [CrossRef] [Green Version]
  72. Gómez Tapias, J.; Montes Ramírez, N.E.; Nivia Guevara, Á.; Diederix, H. Mapa Geológico de Colombia 2015. Available online: https://www2.sgc.gov.co/MGC/Paginas/mgc_1M2015.aspx (accessed on 10 May 2023).
  73. Zondervan, J.R.; Stokes, M.; Boulton, S.J.; Telfer, M.W.; Mather, A.E. Rock Strength and Structural Controls on Fluvial Erodibility: Implications for Drainage Divide Mobility in a Collisional Mountain Belt. Earth Planet. Sci. Lett. 2020, 538, 116221. [Google Scholar] [CrossRef] [Green Version]
  74. Sklar, L.S.; Dietrich, W.E. Sediment and Rock Strength Controls on River Incision into Bedrock. Geology 2001, 29, 1087–1090. [Google Scholar] [CrossRef]
  75. Moosdorf, N.; Cohen, S.; von Hagke, C. A Global Erodibility Index to Represent Sediment Production Potential of Different Rock Types. Appl. Geogr. 2018, 101, 36–44. [Google Scholar] [CrossRef]
  76. Fryirs, K.A.; Wheaton, J.M.; Brierley, G.J. An Approach for Measuring Confinement and Assessing the Influence of Valley Setting on River Forms and Processes. Earth Surf. Process. Landf. 2016, 41, 701–710. [Google Scholar] [CrossRef]
  77. Poveda, G.; Mesa, O.J. On the Existence of Lloró (the Rainiest Locality on Earth): Enhanced Ocean-Land-Atmosphere Interaction by a Low-Level Jet. Geophys. Res. Lett. 2000, 27, 1675–1678. [Google Scholar] [CrossRef] [Green Version]
  78. Quintero Camacho, W. Informe Preliminar de Áreas de Interés Regional para Encontrar Yacimientos de Hidrocarburos no Convencionales (Shale Gas), a Partir de Información Geofísica (Magnetometría y Gravimetría) en la Cuenca del Sinú—San Jacinto; Servicio Geológico Colombiano (SGC): Bogotá, Colombia, 2016; p. 18.
  79. Barbosa Camacho, G. Memoria Explicativa: Mapa Geológico del Departamento del Cauca; Instituto de Investigación e Información Geocientífica, Minero-Ambiental y Nuclear (INGEOMINAS)—Servicio Geológico Colombiano (SGC): Santiago de Cali, Colombia, 2003; p. 221.
  80. Núñez Tello, A.; Ferreira Vesga, P.; Rodríguez, M.Á. Levantamiento Geológico de la Plancha 323, Neiva, Huila; Instituto de Investigación e Información Geocientífica, Minero-Ambiental y Nuclear (INGEOMINAS)—Servicio Geológico Colombiano (SGC): Bogotá, Colombia, 2002; p. 94.
  81. Mojica, J.; Franco, R. Estructura y evolución tectónica del valle medio y superior del Magdalena, Colombia. Geol. Colomb. 1990, 17, 41–64. [Google Scholar]
  82. Villarroael, C.A.; Setoguchi, T.; Brieva, J.; Macía, C. Geology of the La Tatacoa “Desert” (Huila, Colombia): Precisions on the Stratigraphy of the Honda Group, the Evolution of the “Pata High” and the Presence of the La Venta Fauna. Mem. Fac. Sci. Kyoto Univ. Ser. Geol. Mineral. 1996, 58, 41–66. [Google Scholar]
  83. Armenta Porras, G.E. Análisis detallado del Efecto Foehn generado por la Cordillera Oriental en el Alto Magdalena (Huila y Tolima). Master’s Thesis, Universidad Nacional de Colombia, Bogotá, Colombia, 2013. [Google Scholar]
  84. Dill, H.G.; Andrei, B.; Sorin-Ionut, B.; Kristian, U.; Jorge, G.T.; Daniel, B.; Thomas, C. The “Badland Trilogy” of the Desierto de La Tatacoa, Upper Magdalena Valley, Colombia, a Result of Geodynamics and Climate: With a Review of Badland Landscapes. CATENA 2020, 194, 104696. [Google Scholar] [CrossRef]
  85. Kammer, A.; Piraquive Bermúdez, A. Evidencias sedimentológicas y estructurales para un origen paleógeno de la Falla de Chusma, Valle Superior del Magdalena, borde occidental de la sub-cuenca de Neiva. Geol. Colomb. 2013, 38, 43–64. [Google Scholar]
  86. Barjasteh, A. Influence of Geological Structure on Dam Behavior and Case Studies. In Dam Engineering; Mudanya Üniversitesi: Bursa, Turkey, 2019; p. 106. ISBN 978-1-78985-480-0. [Google Scholar]
  87. Nelson, N.C.; Erwin, S.O.; Schmidt, J.C. Spatial and Temporal Patterns in Channel Change on the Snake River Downstream from Jackson Lake Dam, Wyoming. Geomorphology 2013, 200, 132–142. [Google Scholar] [CrossRef]
  88. Adib, A.; Foladfar, H.; Roozy, A. Role of Construction of Large Dams on River Morphology (Case Study: The Karkheh Dam in Iran). Arab. J. Geosci. 2016, 9, 661. [Google Scholar] [CrossRef]
  89. O’Brien, G.R.; Wheaton, J.M.; Fryirs, K.; Macfarlane, W.W.; Brierley, G.; Whitehead, K.; Gilbert, J.; Volk, C. Mapping Valley Bottom Confinement at the Network Scale. Earth Surf. Process. Landf. 2019, 44, 1828–1845. [Google Scholar] [CrossRef] [Green Version]
  90. Csiki, S.J.; Rhoads, B.L. Influence of Four Run-of-River Dams on Channel Morphology and Sediment Characteristics in Illinois, USA. Geomorphology 2014, 206, 215–229. [Google Scholar] [CrossRef]
  91. Turowski, J.M. Alluvial Cover Controlling the Width, Slope and Sinuosity of Bedrock Channels. Earth Surf. Dyn. 2018, 6, 29–48. [Google Scholar] [CrossRef] [Green Version]
  92. Schumm, S.A.; Dumont, J.F.; Holbrook, J.M. Active Tectonics and Alluvial Rivers; Cambridge University Press: New York, NY, USA, 2002; ISBN 978-0-521-89058-8. [Google Scholar]
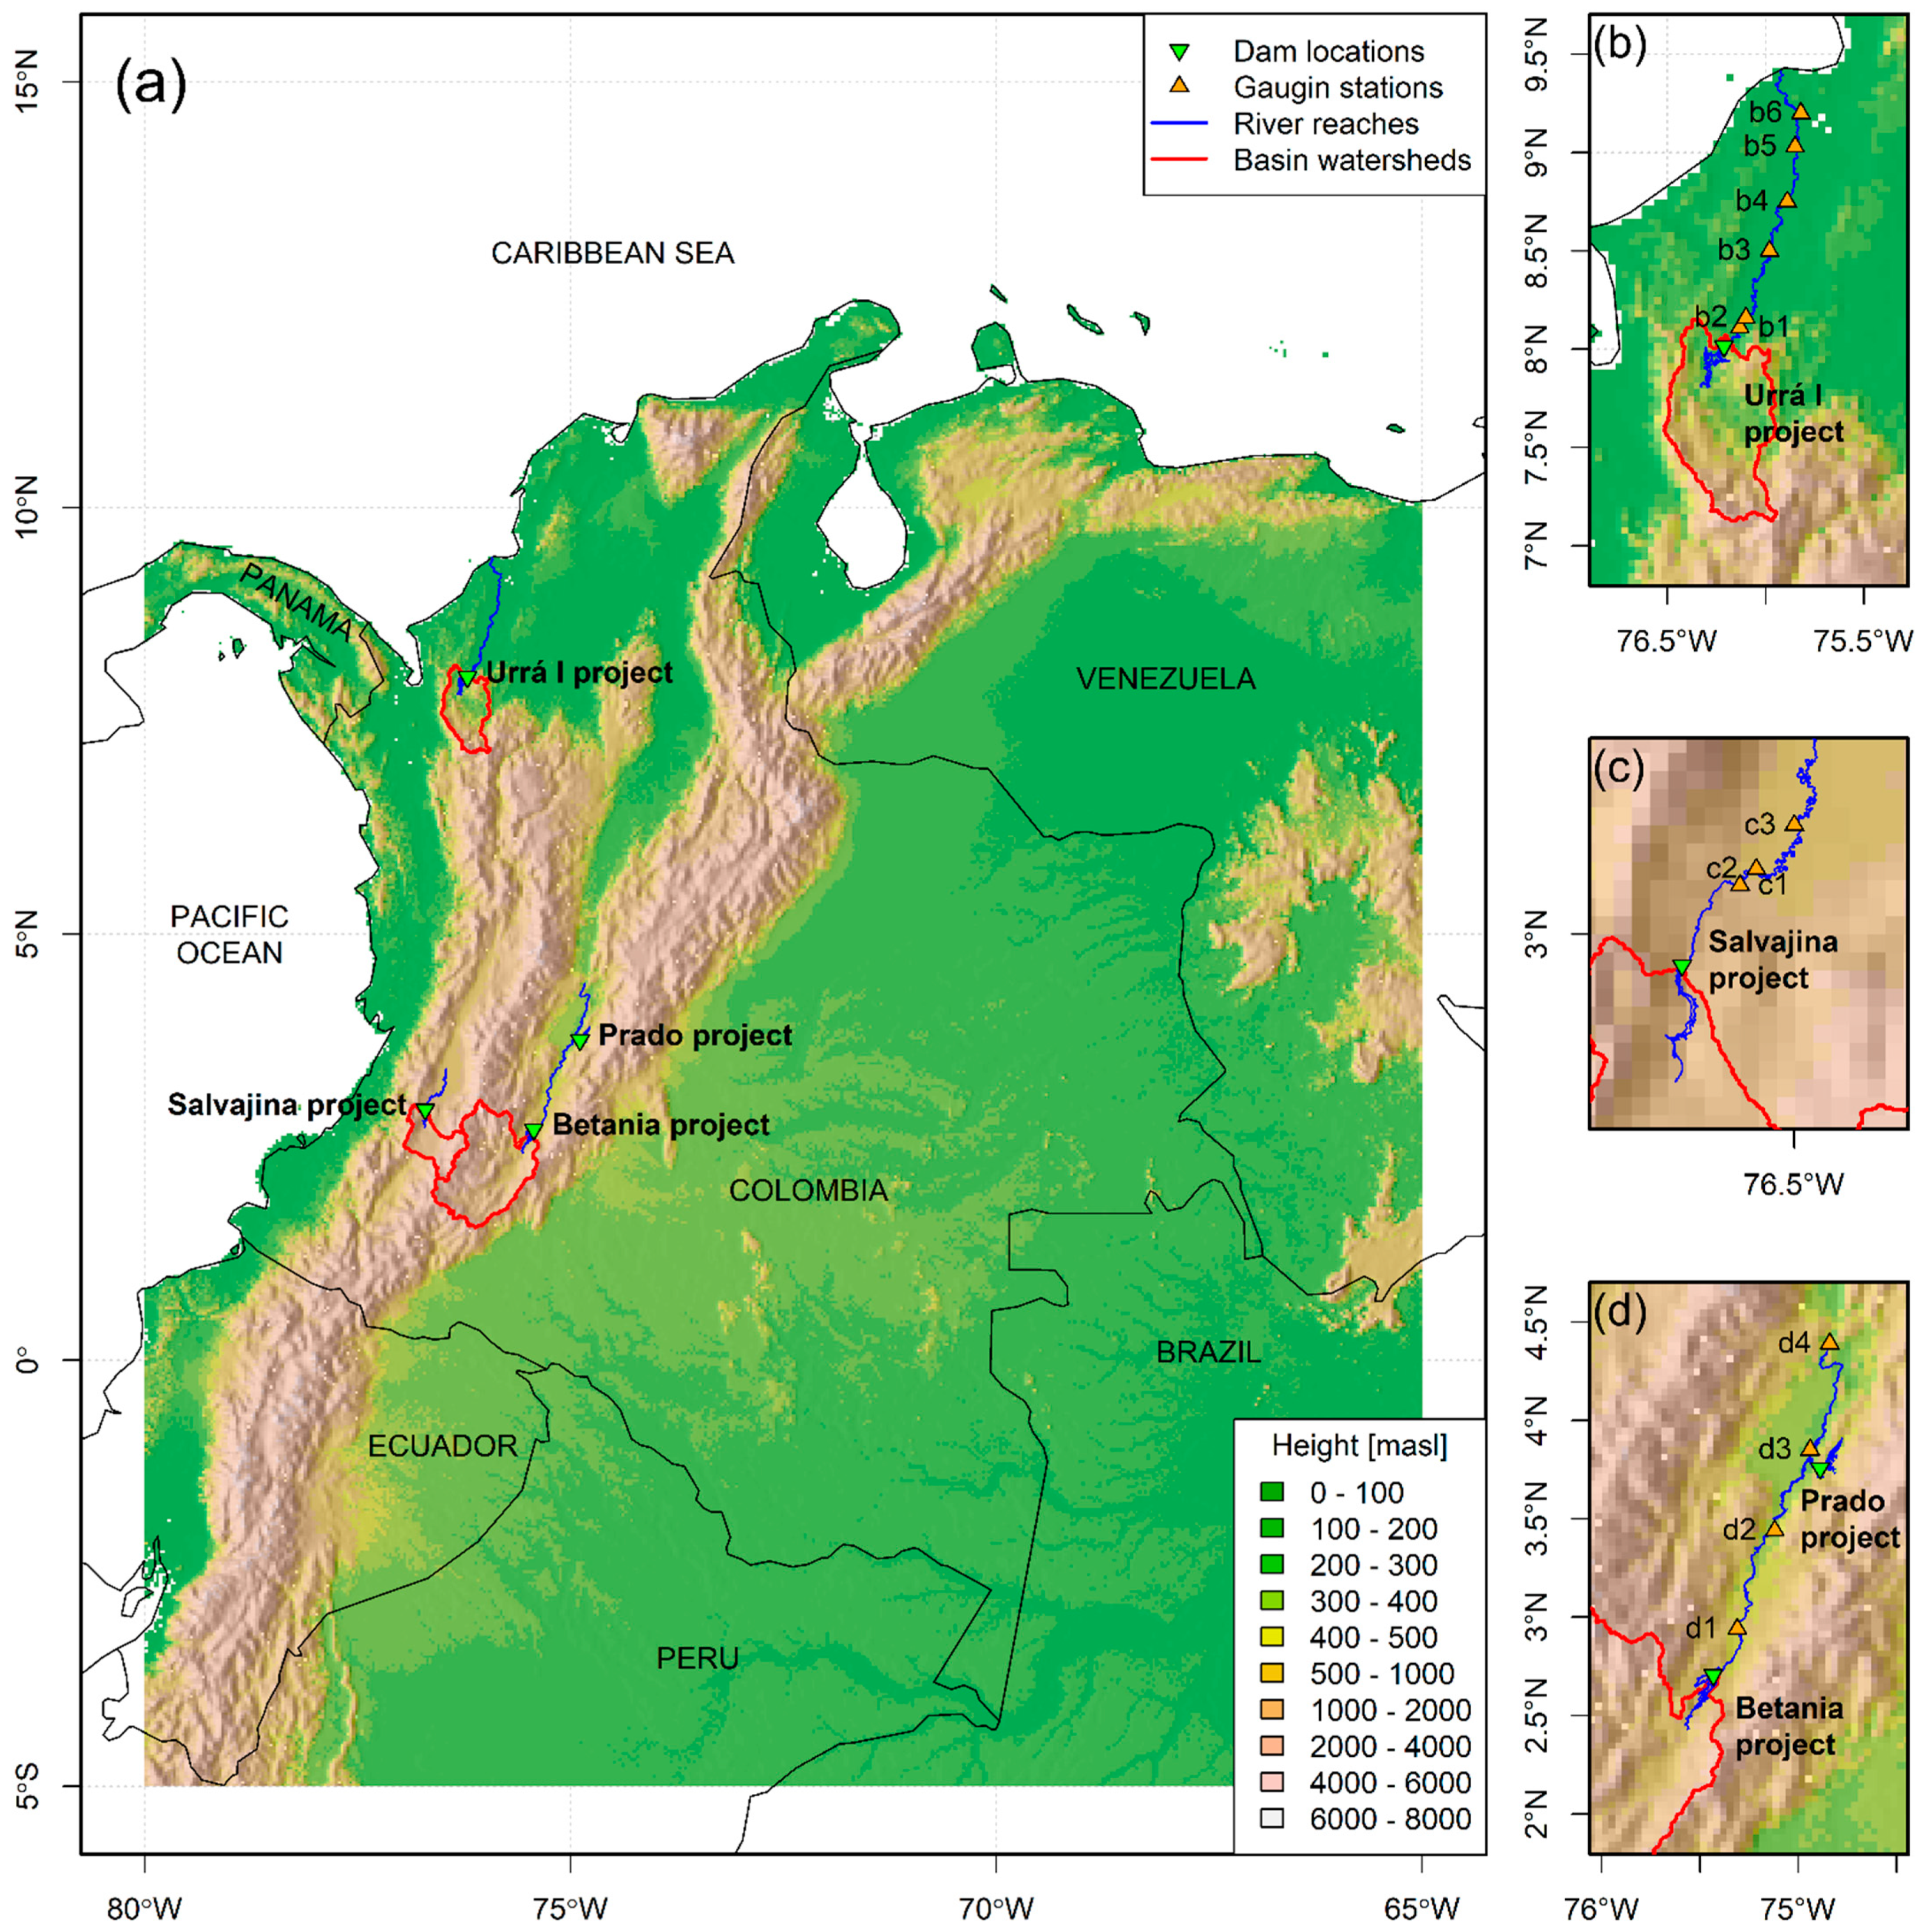
Figure 1. Location of the selected dams in Colombia: (a) general location, (b) Urrá I project, (c) Salvajina project, and (d) Betania and Prado projects (see Table 2 for information about selected gauging stations).
Applsci 13 07109 g001
Figure 2. Methodology for obtaining the morphological characteristics of rivers: (a) georeferencing and digitization of aerial photographs, (b) delimitation of the river channel in spectral images, (c) delimitation of the river channel in radar images, and (d) morphological parameter assessment using the R package cmgo.
Applsci 13 07109 g002
Figure 3. Geological conceptual map of the Urrá I Dam area (geology from the SGC and DEM from the SRTM mission/2000).
Applsci 13 07109 g003
Figure 4. Geological conceptual map of the Salvajina Dam area (geology from the SGC and DEM from the SRTM mission/2000).
Applsci 13 07109 g004
Figure 5. Geological conceptual map of the Betania–Prado Dam area (geology from the Servicio Geológico Colombiano and DEM from the SRTM mission/2000).
Applsci 13 07109 g005
Figure 6. Mean monthly discharge in downstream stations for the pre-dam (black line) and post-dam (red line) periods. Left and right columns show the nearest and the furthest station to the dam, respectively. (a) Urrá I project, (b) Salvajina project, and (c) Betania and Prado projects.
Applsci 13 07109 g006
Figure 7. Changes in annual discharges between pre-dam and post-dam periods as a percentage at downstream stations of the (a) Urrá I Dam, (b) Salvajina Dam, and (c) Betania and Prado Dams.
Applsci 13 07109 g007
Figure 8. Morphological changes downstream of the Urrá I Dam: (a) confinement grade; (b) geological units near the Sinú River; (c) Erodibility Index (EI) on the left and right sides of the river channel (RC); (d) sites of importance near the Sinú River, including affluent rivers and streams; (e) river sinuosity change as a percentage with respect to the pre-dam year 1991; and (f) river width change as a percentage with respect to the pre-dam year 1991.
Applsci 13 07109 g008
Figure 9. Morphological changes downstream of the Salvajina Dam: (a) confinement grade; (b) geological units near the Cauca River; (c) Erodibility Index (EI) on the left and right banks of the river channel (RC); (d) sites near the Cauca River, including affluent rivers and streams; (e) river sinuosity change as a percentage with respect to the pre-dam year 1961; and (f) river width change as a percentage with respect to the pre-dam year 1961.
Applsci 13 07109 g009
Figure 10. Morphological changes downstream of the Betania and Prado Dams: (a) confinement grade; (b) geological units near the Magdalena River; (c) Erodibility Index (EI) on the left and right sides of the river channel (RC) and faults (----); (d) sites near the Magdalena River, including affluent rivers and streams; (e) river sinuosity change as a percentage with respect to the pre-dam year 1969; and (f) river width change as a percentage with respect to the pre-dam year 1969.
Applsci 13 07109 g010
Figure 11. Downstream changes in the Betania Dam in the sector near Natagaima: (a) aerial photograph of March 1969 (Q = 233 m3/s), (b) RGB composite 743 of March 1988 (Q = 326 m3/s), and (c) RGB composite 754 of March 2020 (Q = 350 m3/s).
Applsci 13 07109 g011
Figure 12. Upstream changes due to the Betania Dam across the Magdalena River: (a) aerial photograph of 1969, (b) RGB composite 743 of 1988, and (c) RGB composite 754 of 2020.
Applsci 13 07109 g012
Table 1. Main characteristics of the dams selected for the study.
DamYear Starting OperationHeight
(m)
Reservoir Volume (106 m3)Reservoir Area (m2)Downstream Initial Channel Width (m)Rivers
Upstream of
Reservoir
Rivers Downstream of Reservoir
Prado1972751010125,400302Prado, CundayMagdalena
Salvajina1985148764203,10084CaucaCauca
Betania19861701971700,000236Magdalena, YaguaraMagdalena
Urrá I20001001740740,000112Sinú, VerdeSinú
Table 2. Gauging stations selected for the study.
DamStationCoordinatesElevation
(masl)
Period (Years)Downstream
Distance (km)
NameIDLong.Lat.Pre-DamPost-Dam
Urrá IEl Torob1−76.138.111001991–19982002–201026
Carrizolab2−76.108.16551993–19982002–202040
Nueva Colombiab3−75.988.50201991–19982002–2020112
Monteríab4−75.898.75151963–19982002–2020162
Sabana Nuevab5−75.859.0391979–19982002–2020205
Palma Centralb6−75.829.2061991–19982002–2010230
SalvajinaLa Balsac1−76.603.099871976–19831987–202027
Tablancac2−76.573.129801978–19831987–201036
La Bolsac3−76.503.209641967–19831987–201675
Prado and BetaniaPuente Santanderd1−75.312.944311960–19841988–201942
Angosturad2−75.123.443451975–19841988–2020119
Purificaciónd3−74.943.853061960–19841988–2019182
Nariñod4−74.844.392771978–19841988–2019273
Table 3. Suspended sediment reduction downstream of the selected dams.
ProjectClosest Station to the DamFarthest Station to the Dam
Station NameDownstream Distance (km)Reduction in Suspended Sediment (%)Station NameDownstream Distance (km)Reduction in Suspended Sediment (%)
Prado and BetaniaPuente Santander4270–73Nariño2799
Salvajina Salvajina175Juanchito13430
Urrá IPasacaballos681Montería17540
Table 4. Upstream changes for each dam in Section 1 (influenced zone) and Section 2 (non-influenced zone).
DamReachCoordinatesCharacteristics
InitialEndingL (km)PeriodW (m)S
Lat.Lon.Lat.Lon.
Urrá I Verde River
17.85−76.297.83−76.138Pre811.3
Pos3731.1
27.83−76.137.80−76.335Pre601.0
Pos561.1
Sinú River
17.84−76.297.83−76.256.7Pre561.2
Pos2030.9
27.83−76.257.79−76.246.3Pre551.0
Pos621.0
Salvajina Cauca River
12.77−76.712.75−76.702.7Pre331.06
Pos921.05
22.75−76.702.71−76.745Pre441.15
Pos441.15
Betania Yaguará River
12.69−75.512.64−75.522.5Pre711.1
Pos2691.1
22.64−75.522.63−75.53.5Pre551.0
Pos471.0
Magdalena River
12.56−75.492.53−75.56.5Pre1561.4
Pos3421.1
22.53−75.52.47−75.569.5Pre1221.3
Pos1401.3
Note: Lat.: latitude; Lon.: longitude; L: length; W: river width average; S: river sinuosity average; pre: pre-dam; pos: post-dam.
Disclaimer/Publisher’s Note: The statements, opinions and data contained in all publications are solely those of the individual author(s) and contributor(s) and not of MDPI and/or the editor(s). MDPI and/or the editor(s) disclaim responsibility for any injury to people or property resulting from any ideas, methods, instructions or products referred to in the content.