Article

Effect of Subject-Specific Region of Interest on Motor Imagery Brain–Computer Interface

by
Eltaf Abdalsalam Mohamed
1,
Ibrahim Khalil Adam
2 and
Mohd Zuki Yusoff
3,4,*
1
Department of Electrical Engineering, Blue Nile University, Ad Damazin P.O. Box 143, Sudan
2
Department of Mechanical Engineering, Blue Nile University, Ad Damazin P.O. Box 143, Sudan
3
Centre for Intelligent Signal and Imaging Research (CISIR), Universiti Teknologi PETRONAS (UTP), Bandar Seri Iskandar 32610, Malaysia
4
Electrical and Electronic Engineering Department, Universiti Teknologi PETRONAS (UTP), Bandar Seri Iskandar 32610, Malaysia
*
Author to whom correspondence should be addressed.
Appl. Sci. 2023, 13(11), 6364; https://doi.org/10.3390/app13116364
Submission received: 19 March 2023 / Revised: 5 May 2023 / Accepted: 5 May 2023 / Published: 23 May 2023

Abstract

:
A brain–computer interface (BCI), as a solution to disabled people’s concerns, has drawn attention in biomedical engineering over the last decade. However, the most existing brain–computer interface systems are based on the time or frequency domain of feature extraction, and it is associated with inaccurate detection of event-related desynchronization (ERD). In this study, a new algorithm relating to subject-specific regions of interest (ROIs) with intrinsic time-scale decomposition (ITD) was investigated to achieve satisfactory classification accuracy. ROI-based discrete wavelet transform (DWT) combined with an artificial neural network was used to validate the ROI-based ITD method. Experimentally recorded data of motor imagery movement tasks (right hand, left hand, both hands and both feet) were collected from 15 subjects. The parameters of the subject-specific regions of interest were investigated and optimized. An optimal condition was observed at a specific region of interest and the accuracy increased by 12.76 to 15.17% compared to that without ROI estimation. ITD showed higher classification accuracy, sensitivity, specificity and Kappa coefficient of 9.47%, 8.99%, 9.79% and 12.09%, respectively, for the four classes of motor imagery movements compared to DWT. The developed ITD model was validated using the dataset from BCI Competition IV. On average, ITD with ROIs showed 8.56% and 7.32% higher classification accuracy compared to common spatial patents (CSP) and DWT with ROIs.

1. Introduction

People with motor disorders are unable to meet their needs or live independently. Thus, the brain–computer interface (BCI) aims to reduce healthcare costs and improve life quality by means of communication [1]. BCIs translate the acquired brain activity into a message or command that is then sent to an external device [2,3,4]. Motor imagery is detected from human brain signals using electroencephalography (EEG). EEG is a test that detects the electrical activity of the human brain [5]. Among the different input signals to the BCI system, EEG is a viable method. This is due to the high temporal resolution and portability associated with EEG. The decoding of EEG signals has been studied by global researchers [6,7]. The bio-signal of interest is generated voluntarily and the computer continuously scans the generated signals and matches them with the known waveforms.
These signals are in the form of event-related desynchronization (ERD)/synchronization (ERS) and are controlled by motor imagery (MI) movements associated with cortical areas known as sensorimotor rhythms (SMR) [8,9]. Although ERD and ERS have been investigated with regard to their modulation effects on SMR [10,11,12], the dynamics of ERD/ERS phenomena during motor tasks have not been studied. The ERD can be readily detected in EEG signals within the band of alpha (8 Hz to 12 Hz) and beta rhythms at frequencies of 8 Hz to 12 Hz and 14 Hz to 28 Hz, respectively [13]. The data behavior at specific frequency bands was computed using the coefficient of determination (r2) as a function of electrode location [14]. The Rolandic beta and mu rhythms in the human brain were observed in sensorimotor areas with frequency bands between 10 Hz and 20 Hz [15]. These frequency bands show typical responses associated with the subject’s movement and motor imagery [16,17,18]. However, ERD/ERS values have been found to vary between individuals because of the differences in brain states, structures and physiology. As a result, different frequency ranges, time periods, and brain regions are activated. Several methods have been proposed to detect and classify ERD/ERS in BCI. Pfurtscheller et al. [8,19] combined band power and learning vector quantization (LVQ) for classification. However, inferior results were reported because the band power requires prior knowledge of frequency bands and reactive bands. Distinction-sensitive learning vector quantization was used as an automated approach to select relevant bands in fixed time segments [20].
Wang and Zheng [21] maximized the scatters between two classes of EEGs using a common special pattern (CSP) for a motor imagery task. The diagonals of two covariance matrices were used to compute the spatial filters. However, CSP-based approaches were found to have some drawbacks. It depends on subject-specific segments and frequency bands, and the estimations of covariance matrices are affected by noises and outliers [21]. The spatial non-stationary characters of ERS/ERD and the temporal frequencies result in high inter-subject and intra-subject variability in motor imagery task-based BCIs. However, the occurrences of ERD and ERS are found to be independent of a time interval; hence, selecting which segment is active could be a problem.
To overcome the above-mentioned problems, various techniques, such as the time–frequency domain, have been introduced to transform non-stationary signals into stationary ones [22,23]. Martis et al. [22] described time–frequency energy representations using the intrinsic time-scale decomposition (ITD) method. Proper rotation components in the time-scale domain were provided. Furthermore, the trade-offs between time information and frequency information were balanced. Ince et al. [24] investigated dyadic time segmentation and adaptive selection of frequency domain features with equal bandwidth for the classification of EEG signals corresponding to left or right hand movement imagery for BCI tasks. However, these methods were found to be complex for online BCI studies. Jiang et al. [25] used multiple time segments via a band-pass filter on each time segment. The feature from multiple time segments of each sample was extracted using a CSP spatial filter and then combined. However, the problem of this study is that different subjects have different optimal time segments.
According to the literature review, none of these techniques have studied the features of time–frequency techniques. Moreover, the investigation was conducted for offline studies, and the accuracy still needs improvement. Furthermore, no studies were found on signal decomposition techniques to extract subjects’ ERD and ERS based on intrinsic time-scale decomposition features.
The aim of our paper is to examine the effect of subject-specific regions of interest on the discrimination of four classes (both feet, both hands, right hand and left hand) of motor imagery using time–frequency techniques. The parameters of ERD and ERS were investigated and optimized using the intrinsic time-scale decomposition method. The intrinsic time-scale decomposition method was validated using the discreet wavelet transform. Furthermore, comparisons with other existing methods from the literature were also performed. This study is a continuation of our previous work [26,27], which successfully studied the discrimination of four classes of simple limb motor imagery movements for brain–computer interfaces and the comparison of EEG signal decomposition using time–frequency methods. Hence, by utilizing a subject-specific region of interest (ROI), BCI accuracies could be improved.

2. Materials and Methods

2.1. Participant and Sample Size Calculation

There were 15 participants in total, comprising 7 females and 8 males. The mean age and the standard deviation of the participants were 24.7 years and 4.1 years, respectively. Experiment approval was obtained from the Ethics Committee of Biomedical Technology Mission Oriented Research (BMT–MOR), Universiti Teknologi PETRONAS (UTP), Malaysia. Firstly the sample size was calculated for the infinite population using Equation (1). Secondly, the sample size was adjusted to the required population using Equation (2).
S = Z 2 × P × 1 P M 2
A d j u s t   s a m p l e   s i z e = S 1 + S 1 p o p u l a t i o n
  • S = sample size for infinite population
  • Z = Z score
  • P = population proportion (assumed as 50% or 0.5)
  • M = margin of error
Note: The Z score is determined based on the confidence level. A 95% confidence level was used and the Z score found was 1.960. The margin of error for miscalculation or change of circumstances was 5%.

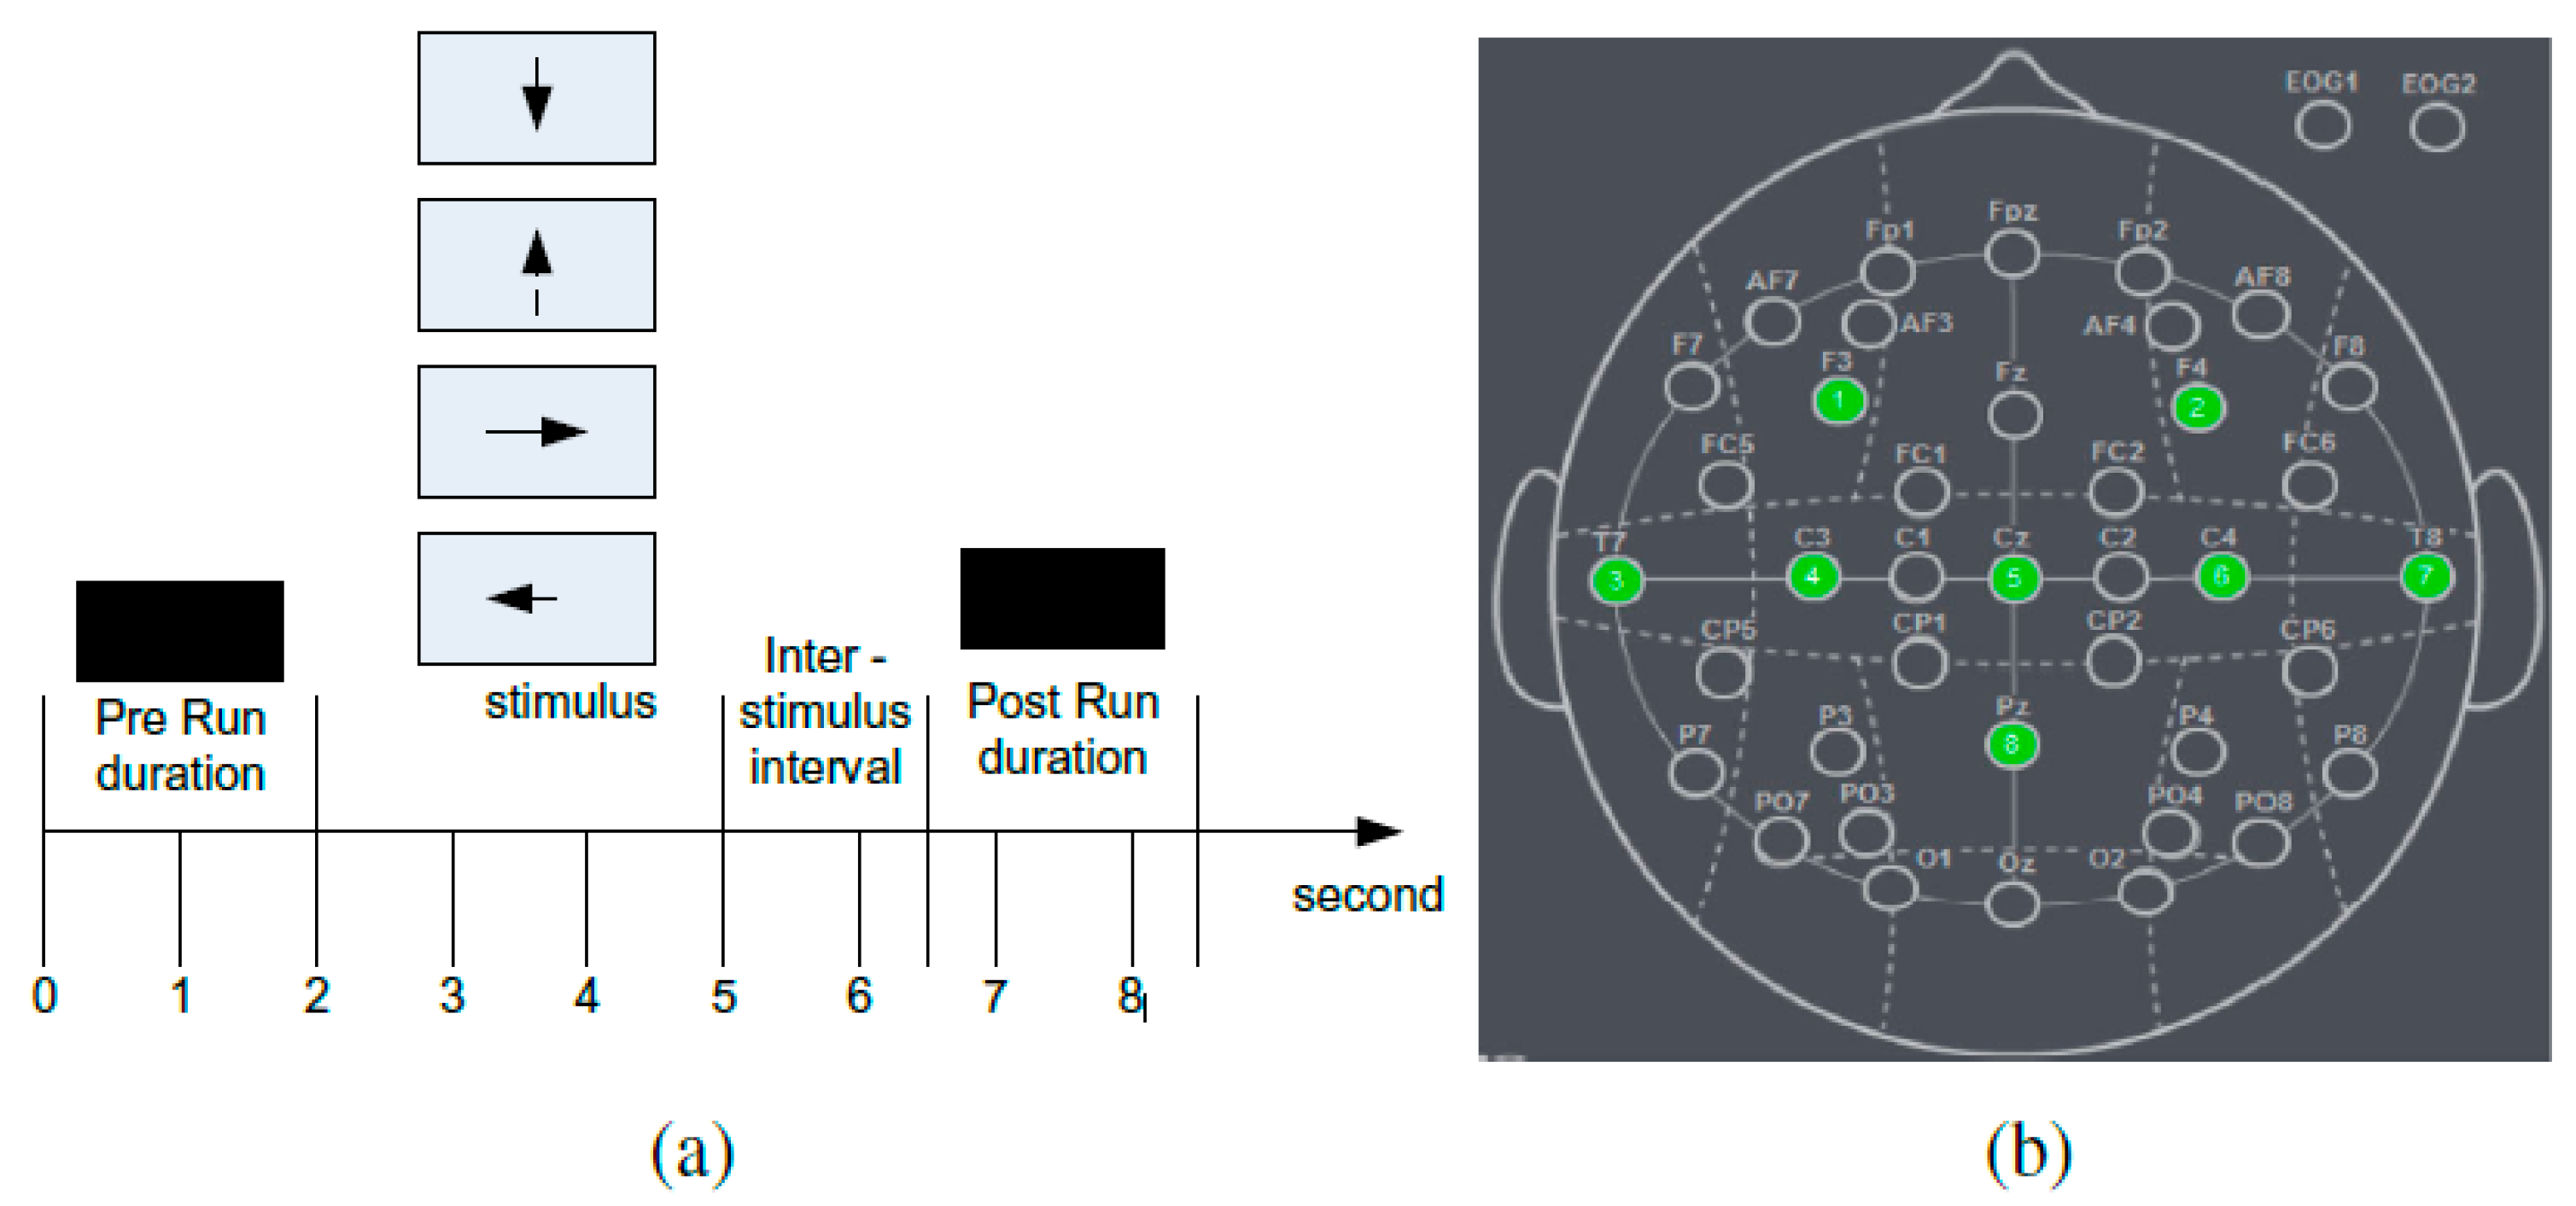
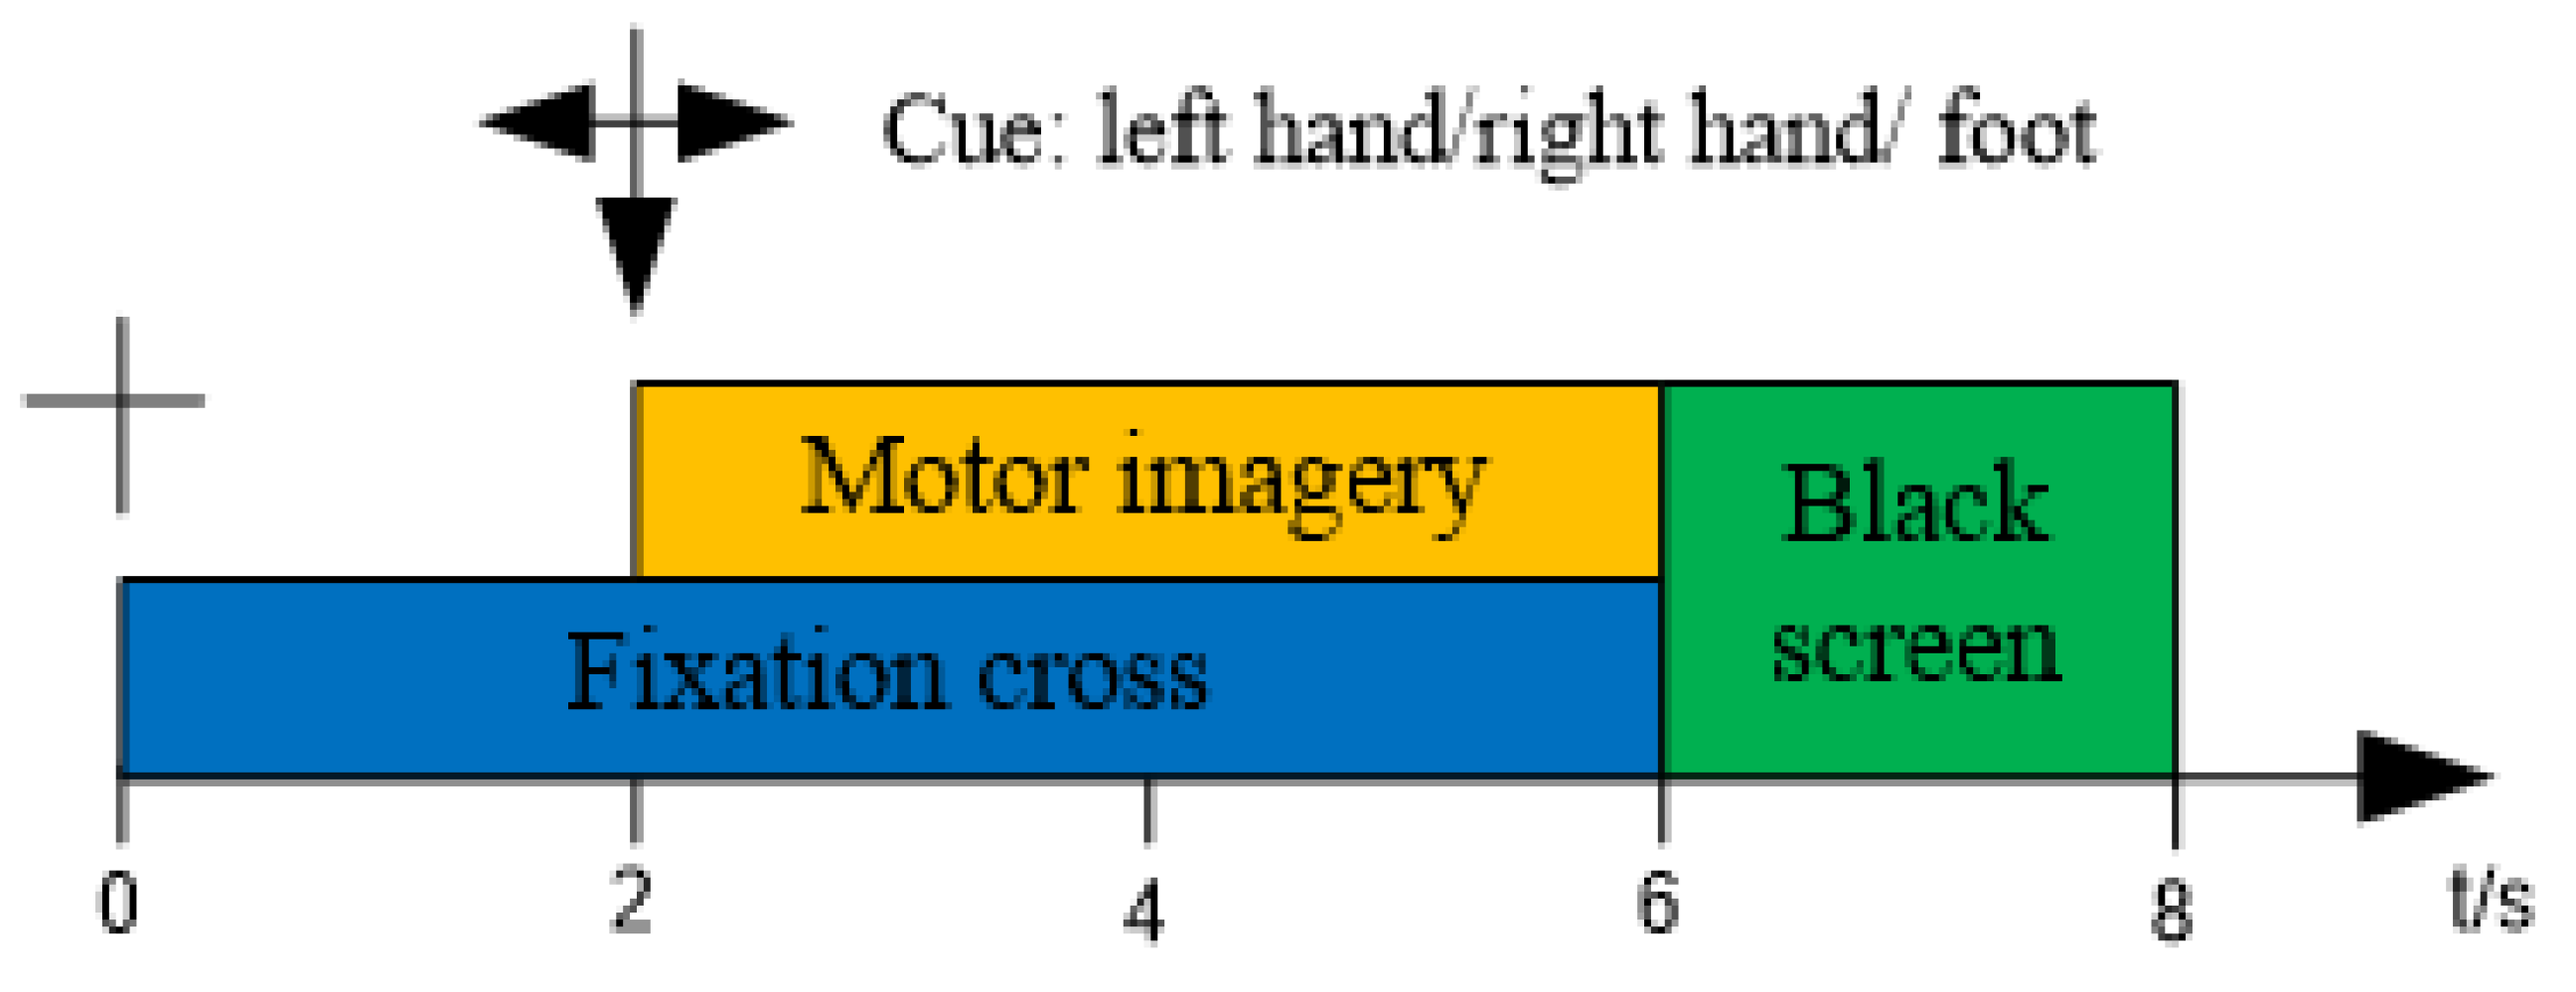
2.2. Experimental Setup

A brief on experimental procedures was introduced to each participant and a consent form was signed. Neuroelectrics’s Enobio with eight dry electrodes following the 10–20 international electrode placement system was used [11]. The participants were invited for one session to perform mental tasks and motor imagery, which were guided by visual cues. During the session, the subject’s screen could either be blank or display an arrow pointing to the right, left, up or down. The stimulus was displayed for 3000 ms and the screen remained blank for 1500 ms before the next stimulus appeared. To allow the subject to blink or stretch, a break time of 1 min was used. During the break time, the screen was blank. Tasks related to the imagination of closing and opening the right hand, left hand, both hands and both feet were studied. Altogether, there were 5 runs being conducted, with each run consisting of 24 trials. Figure 1 shows the experiment’s design.

2.3. Preprocessing

The mu rhythm at a frequency range of 8 Hz to 25 Hz was used to determine the motor imagery movement [19,28,29]. In contrast, the electromyogram (EMG) is maximum at a frequency greater than 30 Hz, whereas the eye movement activity or electrocardiography (ECG) is maximum at a frequency less than 5 Hz. Thus, basic filtering was performed to remove the unwanted artifacts from the EEG signal based on an FIR filter. The signal was first high-pass-filtered with a lower cut-off frequency of 0.1 Hz, followed by low-pass filtering with a higher cut-off frequency of 50 Hz. This band-pass filtering aided in the removal of power line noise, electrooculography (EOG), EMG and ECG artifacts.

2.4. Feature Extraction

Intrinsic time-scale decomposition (ITD) has several advantages compared to the empirical mode decomposition (EMD) technique. This includes better computational efficiency, more effective information extraction from a given signal and suitability for online decomposition [22]. A signal operator L was introduced and used to extract the baseline signal from a given input signal Xt. This makes the residual to be the lower frequency Lt. The proper rotation components (PRCs) are defined as Hxt = XtLt, which is then written as Ht. Then, the input signal Xt is decomposed as follows:
X t = H t + L t
From Equation (3), the ITD algorithm is detailed as follows: Considering the function on the interval τ k , τ k + 1 between adjacent extrema x k and x k + 1 , we calculated the baseline extraction operator as:
L X t = L t = L k + L k + 1 L k x k + 1 x k X t x k ,   t τ k , τ k + 1 ,
L k + 1 = λ x k + τ k + 1 τ k τ k + 2 τ k x k + 2 x k + 1 λ x k + 1
where 0 < λ < 1 is set during computation with a fixed value of λ = 1/2. The following defined operator is used to extract the PRC of any signal.
H t = H X t = X t L X t = X t L t
Next, the steps from Equation (4)–(6) are repeated until the baseline becomes a monotonic function, which results in the decomposition of the raw signal into PRCs, and trend.
X t = H X t + L X t = H X t + H + L L X t = H 1 + L + L 2 X t = H k = 0 p 1 L k + L p X t
where H L k X t is the (k − 1)st level proper rotation and L p X t is either the monotonic trend or the lowest frequency baseline.

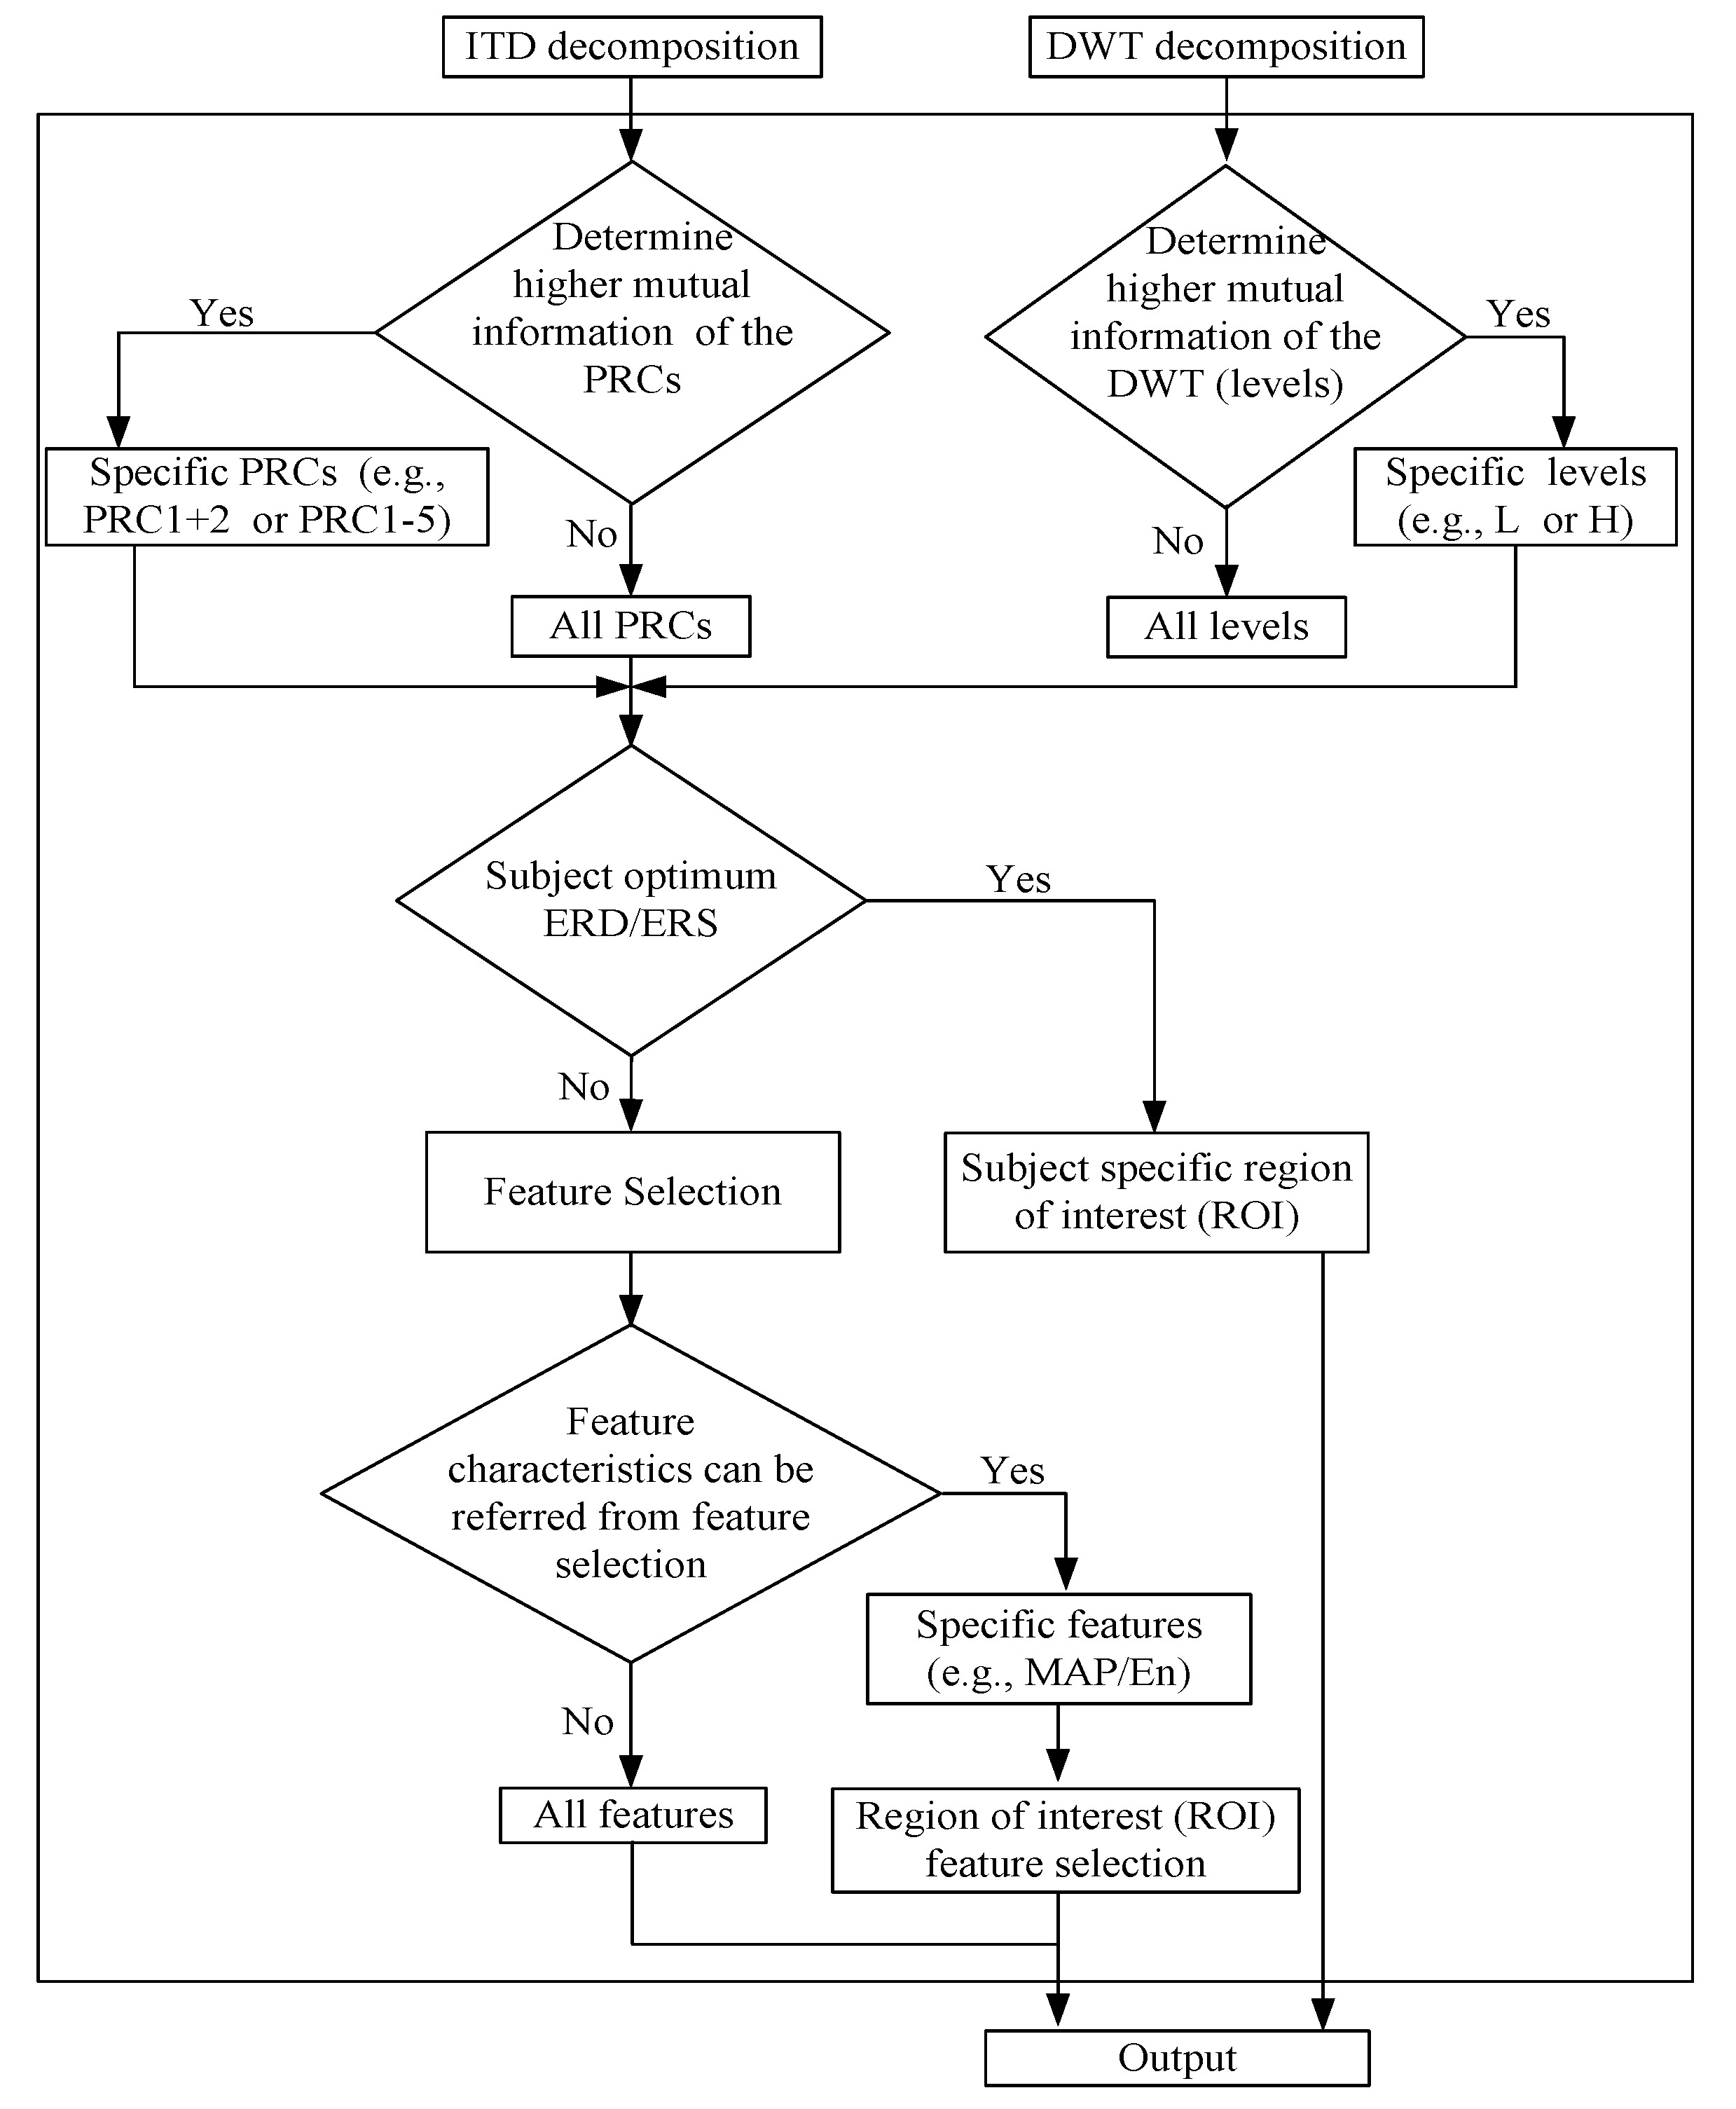
2.5. Optimization of Intrinsic Time-Scale Decomposition

The best region of interest (ROI) is estimated by exhaustively searching for the largest value of F–scores among all regions, as depicted in Figure 2, which is based on an investigation of subject-specific time–frequency of four classes of motor imagery. A subject-specific ROI may be used as a guide in selecting ITD features. After ITD decomposition, optimum feature extraction of PRC should be selected in two ways. The first one depends on extracting features from a fewer number of PRCs, which have higher mutual information of motor imagery movement’s signal. The second one depends on subject-specific time–frequency, which is based on ERD/ERS. Because of the complexity of EEG signals, high temporal and high frequency resolutions are needed. The solution has been implemented in ITD for signal analysis to obtain time–frequency. To calculate the instantaneous amplitude, a single wave-based method was used.
A 1 t = A 2 t = A 1 , t t 1 , t 3 A 2 , t t 3 , t 5
(a)
Perform ITD, which decomposes the signal into some PRCs.
(b)
Calculate the instantaneous amplitude of each PRC based on the half-wave analysis.
(c)
Choose the first two PRCs with instantaneous amplitudes fluctuating around the mu rhythm for further analysis.
(d)
Calculate the ERD of the instantaneous amplitude as follows:
E R D % = 1 N t = 1 N A j t R j t R j ( t ) × 100 %
where A j t is the instantaneous amplitude for j PRCs, R is the reference period or average power in the baseline, and N is the number of trials.

2.6. Feature Classification

The chosen feature representation from the decomposed ITD was fed into a classifier that distinguishes between the motor imagery tasks (left hand, right hand, both hands and both feet). An artificial neural network (ANN) model has been used [30,31,32,33] in BCI systems. The selection of ANN in comparison with the traditional approaches, such as SVMs and LDA, is supported by the reported advantages of the ANN. An ANN has a higher ability to handle nonlinear data and to identify the optimal boundaries between the classes [30]. An NN tool in MATLAB was used to design and train the feed-forward back-propagation neural network (BP NN). One layer of input, hidden, and output was utilized. The algorithm learning effect was studied by varying the hidden layer. The initial hidden unit was 10. Furthermore, the activation functions of Tan sigmoid, pure linear function and Log sigmoid were investigated with different hidden units of 5, 15, 20, 30, 40, 50, 60 and 80. The input and the output numbers were 72 (feature vector length) and 4 (one node per class: right hand, left hand, right foot or left foot), respectively.

2.7. Validation of Intrinsic Time-Scale Decomposition Method

The dataset from BCI Competition IV [34] was used to validate the experimental work. The dataset consisted of two sessions, namely calibration and evaluation sessions. These included seven subjects: four subjects (named “a”, “b”, “f”, “g”) were healthy, and three artificially generated subjects (named “c”, “d”, “e”) were tested. The calibration session consisted of two runs; a total of 200 trials for motor imagery of left hand, right hand or feet were used. The timeline of each trial is shown in Figure 3. The fixed cross was displayed for 2 seconds to prompt the participant to prepare. Then, an arrow would appear for four seconds to prompt the subject to start the motor imagery task. The directions of the arrows are: left—indicating left imagination task, right—indicating right imagination task, and down—indicating feet imagination task. Finally, the screen was black for two seconds, indicating that the trial was over. EEG signals for 59 channels were recorded at a 1000 Hz sampling rate. These data were then band-pass-filtered within 0.05 Hz to 200 Hz, and down-sampled to 100 Hz.

3. Results and Analysis

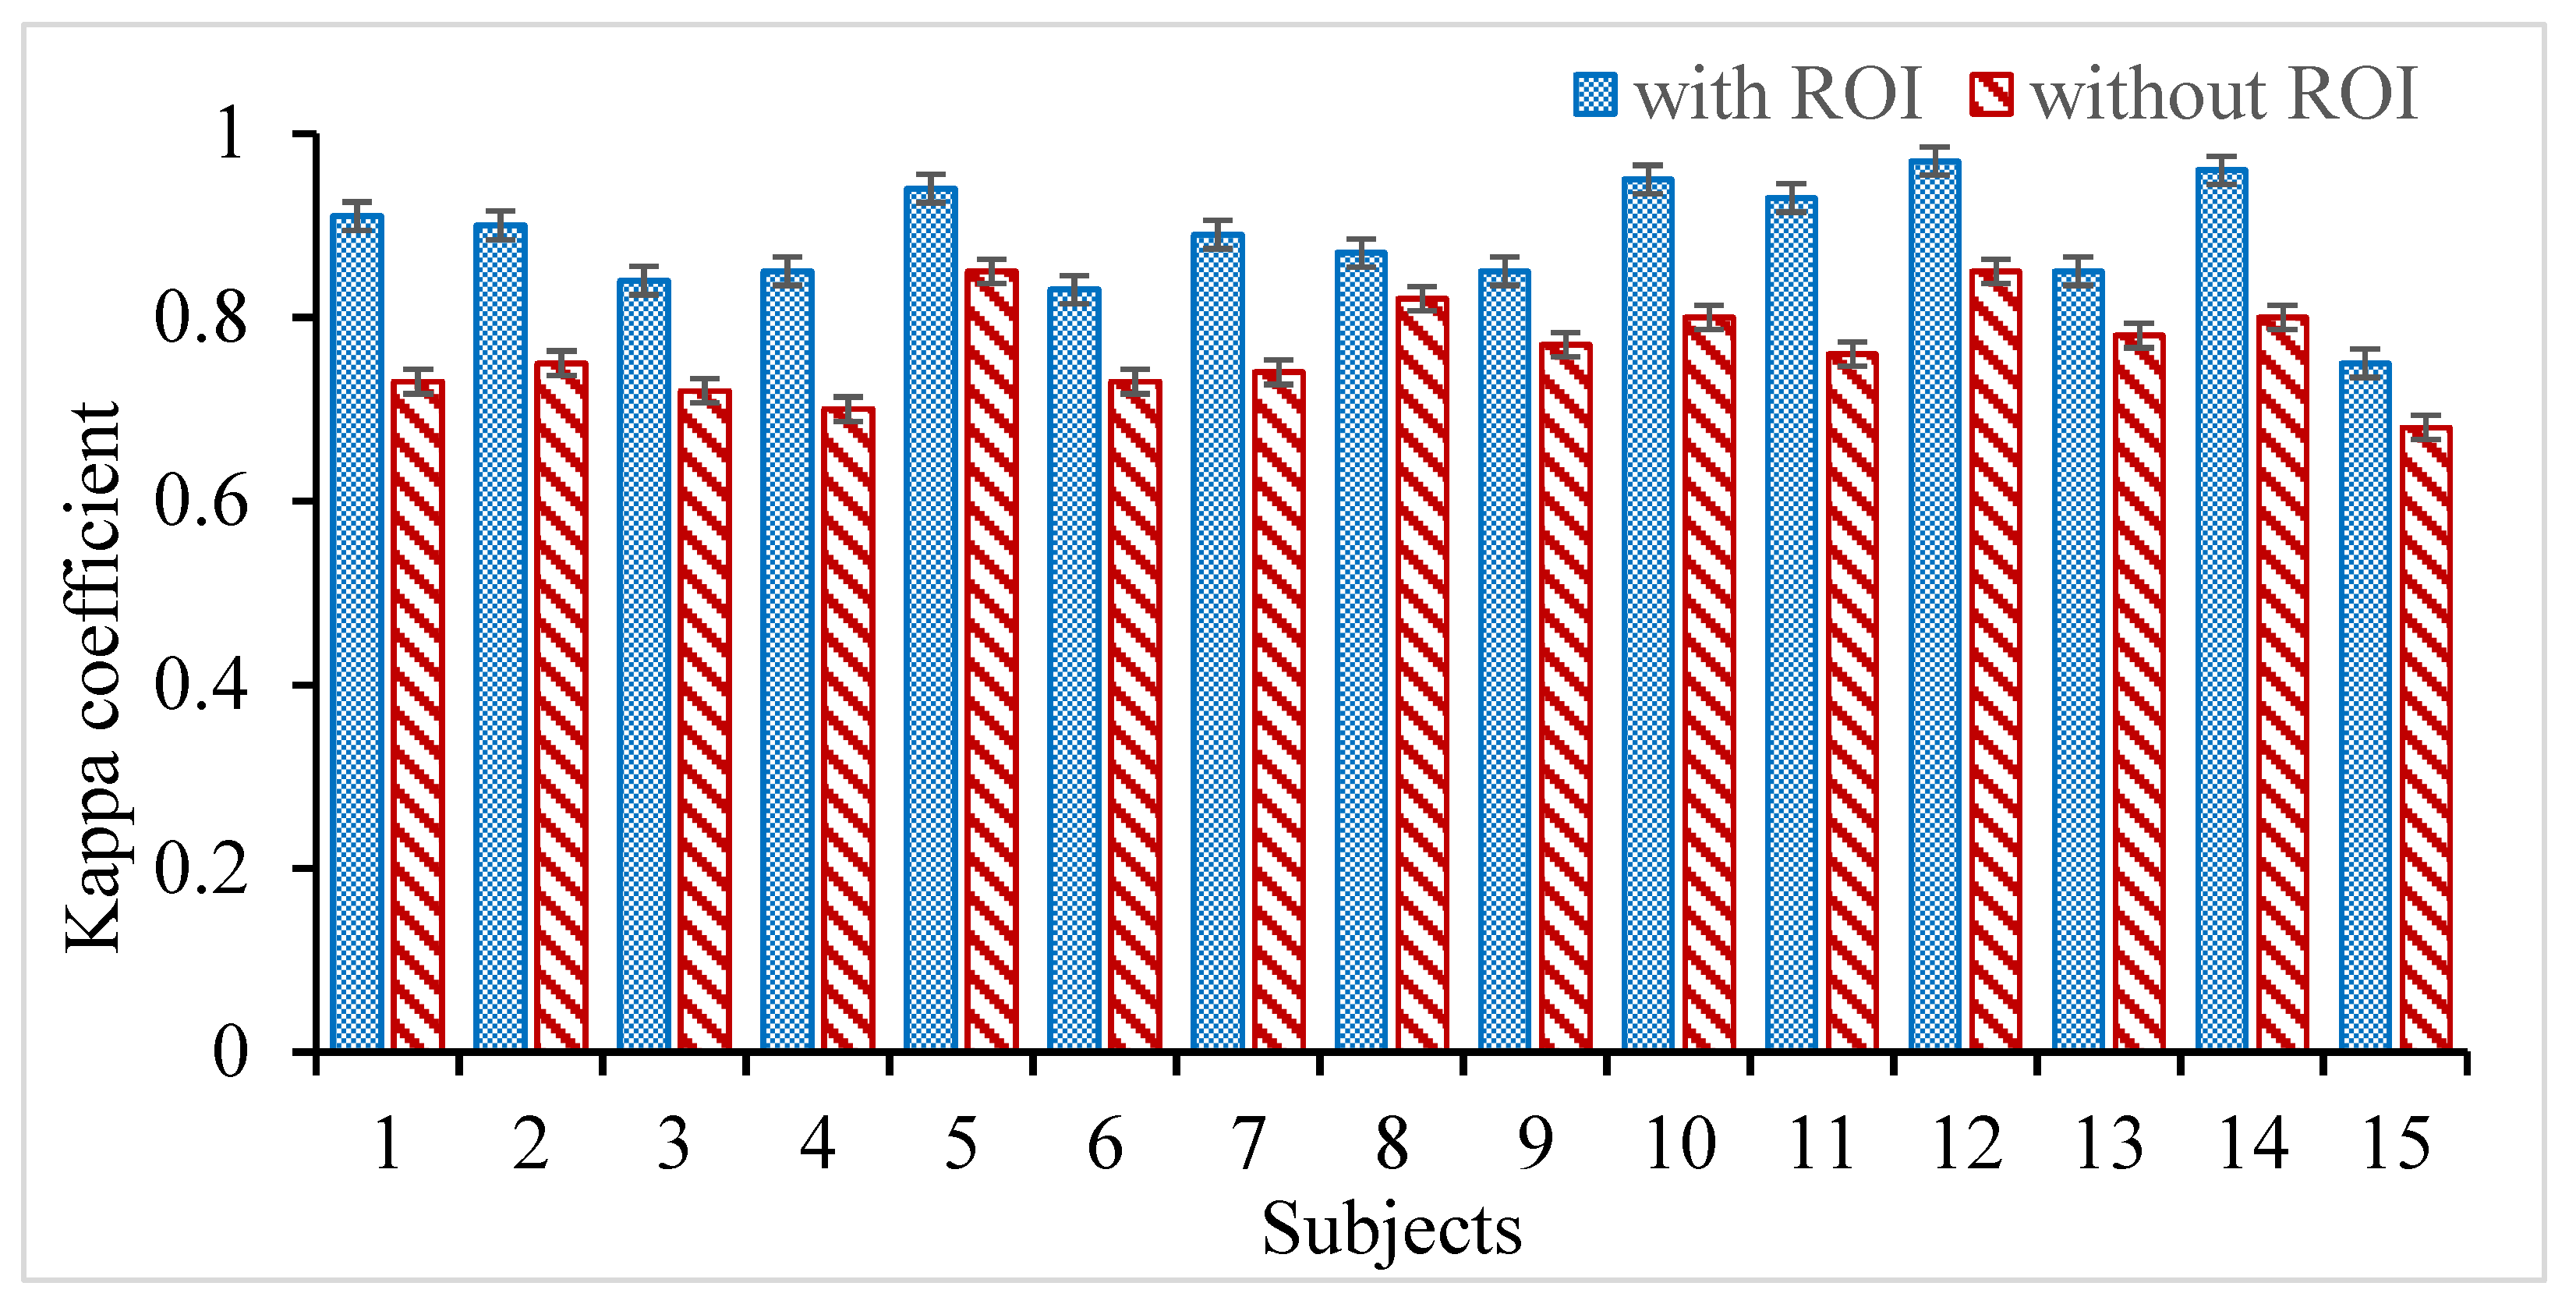
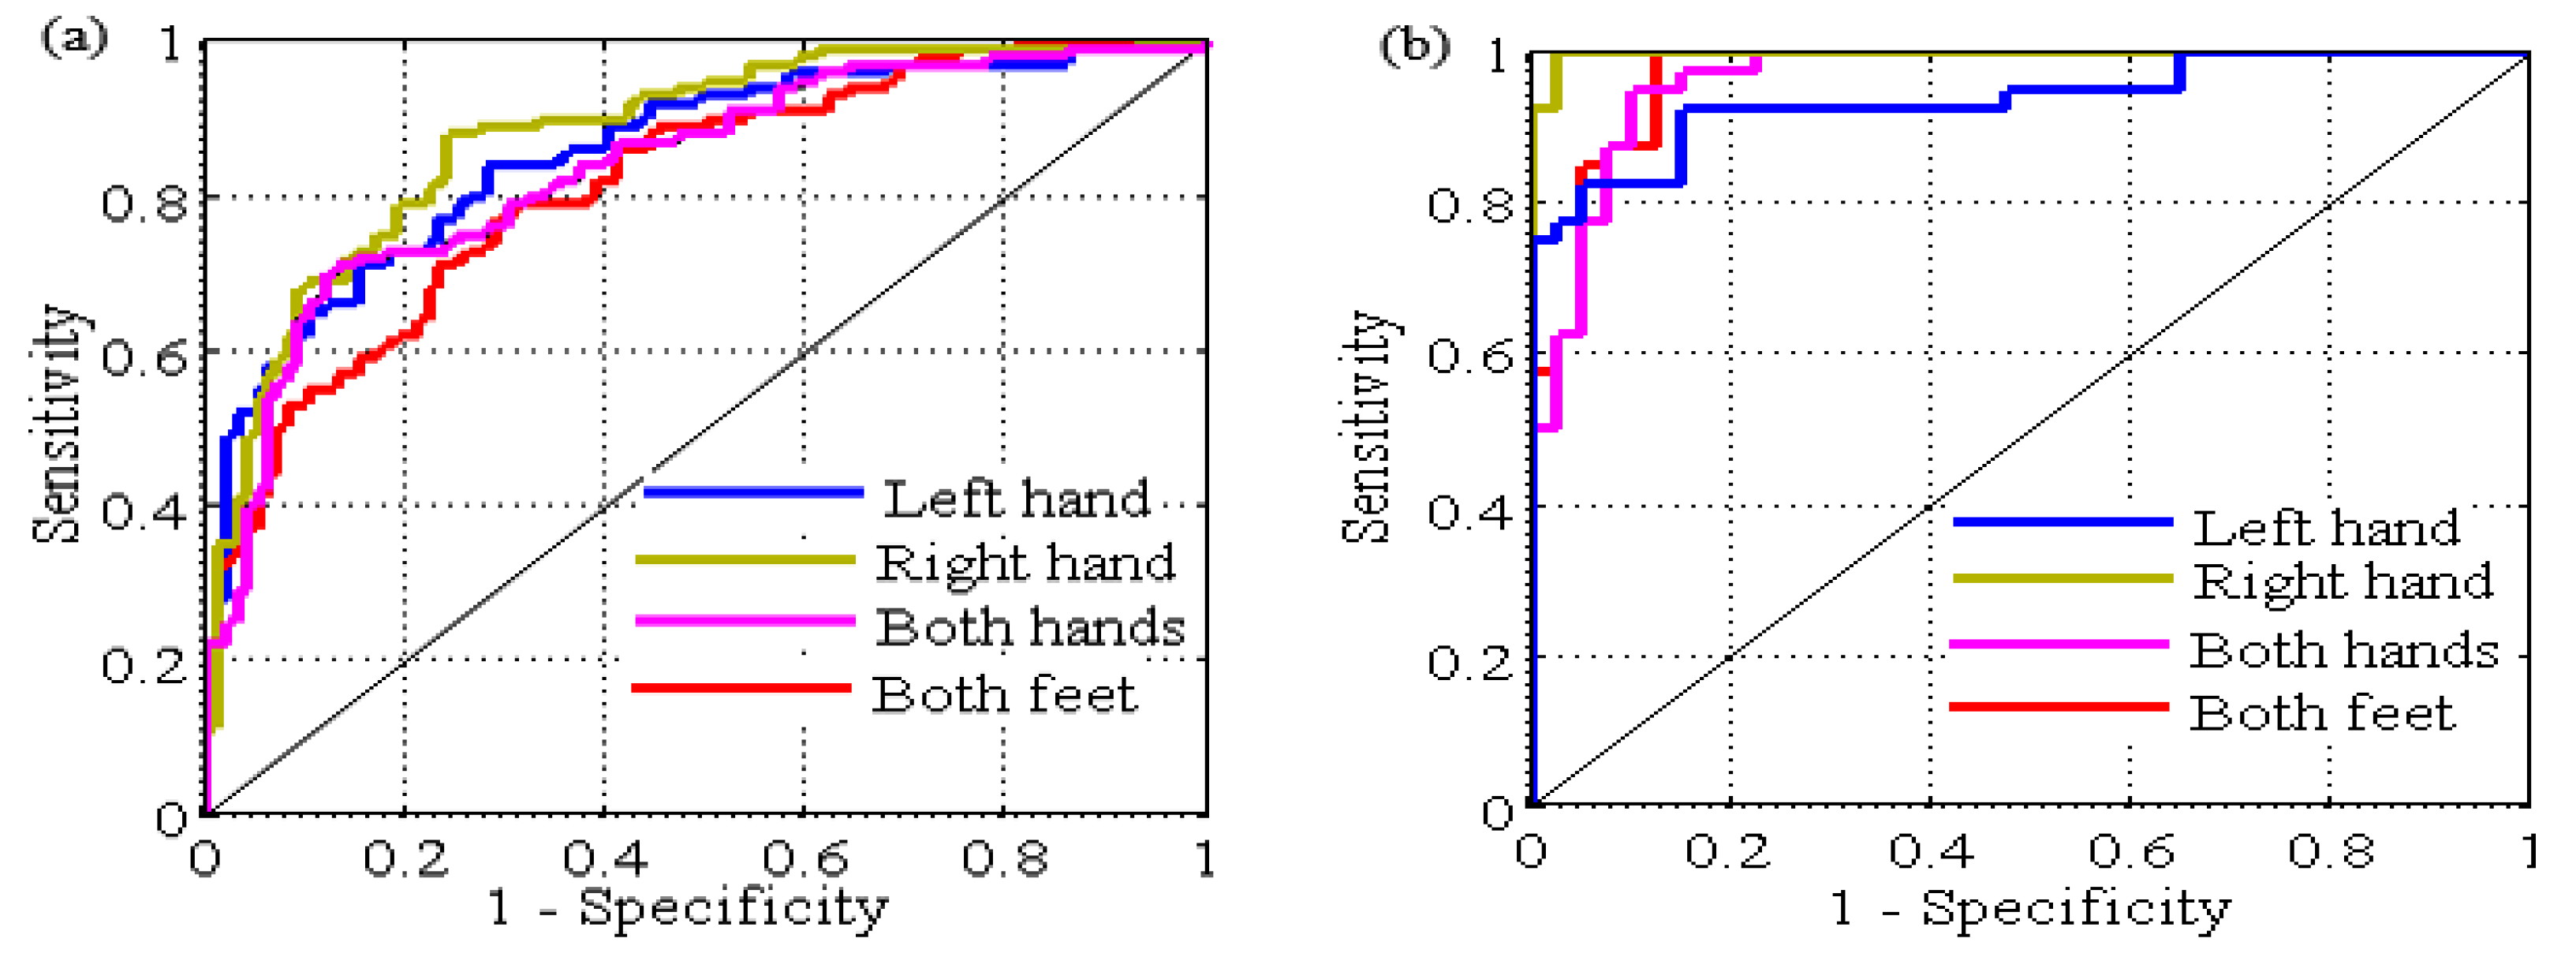
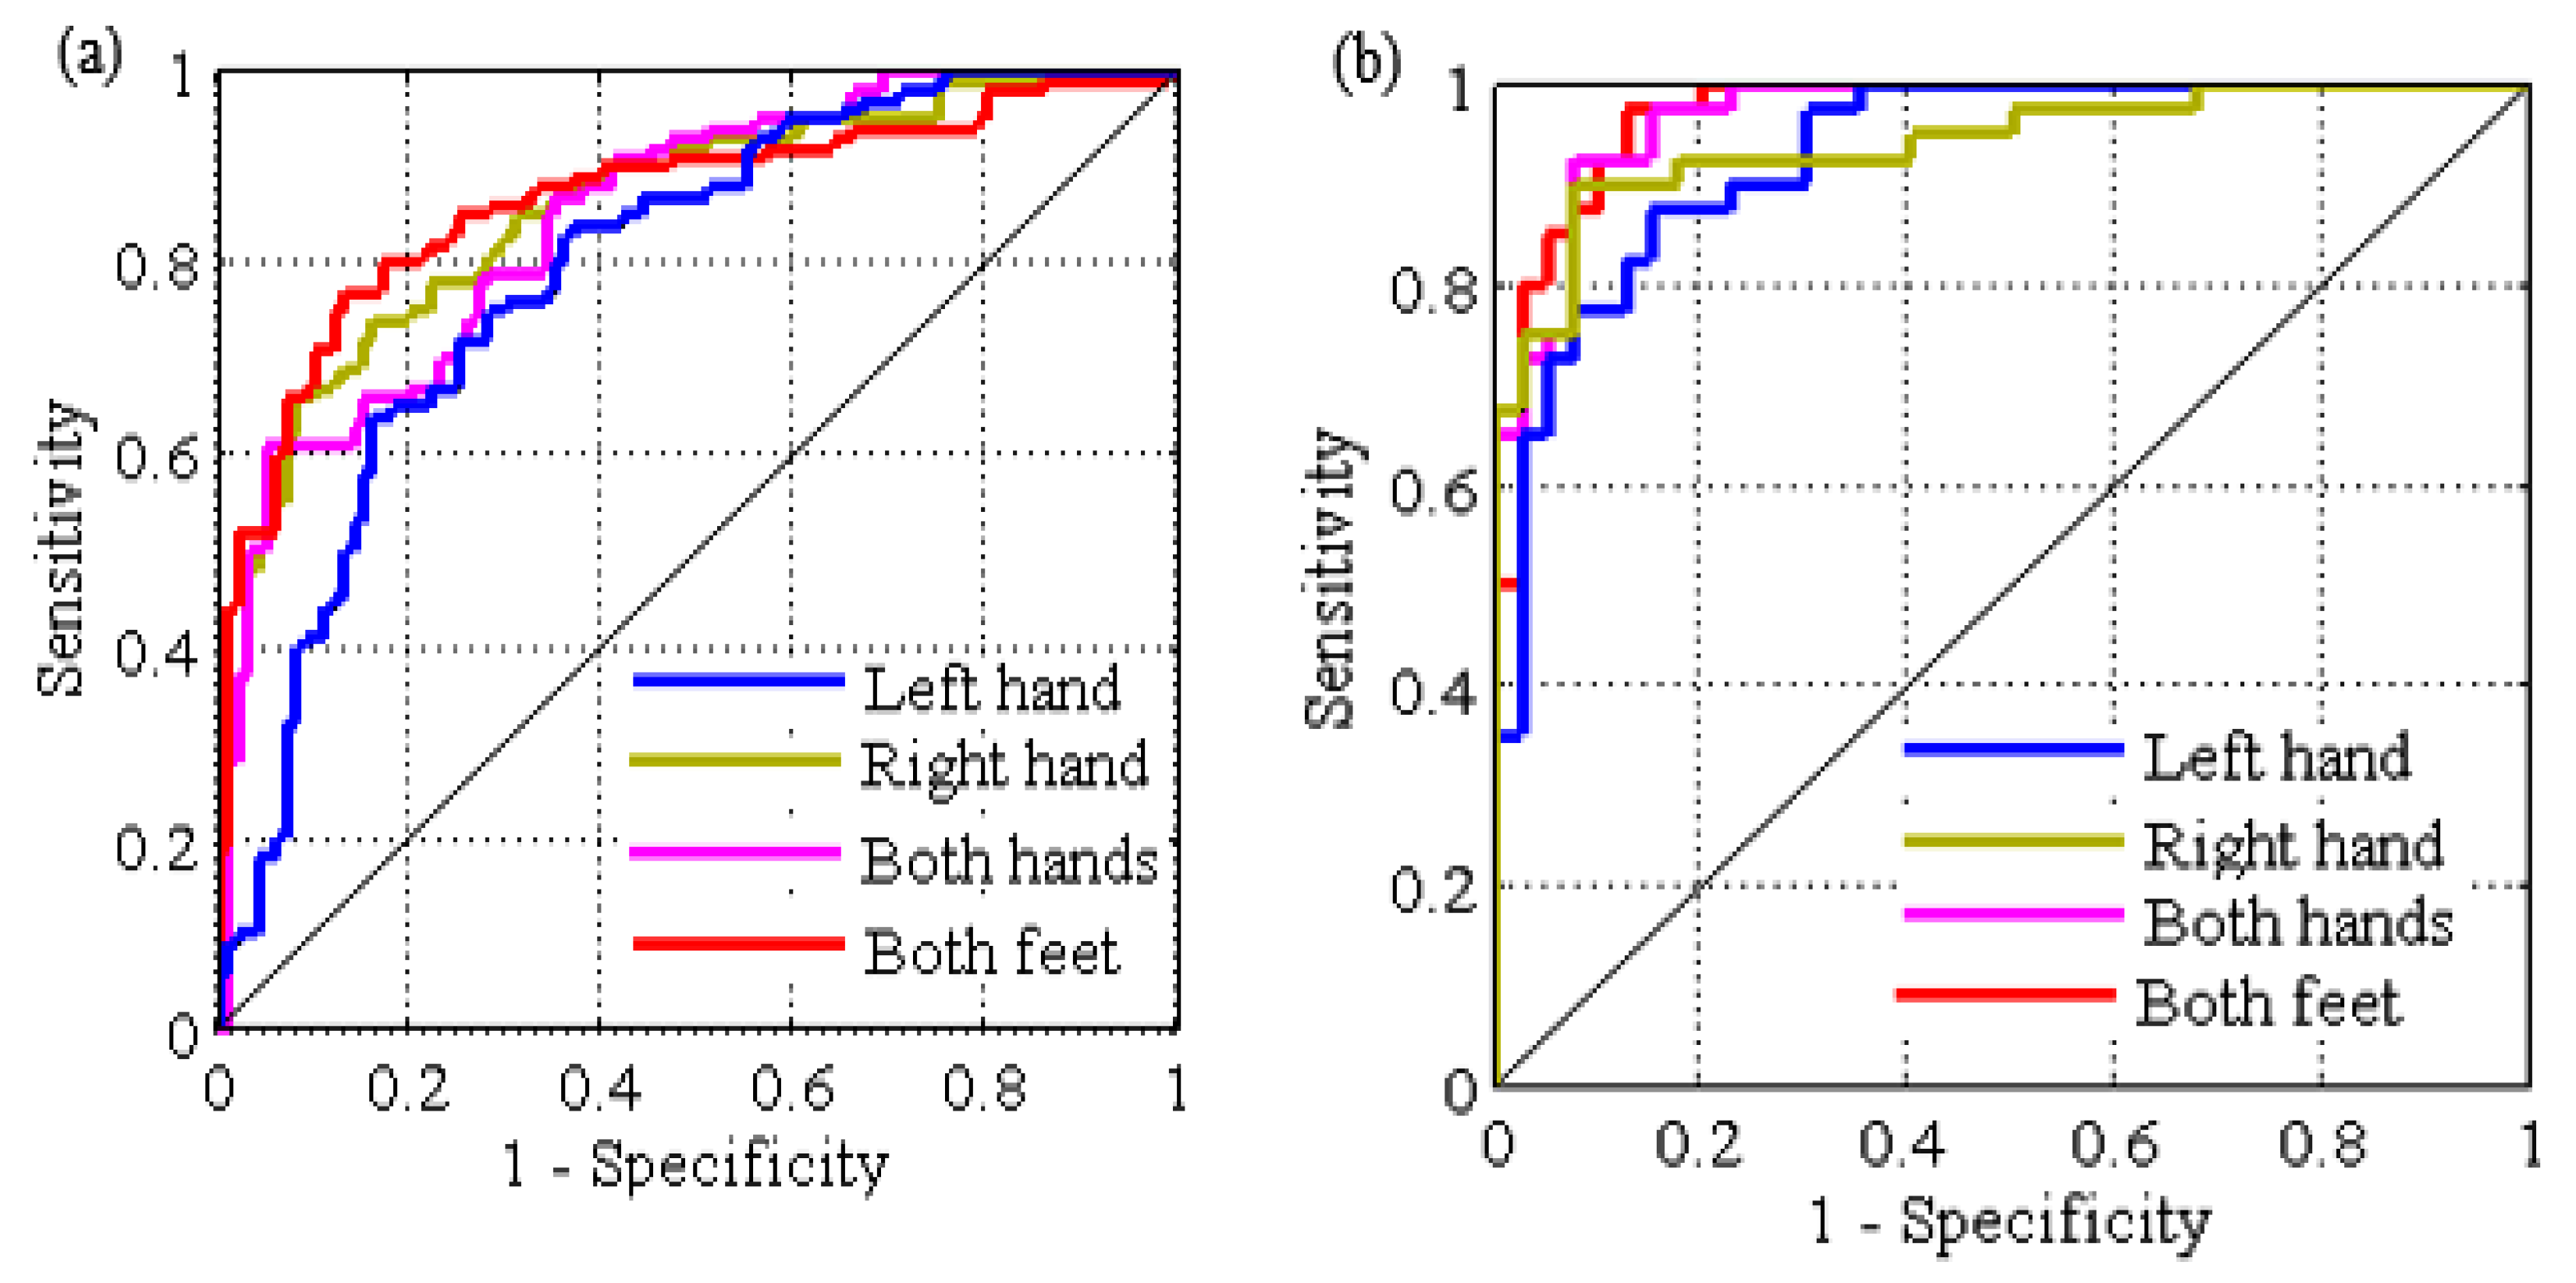
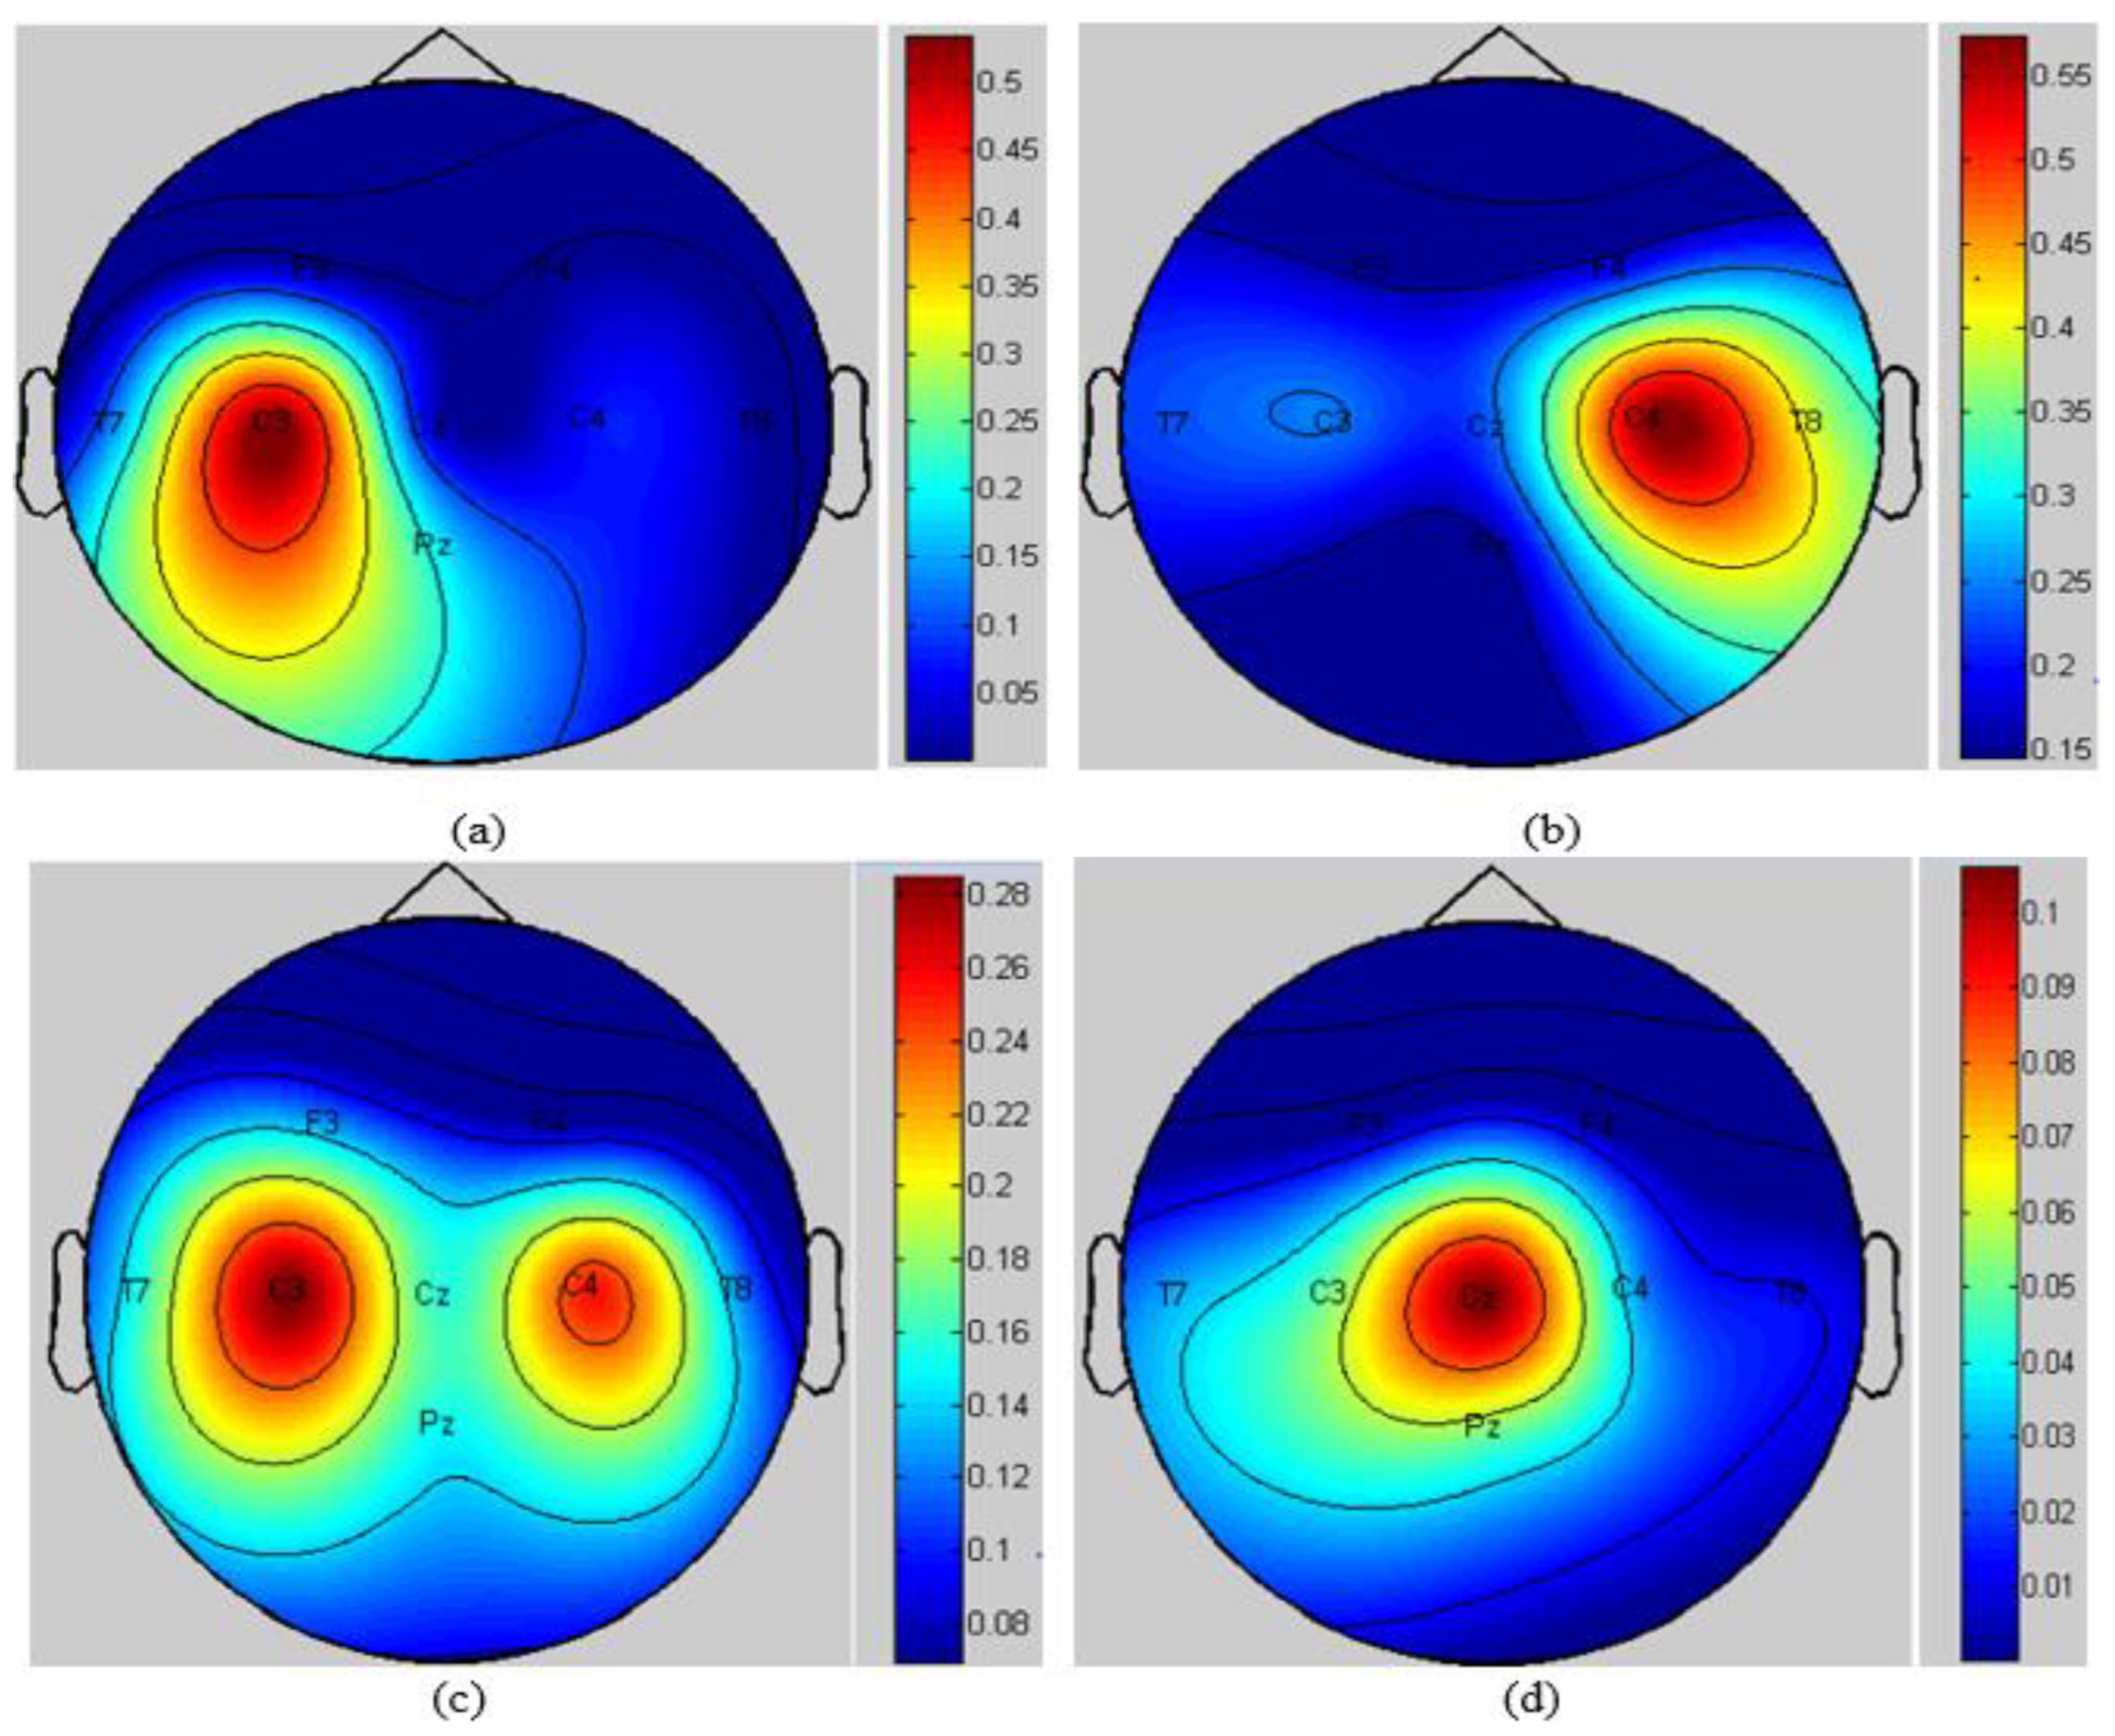
3.1. Effect of ROI on Intrinsic Time-Scale Decomposition

The effects of ROI on the four classes of motor imagery using ITD are presented in Figure 4. The ROI was based on the ERD/ERS and the significant features of the recorded data. It was evaluated using the kappa coefficient (k). Kappa coefficients in the range of 0.70−0.95 were found for all subjects. For ITD with ROI estimation, varied time−frequency distributions across the subjects were observed. These are clearly seen with higher kappa coefficients; however, certain subjects, such as 3, 4, 6 and 15, show lower kappa coefficients; this is due to the distinctions in the physiologies and brain states of the subjects [24]. On average, the kappa coefficient increased by ~14.20% for ITD with ROI estimation compared to that without ROI estimation. Thus, it can be concluded that the ITD with ROI estimation enhances the classification performance.
To further investigate the effects of ROI on ITD, we used the receiver operating characteristic (ROC) to evaluate the discrimination of motor imagery movements of both hands, both feet, right hand and left hand. The ROC curves are shown in Figure 5a,b for Subject 1. Figure 5a shows the classification evaluation of ITD without ROI estimation. On average, the classification accuracy, sensitivity, specificity and area under the curve (AUC) values of ITD without ROI estimation for the right hand, left hand, both hands and both feet were, respectively: 75.00%, 75.00%, 75.00% and 81.91%; 81.66%, 79.79%, 77.91% and 87.03%; 79.58%, 80.21%, 80.83% and 88.08%; and 74.16%, 78.12%, 82.08% and 83.87%, as shown in Figure 5a. The corresponding values of classification accuracy, sensitivity, specificity and AUC for ITD with ROI estimation were, respectively: 84.58%, 86.25%, 87.91% and 92.99%; 91.66%, 91.46%, 91.45% and 97.19%; 98.33%, 98.12%, 97.91% and 99.64%; and 90.00%, 91.45%, 92.91% and 97.20%, as shown in Figure 5b. From the results, it is clear that the ITDs with ROI estimation outperform those ITDs without ROI estimation in all classification measurements. Thus, it can be stated that ROI features or ERD estimations greatly improve the classification performance. For Subject 2, similar observations, with slightly different values of classification accuracy, sensitivity, specificity and AUC, were observed, as seen in Figure 6 and Table 1. The effectiveness of ROIs in distinguishing among the four tasks’ motor imagery is supported by the higher AUC, sensitivity and specificity. The ROCs of ITD for subjects 3 to 14 and the subjects’ performance with and without ROI estimation are shown in Supplementary Figure S1 and Table S1, respectively.

3.2. Neurophysiological Properties of Motor Imagery Movements

The neurophysiological properties of EEG for Subject 3 are shown in Figure 7. The topographic map was used to evaluate the physiologically plausible results of the recorded EEG and the dissimilarity at different frequencies: alpha of 8 Hz to 12 Hz, and beta of 14 Hz to 28 Hz. The data behavior at specific frequency bands was computed using the coefficient of determination (color coded r2) as a function of electrode location, as in [14]. Figure 7a shows the r2 topography map for the specific frequency component of the right-hand motor imagery compared to the rest state, correlated with the right side of the sensorimotor cortex (C3). Figure 7b displays the topographical distribution of the motor imagery tasks for the left hand; the expected spatial response for the left-hand motor imagery movement agrees with the spatial distribution for all subjects. In Figure 7c, a high r2 value indicates a region in a specific frequency band that was activated differentially between the imaginations of both hands and the rest state for both hands. Figure 7d displays the r2 topography for both feet motor imagery compared to the rest condition; additionally, the high r2 value correlated with a specific frequency in feet area (Cz). It was found that the topographies of r2 significantly discriminate between the two motor imagery conditions and were clearly restricted to the sensorimotor cortical areas involved. The Rolandic beta and mu rhythms in the human brain were observed in sensorimotor areas with frequency bands between 10 Hz and 20 Hz [15]. These frequency bands show typical responses associated with the subject’s movement and motor imagery [16,17,18]. The topography of the frequencies associated with maximum control in the mu and beta bands were found. The locations line up with the expected sites of the peri-rolandic sensorimotor cortex. Thus, a clear and locally restricted spectrum of the channels for which participants had maximum control (i.e., the largest values of the correlation between channel location and the EEG feature) was observed. The results of this work support the notion that hand/foot motor imagery activates neural networks in the cortical hand/foot areas, which were displayed here as the blocking of mu and beta rhythms in the contralateral hand/foot areas; previous studies in [16,17] also showed similar findings. Topography maps for subjects 3 to 13 are shown in Supplementary Figure S2.

3.3. Confusion Matrix

The confusion matrices with and without ROI’s estimation for four classes of motor imagery using ITD are presented in Table 2 and Table 3, respectively. Different classification behaviors of the motor images were observed. For ITD with ROI estimation, the classification accuracy was 95.08% for both feet, 94.40% for the right hand, 91.70% for the left hand and 89.63% for both hands; whereas for ITD without ROI estimation, these values were 80.08%, 82.94%, 79.01% and 76.03%, respectively. Thus, ITD with ROI estimation showed 12.76 to 15.17% higher classification accuracy compared to ITD without ROI estimation.

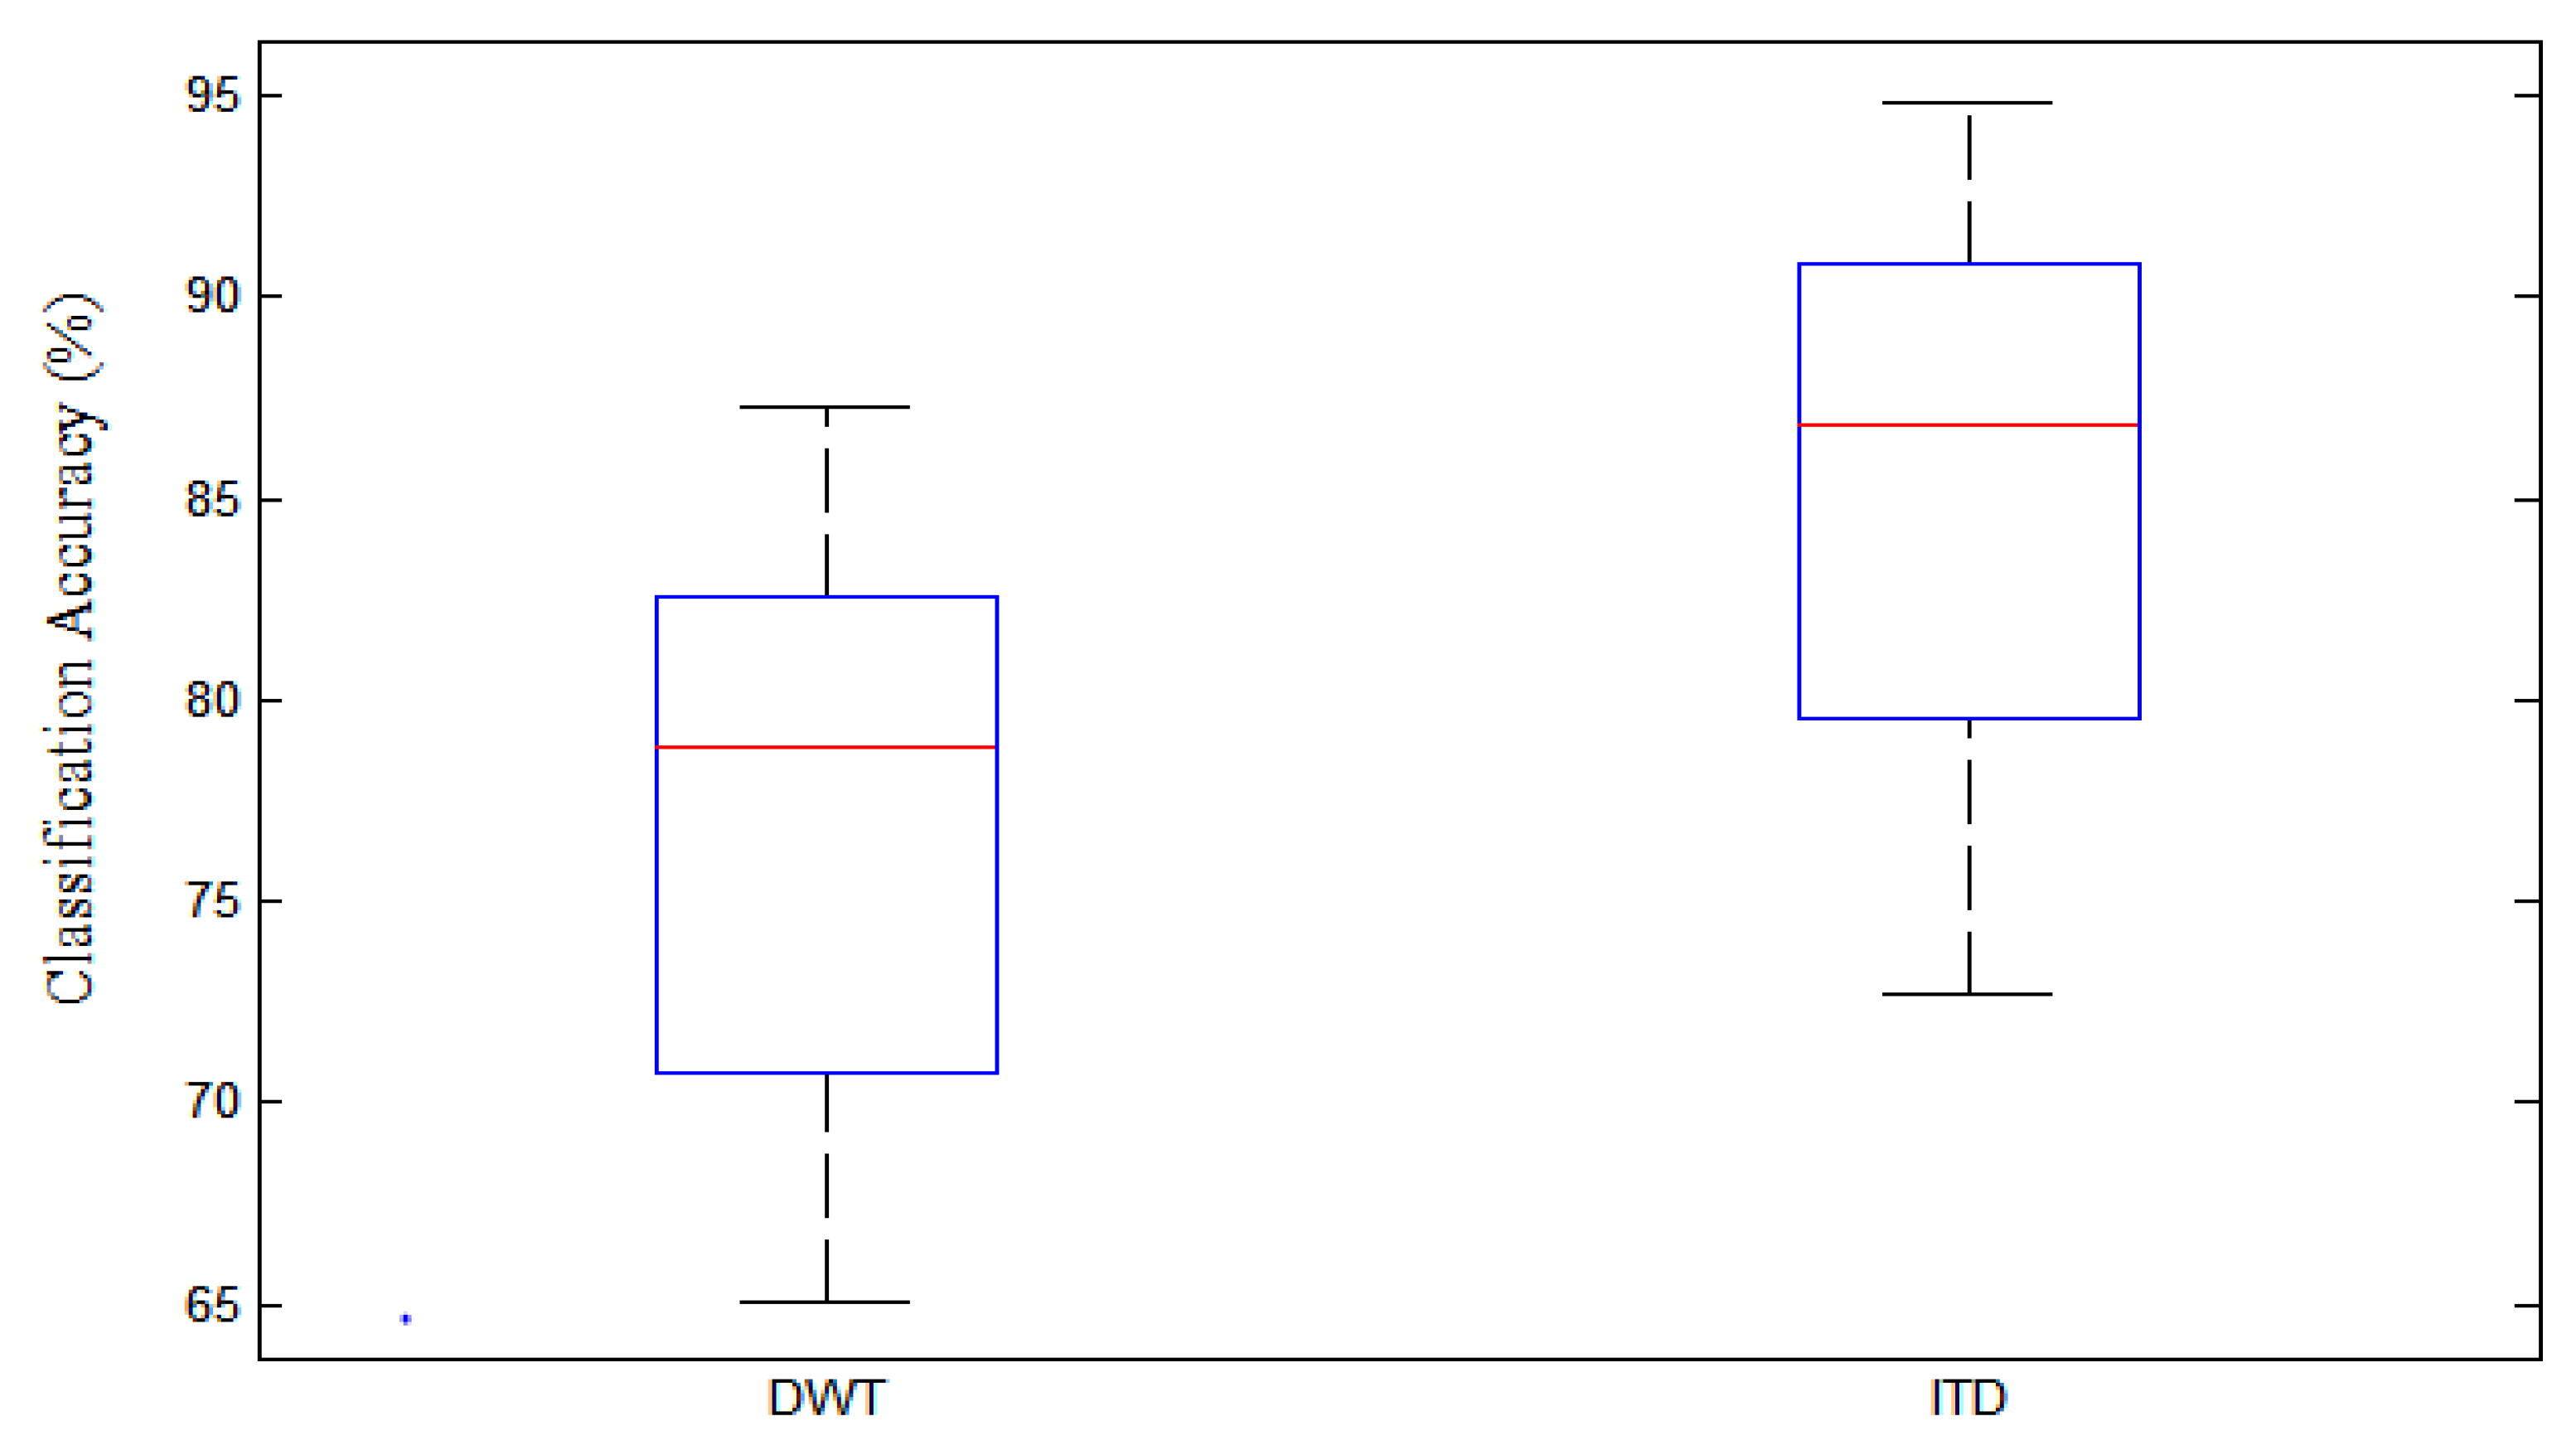
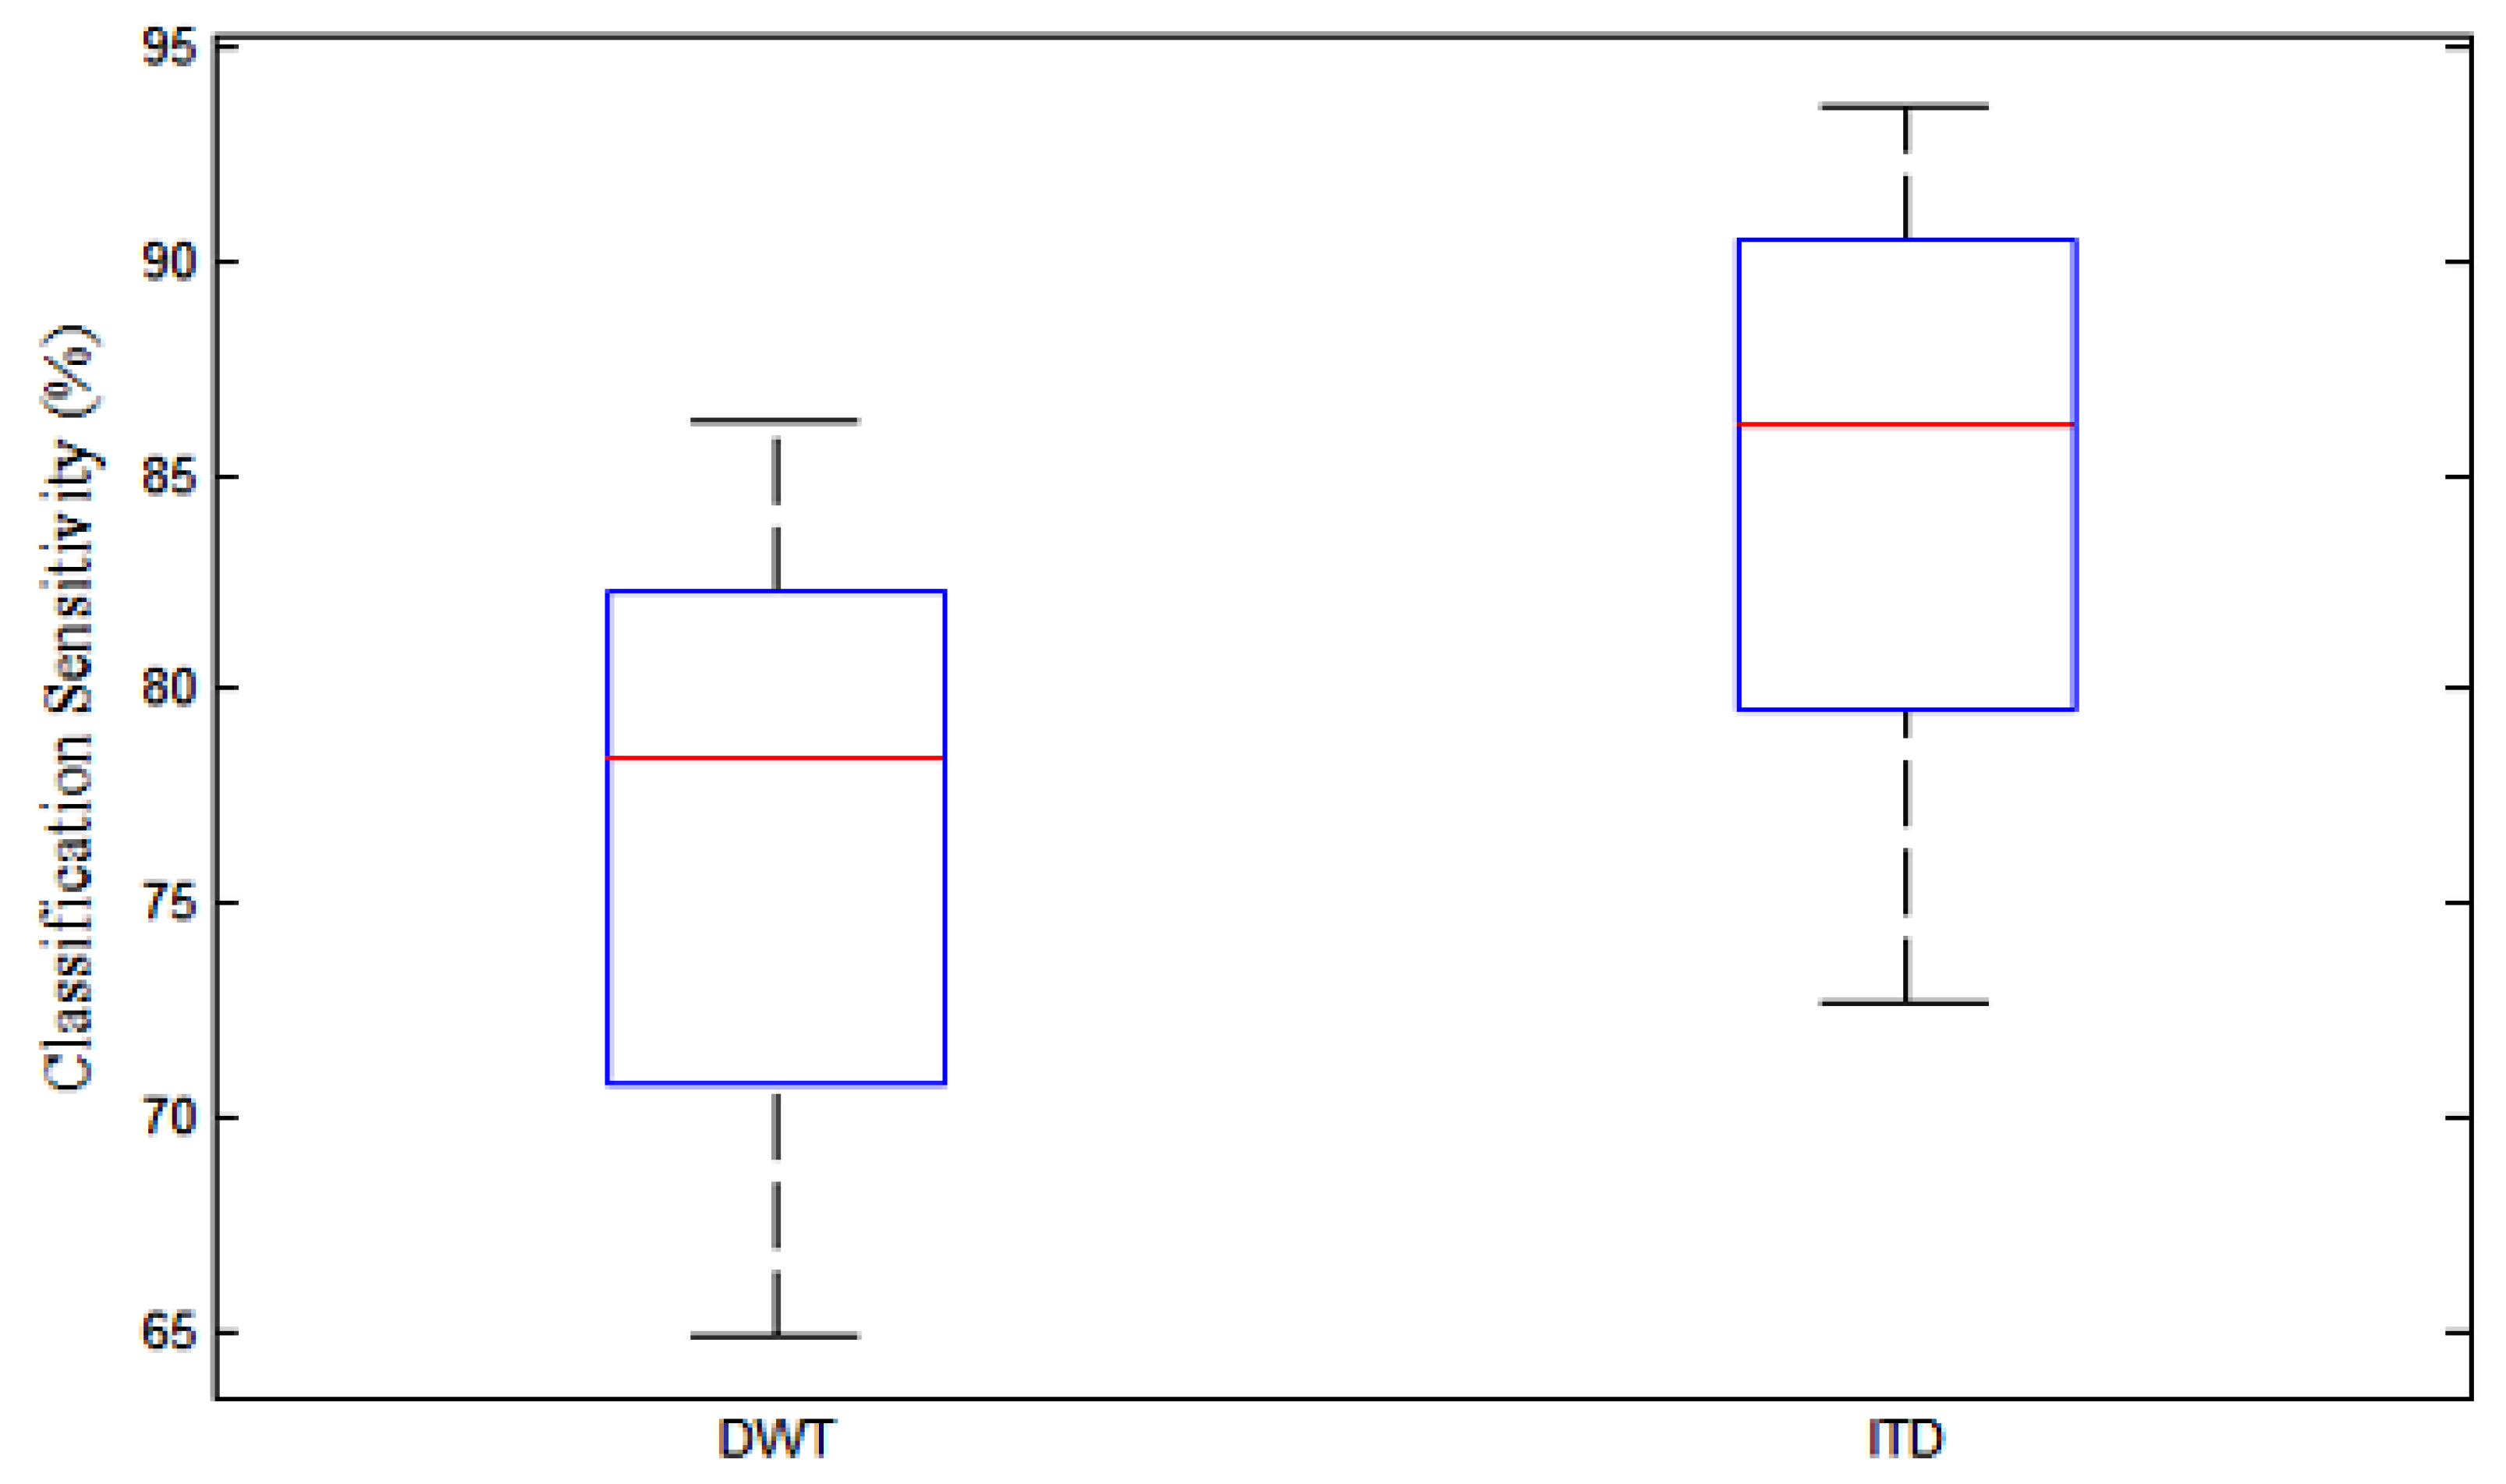
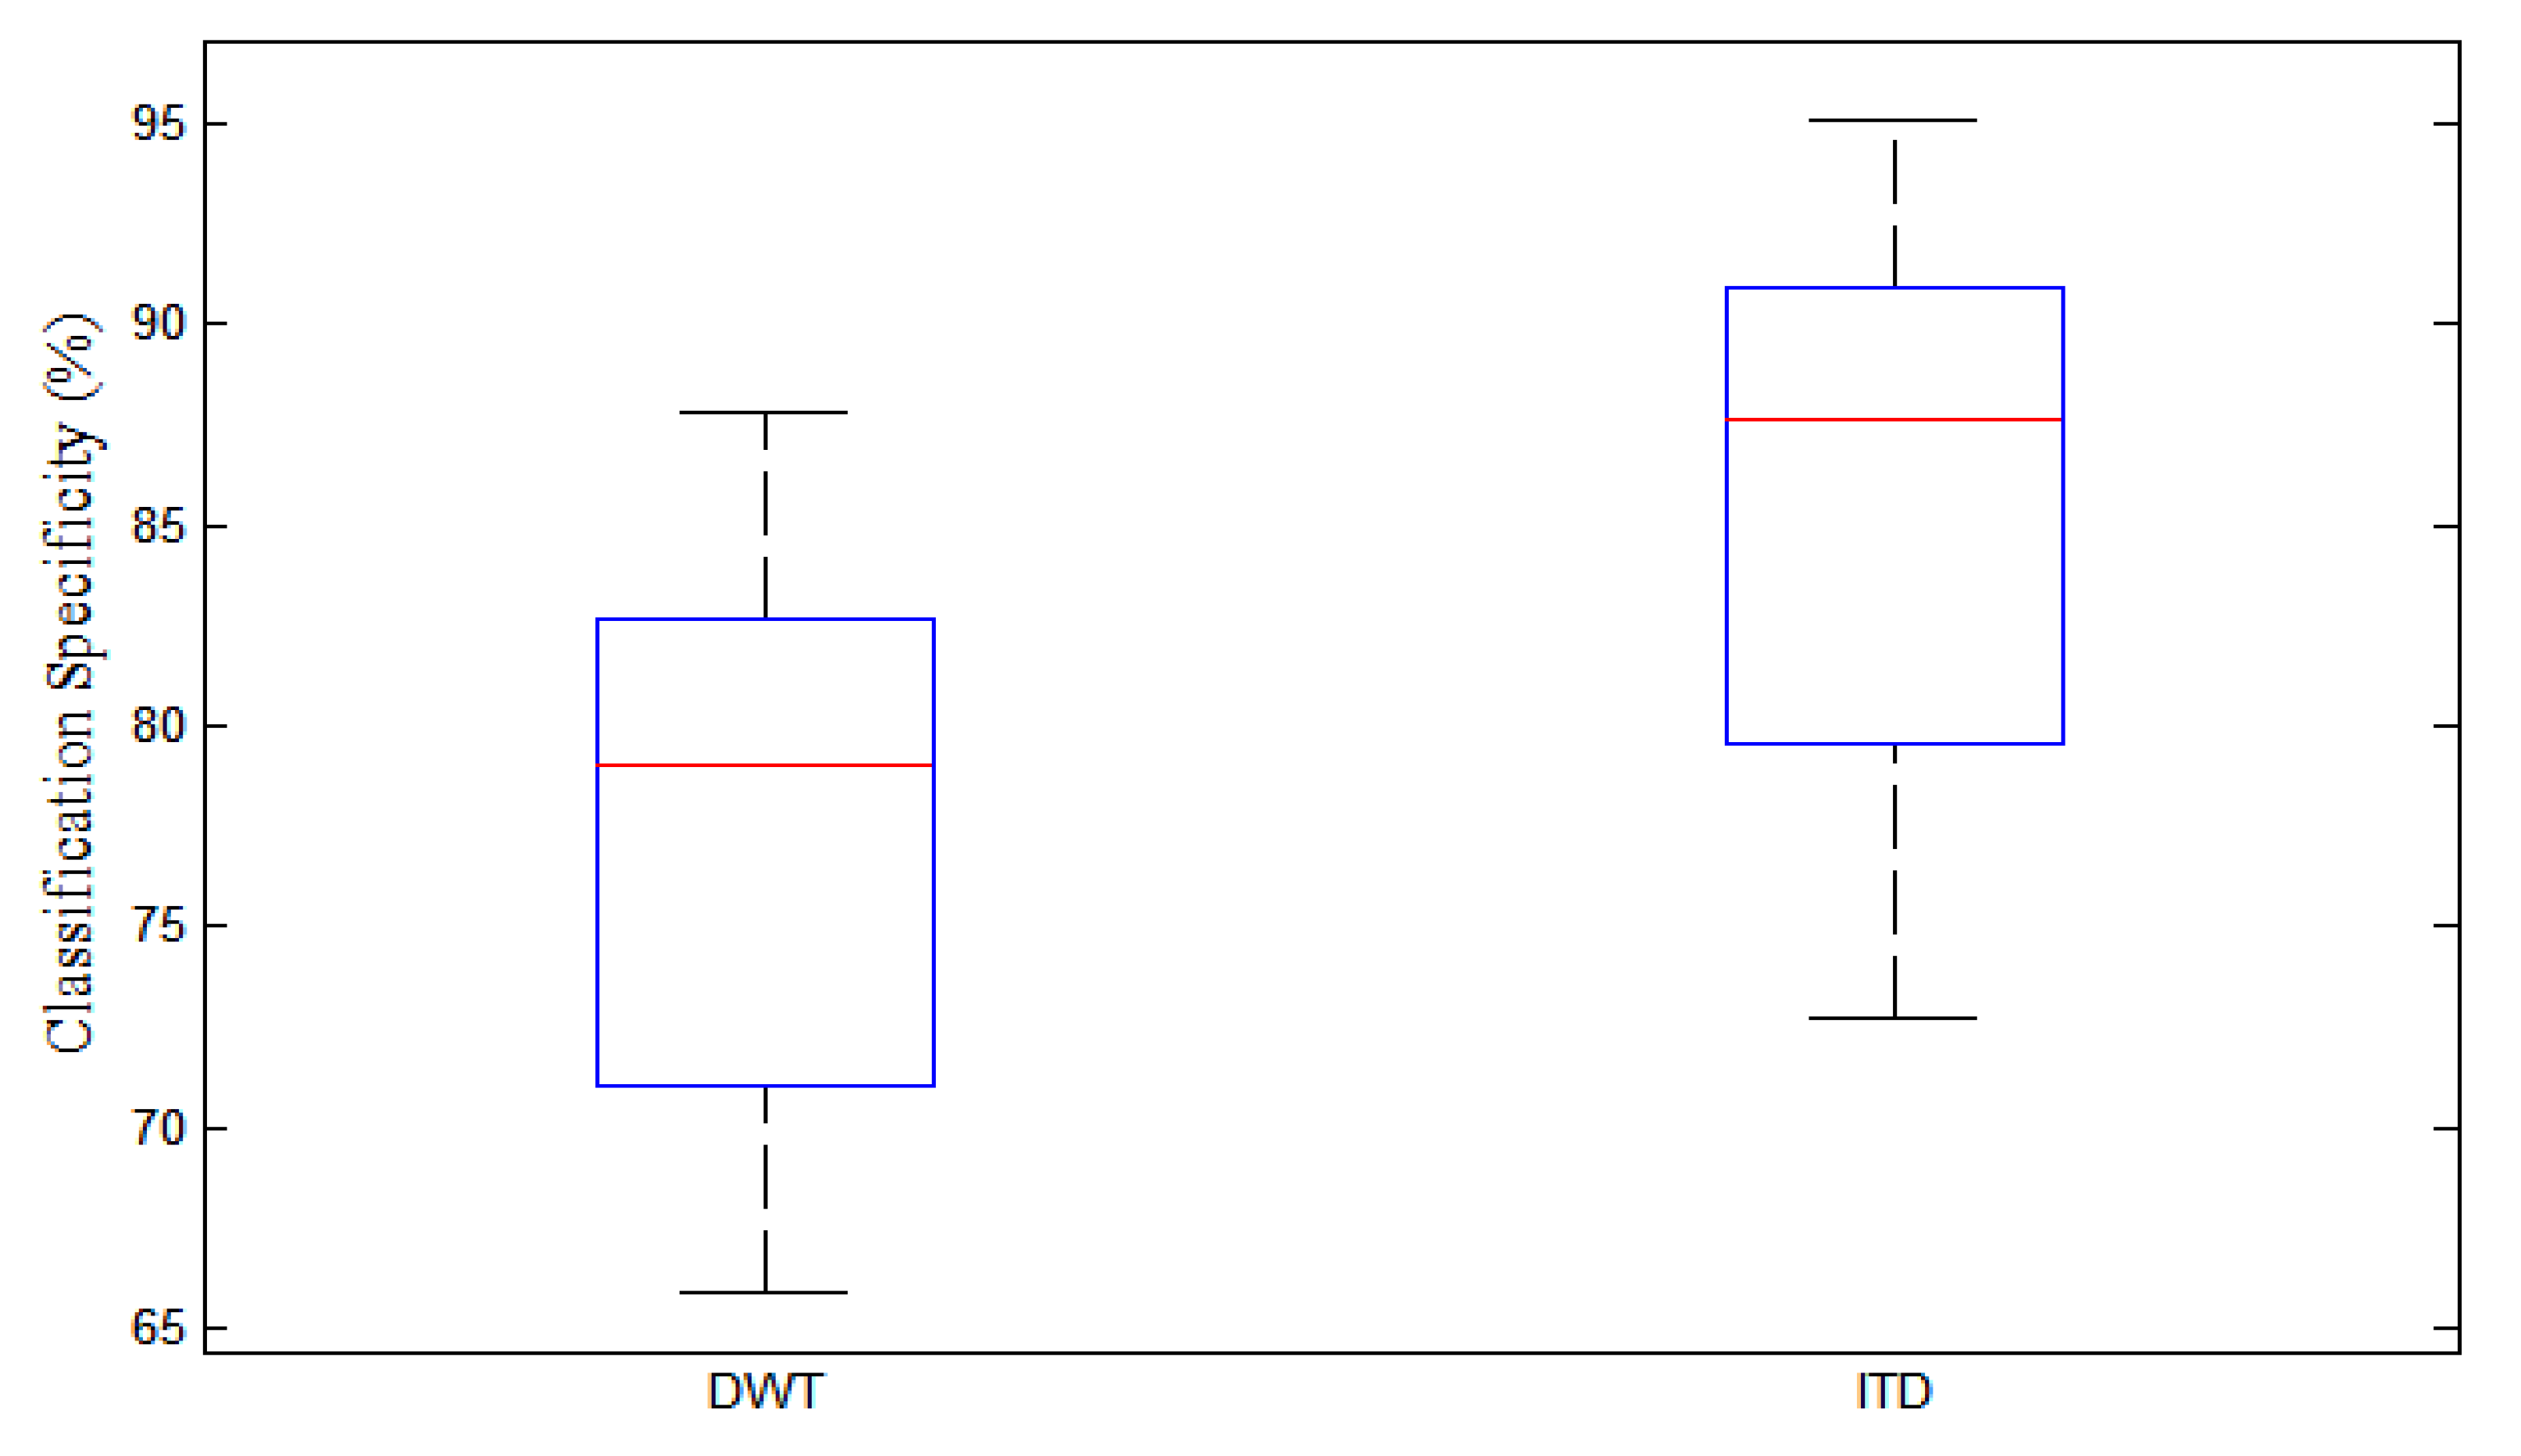
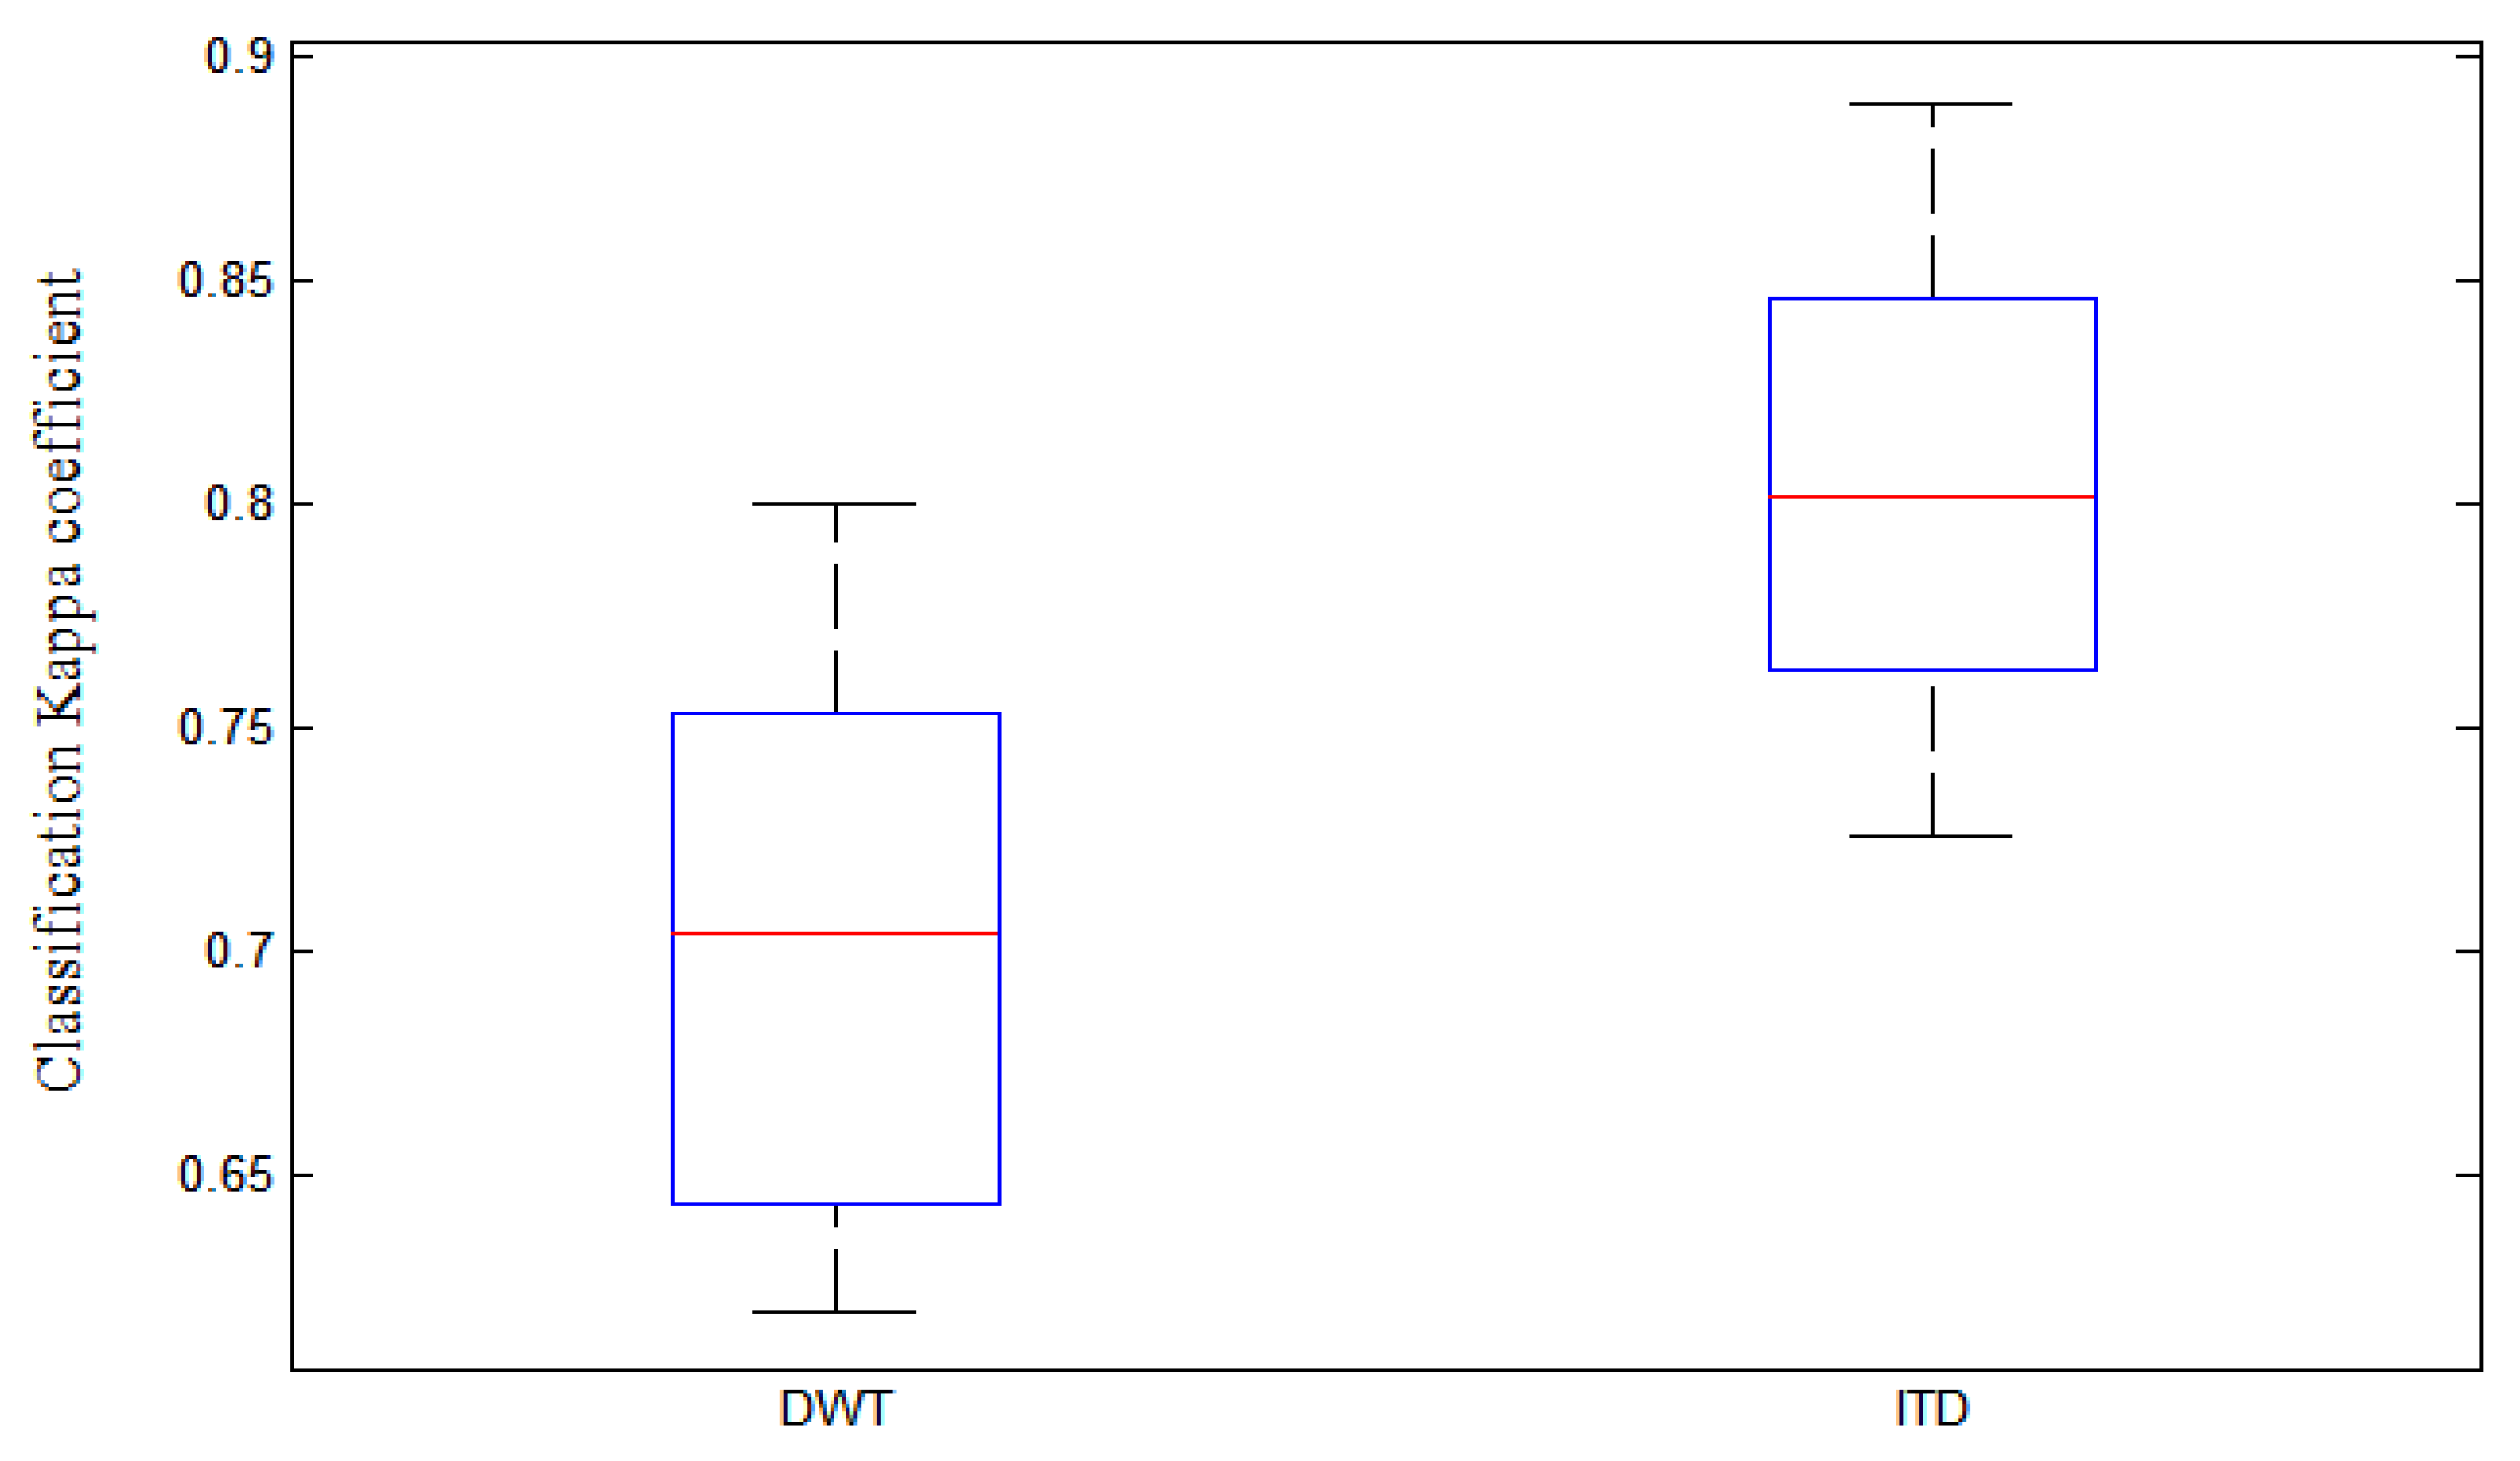
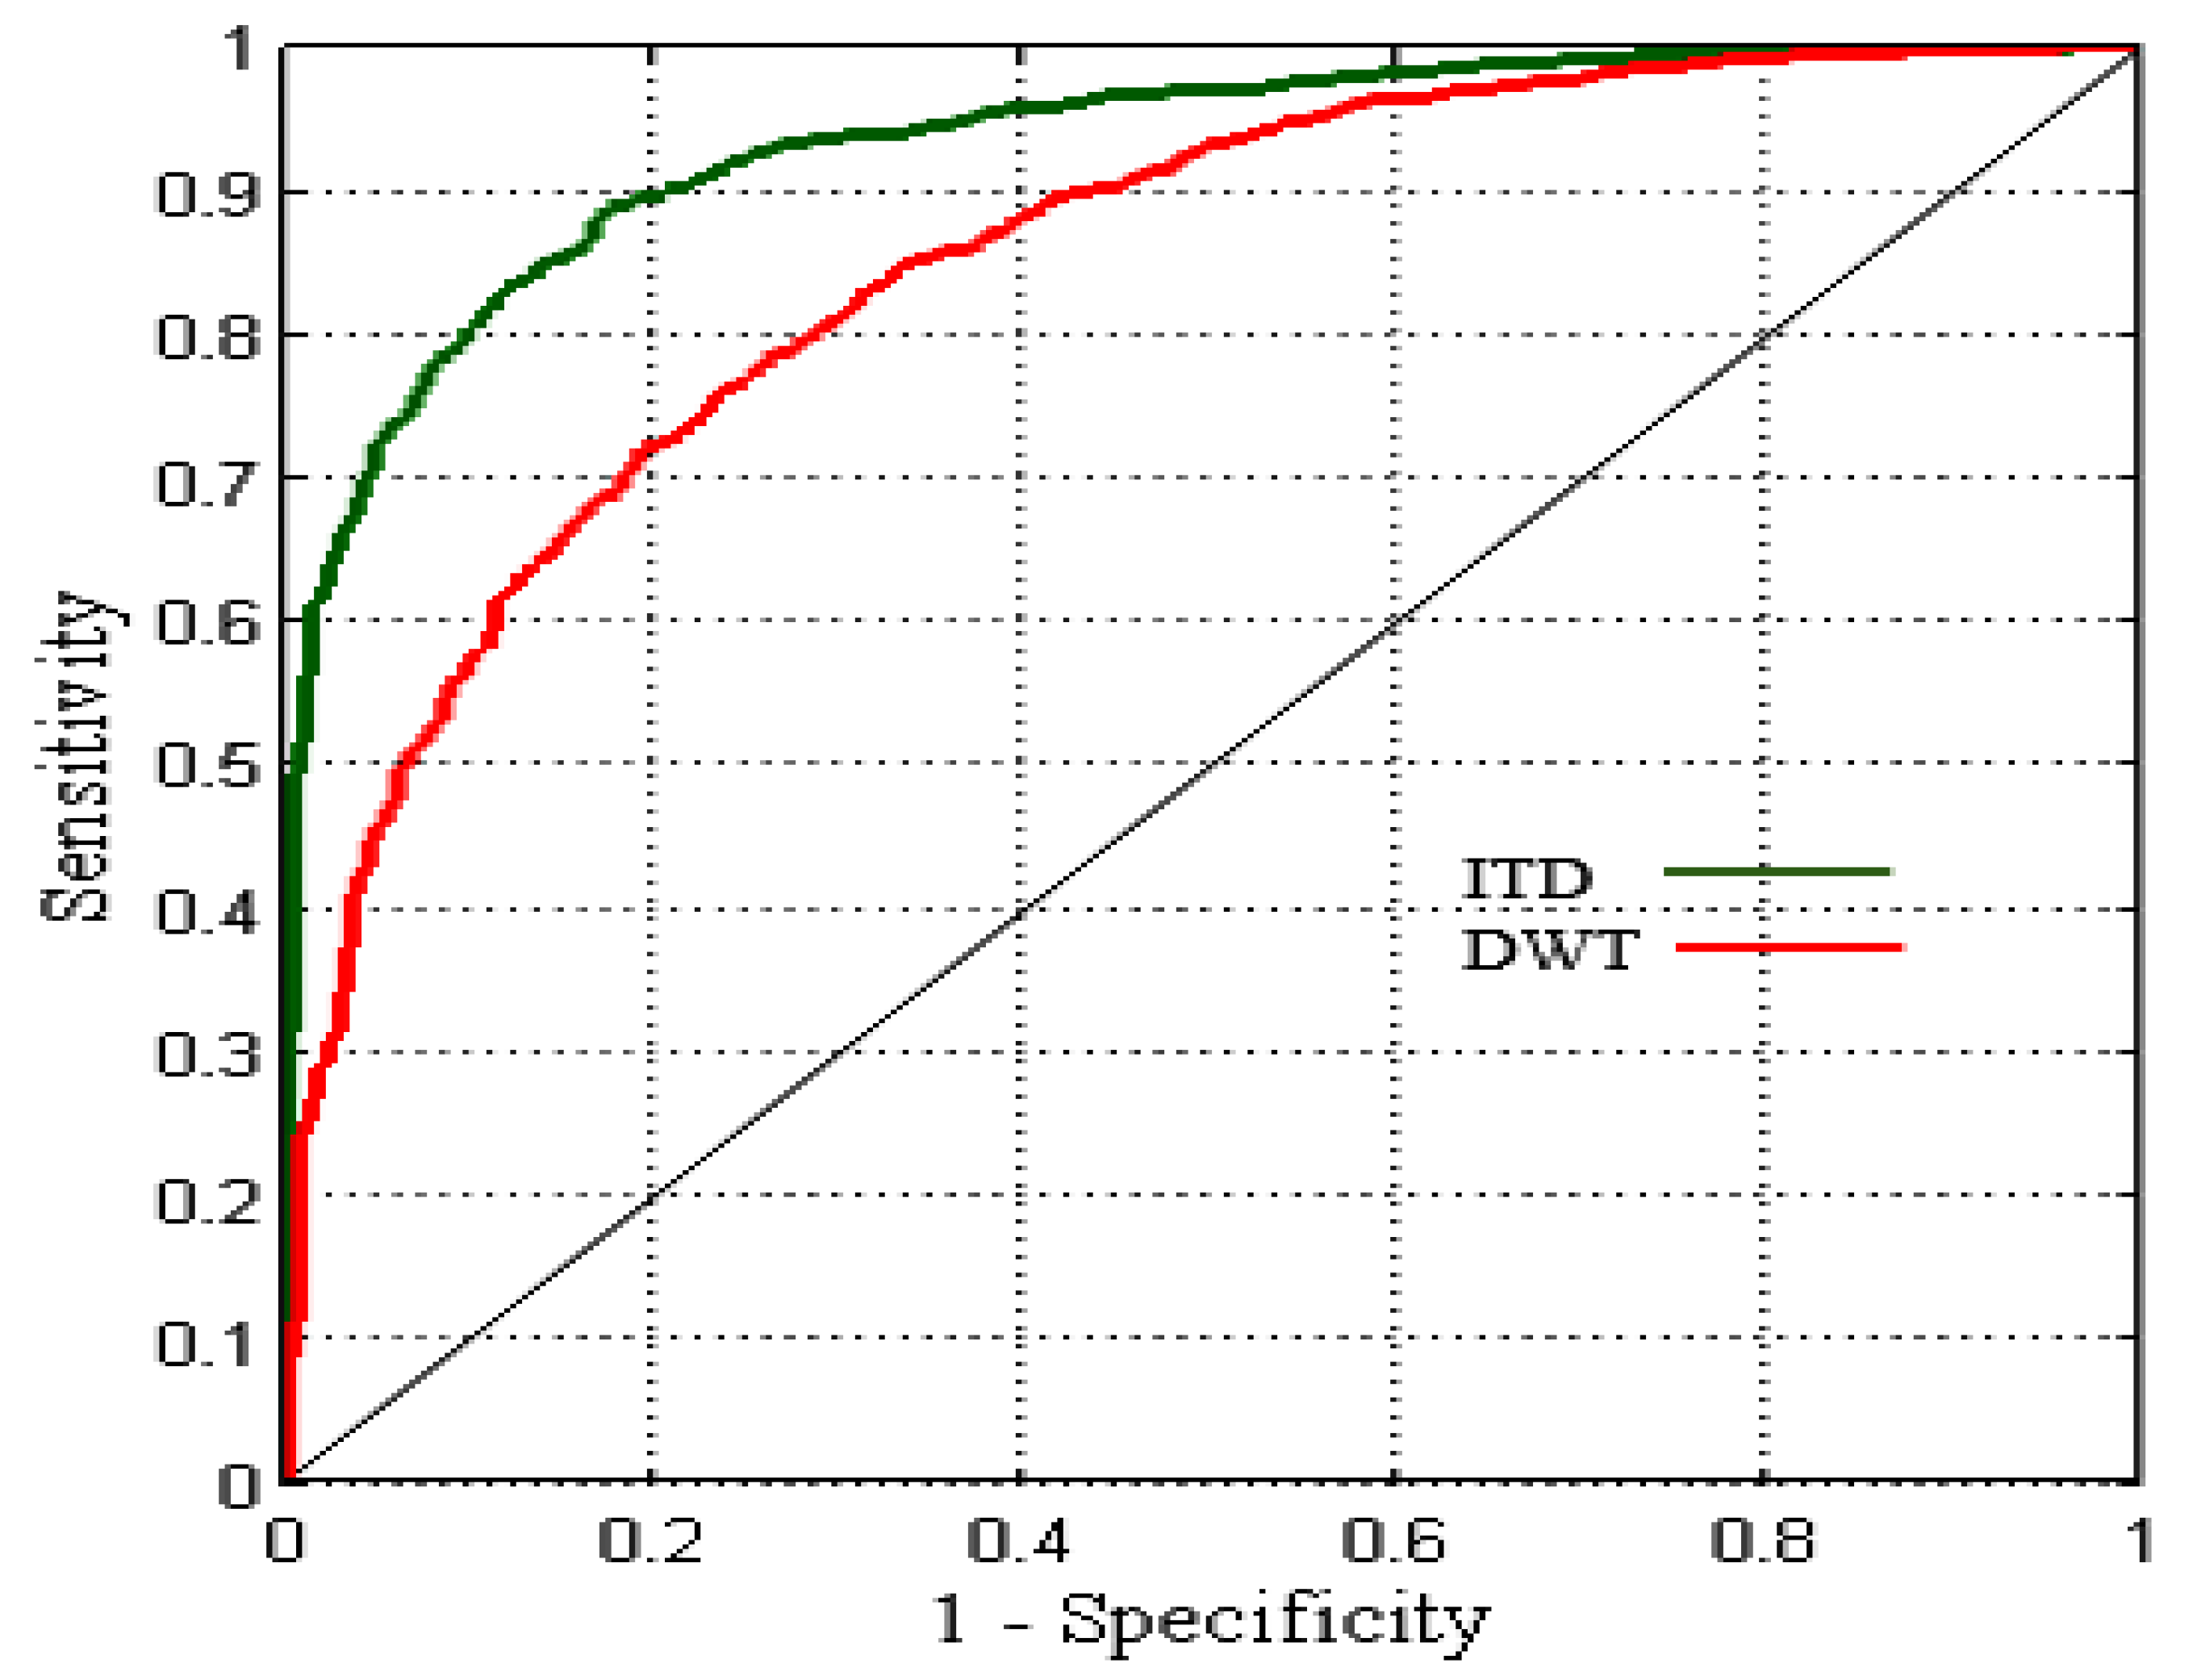
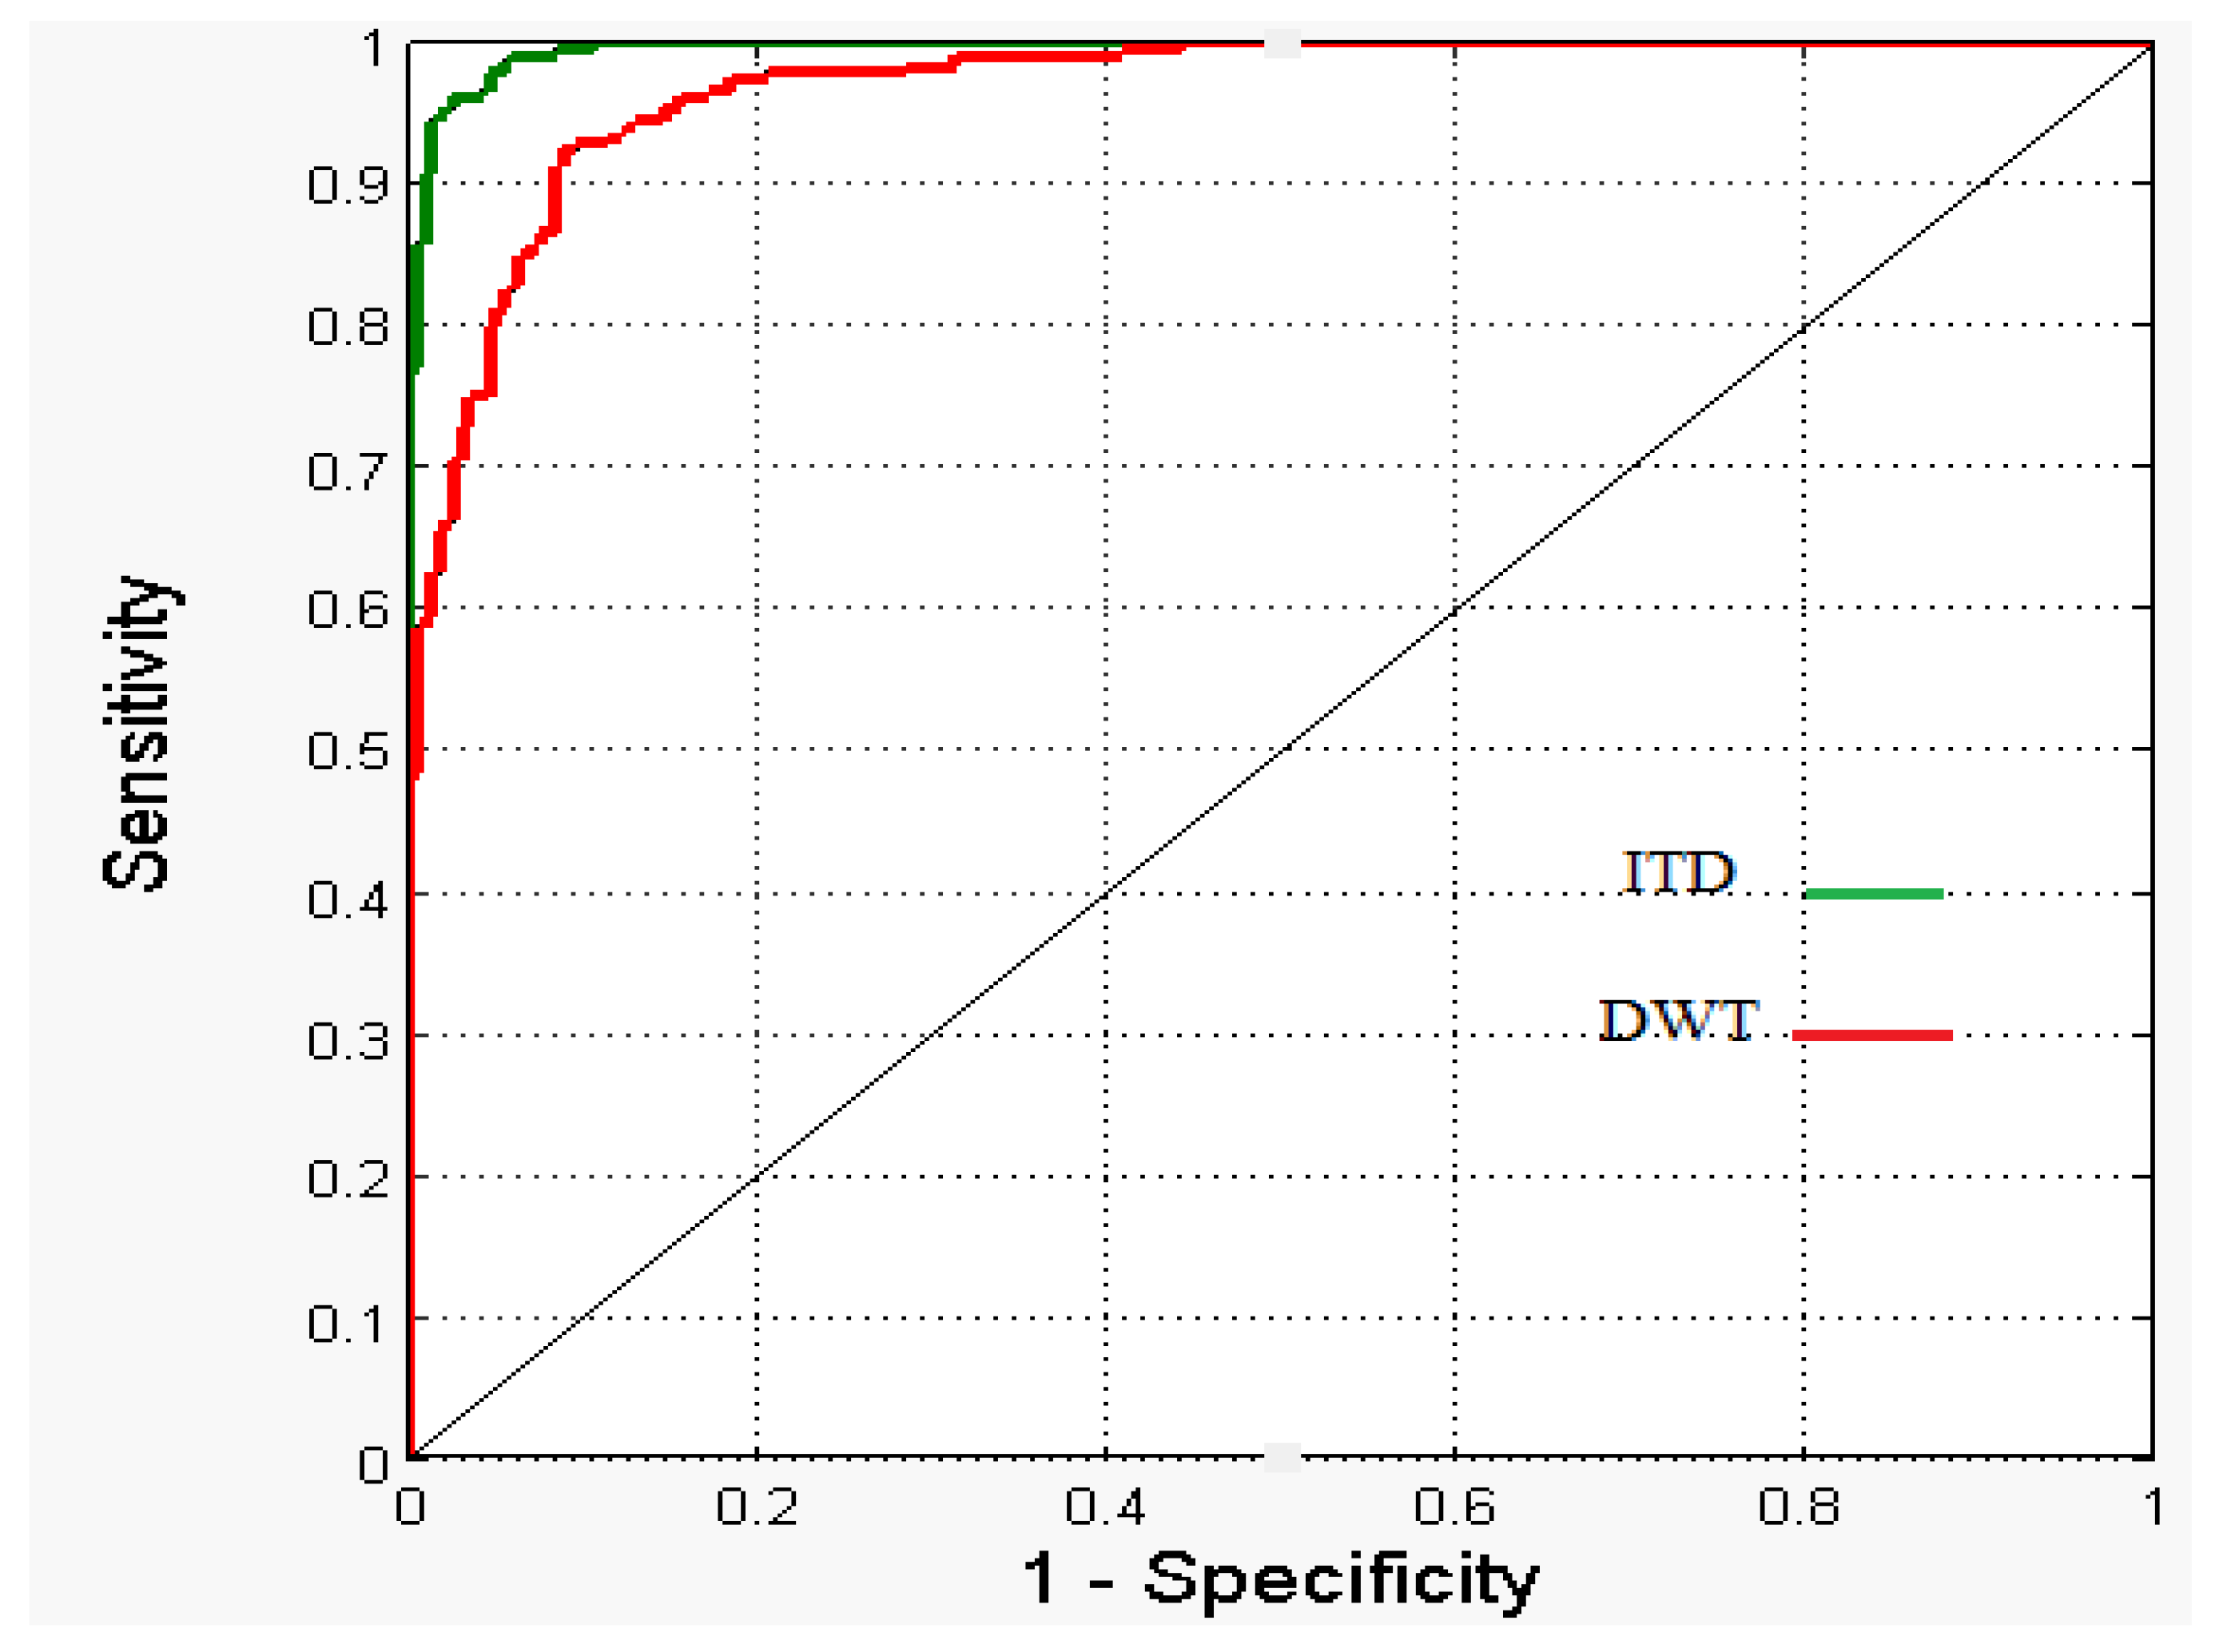
3.4. Comparison of ITD Technique with DWT without ROI Estimation

During motor imagery tasks, changes in the state of the brain lead to changes in EEG frequency and amplitude. Thus, for a clearer understanding of a nonlinear model of ITD to better map the signals into one of the four classes, the ITD approach was compared and validated using discrete wavelet transform (DWT). The comparative classification results of ITD and DWT without ROI are illustrated in Figure 8. On average, for the 15 subjects, the mean classification accuracy obtained was 78.39% for DWT and 86.80% for ITD. From Figure 8, it is clearly seen that the ITD increased the average classification accuracy not only for the 15 subjects but also for the individual subject, as evidenced by the smaller error in the boxplot. The percentage increase in classification accuracy for ITD was 9.68% compared to that of DWT. This change was found to be significant at a level of p < 0.001. The ITD method drastically improves the accuracy of the system, as well as the capabilities of this method to separate among the four classes of motor imagery movements compared to the equivalent decomposition method of DWT without ROI. In summary, the improvements brought upon by ITD are mainly due to better handling of critical cases [35].
Figure 9 shows the boxplot of the mean classification results for sensitivity. The average classification sensitivity for ITD and DWT was 86.14% and 78.39%, respectively. The ITD sensitivity improved by 8.99% compared to that of DWT. This change was significant at p < 0.001.
Figure 10 shows the boxplot of the specificity for ITD and DWT. The mean classification specificity for ITD and DWT was 87.73% and 79.05%, respectively. Compared to the specificity of DWT, the ITD specificity increased by 9.89%; this change was significant at p < 0.001.
Figure 11 shows the boxplot of the kappa coefficient classification for ITD and DWT. The average kappa coefficients for ITD and DWT were 0.8011 and 0.7042, respectively.
The comparative results of ROCs between ITD and DWT are shown in Figure 12. The green line shows the results of the ITD method, while the red line shows the results of the DWT method. The classification accuracy of ITD was 86.80%, with a sensitivity of 84.14% and a specificity of 87.73%. The classification accuracy for DWT was 78.58%, the sensitivity was 78.39% and the specificity was 79%. A comparison between the ITD and DWT decomposition methods showed that the ITD algorithm outperformed DWT by showing a higher accuracy of feature classifications for different motor imagery tasks. The DWT algorithm is sensitive to wavelet function and wavelet level. DWT has more difficulties in treating both hands’ classes. On the other hand, the effect of this problem on the ITD approach does not seem to be too significant. This is mainly due to better handling of critical cases, resulting in a 9.47% improvement in classification accuracy of both hands’ classes. DWT lacks fast algorithms; it takes up to 12.83 times longer compared to ITD.

3.5. Comparison of ITD Technique and DWT with ROI Estimation

The ROC results between ITD and DWT with ROI are shown in Figure 13 using the stated dataset. The classification accuracy of ITD was 96.875%, with a sensitivity of 0.9625 and a specificity of 0.975. The classification accuracy for DWT was 89.765%, the sensitivity was 0.8925 and the specificity was 0.89125.

3.6. Validation and Comparison with the Existing Methods from the Literature

With reference to Table 4 below, the result from ITD based region of interest using the BCI Competition IV dataset indicated an accuracy of 96.87% compared to that utilizing our own collected data, which generated 92.70% accuracy; this resulted in 4.30% more accuracy. On average, with the Competition IV dataset, ITD showed 8.56% and 7.32% higher classification accuracy compared to CSP and DWT, respectively.

4. Discussion

From the results, it is clear that the ITDs with ROI estimation outperform those without ROI estimation in all classification measurements. Class reparability was observed with the selected features, which accommodate outliers and obtain better generalization properties. Thus, it is plausible to say that the classifier results of this paper are in agreement with the results reported by Yang et al. [7]. A comparison between the ITD and DWT with ROIs showed that the ITD with ROIs outperformed DWT with ROIs, by producing a higher accuracy of feature classifications for different motor imagery tasks. The kappa coefficient of ITD increased by 0.0969 than that of DWT, on average; this was significant at p < 0.001. The improvements in the classification accuracy achieved in this study are also consistent with the existing ITD studies by Martis et al. [22]. These findings further verify the potential of the proposed ITD method in facilitating an automated technique for developing effective framework assessment strategies. The investigated ITD method was found to outperform those introduced by Tanaka et al. [3], Jiang et al. [25] and Galan et al. [4] by 5.3% to 14.8%. In their work, these authors used fewer subjects (the maximum being 6 subjects) and fewer classes (the maximum having 3 classes).

5. Conclusions

In this study, subject-specific regions of interest (ROIs) based on optimal ERD patterns were proposed for motor imagery BCI systems. Higher mutual information of time–frequency was obtained from each motor imagery sample. The features were extracted using ITD or DWT from each time–frequency segment and combined with the neural network classification to evaluate the effectiveness of the proposed ITD with ROI and DWT with ROI techniques. The own recorded data was validated with a dataset from BCI Competition IV; here, the ROI-based ITD achieved the highest accuracy of 92.70%, whereas for the ROI-based ITD using the Competition IV data, the accuracy was 96.87%. Compared to DWT with ROI and CSP, ITD with ROI estimation showed a higher classification accuracy of 7.32% and 8.56%, respectively. Thus, the proposed algorithm employing subject-specific regions of interest is promising for practical applications in motor imagery-based brain–computer interface systems.

Supplementary Materials

The following supporting information can be downloaded at: https://www.mdpi.com/article/10.3390/app13116364/s1, Figure S1: ROC of ITD for subjects 3 to 14, Figure S2: Topography maps for subjects 3, 4, 5, 7, 8, 9, 10, 12, and 13 at the frequencies of the mu rhythm (8 to 12Hz) and beta rhythm (18 to 30Hz), comparing each motor imagery task with the resting condition, Table S1: Performance using ITD with and without ROI for subject’s 3 to 15.

Author Contributions

Conceptualization, E.A.M. and M.Z.Y.; data curation, E.A.M. and I.K.A.; formal analysis, E.A.M., I.K.A. and M.Z.Y.; investigation, E.A.M. and I.K.A.; methodology, E.A.M. and M.Z.Y.; supervision, M.Z.Y.; validation, E.A.M. and I.K.A.; visualization, E.A.M.; writing—original draft, E.A.M. and I.K.A.; writing—review and editing, M.Z.Y. All authors have read and agreed to the published version of the manuscript.

Funding

This research was funded in part by the Ministry of Education Malaysia under the Higher Institutional Centre of Excellence (HICoE) Scheme awarded to the Centre for Intelligent Signal and Imaging Research (CISIR), Universiti Teknologi PETRONAS (UTP), Malaysia; and in part, by CISIR’s Opex Incentive FY2023 (Cost Centre: 015LB0-063).

Institutional Review Board Statement

The study was conducted in accordance with the Declaration of Helsinki, and approved by an internal ethics committee of the Centre for Intelligent Signal and Imaging Research (CISIR), Universiti Teknologi PETRONAS (29 November 2013).

Informed Consent Statement

Informed consent was obtained from all subjects involved in the study.

Data Availability Statement

Data is unavailable for sharing due to privacy or ethical restrictions.

Acknowledgments

The authors would like to thank Universiti Teknologi PETRONAS and the University of Blue Nile, and the participants for their supports and cooperations.

Conflicts of Interest

The authors declare no conflict of interest.

References

  1. Yuan, H.; He, B. Brain–computer interfaces using sensorimotor rhythms: Current state and future perspectives. IEEE Trans. Biomed. Eng. 2014, 61, 1425–1435. [Google Scholar] [CrossRef]
  2. Li, J.; Liang, J.; Zhao, Q.; Li, J.; Hong, K.; Zhang, L. Design of assistive wheelchair system directly steered by human thoughts. Int. J. Neural Syst. 2013, 23, 1350013. [Google Scholar] [CrossRef] [PubMed]
  3. Tanaka, K.; Matsunaga, K.; Wang, H.O. Electroencephalogram-based control of an electric wheelchair. IEEE Trans. Robot. 2005, 21, 762–766. [Google Scholar] [CrossRef]
  4. Galán, F.; Nuttin, M.; Lew, E.; Ferrez, P.W.; Vanacker, G.; Philips, J.; Millán, J.D.R. A brain-actuated wheelchair: Asynchronous and non-invasive brain–computer interfaces for continuous control of robots. Clin. Neurophysiol. 2008, 119, 2159–2169. [Google Scholar] [CrossRef]
  5. Nicolas-Alonso, L.F.; Gomez-Gil, J. Brain computer interfaces, a review. Sensors 2012, 12, 1211–1279. [Google Scholar] [CrossRef] [PubMed]
  6. Abiri, R.; Borhani, S.; Sellers, E.W.; Jiang, Y.; Zhao, X. A comprehensive review of EEG-based brain–computer interface paradigms. J. Neural Eng. 2019, 16, 011001. [Google Scholar] [CrossRef]
  7. Yang, J.; Singh, H.; Hines, E.L.; Schlaghecken, F.; Iliescu, D.D.; Leeson, M.S.; Stocks, N.G. Channel selection and classification of electroencephalogram signals: An artificial neural network and genetic algorithm-based approach. Artif. Intell. Med. 2012, 55, 117–126. [Google Scholar] [CrossRef]
  8. Pfurtscheller, G. Functional brain imaging based on ERD/ERS. Vis. Res. 2001, 41, 1257–1260. [Google Scholar] [CrossRef]
  9. Pfurtscheller, G.; Scherer, R.; Muller-Putz, G.R.; Lopes da Silva, F.H. Short-lived brain state after cued motor imagery in naive subjects. Eur. J. Neurosci. 2008, 28, 1419–1426. [Google Scholar] [CrossRef]
  10. Alonso-Valerdi, L.M.; Salido-Ruiz, R.A.; Ramirez-Mendoza, R.A. Motor imagery based brain-computer interfaces: An emerging technology to rehabilitate motor deficits. Neuropsychologia 2015, 79, 354–363. [Google Scholar] [CrossRef]
  11. Jeon, Y.; Nam, C.S.; Kim, Y.-J.; Whang, M.C. Event-related (De)synchronization (ERD/ERS) during motor imagery tasks: Implications for brain–computer interfaces. Int. J. Ind. Ergon. 2011, 41, 428–436. [Google Scholar] [CrossRef]
  12. Abdalsalam, E.; Yusoff, M.Z.; Malik, A.; Kamel, N.S.; Mahmoud, D. Modulation of sensorimotor rhythms for brain-computer interface using motor imagery with online feedback. Signal Image Video Process. 2018, 12, 557–564. [Google Scholar] [CrossRef]
  13. Padfield, N.; Zabalza, J.; Zhao, H.; Masero, V.; Ren, J. EEG-based brain-computer interfaces using motor-imagery: Techniques and challenges. Sensors 2019, 19, 1423. [Google Scholar] [CrossRef] [PubMed]
  14. LaFleur, K.; Cassady, K.; Doud, A.; Shades, K.; Rogin, E.; He, B. Quadcopter control in three-dimensional space using a noninvasive motor imagery-based brain–computer interface. J. Neural Eng. 2013, 10, 046003. [Google Scholar] [CrossRef]
  15. Hari, R.; Forss, N.; Avikainen, S.; Kirveskari, E.; Salenius, S.; Rizzolatti, G. Activation of human primary motor cortex during action observation: A neuromagnetic study. Proc. Natl. Acad. Sci. USA 1998, 95, 15061–15065. [Google Scholar] [CrossRef] [PubMed]
  16. Wolpaw, J.R.; McFarland, D.J. Control of a two-dimensional movement signal by a noninvasive brain-computer interface in humans. Proc. Natl. Acad. Sci. USA 2004, 101, 17849–17854. [Google Scholar] [CrossRef] [PubMed]
  17. McFarland, D.J. The advantages of the surface Laplacian in brain–computer interface research. Int. J. Psychophysiol. 2015, 97, 271–276. [Google Scholar] [CrossRef]
  18. Li, Y.; Long, J.; Yu, T.; Yu, Z.; Wang, C.; Zhang, H.; Guan, C. An EEG-based BCI system for 2-D cursor control by combining Mu/Beta rhythm and P300 potential. IEEE Trans. Biomed. Eng. 2010, 57, 2495–2505. [Google Scholar] [CrossRef]
  19. Pfurtscheller, G.; Flotzinger, D.; Kalcher, J. Brain-computer interface—A new communication device for handicapped persons. J. Microcomput. Appl. 1993, 16, 293–299. [Google Scholar] [CrossRef]
  20. Pregenzer, M.; Pfurtscheller, G. Frequency component selection for an EEG-based brain to computer interface. IEEE Trans. Rehabil. Eng. 1999, 7, 413–419. [Google Scholar] [CrossRef]
  21. Wang, H.; Zheng, W. Local temporal common spatial patterns for robust single-trial EEG classification. IEEE Trans. Neural Syst. Rehabil. Eng. 2008, 16, 131–139. [Google Scholar] [CrossRef] [PubMed]
  22. Martis, R.J.; Acharya, U.R.; Tan, J.H.; Petznick, A.; Tong, L.; Chua, C.K.; Ng, E.Y.K. Application of intrinsic time-scale decomposition (ITD) to EEG signals for automated seizure prediction. Int. J. Neural Syst. 2013, 23, 1350023. [Google Scholar] [CrossRef] [PubMed]
  23. Guo, Z.; Xie, L.; Ye, T.; Horch, A. Online detection of time-variant oscillations based on improved ITD. Control Eng. Pract. 2014, 32, 64–72. [Google Scholar] [CrossRef]
  24. Ince, N.F.; Tewfik, A.H.; Arica, S. Extraction subject-specific motor imagery time–frequency patterns for single trial EEG classification. Comput. Biol. Med. 2007, 37, 499–508. [Google Scholar] [CrossRef]
  25. Jiang, J.; Wang, C.; Wu, J.; Qin, W.; Xu, M.; Yin, E. Temporal combination pattern optimization based on feature selection method for motor imagery BCIs. Front. Hum. Neurosci. 2020, 14, 231. [Google Scholar] [CrossRef]
  26. Abdalsalam, E.; Yusoff, M.Z.; Malik, A.S.; Bahloul, M.R.; Adam, D.M.; Adam, I.K. Comparison of EEG signal decomposition methods in classification of motor-imagery BCI. Multimed. Tools Appl. 2018, 77, 21305–21327. [Google Scholar]
  27. Abdalsalam, E.; Yusoff, M.Z.; Mahmoud, D.; Malik, A.S.; Bahloul, M.R. Discrimination of four class simple limb motor imagery movements for brain–computer interface. Biomed. Signal Process. Control 2018, 44, 181–190. [Google Scholar] [CrossRef]
  28. Wolpaw, J.R.; McFarland, D.J.; Neat, G.W.; Forneris, C.A. An EEG-based brain-computer interface for cursor control. Electroencephalogr. Clin. Neurophysiol. 1991, 78, 252–259. [Google Scholar] [CrossRef]
  29. Wolpaw, J.R.; McFarland, D.J. Multichannel EEG-based brain-computer communication. Electroencephalogr. Clin. Neurophysiol. 1994, 90, 444–449. [Google Scholar] [CrossRef]
  30. Suzuki, K. Artificial Neural Networks: Methodological Advances and Biomedical Applications; InTech: London, UK, 2011. [Google Scholar]
  31. Phothisonothai, M.; Watanabe, K. Optimal fractal feature and neural network: EEG based BCI applications. In Brain-Computer Interface Systems-Recent Progress and Future Prospects; InTech: London, UK, 2013. [Google Scholar]
  32. Sonkin, K.M.; Stankevich, L.A.; Khomenko, J.G.; Nagornova, Z.V.; Shemyakina, N.V. Development of electroencephalographic pattern classifiers for real and imaginary thumb and index finger movements of one hand. Artif. Intell. Med. 2015, 63, 107–117. [Google Scholar] [CrossRef]
  33. Chen, C.-W.; Lin, C.-C.K.; Ju, M.-S. Detecting movement-related EEG change by wavelet decomposition-based neural networks trained with single thumb movement. Clin. Neurophysiol. 2007, 118, 802–814. [Google Scholar] [CrossRef] [PubMed]
  34. Ang, K.K.; Chin, Z.Y.; Zhang, H.; Guan, C. Mutual information-based selection of optimal spatial–temporal patterns for single-trial EEG-based BCIs. Pattern Recognit. 2012, 45, 2137–2144. [Google Scholar] [CrossRef]
  35. Frei, M.G.; Osorio, I. Intrinsic time-scale decomposition: Time–frequency–energy analysis and real-time filtering of non-stationary signals. Proc. R. Soc. Lond. A Math. Phys. Eng. Sci. 2007, 463, 321–342. [Google Scholar] [CrossRef]
Figure 1. Experiment design: (a) data collection protocol and (b) EEG recording device with (green) electrodes on the scalp.
Applsci 13 06364 g001
Figure 2. Optimum features derived from ROI.
Applsci 13 06364 g002
Figure 3. Validation timeline trial.
Applsci 13 06364 g003
Figure 4. Kappa coefficients of ITD with and without ROI.
Applsci 13 06364 g004
Figure 5. ROCs of ITD for Subject 1: (a) without ROI and (b) with ROI estimation.
Applsci 13 06364 g005
Figure 6. ROC’s of ITD for Subject 2: (a) without ROI and (b) with ROI estimation.
Applsci 13 06364 g006
Figure 7. Subject 3’s motor imagery topographic map for (a) the right hand, (b) the left hand, (c) both hands, and (d) both feet.
Applsci 13 06364 g007
Figure 8. The accuracy of ITD and DWT for 15 subjects.
Applsci 13 06364 g008
Figure 9. The sensitivity of ITD and DWT for 15 subjects.
Applsci 13 06364 g009
Figure 10. The specificity of ITD and DWT for 15 subjects.
Applsci 13 06364 g010
Figure 11. The kappa coefficient of ITD and DWT for 15 subjects.
Applsci 13 06364 g011
Figure 12. The ROCs of sensitivity vs. 1-specificity for ITD and DWT.
Applsci 13 06364 g012
Figure 13. The ROCs of sensitivity vs. 1-specifity for ITD and DWT with ROI.
Applsci 13 06364 g013
Table 1. Subjects’ performance using ITD with and without ROI.
Subject Left HandRight HandBoth HandsBoth Feet
Subject 1ITD
with ROI
Accuracy %86.25%91.46%98.12%91.45%
Sensitivity %84.58%91.66%98.33%90.00%
Specificity %87.91%91.45%97.91%92.91%
AUC %92.99%97.19%99.64%97.20%
ITD without ROIAccuracy %75.00%79.79%80.21%78.12%
Sensitivity %75.00%81.66%79.58%74.16%
Specificity %75.00%77.91%80.83%82.08%
AUC %81.91%87.03%88.08%83.87%
Subject 2ITD with ROIAccuracy %96.66%87.29%90.83%90.00%
Sensitivity %96.66%90.41%91.66%91.66%
Specificity %96.66%84.16%90.00%88.33%
AUC %99.16%94.01%96.80%96.02%
ITD without ROIAccuracy %78.75%73.33%72.50%71.66%
Sensitivity %79.58%73.33%71.25%71.66%
Specificity %77.91%73.33%73.75%71.66%
AUC %87.53%79.29%80.37%80.63%
Table 2. Confusion matrix of ITD with ROI.
True classPredicted Class
Right HandLeft HandBoth HandsBoth Feet
Right hand94.40%4.03%0.75%0.82%
Left hand6.43%91.70%1.54%0.33%
Both hands6.03%3.93%89.63%0.41%
Both feet3.01%1.07%0.84%95.08%
Table 3. Confusion matrix of ITD without ROI.
True classPredicted Class
Right HandLeft HandBoth HandsBoth Feet
Right hand82.94%7.53%5.71%3.82%
Left hand13.65%79.01%4.82%2.53%
Both hands11.53%9.83%76.03%2.61%
Both feet10.01%5.07%4.84%80.08%
Table 4. Comparison results of feature extraction methods.
Reference and YearMethodAccuracy (%)
Jiang et al. [26]CSP88.58
This studyDWT with ROI
BCI Competition IV dataset
89.77
ITD with ROI
BCI Competition IV dataset
96.87
ITD with ROI Own recorded dataset92.70
Disclaimer/Publisher’s Note: The statements, opinions and data contained in all publications are solely those of the individual author(s) and contributor(s) and not of MDPI and/or the editor(s). MDPI and/or the editor(s) disclaim responsibility for any injury to people or property resulting from any ideas, methods, instructions or products referred to in the content.

