Abstract
The post-grouting technology can effectively improve the bearing capacity and reliability of foundation piles, and it is of great academic and economic significance to evaluate the effect of post-grouting. However, in general, the evaluation of the effect of post-grouting slurry on foundation piles is still relatively single, and most researchers only test the improvement of the bearing characteristics of post-grouting piles, but there are few research results on the distribution state of slurry consolidation and the range of the reinforced soil. In this paper, elastic wave CT was used to detect the bridge piles of Taizhou Bay Du Xiaipu Bridge, and elastic wave CT technology was applied to the detection of the post-grouting effect of foundation piles experimentally. The spatial distribution characteristics of the underground grouting reinforcement area were revealed from the perspective of visualization, and the influencing factors of the elastic wave inversion results were analyzed. The conclusions obtained from elastic wave CT detection were similar to those of electromagnetic wave CT, and the laws are basically consistent with the current engineering experience, reflecting the applicability of using elastic wave CT to detect the effect of post-grouting of pile foundation.
1. Introduction
The post-grouting technology of bored piles is an indispensable technical link in many pile foundation projects, which can effectively improve the bearing capacity and reliability of foundation piles. With the increasing scale of infrastructure construction, post-grouting technology has been widely used in many fields such as municipal construction, highways, and bridges. It is of great academic and economic significance to detect and study the scope of post-grouting to further develop and improve the theory of post-grouting, so as to guide engineering practice [1,2,3].
At present, the detection of the effect of post-grouting is very difficult due to its invisibility. The detection means are still dominated by traditional testing methods, such as static sounding, drill hole sampling, ultrasonic CT, etc. In addition, Huang Shengen et al. [1] experimentally applied electromagnetic wave CT technology to detect the effect of post-grouting of pile foundation and made some achievements. However, its interference with the metal of the reinforcement cage inside the pile is obvious, which will have a non-negligible impact on the detection results. Liu Ying et al. [4] simulated the post-grouting process at the pile end of bored piles through indoor model tests, and after excavation observation, it was found that the form of slurry diffusion was significantly influenced by the pressure and pressure volume of the pressurized slurry, and the slurry diffusion mode was dominated by spherical infiltration when the pressure and pressure volume were not large, while splitting infiltration was dominated when the pressure and pressure volume were large. Dai Guoliang et al. [5] conducted a borehole coring test on a test pile after 5 months of post-grouting. Based on the core samples obtained from three boreholes around the pile, it was found that the cement slurry pile end returned to a height of about 15 m, the cement slurry was mostly distributed in thin layers and discontinuous, and the cement slurry at the bottom of the pile was still partially unconsolidated. Huang Shengen et al. [6] used ultrasonic CT and electromagnetic CT techniques to test and evaluate the post-pressure effect of the main pier group piles of the Sutong Bridge, and combined with the results of the later drilling and coring, it was considered feasible to use these two methods together to test the post-grouting effect of deep and long piles. Liu Jianda et al. [7] used ultrasonic CT to detect the effect of pile bottom compression slurry in the Yangtze River Bridge and solved several key technical problems in the test pile testing, and the testing results showed images of the distribution range of pressed-in cement slurry.
Meanwhile, Hu Gang, Hu Xing, Wang Jianjun, Mao Xing, Lu Song, and Song Qingbo used cross-well elastic wave CT technology in the field of engineering tests successively [8,9,10,11,12,13,14,15,16]. Its application covers the detection of unfavorable geological conditions, the detection of existing engineering hidden danger, the detection of unfavorable geological and treatment effects of engineering hidden danger, the quality appraisal of concrete structure, etc., which have made a lot of achievements.
In this paper, drawing on the fruitful results and experience gained from elastic wave CT technology in the fields of geological structure and oil and gas exploration, elastic wave CT technology was experimentally applied to the detection of the effect of post-grouting of foundation piles. On the one hand, it enriched the existing means of post-grouting slurry detection of foundation piles, and revealed the spatial distribution characteristics of the subsurface pressure slurry reinforcement zone from a visualization perspective by using image reconstruction technology; on the other hand, based on the distribution state of post-grouting slurry consolidation and soil reinforcement range obtained from the detection, it can guide the design of post-grouting slurry parameters and further develop and improve the theory of post-grouting slurry action mechanisms and so on.
2. Basic Principle of Cross-Well Elastic Wave CT
2.1. System Composition and Operation Process
The cross-well elastic wave CT system is mainly composed of three parts: host, source, and geophone, as shown in Figure 1. When working, the transmitting probe and receiving probe (a bunch of geophones) are placed in two detection channels (PVC pipes) and lowered to the bottom of the hole. Keeping the geophone immobile, the transmitting probe is spaced 1 m apart to excite the elastic wave (P-wave) from bottom to top. Due to the difference in density, modulus, and other aspects of the pile, slurry consolidation, and the soil around the pile after grouting, the propagation velocity of the P-wave in different media is different; thus, the geophone receives different elastic wave-transmission travel times. According to different elastic-wave travel times, the velocity field distribution map of the media between wells can be reconstructed, and then the media distribution in the stratum can be inferred according to the velocity field.
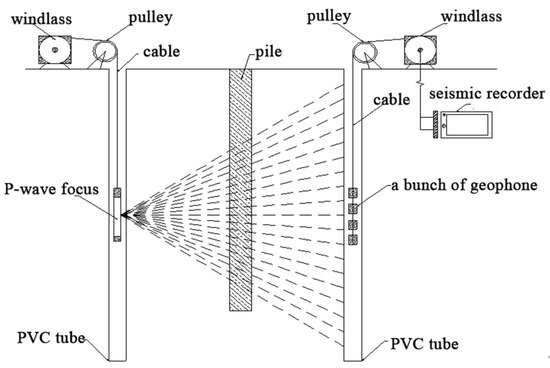
Figure 1.
Schematic diagram of elastic wave CT system.
2.2. Fundamental of Reconstructing Velocity Field
The probe profile was meshed when reconstructing the velocity field as shown in Figure 2. The initial slowness (the reciprocal of the velocity) was assigned to each mesh to form the slowness matrix S. The propagation path length of the elastic wave in each mesh forms the path matrix A. The theoretical travel time matrix B can be derived from the slowness and path matrix as shown in Equation (1).
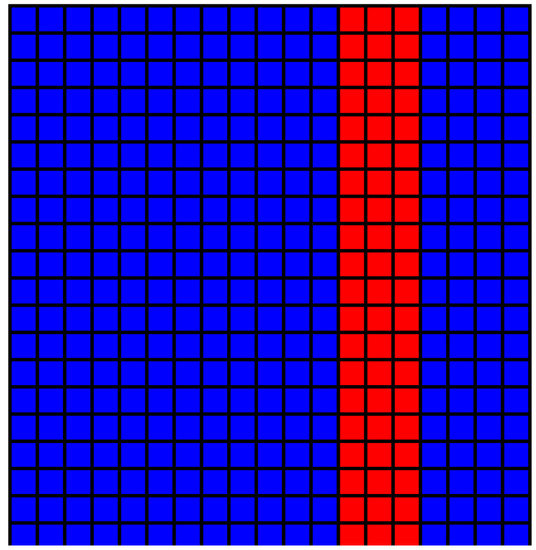
Figure 2.
Sectional meshing.
Since the theoretical travel time B is different from the measured travel time B’, the difference between the two ∆B1 is brought into Equation (2) to obtain the corrected slowness matrix S1, and the theoretical travel time B1 is calculated again; then, the difference between the theoretical and measured travel times is repeatedly iterated until the difference between the two reaches the error limit or reaches the number of iterations [7]. At this point, the corresponding slowness matrix S′ is the result of the inversion.
3. Application
3.1. Project Profile
The test piles were selected for post-grouting effect elastic wave CT testing of No. 7-2 and No. 7-3 piles of the left abutment of the Taizhou Bay Du Xiapu Bridge in Taizhou City, Zhejiang Province. The length of the No. 7 abutment pile design pile was 56 m. The pile diameter was 1.5 m. The pile top design elevation was 2.9 m, and the pile bottom design elevation was −53.1 m, as shown in Figure 3. The parameters of the test piles are shown in Table 1.
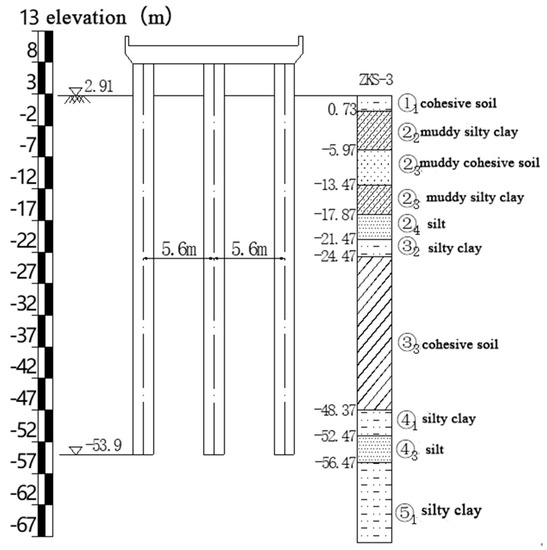
Figure 3.
The left section of the stratum of No. 7 pier.

Table 1.
Parameters of the experimental pile.
According to the post-grouting design, the piles of the No.7 pier were all base grouting. The cement pressed volume of each pile was 4.2 t, the water-cement ratio was 0.4, and the last press-grouting force of ground grouting pump was 3.66 Mpa. The detection holes inside the pile were embedded Φ60 PVC pipes with the reinforcement cage, with a length of 57 m. The detection holes outside the pile were Φ60 PVC pipes with a length of 60 m. One detection hole was arranged inside each pile, and three detection holes were arranged outside the pile, at the positions of about 3 m, 4.5 m, and 6 m around the pile, as transmitting holes and receiving holes, for the CT detection of seven profiles on site. The layout of each detection hole is shown in Figure 4. Each detection hole was combined accordingly to form a detection profile, and the profile number and actual detection hole spacing are shown in Table 2.
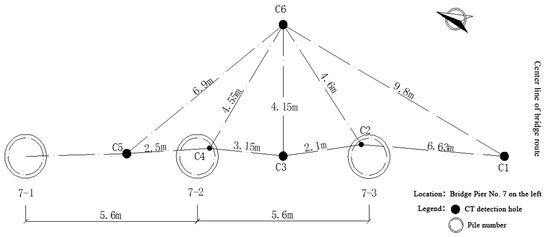
Figure 4.
The layout of pile position and CT inspection hole.
Table 2.
Transmitting–receiving hole number and section number.
The experimental design of the elastic wave excitation frequency was 3000 Hz, and the maximum frequency received during the detection process was around 5000 Hz.
3.2. Analysis of Test Results
According to the pre-inversion results of several pile-side profiles, when the number of iterations reached 10, the inversion results basically reached stability. Hence, when the inversion of detection results was carried out, the number of iterations was unified to 10. In addition, the receiving-angle was set at 45°, the sampling density was 1 m, and the detection profile model grid was meshed into a 0.5 m × 0.5 m square grid.
Figure 5 shows the inversion results of the three pile side profiles, C3-C6, C6-C1, and C6-C5, before grouting. The X-coordinates in the figure are the spacing between the transmitting and receiving holes, and the Y-coordinates are the depths from the ground downwards, all in m (the same below). Comparing the three profiles, combined with the geotechnical investigation data near the pier, the following common stratigraphic interfaces can be seen: (1) the interface between mud and muddy silty clay around 14 m depth; (2) the interface between muddy silty clay and silt near 20 m depth; (3) the interface between silt and cohesive soil around 27 m depth; (4) the interface between cohesive soil and silty clay near 33 m depth; (5) the interface between silty clay and silt near 51 m. The propagation velocity of elastic wave in the layer above 14 m was below 900 m/s, which is due to the fact that the layer above 14 m was mostly mud or muddy soil. In addition, the layer was basically in a flow-plastic state and was relatively soft; the propagation velocity of elastic wave in the layer from 20 to 27 m was about 1000 m/s, and the layer was relatively soft silt. The propagation velocity of elastic wave in the layer from 27 to 33 m was about 1100 m/s, and the layer was soft-plastic-cohesive soil. The propagation velocity of elastic wave in the layer from 33 to 51 m was about 1200 m/s, and the layer was plastic silty clay. The propagation velocity of elastic wave in the layer below 51 m was more than 1300 m/s, and the layer was medium dense silt and plastic silty clay. Overall, the velocity cloud map reflects the distribution of elastic wave propagation velocity of elastic wave in each layer in the depth direction and the inversion nephogram, which had a high degree of coincidence with the geotechnical investigation data.
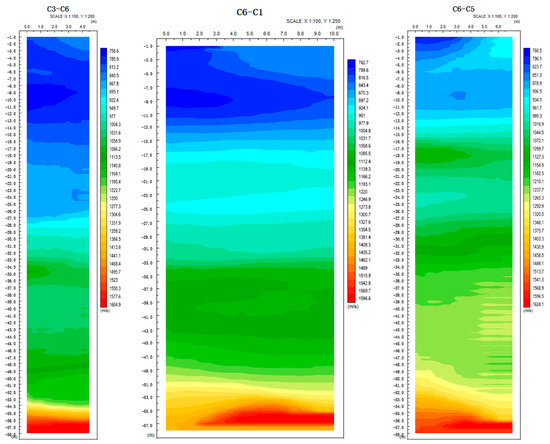
Figure 5.
Side profile of pile (before grouting).
Figure 6 shows the inversion clouds of the pile profile before grouting. In the C1-C3 profile, the stratified layer was basically invisible, but the interface of mud and muddy silty clay at the depth 14 m and the interface of cohesive soil and silty clay near 33 m could still be discerned. According to the velocity spectrum, the propagation velocity of the layer gradually decreased from 1500 m/s to about 1150 m/s as the distance from the pile became closer and closer in the range above 14 m in depth; in the range of depth 14–33 m, the propagation velocity of layer gradually decreased from 1600 m/s to about 1250 m/s, while in the depth of 33–50 m, the propagation velocity of the elastic wave in the layer gradually decreased from 1850 m/s to about 1450 m/s. It can be seen that in the area far from the pile, the propagation velocity of elastic wave in the layer at the same depth was basically the same as the pile side profile in Figure 5, but the closer to the pile, the smaller the propagation velocity of elastic wave in the layer was.
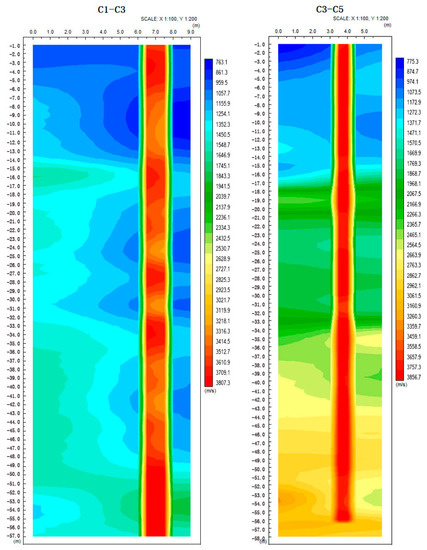
Figure 6.
Cross-pile section (before grouting).
In the C3-C5 profile, the stratified layer was basically visible, and the soil stratigraphic interfaces near the depths of 14 m and 33 m were clearly discernible. The propagation velocity of elastic wave in the layer gradually decreased from 1400 m/s to 1200 m/s in the range of depth above 14 m, from 1900 m/s to 1650 m/s in the range of depth 14–33 m, and from 2950 m/s to 2800 m/s in the range of depth below 33 m as the distance from the pile became closer. Similar to the C1-C3 profile, the propagation velocity of elastic wave in the layer tended to decrease gradually as the distance from the pile became closer to the depth direction.
According to the engineering experience, the above law is related to the construction characteristics of bored piles. During the construction of bored piles, the soil in stress equilibrium is removed and the soil around the borehole is displaced into the hole due to unloading, resulting in the soil around the borehole becoming relaxed. The closer to the borehole, the more unconsolidated the soil is. The propagation velocity of elastic waves and the compactness of the layer are closely related. The more compact and harder the layer is, the greater the propagation velocity of elastic wave is. Therefore, the closer the soil is to the pile, the smaller the elastic wave propagation velocity is.
One month after the pile grouting, the profiles were detected again.
The inversion results of the three pile-side profiles C3-C6, C6-C1, and C6-C5 after grouting are shown in Figure 7. The variation of velocity before and after slurry injection in the pile side profile is shown in Table 3. By comparing the three clouds, five common stratigraphic interfaces can still be distinguished. The propagation velocity of elastic wave above 33 m in depth was basically unchanged compared with that before grouting; however, the propagation velocity of elastic wave in the range of 33–51 m increased from 1200 m/s before grouting to about 1300 m/s; the propagation velocity of elastic wave below 51 m increased by about 50 m/s. This indicates that post-grouting has an effect on the strength of the soil in a certain depth range around the pile. Combined with relevant research results, considering the slurry up-flow phenomenon in the grouting process, it was presumed that this was the result of the action of the cement paste upward return on the soil around the pile during the grouting. In the range of below 33 m, the silty clay was mainly interspersed with a medium dense silt. The silty clay and silt were extruded or osmosed and reinforced under the high pressure of the grouting, and the strength and compactness of the soil increased; thus, the propagation velocity of the elastic wave increased.
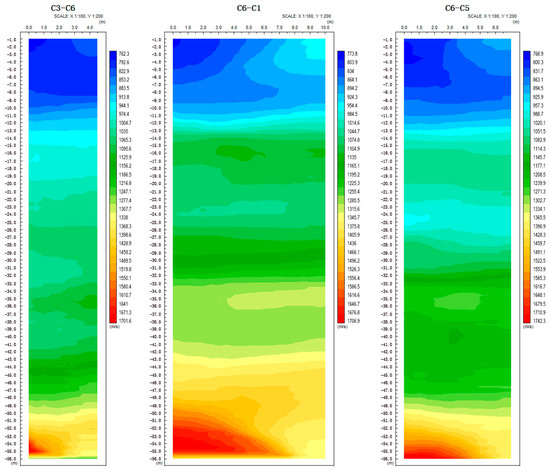
Figure 7.
Side profile of pile (after grouting).
Table 3.
Variation of pile lateral profile velocity before and after grouting.
Based on the inversion results of the pile profiles after grouting, in order to more intuitively compare the changes of cross pile profile before and after grouting, each profile was compared before and after grouting, as shown in Figure 8 and Figure 9.
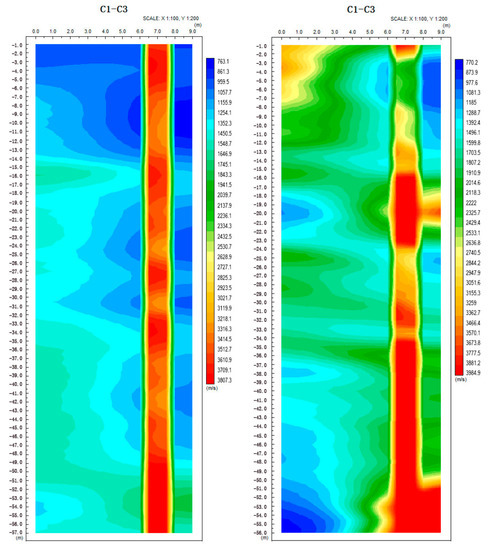
Figure 8.
C1-C3 profile before and after grouting.
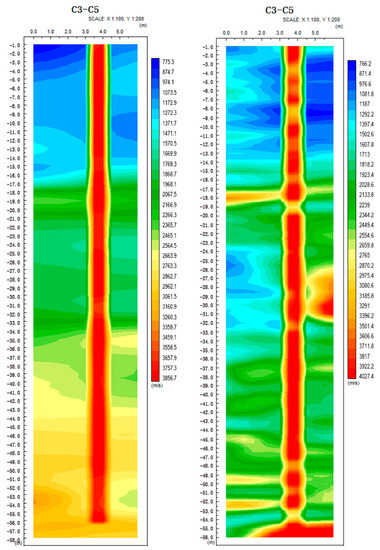
Figure 9.
C3-C5 profile before and after grouting.
Figure 8 shows the before and after grouting of pile profile C1-C3 (before grouting is in the left panel and after grouting is in the right panel). From the figure, it can be seen that the velocity field distribution of the profile changed obviously after grouting, and the characteristic of the stratigraphic interfaces at 14 m and 33 m depths could still be discerned. Ignoring the two inversion artifacts in the upper and lower left corners of the right figure, the propagation velocity of elastic wave in the layer in the range above 14 m depth, from far to near to the pile, still showed a decreasing trend, from 1800 m/s to about 1500 m/s gradually. The propagation velocity of elastic waves in the layer within the depth range of 14–43 m was always stable at about 1650 m/s and did not vary significantly with the distance from the pile. Above 43 m depth, with the distance from the pile decreasing, the propagation velocity of the elastic wave in the layer increased from 1650 m/s away from the pile to about 2250 m/s, and the velocity change rule was opposite to that of before grouting. The closer to the pile, the faster the propagation velocity of elastic wave increased.
From Figure 9, it can be seen that the velocity field of the C3-C5 profile also changed significantly after grouting (right panel). Above the depth of 14 m at the partition interface, from far to near to the pile, the change trend of the propagation velocity of elastic wave in the layer still decreased, from about 1000 m/s to 900 m/s; at the depth of 14–33 m, from far to near to the pile, the soil wave velocity decreased from about 1700 m/s to 1550 m/s; in the range of depth 33–43 m, the change of the propagation velocity of elastic wave in the layer was not obvious and was basically stable at 2800 m/s; while below the 43 m depth from far to near to the pile, the propagation velocity of elastic wave in the layer showed an increasing trend from 2400 m/s to 2700 m/s.
The variation of velocity before and after grouting across the pile profile is shown in Table 4. The above test results show that the derived law was basically the same. This indicates that the base grouting, the cement paste under pressure, has a reinforcing effect on the soil around the pile, which makes the layer disturbed during the borehole be reinforced. Moreover, the closer to the pile the more obvious the reinforcing effect is. According to the velocity variation range in the cloud, the maximum reinforcement radius of this post-base grouting can reach 2 m, and the height of cement paste return along the pile was about 12 m.
Table 4.
Variation of cross-pile profile velocity before and after grouting.
4. Analysis of Influencing Factors
Experience shows that field operation and post data processing methods have a large impact on the inversion results of elastic wave CT detection. In order to obtain reliable inversion results, this paper compared and analyzed the influence of three key factors on the inversion results, namely receiving angle, sampling density, and model mesh division. In order to make the comparison results appear intuitive, the method of control variables was used in the analysis and the C6-C5 profiles before grouting was uniformly used for comparison.
4.1. Effect of Receiving Angle
Keeping all other conditions the same, Figure 10 shows the inversion results of profiles C6-C5 before grouting for the unrestricted receiving angle of, from left to right, 60°, 45°, and 30°, respectively. As can be seen from the figure, when the receiving angle was unrestricted, although the data information was most comprehensive at this time, the larger receiving angle indicated the longer path of elastic wave propagation and more error information; when the receiving angle was 60°, the two typical stratigraphic interfaces of 15 m and 33 m could be roughly judged. Additionally, the cloud map did not express the other stratigraphic interfaces well, and most of the area did not show the stratigraphic characteristics. This indicates that the receiving angle was still too large, which contains more error information. The inversion result was better when the receiving angle was 45°, which can better delineate most stratigraphic interfaces compared to the previous geotechnical investigation data. When the receiving angle was 30°, although it can reflect the main stratigraphic information, the delineation of strata was too simple and the information contained was relatively rough. Therefore, it is more reasonable to set the receiving angle to 45°, which can utilize enough elastic wave information and effectively reduce the errors in the information.
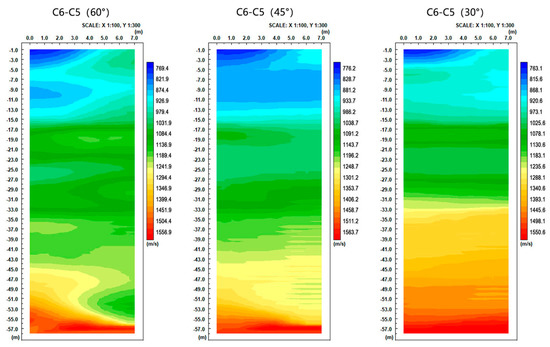
Figure 10.
Comparison of results with different receiving angles.
4.2. Effect of Sampling Density
Keeping all other conditions the same, Figure 11 shows the inversion results of the elastic wave information when the sampling density from left to right was 3 m, 2 m, and 1 m, respectively. As can be seen from the figure, when the sampling density was 3 m, the elastic wave information collected was too sparse, resulting in rough inversion results. The stratigraphic delineation in the middle section was not clear enough in the range of 15–33 m, and even a large anomaly zone appeared in the depth range of 45–50 m. When the sampling density was 2 m, comparing the inversion results of the sampling density of 1 m, it was found that the contents of the two maps were basically the same. There was only a slight difference in the stratigraphic delineation in the depth range of 33–43 m. Therefore, it is suggested that the sampling density should be flexibly adjusted according to the size and accuracy requirements of the detection area and generally set to 1–2 m. When the detection area is small, the data collection points can be appropriately encrypted.
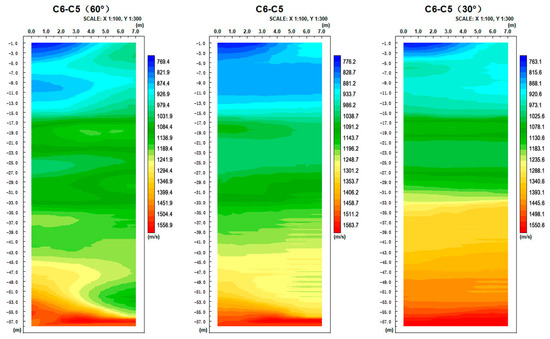
Figure 11.
Comparison of results of different sampling densities.
4.3. Influence of Meshing
Keeping all other conditions the same, Figure 12 shows the inversion results of the elastic wave information when the inversion area grid size from left to right was 1.5 m × 1.5 m, 1 m × 1 m, and 0.5 m × 0.5 m, respectively. When the grid size was 1.5 m × 1.5 m, the resolution of the cloud map for the strata was low, and most of the strata were not reflected; when the grid size was 1 m × 1 m, the accuracy of the inversion improved significantly, and most of the strata were reflected basically. However, compared to the inversion results of the 0.5 m × 0.5 m grid size, the distribution of strata still seemed to be rough and fuzzy, flat and regular, and not as detailed as the latter. Therefore, the quality of the inversion becomes higher as the grid size is smaller and smaller, but the inversion time also increases gradually.
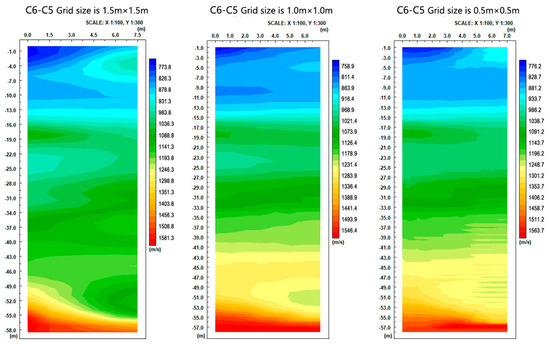
Figure 12.
Comparison of different meshing results.
5. Conclusions
In this study, experimental tests were conducted on the experimental bridge piles by means of seismic wave CT, and the following conclusions were obtained:
(1) The elastic wave CT detection within the profile is more sensitive to the horizontal anomalies of interval velocity interface within the target at different detection spacing, which can accurately reflect the interface between the characteristic strata.
(2) According to the elastic wave CT detection results, the action radius of the post-base grouting of this test is about 2 m, and the cement paste upward return height is about 12 m. This is similar to the conclusion obtained from EM wave CT detection, and the pattern is basically consistent with the current engineering experience, which indicates the applicability of using the elastic wave CT method to detect the effect of post-grouting of the pile. This shows that there is a good application of using the elastic wave CT method to detect the post-grouting effect of pile, and more reliable detection results are obtained with drilling and CPT to achieve the purpose of guiding engineering.
This study shows that the results of elastic wave inversion are influenced by the receiving angle, sampling density, and regional meshing. In order to provide a reference for future studies, the effects of different receiving angles, different sampling densities, and different regional meshing were investigated. In order to improve the quality of the inversion, the receiving angle should be selected not only to consider the use of enough elastic wave information, but also to minimize the error in the information, and generally 45° is better; sampling density in theory is the denser the better, but blindly encrypted sampling points reduce the efficiency of work. Hence, the general sampling density depends on the size of the measurement area and accuracy requirements, more with 1–2 m; the finer the regional meshing is, the higher the quality of the inversion is. At the same time, the time used for inversion also gradually increases, usually 0.5 m × 0.5 m.
Author Contributions
Conceptualization, S.H.; methodology, H.C.; software, J.L. and H.Z.; validation, R.Y.; writing—original draft preparation, S.H. and H.C.; writing—review and editing, S.H., R.Y. and H.Z. All authors have read and agreed to the published version of the manuscript.
Funding
This research received no external funding.
Institutional Review Board Statement
Not applicable.
Informed Consent Statement
Not applicable.
Data Availability Statement
Not applicable.
Conflicts of Interest
The authors declare no conflict of interest.
References
- Huang, S.; Peng, C. The Principle and Engineering Practice of Post-Grouting Technology for Cast-in-Place Piles; China University of Geosciences Press: Wuhan, China, 2016. [Google Scholar]
- Kocur, G.-K.; Saenger, E.H.; Voge, T. Elastic wave propagation in a segmented X-ray computed tomography model of a concrete specimen. Constr. Build. Mater. 2010, 24, 2393–2400. [Google Scholar] [CrossRef]
- Shiotani, T.; Momoki, S.; Chai, H.; Aggelis, D.G. Elastic wave validation of large concrete structures repaired by means of cement grounding. Constr. Build. Mater. 2009, 23, 2647–2652. [Google Scholar] [CrossRef]
- Liu, Y.; Yao, Y. Indoor model test of post-grouting effect of cast-in-place pile end. J. Southwest Univ. Sci. Technol. 2011, 26, 22–26. [Google Scholar]
- Dai, G.; Gong, W.; Xue, G.; Tong, X. Inspection of post-grouting effect of super-long bored pile end. Rock Soil Mech. 2006, 5, 849–852. [Google Scholar]
- Shenggen, H.; Weiming, G. Application of CT technology in the detection of super-long pile post-grouting effect of Over-Length Piles. In Proceedings of the First China Water Resources and Hydropower Geomechanics and Engineering Symposium, Kunming, China, 10–13 November 2006. [Google Scholar]
- Jianda, L.; Xiaoping, F.; Hangang, X. A preliminary study on the electrical method for detecting the length of the reinforcement cage in a cast-in-place pile. Chin. J. Geotech. Eng. 2008, 2, 288–291. [Google Scholar]
- Shiotani, T.; Kobayashi, Y.; Chang, K.C. Hybrid elastic-wave CT with impact acoustics for single-side measurement in concrete structures. Constr. Build. Mater. 2016, 112, 907–914. [Google Scholar] [CrossRef]
- Chai, H.K.; Momoki, S.; Kobayashi, Y.; Aggelis, D.G.; Shiotani, T. Tomographic reconstruction for concrete using attenuation of ultrasound. NDT E Int. 2011, 44, 206–215. [Google Scholar] [CrossRef]
- Wang, W.; Luo, Q.; Song, R.; Fu, X. Detecting the internal quality of bored piles with acoustic CT. Constr. Technol. 2000, 10, 26–28. [Google Scholar]
- Hu, G.; Duan, B.; He, Z.; Ye, T. Using cross-well elastic tomography to detect hidden faults. CT Theory Appl. Res. 2015, 3, 345–355. [Google Scholar]
- Hu, X.; Bao, T.; Xie, T. The application of elastic CT technology in the diagnosis of diseases in the Qincaiyakou tunnel. J. Guizhou Univ. 2010, 3, 118–121. [Google Scholar]
- Wang, J.; Cao, J. Using cross-well elastic CT to detect the fracture at the foundation of a certain bridge pier. Resour. Environ. Eng. 2008, S2, 89–91. [Google Scholar]
- Mao, X. The application of elastic wave CT in the detection and evaluation of grouting effect. Geophys. Geochem. Explor. 2012, S1, 154–157. [Google Scholar]
- Lu, S.; Chen, Y.; Li, S. The application of elastic wave CT in the detection of grouting effect of railway subgrade diseases. Roadbed Eng. 2015, 1, 163–166. [Google Scholar]
- Song, Q. Experimental Study on Abnormal Elastic Wave Tomography of Underground Concrete Structure Contact; Anhui University of Science and Technology: Huainan, China, 2014. [Google Scholar]


Disclaimer/Publisher’s Note: The statements, opinions and data contained in all publications are solely those of the individual author(s) and contributor(s) and not of MDPI and/or the editor(s). MDPI and/or the editor(s) disclaim responsibility for any injury to people or property resulting from any ideas, methods, instructions or products referred to in the content. |
© 2022 by the authors. Licensee MDPI, Basel, Switzerland. This article is an open access article distributed under the terms and conditions of the Creative Commons Attribution (CC BY) license (https://creativecommons.org/licenses/by/4.0/).