Article

Preparation of Nanoparticle-Loaded Microbubbles via an Electrohydrodynamic Atomization Process

1
School of Chemistry and Chemical Engineering, Jiangsu University, Zhenjiang 212013, China
2
Institute of Fluid Physics, China Academy of Engineering Physics, Mianyang 621900, China
*
Authors to whom correspondence should be addressed.
Appl. Sci. 2022, 12(7), 3621; https://doi.org/10.3390/app12073621
Submission received: 11 March 2022 / Revised: 28 March 2022 / Accepted: 31 March 2022 / Published: 2 April 2022
(This article belongs to the Collection Synthesis and Application of Microcapsules)

Abstract

:
Microbubbles have been widely used in many research fields due to their outstanding physicochemical properties and unique structural characteristics, especially as ultrasonic contrast agents and drug delivery carriers. However, the stability of conventional microbubbles is generally poor, which limits the development of their applications. Loading nanoparticle to microbubbles has great potential in enhancing the stability of microbubbles. This paper reports for the first time the feasibility of one-step preparation of nanoparticle-loaded microbubbles by coaxial electrohydrodynamic atomization. Bovine serum albumin (BSA) was used as the model material of the bubble shell layer to study the effect of the loading of nanoparticles on the stability of microbubbles. The results show that the concentration of nanoparticles has a significant impact on the stability of microbubbles, and loading an appropriate amount of nanoparticles is helpful in improving the stability of microbubbles. The results also show that nanoparticle-loaded microbubbles with a size distribution in the range of 120–200 μm can be prepared under optimal conditions.

1. Introduction

Micron-sized bubbles, also known as microbubbles, are widely used in micro reactor engineering [1], sewage treatment [2], food processing [3] and many other fields due to their superior ultrasonic response performance and efficient gas-liquid interface mass transfer. Since the discovery of microbubbles with good acoustic properties and encapsulation ability, microbubbles have shown ideal application prospects in the research fields of ultrasound contrast agents, drugs and gene delivery carriers [4,5,6,7,8,9,10]. Microbubbles are further developed towards the integration of diagnosis and treatment from drug loading to drug delivery system with targeted functions [7,11,12,13]. Due to the excellent performance of nanoparticles in the biomedical field [14,15,16], microbubbles loaded with nanoparticles have become the focus of attention in the microbubble research field [17,18,19,20,21].
Conventional preparation methods of microbubbles include mechanical vibration/stirring, ultrasonication, a freeze-drying method, and an adsorption method, among others [22]. However, the defects of these methods in precise control of the bubble size and the complexity of the operating procedure limit their applications and further development [23]. In recent years, newly developed technologies for the preparation of microbubble, such as a microfluidic method [21,24,25,26] and an electrohydrodynamic atomization method [27], have attracted increasing attention. The microfluidic method has great potentials in precise control of bubble size, while the production rate and channel blockage issues still need to be addressed, especially for highly viscous fluids and solid particle contained flows. The electrohydrodynamic atomization method as an extension of electrospraying [28] uses an electric field to intensify the microbubble formation process. The microbubble size range can be controlled by adjusting the applied voltage and flow rate. This can overcome the drawbacks of the microfluidic method, which usually adjusts the bubble size by changing the microchannel size, which is costly and associated with the channel blockage issue when small microbubbles are desired and a complex shell layer of the microbubble is required [29,30]. Farook et al. [27,31] first studied the preparation of microbubbles using electrohydrodynamic atomization technology. Parhizkar et al. [32] took this as an example to prepare microbubbles with better monodispersity by varying coaxial nozzle configurations. However, only conventional microbubbles, simply consisting of a shell layer and a gas core, were produced. It is still unclear whether microbubbles with functional substances can be formed by the electrohydrodynamic atomization method.
On the other hand, due to the poor mechanical properties of the shell layer and the fast diffusion rate of the gas core of conventional microbubbles, microbubble stability is usually low, which limits the practical applications of microbubbles [29,33,34]. It has been reported that loading nanoparticles into the microbubbles will not only increase the mechanical strength of the shell layer but also prevent gas diffusion from the core region of microbubble [18,19]. Therefore, it is of great significance to produce nanoparticle-loaded microbubbles. Unfortunately, no study on the preparation of nanoparticle-loaded microbubble via electrohydrodynamic atomization method has been reported to date.
In this study, the electrohydrodynamic atomization technology was first used to prepare nanoparticle-loaded microbubbles. Bovine serum albumin (BSA) and air was selected as the template material for the shell layer and the gas core of the microbubbles. Silica (SiO2) nanoparticles were used as the template nanoparticles. The effects of nanoparticle loading on microbubble stability were studied in terms of bubble size and number variation. Key parameters affecting the preparation of nanoparticle-loaded microbubbles such as the concentration of nanoparticles, gas to liquid flow rate ratio and applied voltage were also explored.

2. Materials and Methods

2.1. Materials

Glycerol (g116203, AR, 99%) and bovine serum albumin (BSA, na8692) were purchased from Aladdin reagent (Shanghai, China) Co., Ltd. (No. 196, Xinjinqiao Road, Pudong, Shanghai). Phosphate buffer granules (PBS, instant granules, pH7.4 ± 0.2) were purchased from Sinopharm Chemical Reagent Co., Ltd. (No. 123, Fuzhou Road, Shanghai, China) Silica nanoparticles (SiO2, 20 ± 5 nm) were purchased from Shanghai McLean Biochemical Technology Co., Ltd. (5th Floor, Building 10, Peninsula Science and Technology Park, No. 88 Darwin Road, Shanghai, China).

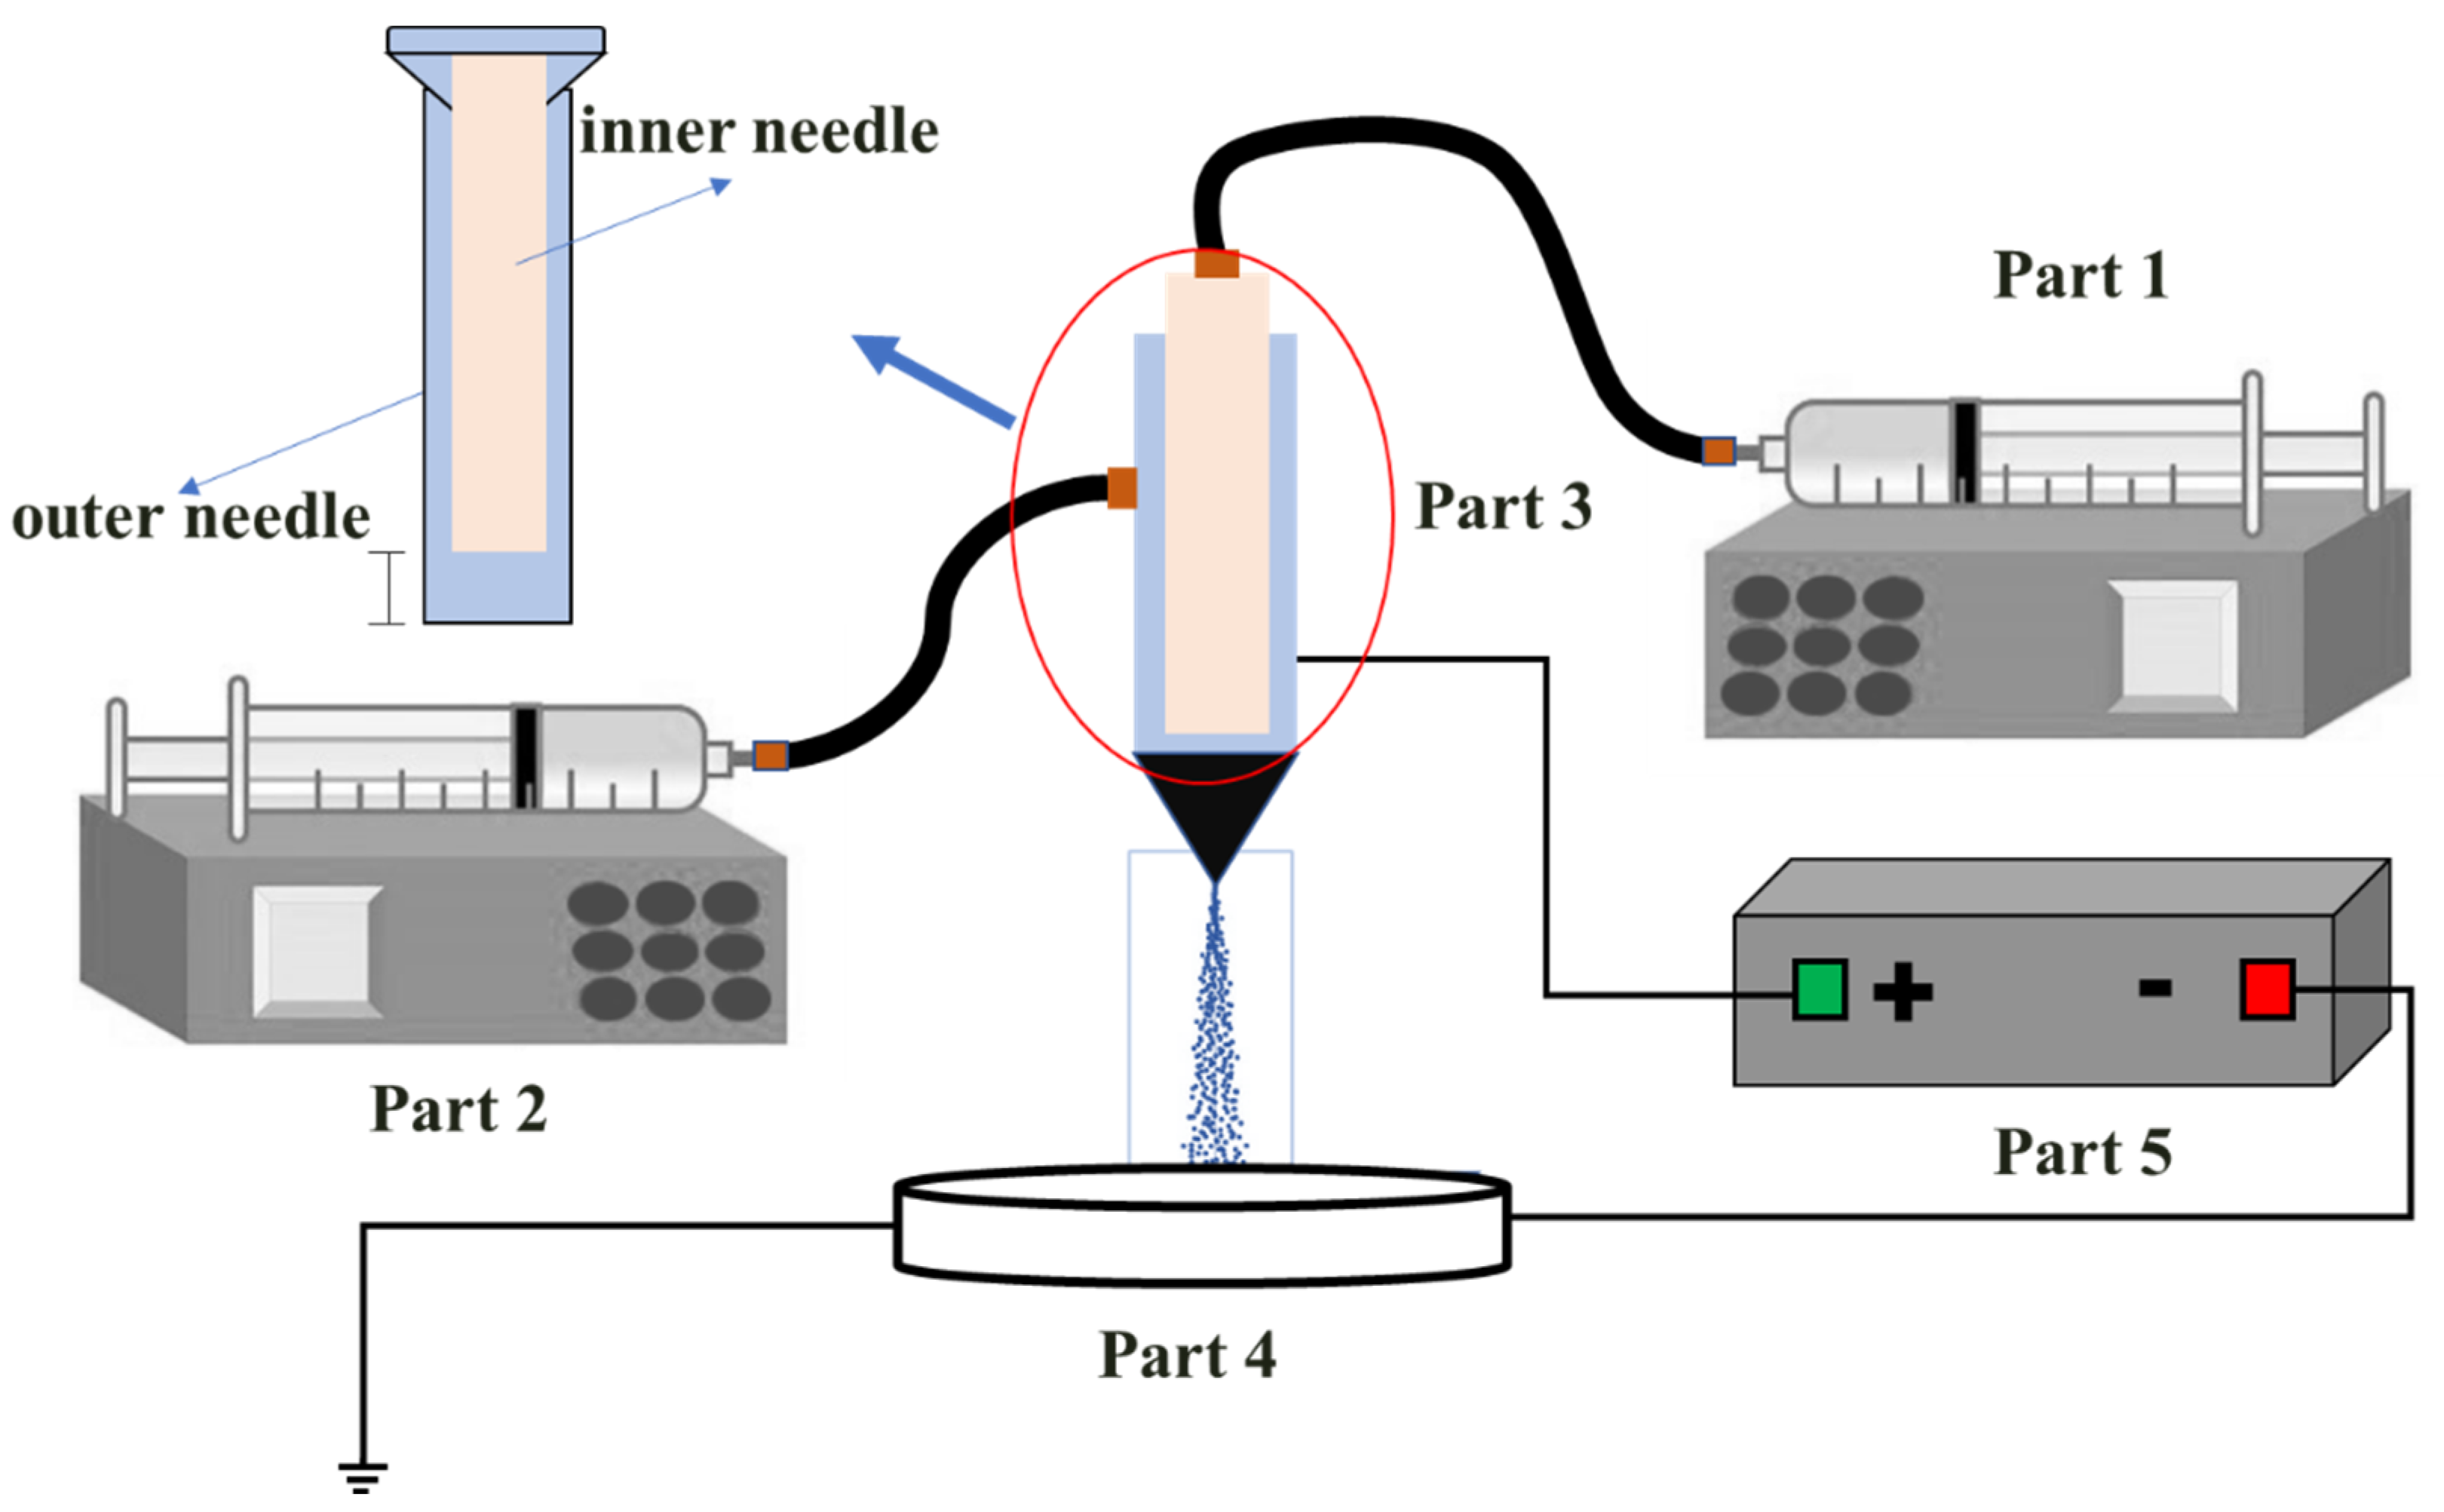
2.2. Experimental Setup

A schematic diagram of the experimental setup for preparing nanoparticle-loaded microbubbles is shown in Figure 1. The setup is mainly composed of five parts. Part 1 and part 2 are syringe pumps, which are used to transport gas core and shell layer material respectively. Part 3 is the key component of the whole device, namely, the coaxial needle. This is composed of an inner needle and an outer needle. Detailed information for the coaxial needle configuration can be seen in the enlarged schematic diagram on the left. Generally, the bottom end of the outer needle is slightly longer, which is conducive to the formation of a shell layer-wrapped gas core structure. Part 4 is the collection tray with the corresponding collection medium. In this experiment, PBS solution was used as the collection medium and a slide of aluminum foil paper was immersed in the collection medium and connected to a ground electrode (as an unnecessary setting, it is indicated in Figure 1). Part 5 is a high-voltage power generator, which was used to provide high-voltage on the coaxial needle and to form a corresponding electric field between the coaxial needle and the collection tray.

2.3. Preparation of Shell Layer Solutions and Collecting Medium

Preparation of shell layer solution without nanoparticles. A volume of 10 mL glycerol was mixed with distilled water in a 50 mL beaker and then transferred into a 100 mL to form a 10% vol glycerol solution. Then, a 5 mg/mL BSA-glycerol solution was prepared by adding 0.5 g BSA to 100 mL beaker and topping up to 100 mL with 10% vol glycerol solution.
Preparation of the shell layer solution with nanoparticles. A volume of 20 mL of BSA-glycerol suspensions was add into each of three 50 mL beakers. SiO2 nanoparticles (0.01, 0.02 and 0.04 g) were weighed added, respectively. After magnetic stirring for 30 min and ultrasonication for 5 min, the desired nanoparticle-BSA-glycerol suspension with different nanoparticle concentrations was obtained.
Preparation of collecting medium. PBS solution with a volume fraction of 10% was prepared for the collection of microbubbles. A quantity of 1 g of PBS particles was weighed into a 50 mL beaker using an analytical balance. Distilled water was added and stirred with a magnetic stirrer until the particles were completely dissolved.

2.4. Preparation of Microbubbles

As shown in Figure 1, the shell layer solution was introduced into the outer needle by syringe pump 2 and the core gas was introduced into the inner needle by syringe pump 1. The connection section was sealed with parafilm to avoid leakage of liquid or A volume of 1 mL of PBS solution was placed in the collection tray. Syringe pumps were activated and high voltage generator adjusted to yield microbubbles.

2.5. Characterization

The morphology and size of microbubbles at different time points were observed by optical microscopy using a real-time photography function. Various photos were taken with the microscope, and Nano Measurer software was used to analyze the size of microbubbles from the photos. Origin 9.0 software was used for data processing. The average size of microbubbles in this paper was determined by:
X = (∑Xi)/n
where X is the average diameter of the microbubbles, xi is the diameter of a single bubble and n is the bubble number.

3. Results and Discussion

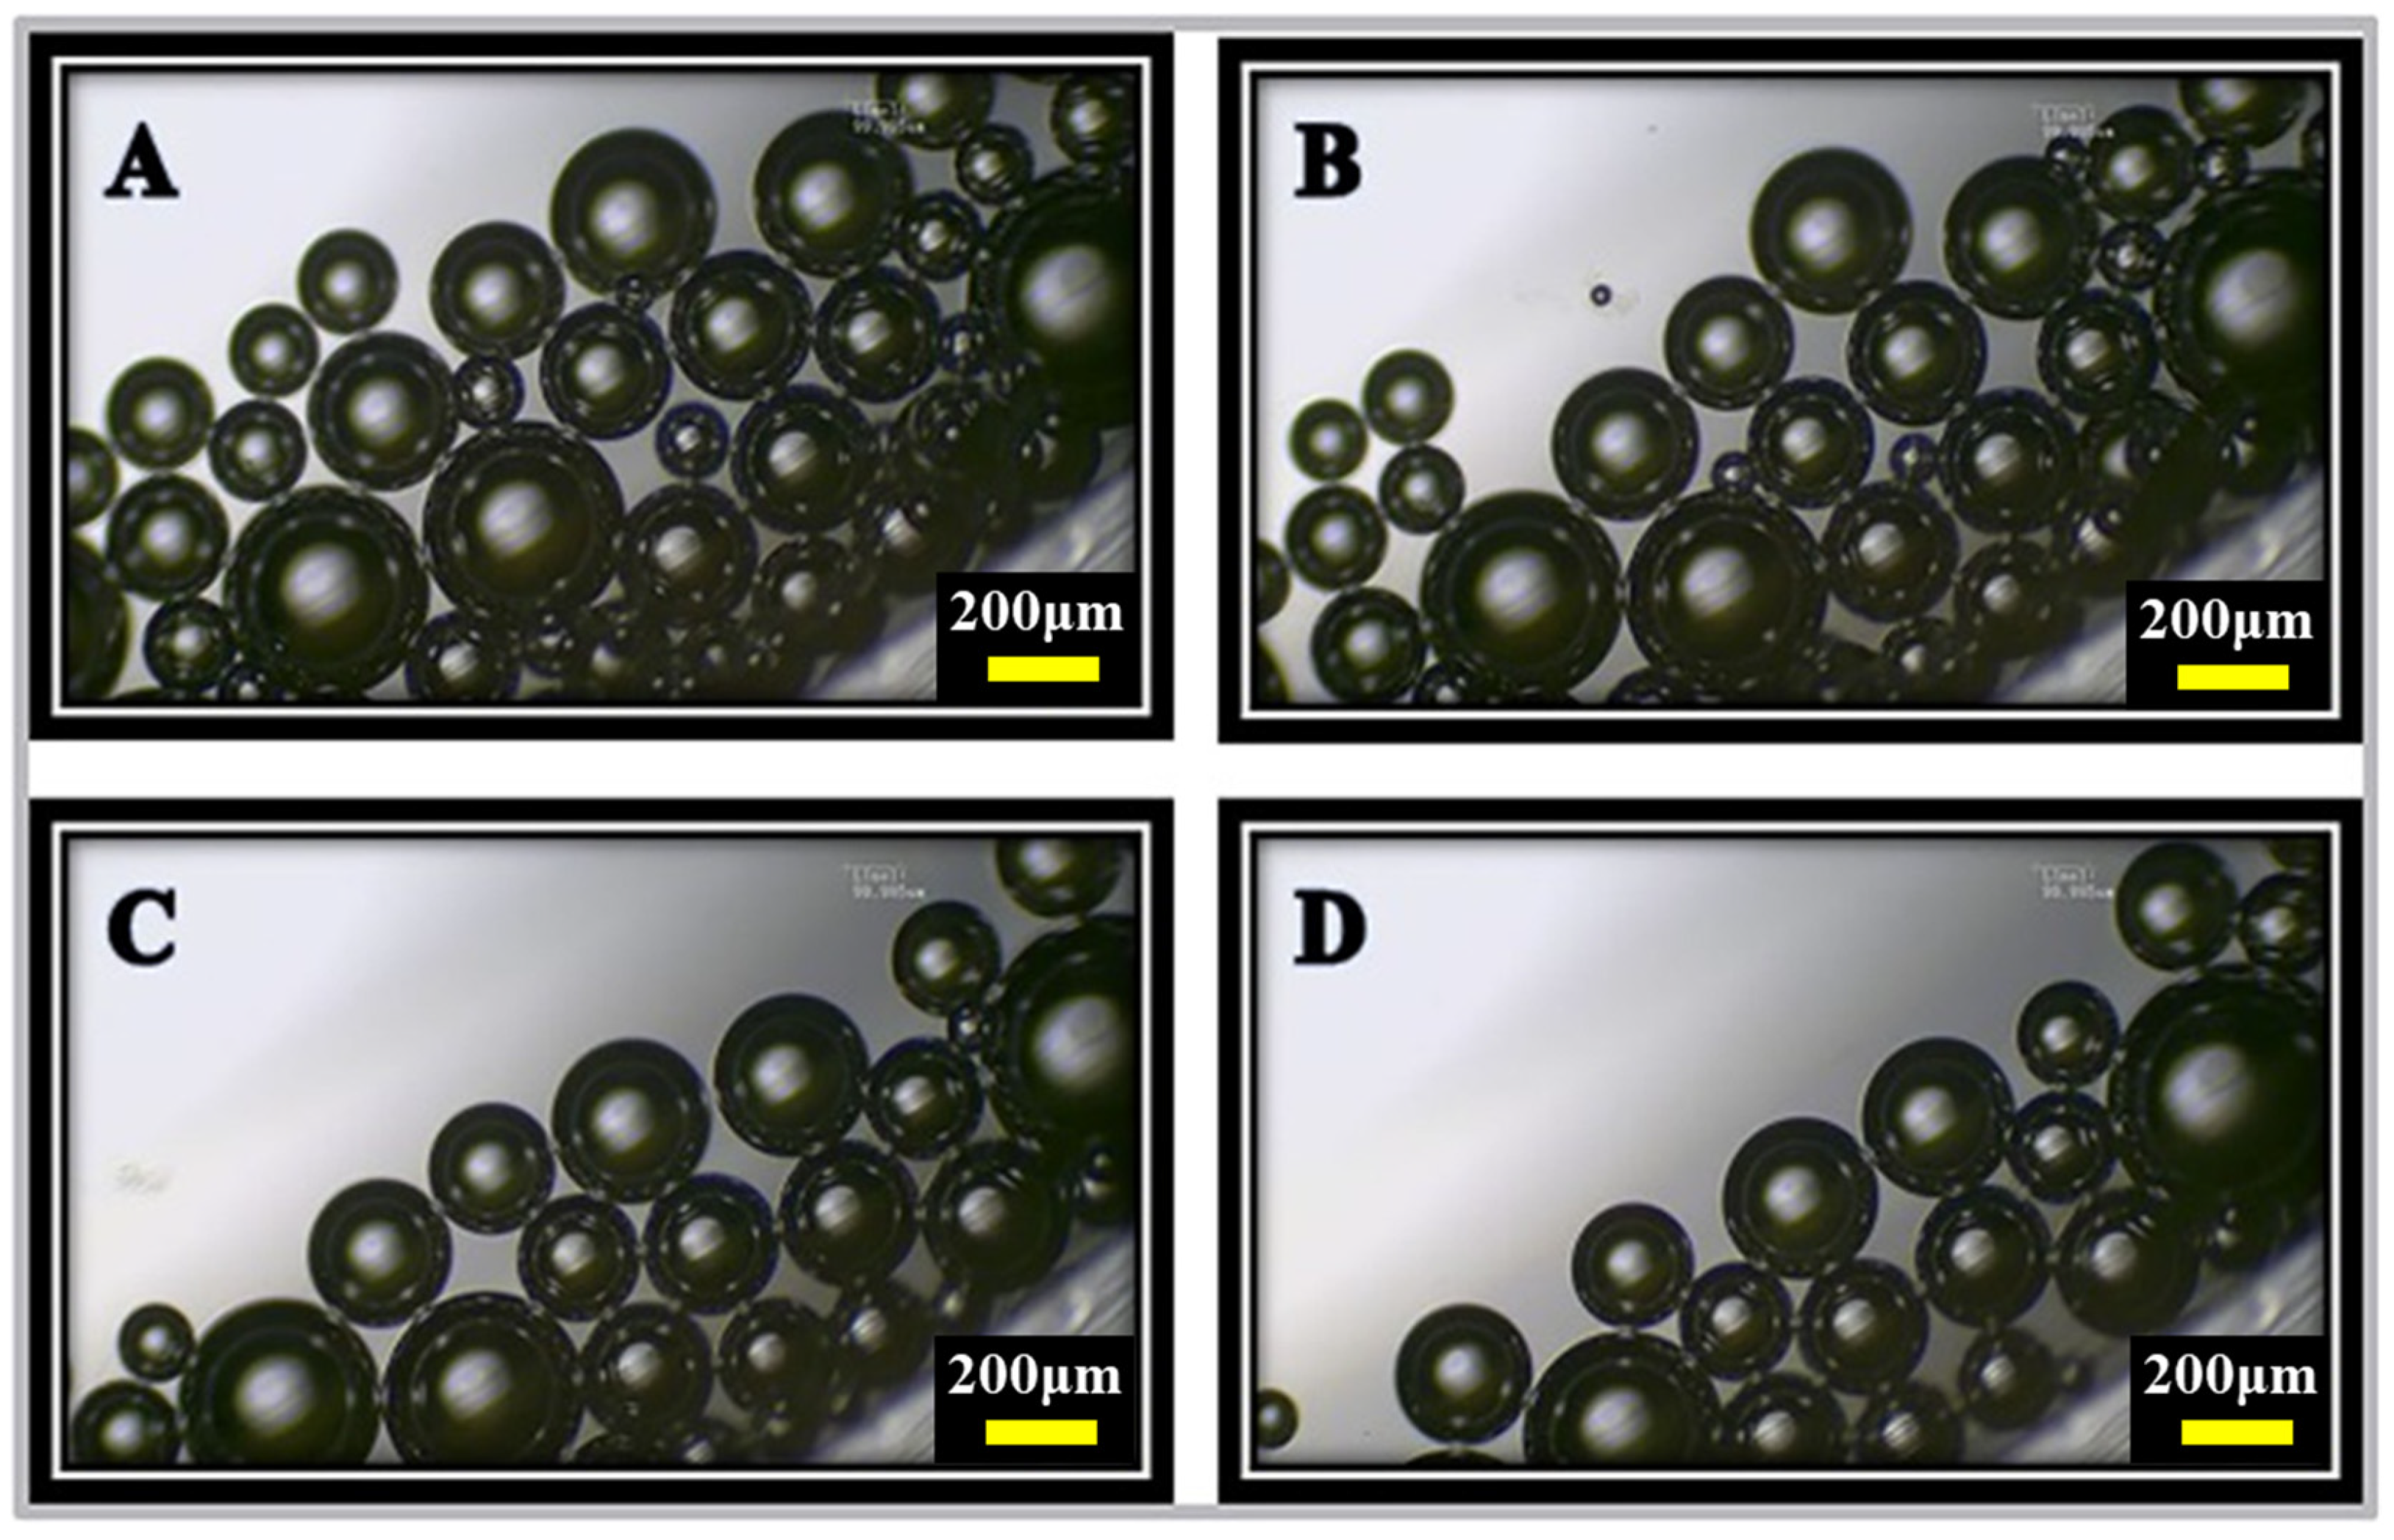
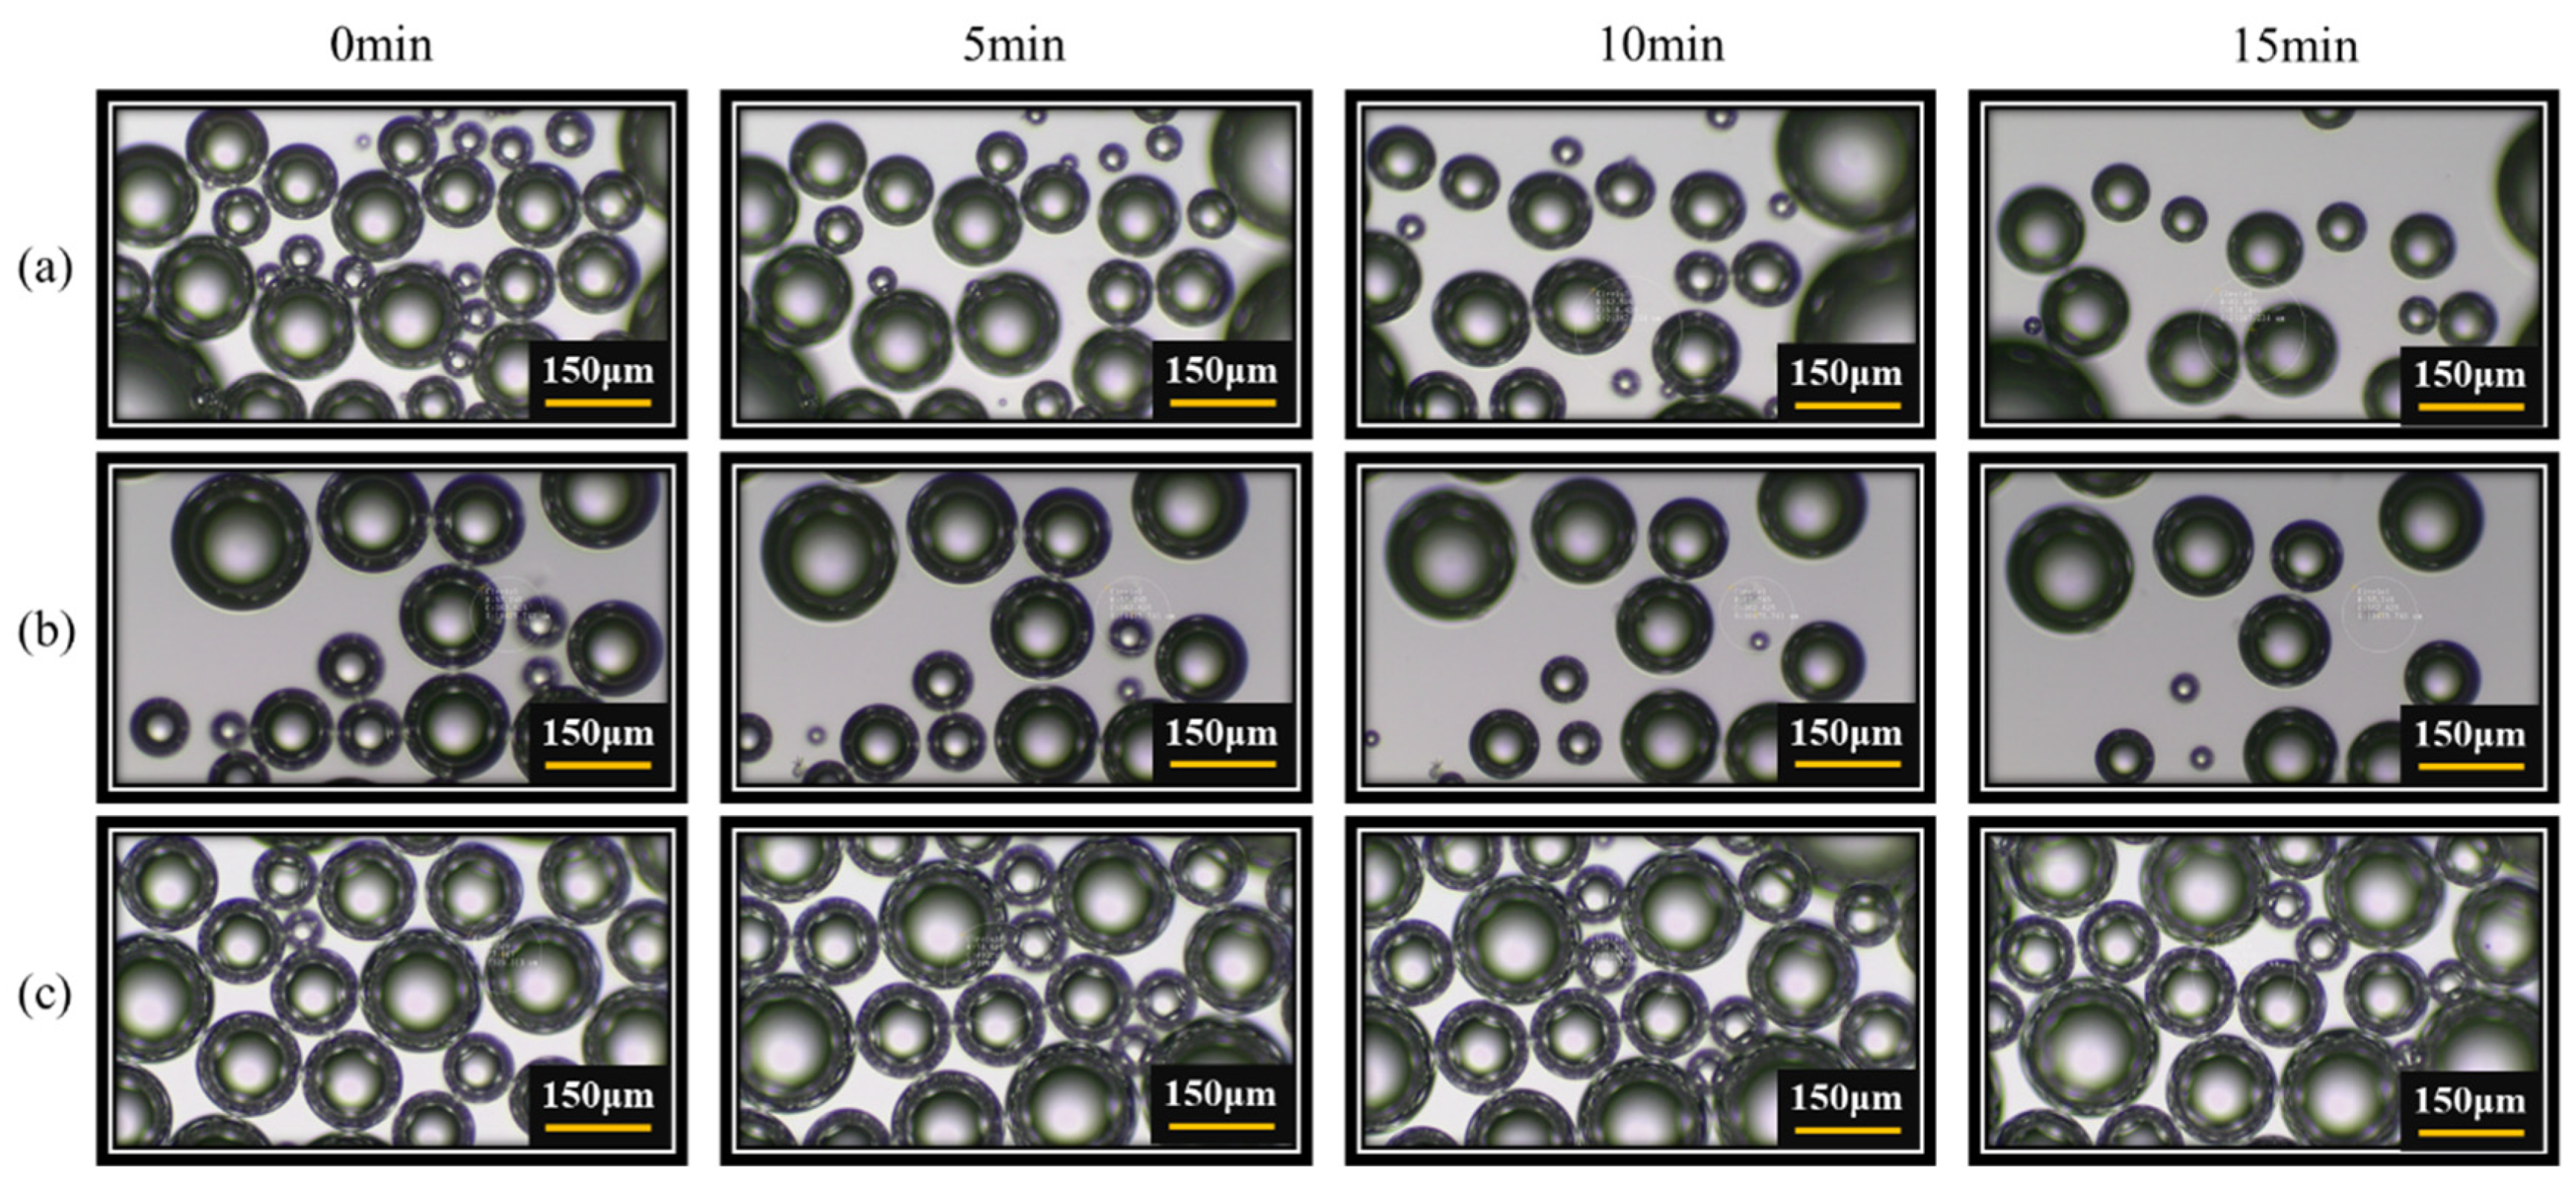
3.1. Microbubbles with and without Nanoparticles Loaded

Figure 2 and Figure 3 show the representative optical micrographs of the produced microbubbles with nanoparticles loaded and without nanoparticles loaded at different time points. The operating conditions were as follows: flow rate of liquid (Ql) 10 mL/h, flow rate of gas (Qg) 50 mL/h, and applied voltage 12 kV. As shown in Figure 2 and Figure 3, both microbubbles with and without nanoparticles loaded could be obtained successfully by coaxial electrohydrodynamic atomization. However, less microbubbles were produced under the same conditions when loading nanoparticles into microbubbles, indicating that the optimal operating conditions for obtaining microbubbles with and without nanoparticles were different. It can also be observed that smaller bubbles tended to disappear more easily for both types of microbubbles. This may be caused by the Oswald ripening effect [35,36], in which small-sized microbubbles dissolve into the surrounding larger sized microbubbles. Figure 4 shows the dimensionless bubble number varying with time for cases with nanoparticles loaded and without nanoparticles loaded. It is obvious that with the loading of nanoparticles, the reduction trend of microbubble number becomes less, suggesting that the microbubbles loaded with nanoparticles have better stability and longer survival time.

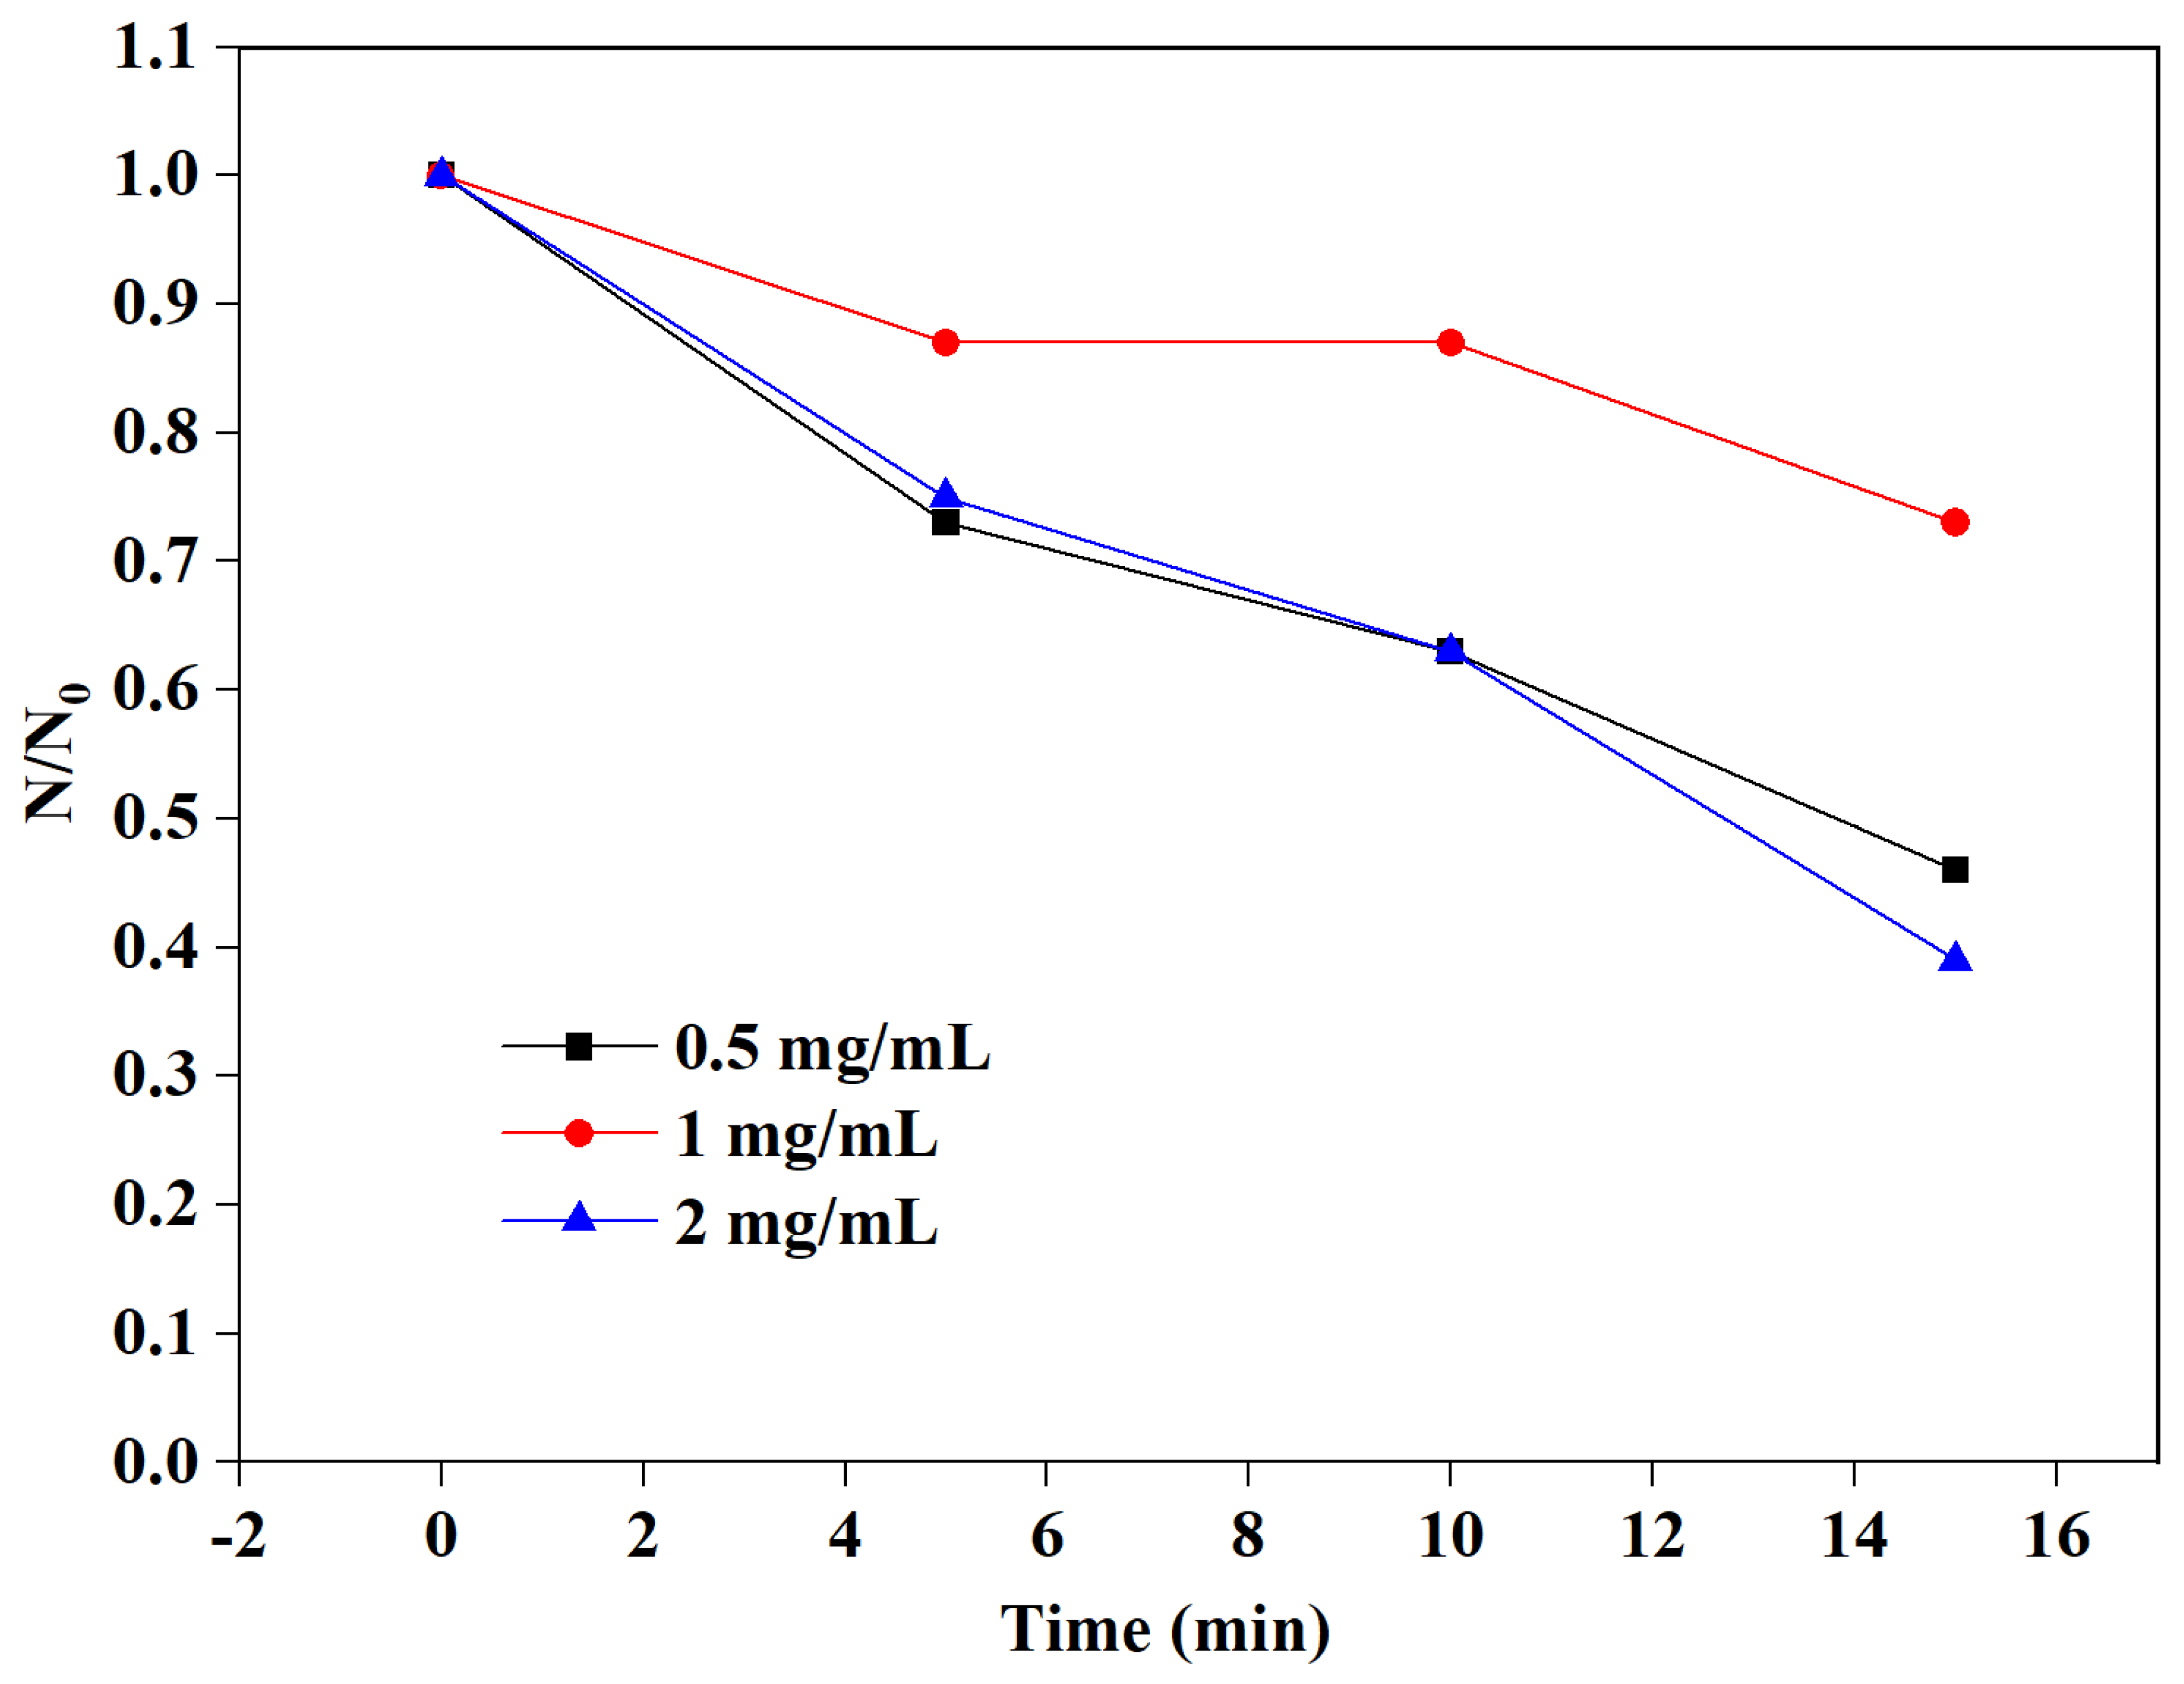
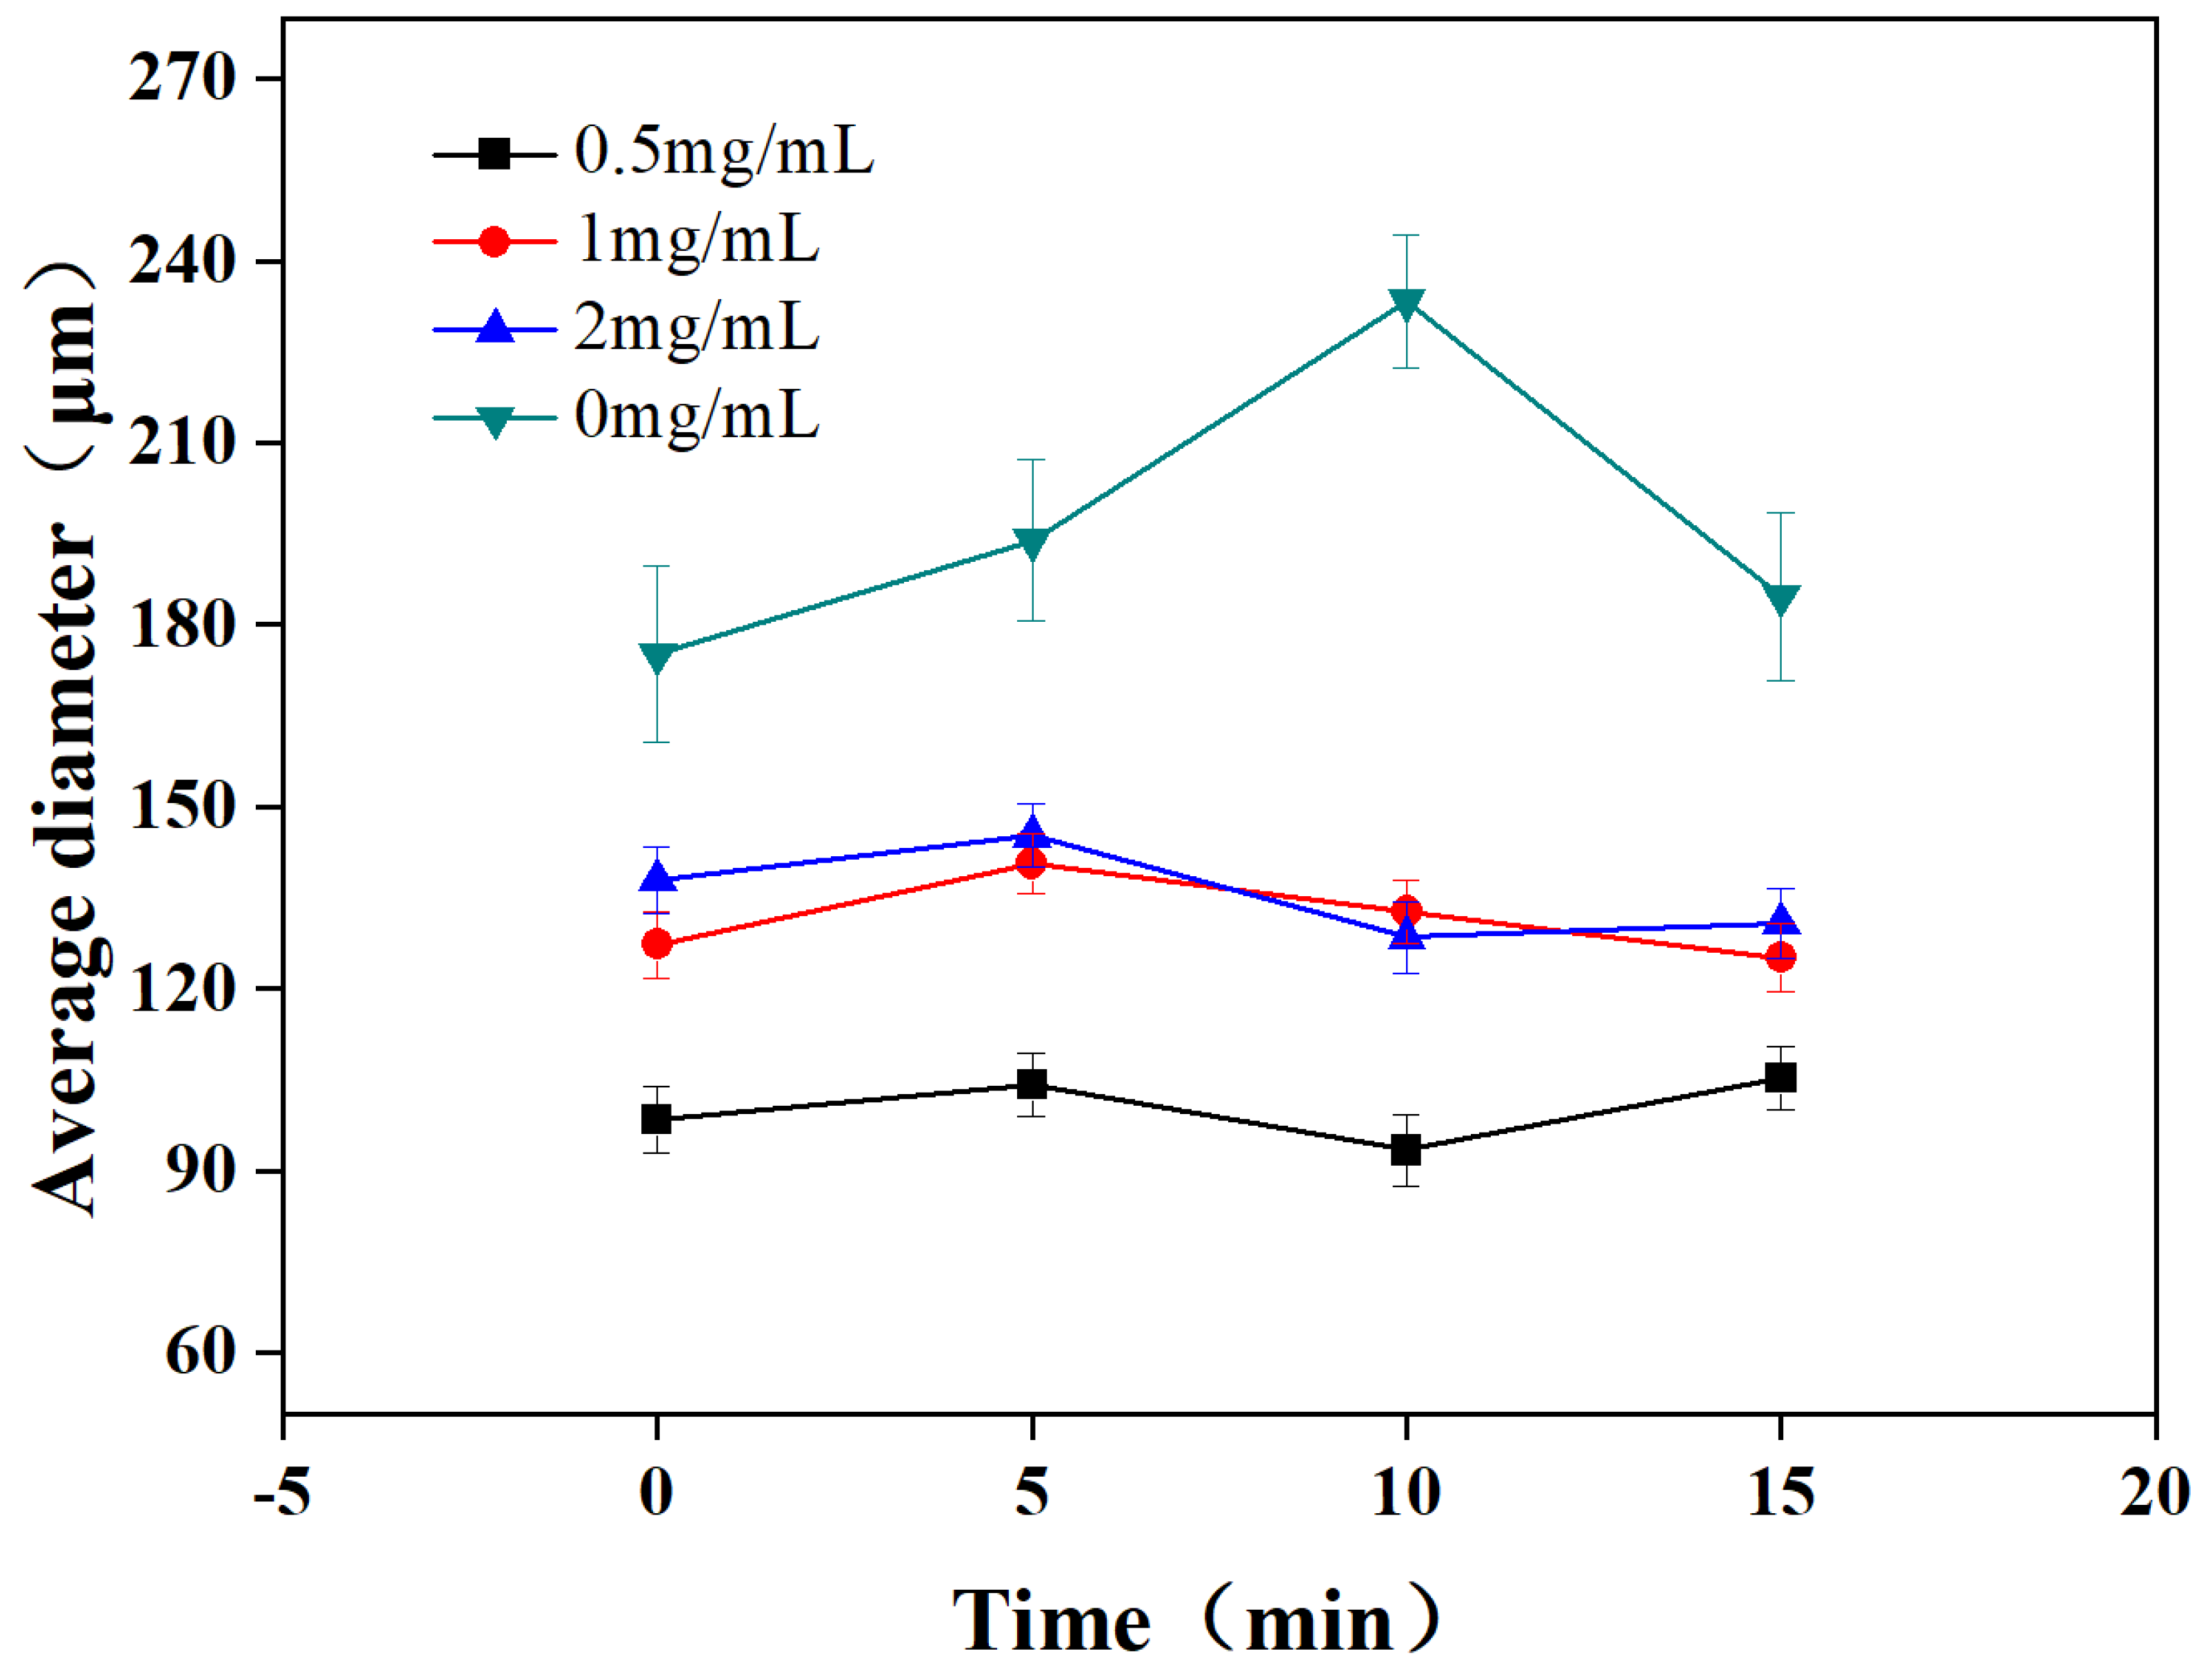
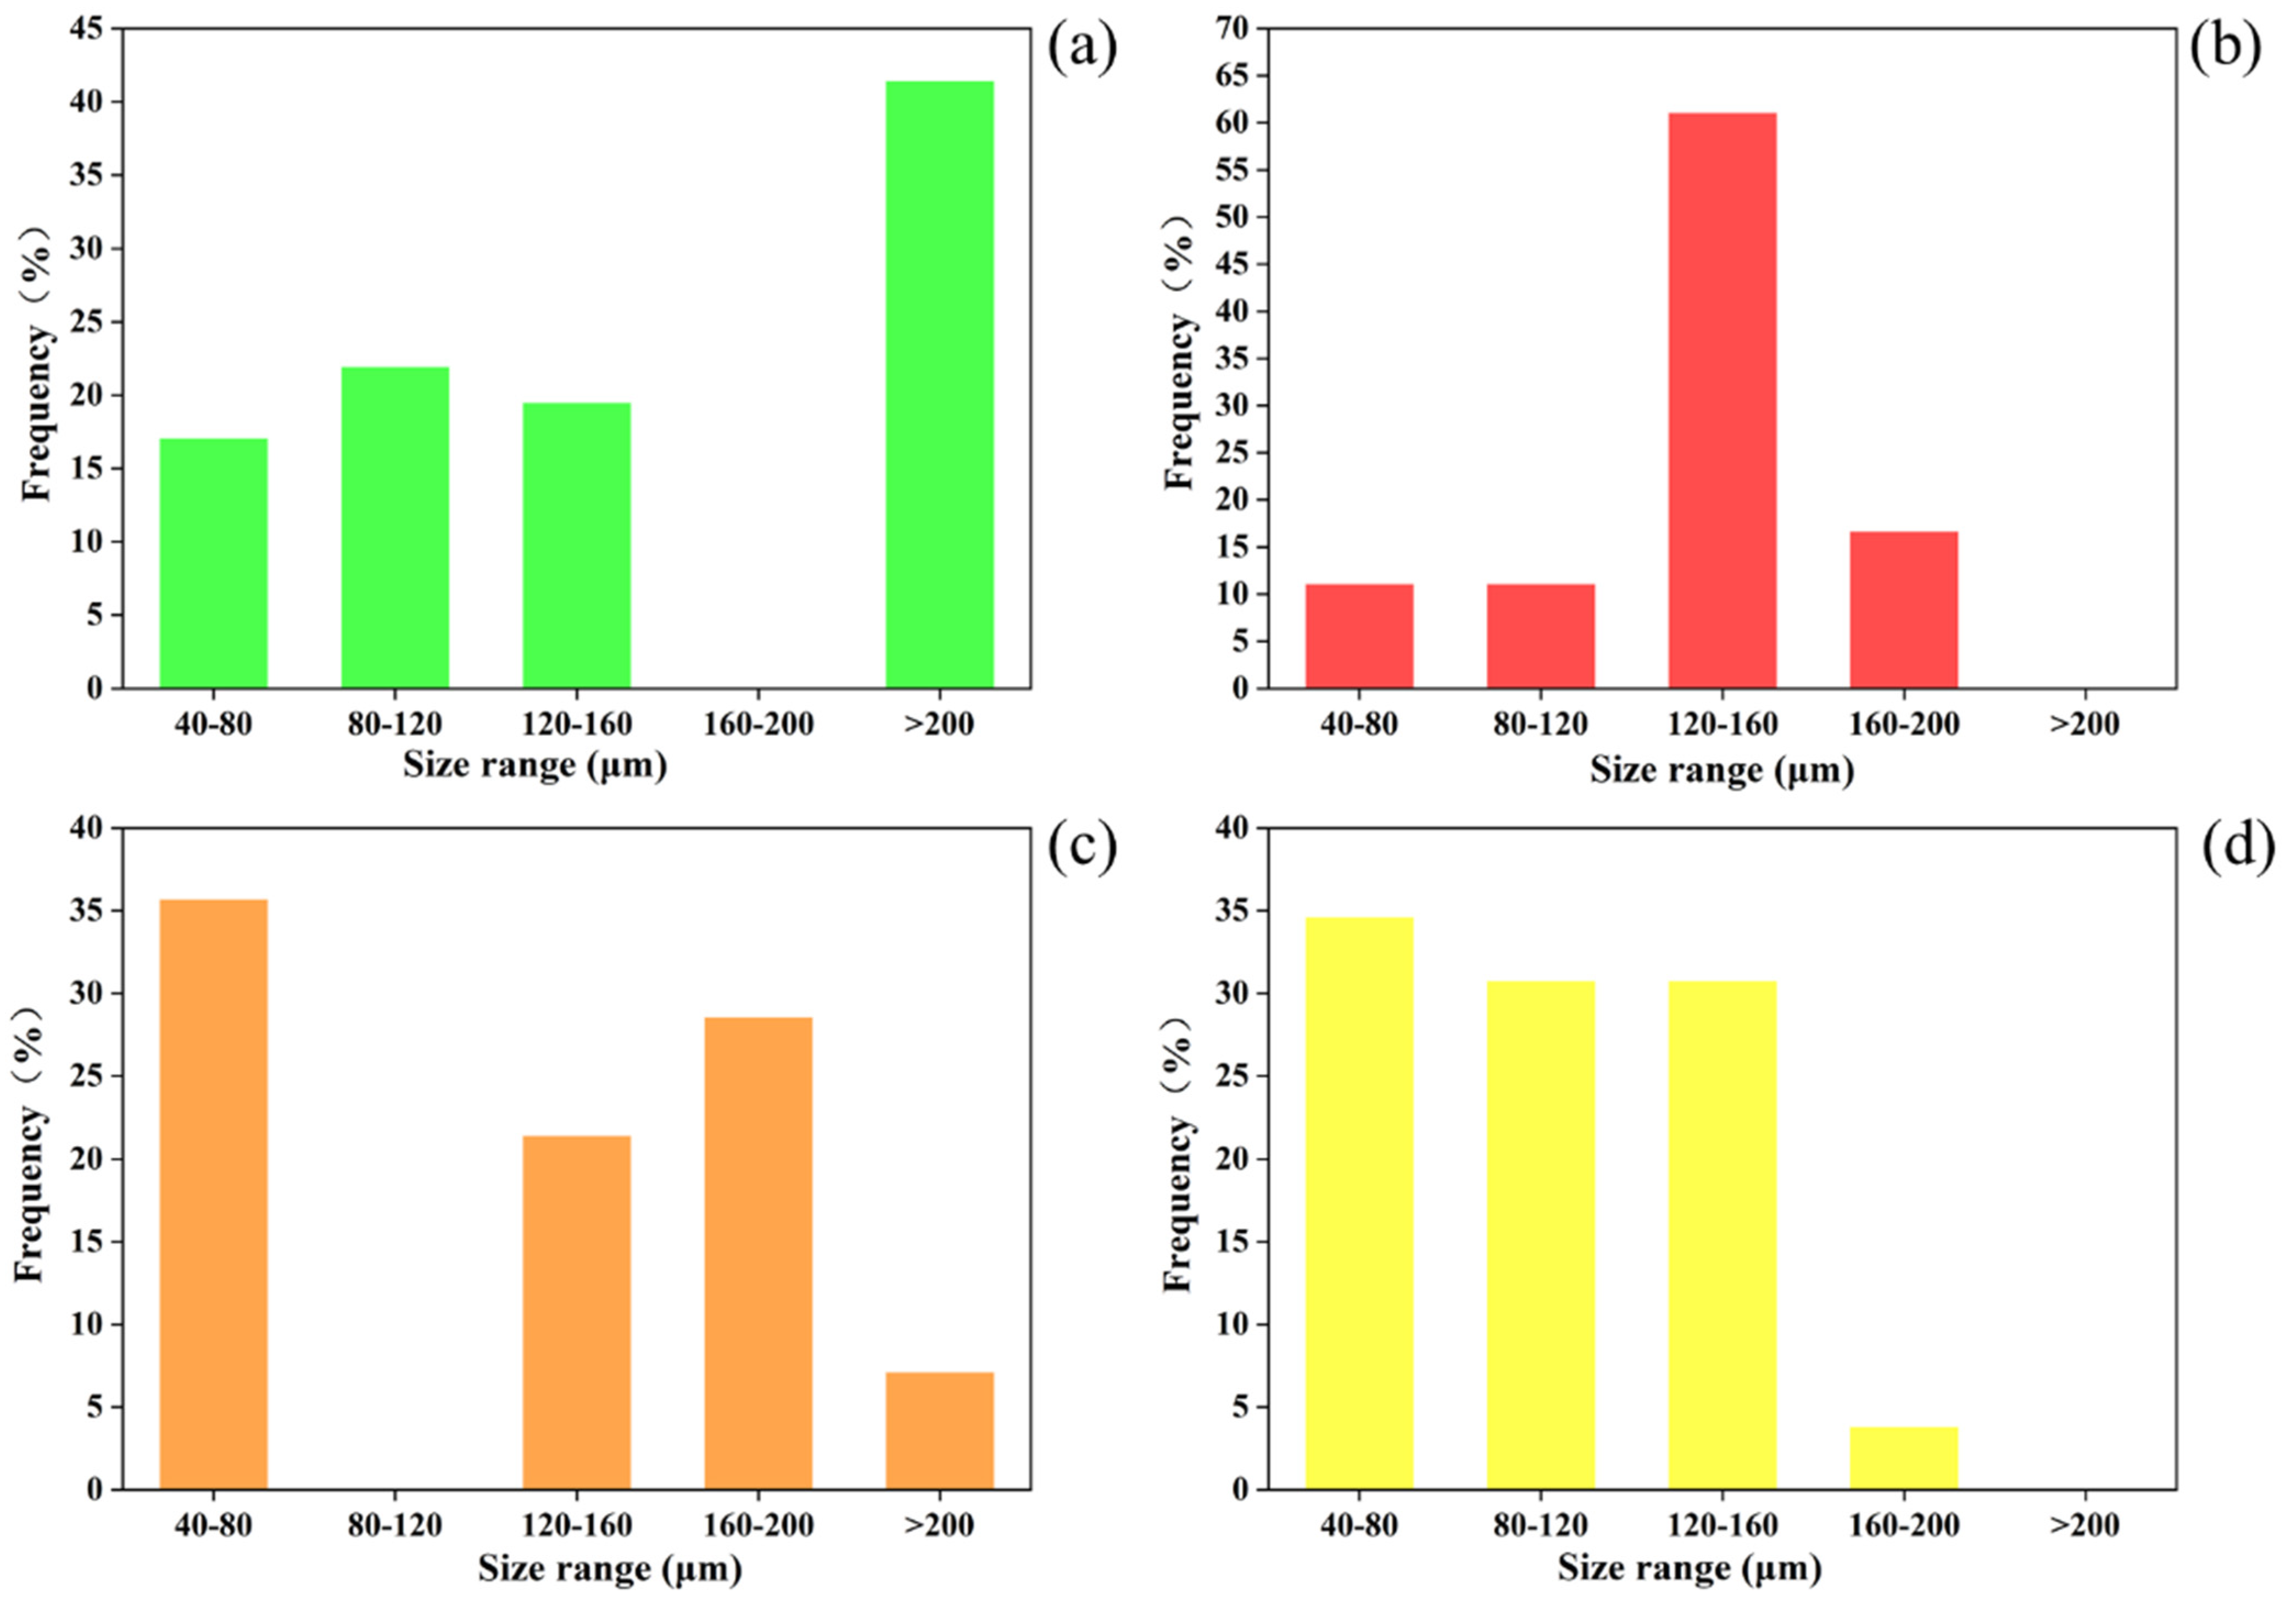
3.2. Effect of Nanoparticle Concentrations on the Microbubbles

To further evaluate the effect of nanoparticle loading on the microbubbles, stability analysis of microbubbles loaded with different concentrations of silica nanoparticles were carried out. Figure 5 shows representative optical micrographs of microbubbles loaded with various concentrations of nanoparticles. The operating conditions were as follows: flow rate of liquid (Ql), 10 mL/h; flow rate of gas (Qg), 60 mL/h, and applied voltage 11 kV. As shown in Figure 5, with the increasing nanoparticle concentration, the microbubbles become more uniform. More microbubbles were produced when CNP = 2 mg/mL. However, as shown in Figure 6, when the nanoparticle concentration increased from 0.5 mg/mL to 1 mg/mL, the reduction rate of bubble number tended to slow down. Further increasing the nanoparticle concentration to 2 mg/mL resulted in an intensification of bubble number reduction. This indicates that the concentration of nanoparticles has a significant impact on the stability of microbubbles, and loading an appropriate amount of nanoparticles is helpful in improving the stability of microbubbles.
Figure 7 shows the effect of nanoparticle concentration on the average diameter of microbubbles. It can be clearly observed that when nanoparticles are loaded in the shell layer, the average size of microbubbles decreases. When the concentration of silica nanoparticles was 0.5 mg/mL, the average size of microbubbles was 100.32 ± 5.49 μm. With the increase of silica concentration, the average size of microbubbles increased gradually. When the concentration of silica nanoparticles was 1 mg/mL, the average size of microbubbles was 131.43 ± 5.28 μm. After increasing the concentration of silica nanoparticles to 2 mg/mL, the average size of microbubbles increased slightly (135.66 ± 5.57 μm). The average size of microbubbles without loading nanoparticles was 196.83 ± 13.14 μm under the same operating conditions. In addition, the size of microbubbles without loading nanoparticles increased gradually at the first 10 min. However, the size of microbubbles loaded with nanoparticles seemed more stable.
When nanoparticles are introduced into the shell layer of microbubbles under the electric field, the introduction of nanoparticles may induce the accumulation of charge on the microbubbles. It is generally accepted that the charge on the surface makes the bubble more stable due to a repulsion force [37,38]. The high-density charge makes the microbubbles easier to break into finer particles under the condition of the electric field [39], which may be one of the reasons for the reduction of microbubbles size. At the same time, we speculate that the existence of nanoparticles limits the Oswaldo ripening effect in the microbubble environment to a certain extent, which is also the reason why the size of microbubbles does not increase or fall sharply after the introduction of nanoparticles.
We analyzed the size distribution of microbubbles prepared by introducing nanoparticles with different concentrations. The results are shown in Figure 8. As can be seen from Figure 8a, when nanoparticles were not loaded, the size of BSA microbubbles was between 40 and 160 μm. It is also worth noting that more than 40% of the microbubbles were larger than 200 μm. When silica nanoparticles were added into the shell layer, the size distribution of the microbubbles was significantly narrowed. The proportion of microbubbles with sizes greater than 200 μm decreased sharply. When the concentration of silica nanoparticles was 0.5 mg/mL, microbubbles showed an ideal size distribution. More than 60% of microbubbles were distributed in the 120~160 μm size range (see Figure 8b). It can be seen from Figure 8c that when the concentration of silica nanoparticles increased to 1 mg/mL, more than 35% of microbubbles were distributed in the 40~80 μm size range. The microbubbles ranging from 120~200 μm accounted for more than 50% of the total, while the microbubbles with sizes greater than 200 μm accounted for ~8%. As can be seen from Figure 8d, when the concentration of silica nanoparticles increased to 2 mg/mL, the proportion of microbubbles ranging in size from 40~160 μm was more than 95%.
Basically, the breakage and dissolution behavior of microbubbles is the result of the coordinated influence of interfacial tension and size. The classical Laplace equation (∆P = 2 σ/R) suggests that the microbubble surface pressure difference is inversely proportional to the microbubble radius R and directly proportional to the microbubble surface interfacial tension. The smaller the microbubble, the greater the pressure difference between the inside and outside, which means that the microbubble is easier to break. This is consistent with the findings shown in Figure 2 and Figure 3. When the size change of microbubbles is negligible (i.e., assuming that R is constant), the smaller interfacial tension leads to the smaller pressure difference. As a result, more stable microbubbles can be achieved. According to the experiment results, we can preliminarily deduce that the introduction of nanoparticles has an impact on the interfacial tension of the surface of microbubbles. The introduction of nanoparticles may reduce the interfacial tension at the interfaces of microbubbles, which improves the stability of microbubbles and prolongs the survival time. In addition, it also worth noting that the stability of the nanoparticle-loaded microbubbles may not simply be dominated by size and surface tension. Other parameters, such as the mechanical strength of the shell layer, may also be key factors affecting the stability of the microbubbles, and need to be further studied.

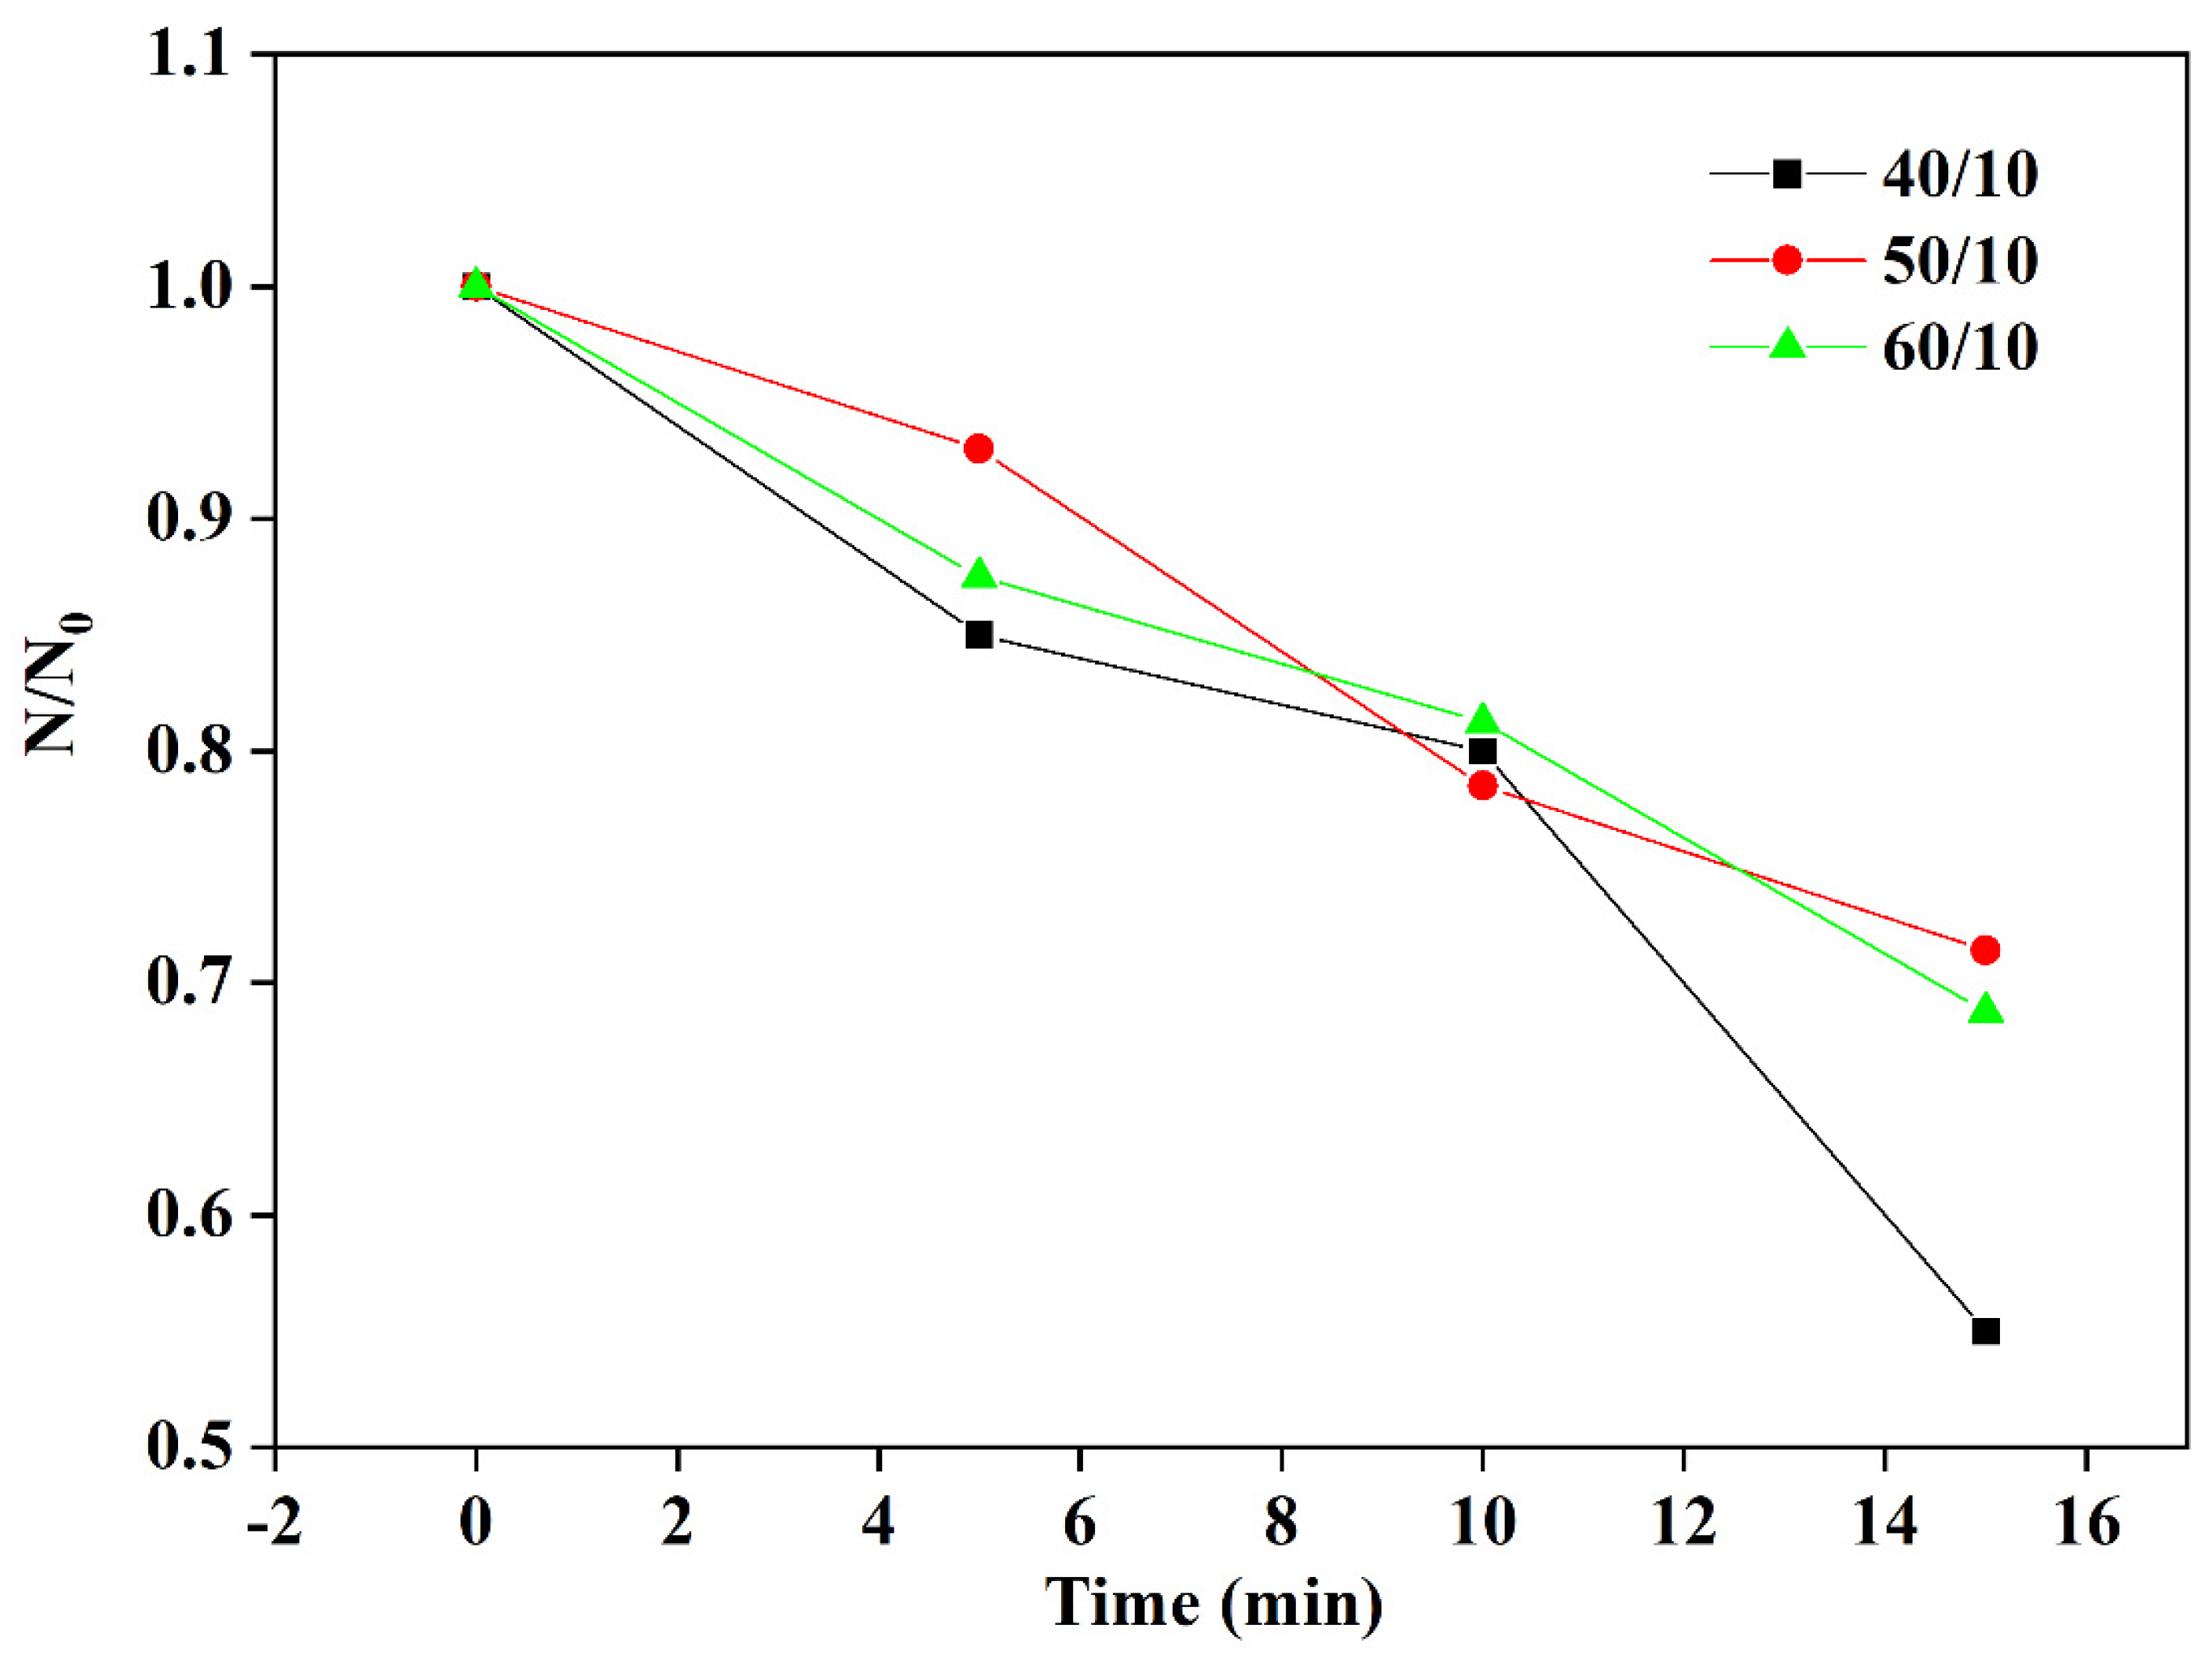
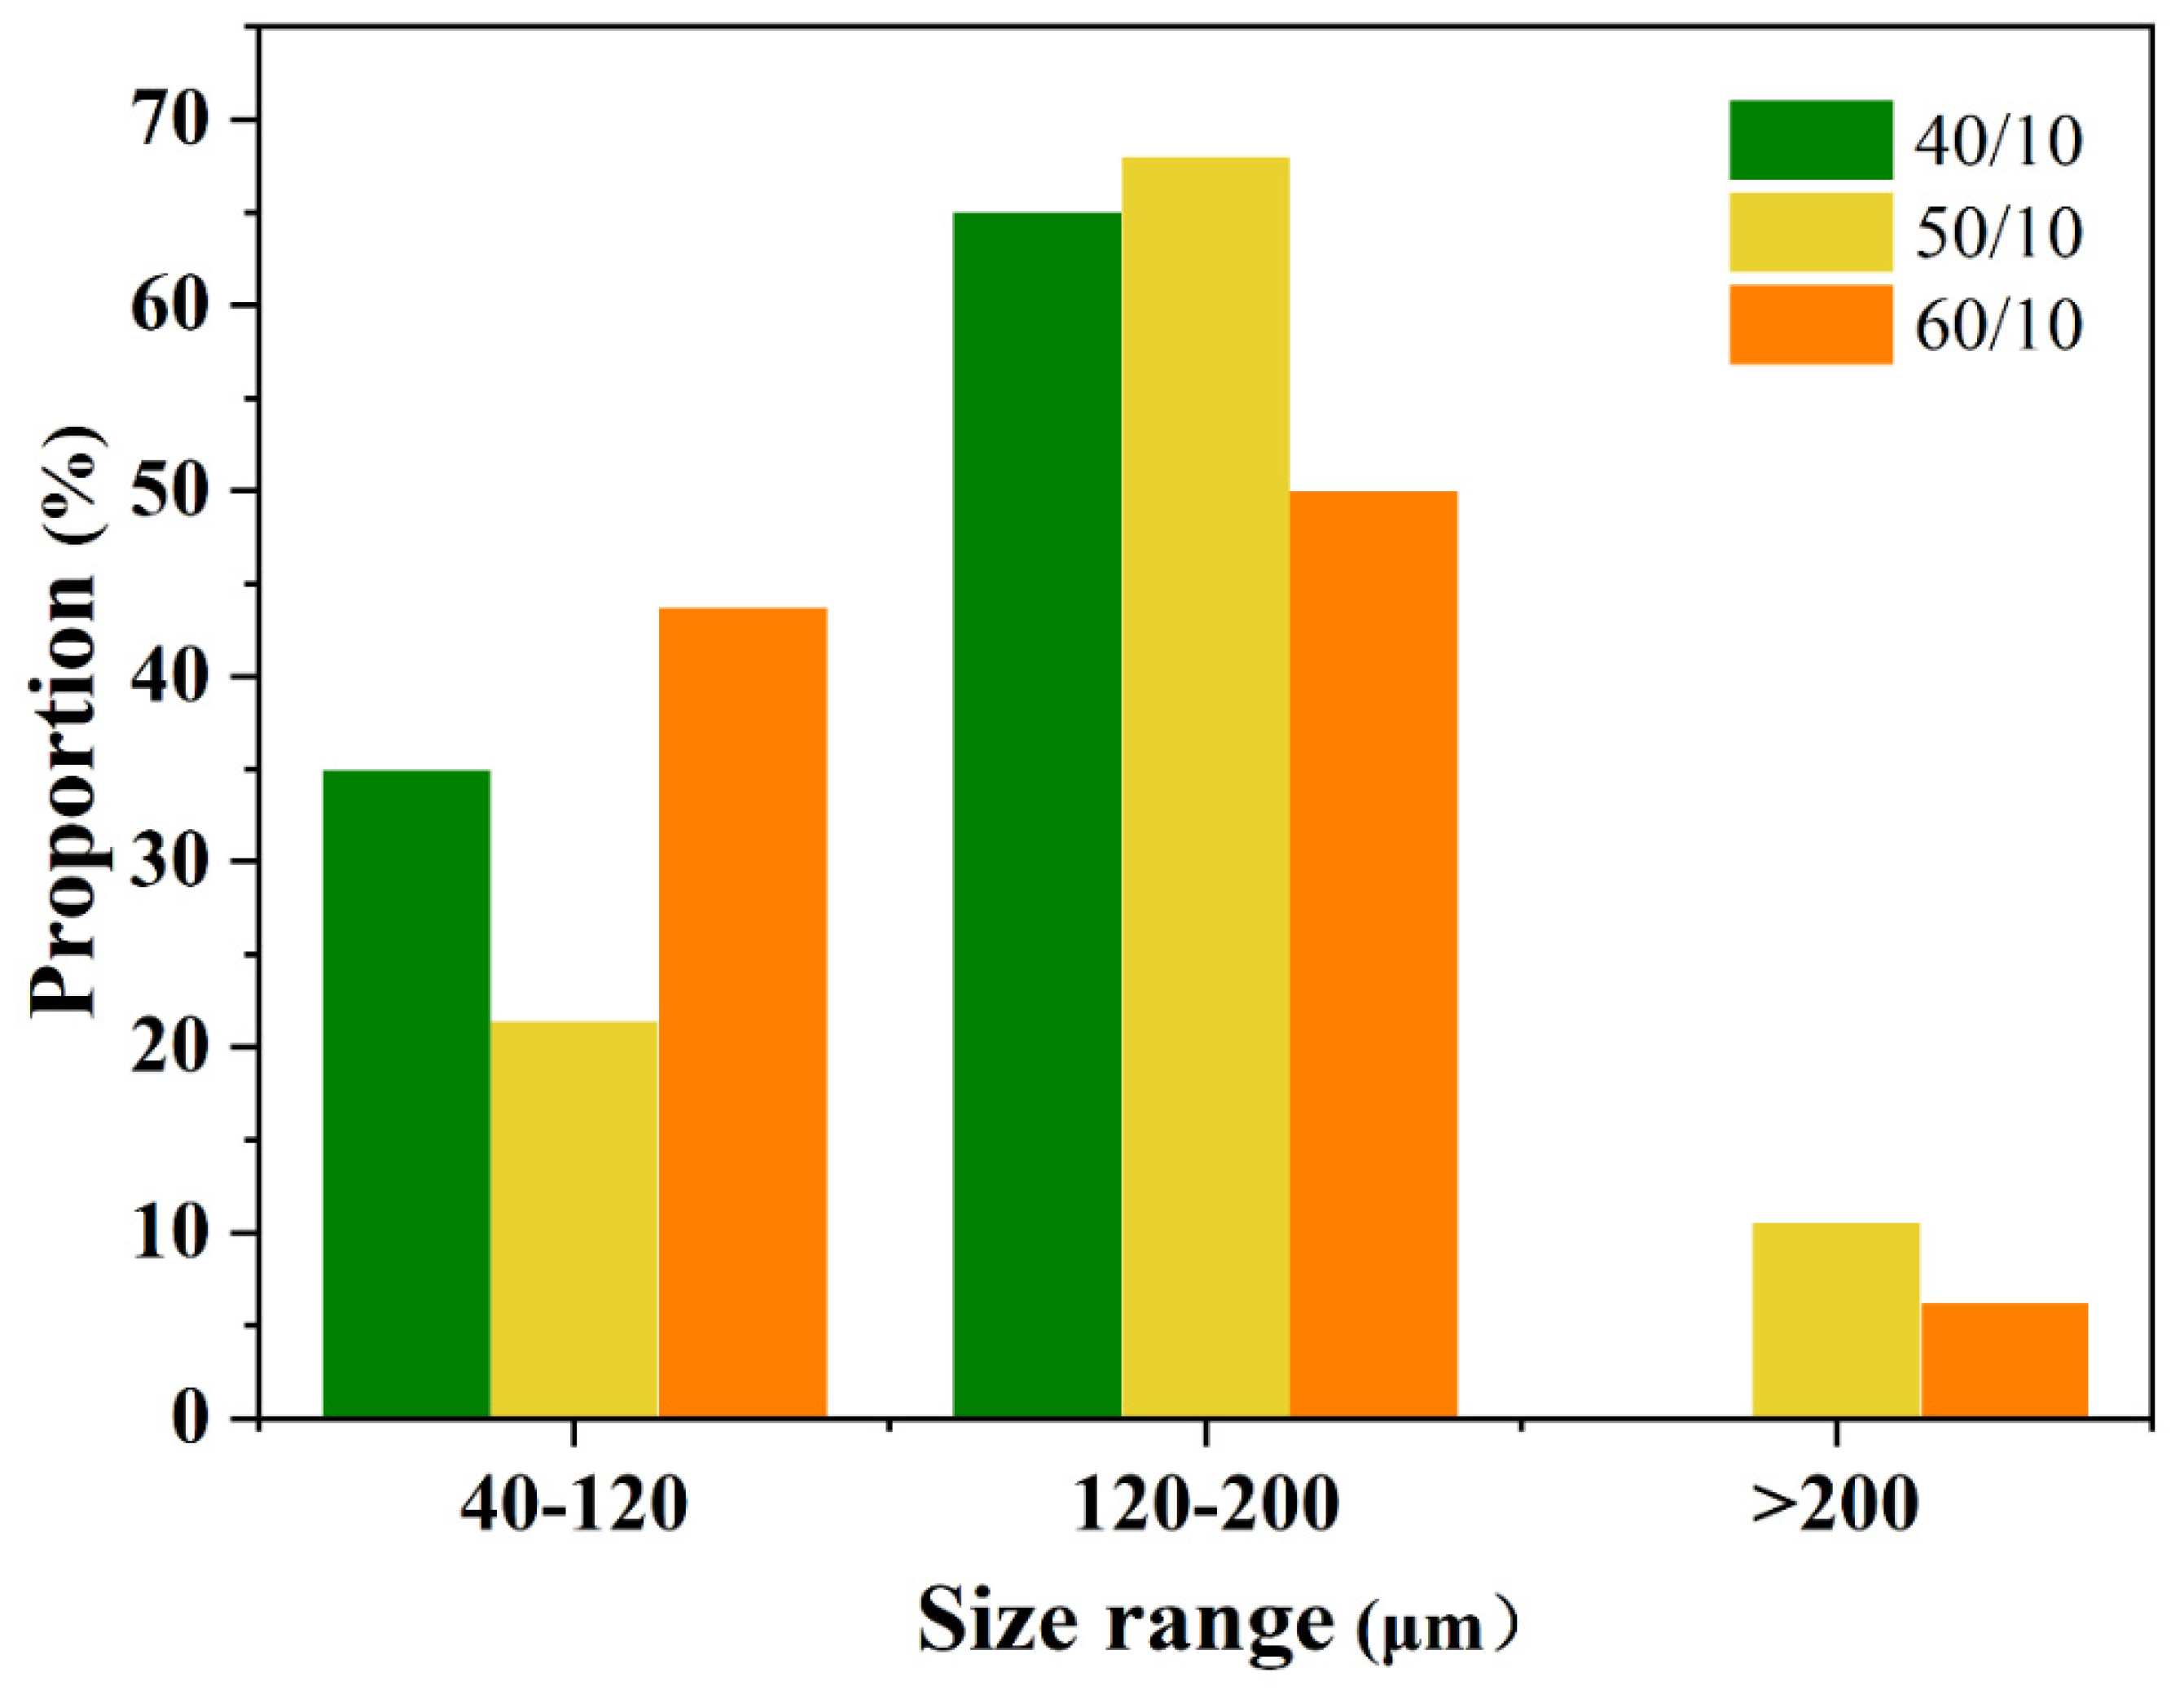
3.3. Effect of Gas to Liquid Flow Rate Ratio on the Microbubbles

It was found that when nanoparticle-loaded microbubbles were prepared by electrohydrodynamic atomization, gas injection flow had a significant effect on the successful preparation of microbubbles. Therefore, the effect of gas to liquid flow rate ratio on the stability of microbubbles was studied and analyzed under the conditions a voltage of 12 kV and a nanoparticle concentration CNP = 1 mg/mL. Figure 9 shows the variations of normalized microbubble number with time at different gas/liquid flow rates. With the increase of gas/liquid flow rate from 40/10 to 50/10 (mL/h/mL/h), the stability of microbubbles increased. Further increasing the gas flow rate to 60 mL/h did not enhance stability. Note that beyond these gas/liquid flow rates, the production process of microbubbles was unstable.
Figure 10 depicts the size distributions of microbubbles at different gas/liquid flow rates. It can be seen that with the increase of gas/liquid flow rate ratio, the average size of microbubbles became larger, while the size distributions became broader. About 68% of microbubbles obtained at a gas flow rate ratio of 50/10 (mL/h/mL/h) were distributed in the 120~200 μm size range. As with the analysis and discussion in previous sections, microbubbles under this condition showed relatively ideal stability. To sum up, the results show that with a voltage at of 12 kV and a nanoparticle concentration CNP = 1 mg/mL, the best gas/liquid flow rate ratio for the preparation of microbubbles with good stability is 50/10 (mL/h/mL/h).

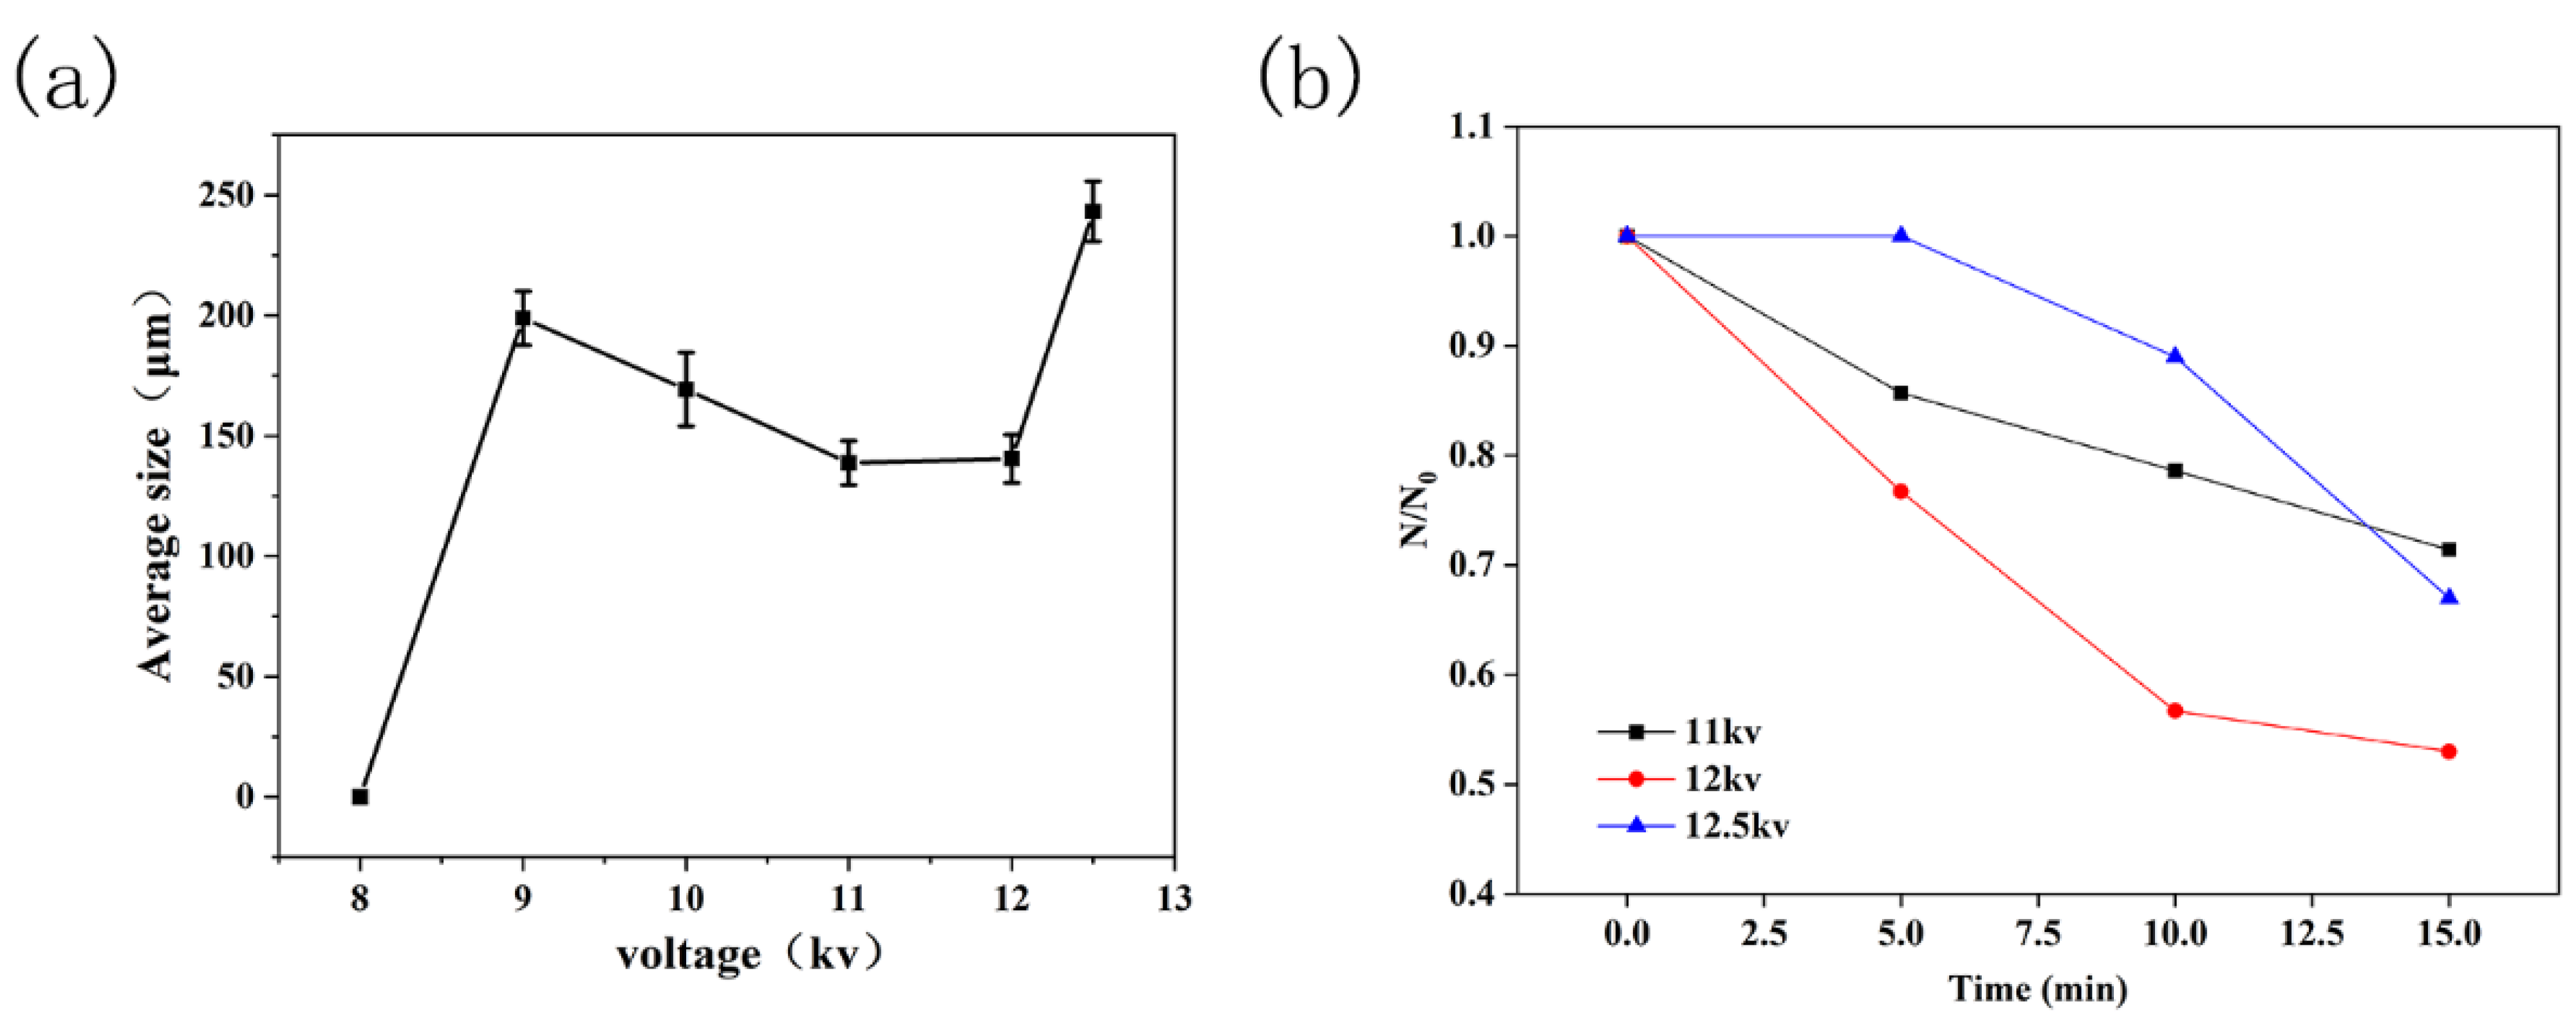
3.4. Effect of Applied Voltage on the Microbubbles

Voltage is an important factor affecting the preparation of microbubbles by electrohydrodynamic atomization. The effects of applied voltage were studied and analyzed, and the results are shown in Figure 11. During the experiment, we found that microbubbles could not be observed in the collection medium when the voltage was less than 8 kV. With an increase of voltage, a few microbubbles could be gradually observed. When the voltage rose to 11 kV, microbubbles were be prepared stably. Figure 11a shows the variations of the average size of microbubbles with voltage. With increasing of voltage, the size of microbubbles decreased first and then increased. When the voltage reached 12.5 kV, the average diameter of the microbubbles reached 243.19 ± 12.53 μm. According to the theoretical knowledge of droplet atomization and fragmentation behavior under the condition of electric field polarization, at greater electric field intensity the droplet breaks into smaller droplets. However, there is a polarization threshold in this process. When the electric field intensity exceeds this threshold, the process of breaking into smaller droplets is affected and larger droplets may appear. A voltage of 11~12 kV is suggested as the ideal range under the experimental conditions of Ql = 10 mL/h, Qg = 50 mL/h, and CNP = 1 mg/mL. The polarization threshold of the electric field under the above experimental conditions can be calculated by the formula E0 = V/H, where E0 is the polarization threshold of electric field intensity, V is the voltage applied, and H is the working distance of the nozzle (H = 10 cm in this experimental condition). Under these experimental conditions, we found that the average size of microbubbles was 138.76 ± 9.76 μm when the voltage was 11 kV, while it was140.45 ± 9.98 μm when the voltage was12 kV. When the voltage reached 12 kV, the size of microbubbles started to increase. When it reached 12.5 kV, the average size of microbubbles shot up to 243.19 ± 12.53 μm. This indicates that the electric field polarization threshold under this experimental condition is in the range of 1.1~1.2 kV/cm. When the electric field intensity is greater than the polarization threshold, the size of microbubbles may increase significantly with increasing voltage. This suggests that it is not advisable to produce smaller microbubbles simply by increasing the voltage when the polarization threshold is reached. The variation of microbubble number with time at different voltages is shown in Figure 11b. The results show that the stability of microbubbles prepared at 11 kV was better than that at 12 kV and 12.5 kV.

4. Conclusions

In this study, nanoparticle-loaded microbubbles were prepared by coaxial electrohydrodynamic atomization technology for the first time. The results show that the loading of nanoparticles has great impact on the stability of microbubbles. A proper quantity of nanoparticles increases the stability and reduces the size of microbubbles. A nanoparticle concentration of 1 mg/mL is suggested to produce microbubbles with the best performance in terms of size and stability. Investigations on the effects of gas/liquid flow rate ratios and applied voltages suggest that a 50/10 gas flow rate ratio and 11 kV are the optimal conditions to produce the most stable and uniform microbubbles. Under these conditions, the size of nanoparticle-loaded microbubbles ranged from 120–200 μm.

Author Contributions

Conceptualization, W.-C.Y. and J.-C.W.; methodology, X.-B.N., Y.W. and X.R.; validation, R.W., W.-C.Y. and J.-C.W.; formal analysis, R.W.; investigation, X.-B.N.; data curation, X.-B.N.; writing—original draft preparation, X.-B.N., Y.W. and X.R.; writing—review and editing, R.W., W.-C.Y. and J.-C.W.; visualization, Y.W.; supervision, W.-C.Y., R.W. and J.-C.W.; project administration, W.-C.Y. and J.-C.W.; funding acquisition, W.-C.Y. All authors have read and agreed to the published version of the manuscript.

Funding

This research was funded by the National Natural Science Foundation of China (21808088), the Natural Science Foundation of Jiangsu Province (BK20180868), the startup funding for high-level talent of Jiangsu University of China (18JDG022), Innovation and Entrepreneurship Program of Jiangsu Province (2020) and the Postgraduate Research & Practice Innovation Program of Jiangsu Province (SJCX21_1676).

Institutional Review Board Statement

Not applicable.

Informed Consent Statement

Not applicable.

Data Availability Statement

Not applicable.

Conflicts of Interest

The authors declare no conflict of interest.

References

  1. Jähnisch, K.; Hessel, V.; Löwe, H.; Baerns, M. Chemistry in Microstructured Reactors. Angew. Chem. Int. Ed. 2004, 43, 406–446. [Google Scholar] [CrossRef] [PubMed]
  2. Terasaka, K.; Hirabayashi, A.; Nishino, T.; Fujioka, S.; Kobayashi, D. Development of microbubble aerator for waste water treatment using aerobic activated sludge. Chem. Eng. Sci. 2011, 66, 3172–3179. [Google Scholar] [CrossRef]
  3. Shen, Y.; Longo, M.L.; Powell, R.L. Stability and rheological behavior of concentrated monodisperse food emulsifier coated microbubble suspensions. J. Colloid Interface Sci. 2008, 327, 204–210. [Google Scholar] [CrossRef] [PubMed]
  4. Bjerknes, K.; Sontum, P.C.; Smistad, G.; Agerkvist, I. Preparation of polymeric microbubbles: Formulation studies and product characterisation. Int. J. Appl. Pharm. 1997, 158, 129–136. [Google Scholar] [CrossRef]
  5. Kwan, J.J.; Borden, M.A. Microbubble Dissolution in a Multigas Environment. Langmuir 2010, 26, 6542–6548. [Google Scholar] [CrossRef]
  6. Lindner, J.R. Microbubbles in medical imaging: Current applications and future directions. Nat. Rev. Drug Discov. 2004, 3, 527–533. [Google Scholar] [CrossRef]
  7. Sirsi, S.; Borden, M. Microbubble Compositions, Properties and Biomedical Applications. Bubble Sci. Eng. Technol. 2009, 1, 3–17. [Google Scholar] [CrossRef]
  8. Unnikrishnan, S.; Klibanov, A.L. Microbubbles as ultrasound contrast agents for molecular imaging: Preparation and application. AJR Am. J. Roentgenol. 2012, 1992, 292–299. [Google Scholar] [CrossRef]
  9. Schutt, E.G.; Klein, D.H.; Mattrey, R.M.; Riess, J.G. Injectable microbubbles as contrast agents for diagnostic ultrasound imaging: The key role of perfluorochemicals. Angew. Chem. Int. Ed. 2003, 4228, 3218–3235. [Google Scholar] [CrossRef]
  10. Stride, E.; Saffari, N. Microbubble ultrasound contrast agents: A review. Proc. Inst. Mech. Eng. Part H J. Eng. Med. 2003, 217, 429–447. [Google Scholar] [CrossRef]
  11. Pancholi, K.; Stride, E.; Edirisinghe, M. Generation of microbubbles for diagnostic and therapeutic applications using a novel device. J. Drug Target 2008, 16, 494–501. [Google Scholar] [CrossRef] [PubMed]
  12. Lv, Y.; Hao, L.; Hu, W.; Ran, Y.; Bai, Y.; Zhang, L. Novel multifunctional pH-sensitive nanoparticles loaded into microbubbles as drug delivery vehicles for enhanced tumor targeting. Sci. Rep. 2016, 6, 29321. [Google Scholar] [CrossRef] [PubMed] [Green Version]
  13. de Saint Victor, M.; Crake, C.; Coussios, C.-C.; Stride, E. Properties, characteristics and applications of microbubbles for sonothrombolysis. Expert Opin. Drug Deliv. 2014, 11, 187–209. [Google Scholar] [CrossRef] [PubMed] [Green Version]
  14. Khan, I.; Saeed, K.; Khan, I. Nanoparticles: Properties, applications and toxicities. Arab. J. Chem. 2019, 12, 908–931. [Google Scholar] [CrossRef]
  15. Roovers, S.; Lajoinie, G.; De Cock, I.; Brans, T.; Dewitte, H.; Braeckmans, K.; Versluis, M.; De Smedt, S.C.; Lentacker, I. Sonoprinting of nanoparticle-loaded microbubbles: Unraveling the multi-timescale mechanism. Biomaterials 2019, 217, 119250. [Google Scholar] [CrossRef] [Green Version]
  16. Kim, D.; Shin, K.; Kwon, S.G.; Hyeon, T. Synthesis and Biomedical Applications of Multifunctional Nanoparticles. Adv. Mater. 2018, 30, 1802309. [Google Scholar] [CrossRef]
  17. Park, J.I.; Jagadeesan, D.; Williams, R.; Oakden, W.; Chung, S.; Stanisz, G.J.; Kumacheva, E. Microbubbles Loaded with Nanoparticles: A Route to Multiple Imaging Modalities. ACS Nano 2010, 4, 6579–6586. [Google Scholar] [CrossRef]
  18. Mohamedi, G.; Azmin, M.; Pastoriza-Santos, I.; Huang, V.; Pérez-Juste, J.; Liz-Marzán, L.M.; Edirisinghe, M.; Stride, E. Effects of Gold Nanoparticles on the Stability of Microbubbles. Langmuir 2012, 28, 13808–13815. [Google Scholar] [CrossRef]
  19. Owen, J.; Crake, C.; Lee, J.Y.; Carugo, D.; Beguin, E.; Khrapitchev, A.A.; Browning, R.J.; Sibson, N.; Stride, E. A versatile method for the preparation of particle-loaded microbubbles for multimodality imaging and targeted drug delivery. Drug Deliv. Transl. Res. 2018, 8, 342–356. [Google Scholar] [CrossRef] [Green Version]
  20. Tay, L.M.; Xu, C. Coating microbubbles with nanoparticles for medical imaging and drug delivery. Nanomedicine 2017, 12, 91–94. [Google Scholar] [CrossRef]
  21. Seo, M.; Gorelikov, I.; Williams, R.; Matsuura, N. Microfluidic Assembly of Monodisperse, Nanoparticle-Incorporated Perfluorocarbon Microbubbles for Medical Imaging and Therapy. Langmuir 2010, 26, 13855–13860. [Google Scholar] [CrossRef] [PubMed]
  22. Lee, J.Y.; Carugo, D.; Crake, C.; Owen, J.; de Saint Victor, M.; Seth, A.; Coussios, C.; Stride, E. Nanoparticle-Loaded Protein–Polymer Nanodroplets for Improved Stability and Conversion Efficiency in Ultrasound Imaging and Drug Delivery. Adv. Mater. 2015, 27, 5484–5492. [Google Scholar] [CrossRef] [Green Version]
  23. Yan, W.-C.; Chua, Q.W.; Ong, X.J.; Sharma, V.K.; Tong, Y.W.; Wang, C.-H. Fabrication of ultrasound-responsive microbubbles via coaxial electrohydrodynamic atomization for triggered release of tPA. J. Colloid Interface Sci. 2017, 501, 282–293. [Google Scholar] [CrossRef] [PubMed]
  24. Chen, H.; Li, J.; Zhou, W.; Pelan, E.G.; Stoyanov, S.D.; Arnaudov, L.N.; Stone, H.A. Sonication–Microfluidics for Fabrication of Nanoparticle-Stabilized Microbubbles. Langmuir 2014, 30, 4262–4266. [Google Scholar] [CrossRef] [PubMed]
  25. Wan, J.; Bick, A.; Sullivan, M.; Stone, H.A. Controllable Microfluidic Production of Microbubbles in Water-in-Oil Emulsions and the Formation of Porous Microparticles. Adv. Mater. 2008, 20, 3314–3318. [Google Scholar] [CrossRef]
  26. Xu, J.H.; Li, S.W.; Chen, G.G.; Luo, G.S. Formation of monodisperse microbubbles in a microfluidic device. AIChE J. 2006, 52, 2254–2259. [Google Scholar] [CrossRef]
  27. Farook, U.; Zhang, H.B.; Edirisinghe, M.J.; Stride, E.; Saffari, N. Preparation of microbubble suspensions by co-axial electrohydrodynamic atomization. Med. Eng. Phys. 2007, 29, 749–754. [Google Scholar] [CrossRef] [PubMed]
  28. Chen, C.; Liu, W.; Jiang, P.; Hong, T. Coaxial Electrohydrodynamic Atomization for the Production of Drug-Loaded Micro/Nanoparticles. Micromachines 2019, 10, 125. [Google Scholar] [CrossRef] [Green Version]
  29. Yan, W.-C.; Ong, X.J.; Pun, K.T.; Tan, D.Y.; Sharma, V.K.; Tong, Y.W.; Wang, C.-H. Preparation of tPA-loaded microbubbles as potential theranostic agents: A novel one-step method via coaxial electrohydrodynamic atomization technique. Chem. Eng. J. 2017, 307, 168–180. [Google Scholar] [CrossRef]
  30. Yan, W.-C.; Tong, Y.W.; Wang, C.-H. Coaxial electrohydrodynamic atomization toward large scale production of core-shell structured microparticles. AIChE J. 2017, 63, 5303–5319. [Google Scholar] [CrossRef]
  31. Farook, U.; Stride, E.; Edirisinghe, M.; Moaleji, R. Microbubbling by co-axial electrohydrodynamic atomization. Med. Biol. Eng. Comput. 2007, 45, 781–789. [Google Scholar] [CrossRef] [PubMed]
  32. Parhizkar, M.; Stride, E.; Edirisinghe, M. Preparation of monodisperse microbubbles using an integrated embedded capillary T-junction with electrohydrodynamic focusing. Lab Chip 2014, 14, 2437–2446. [Google Scholar] [CrossRef] [PubMed] [Green Version]
  33. Murray, B.S. Stabilization of bubbles and foams. Curr. Opin. Colloid Interface Sci. 2007, 12, 232–241. [Google Scholar] [CrossRef]
  34. Brugarolas, T.; Gianola, D.S.; Zhang, L.; Campbell, G.M.; Bassani, J.L.; Feng, G.; Lee, D. Tailoring and Understanding the Mechanical Properties of Nanoparticle-Shelled Bubbles. ACS Appl. Mater. Interfaces 2014, 6, 11558–11572. [Google Scholar] [CrossRef]
  35. Lee, M.; Lee, E.Y.; Lee, D.; Park, B.J. Stabilization and fabrication of microbubbles: Applications for medical purposes and functional materials. Soft Matter 2015, 11, 2067–2079. [Google Scholar] [CrossRef]
  36. Yarranton, H.W.; Masliyah, J.H. Numerical Simulation of Ostwald Ripening in Emulsions. J. Colloid Interface Sci. 1997, 196, 157–169. [Google Scholar] [CrossRef]
  37. Jin, Z.; Mantri, Y.; Retout, M.; Cheng, Y.; Zhou, J.; Jorns, A.; Fajtova, P.; Yim, W.; Moore, C.; Xu, M.; et al. A Charge-Switchable Zwitterionic Peptide for Rapid Detection of SARS-CoV-2 Main Protease. Angew. Angew. Chem. Int. Ed. 2022, 61, e202112995. [Google Scholar] [CrossRef]
  38. Welsh, T.J.; Krainer, G.; Espinosa, J.R.; Joseph, J.A.; Sridhar, A.; Jahnel, M.; Arter, W.E.; Saar, K.L.; Alberti, S.; Collepardo-Guevara, R.; et al. Surface Electrostatics Govern the Emulsion Stability of Biomolecular Condensates. Nano Lett. 2022, 22, 612–621. [Google Scholar] [CrossRef]
  39. Xie, J.; Jiang, J.; Davoodi, P.; Srinivasan, M.P.; Wang, C.-H. Electrohydrodynamic atomization: A two-decade effort to produce and process micro-/nanoparticulate materials. Chem. Eng. Sci. 2015, 125, 32–57. [Google Scholar] [CrossRef] [Green Version]
Figure 1. Schematic diagram of the experimental setup.
Applsci 12 03621 g001
Figure 2. Representative optical micrographs of microbubbles without nanoparticles. (A) t = 0 min. (B) t = 5 min. (C) t = 10 min. (D) t = 15 min.
Applsci 12 03621 g002
Figure 3. Representative optical micrographs of microbubbles with nanoparticles. (A) t = 0 min. (B) t = 5 min. (C) t = 10 min. (D) t = 15 min.
Applsci 12 03621 g003
Figure 4. Variation of normalized microbubble number against time.
Applsci 12 03621 g004
Figure 5. Representative optical micrographs of microbubbles loaded with various concentration of nanoparticles. (a) CNP = 0.5 mg/mL; (b) CNP = 1 mg/mL; (c) CNP = 2 mg/mL.
Applsci 12 03621 g005
Figure 6. Variation of normalized bubble number with time when loading nanoparticles with different concentrations.
Applsci 12 03621 g006
Figure 7. Variation of average bubble diameter over time for microbubbles loaded with various concentrations of nanoparticle. At time 0, the initial sizes of microbubbles at different loading concentrations were as follows: 175.19 ± 14.59 μm (0 mg/mL), 98.41 ± 5.57 μm (0.5 mg/mL), 127.23 ± 5.45 μm (1 mg/mL), 137.98 ± 5.28 μm (2 mg/mL).
Applsci 12 03621 g007
Figure 8. Size distributions of microbubbles loaded with different nanoparticle concentrations. (a) CNP = 0 mg/mL; (b) CNP = 0.5 mg/mL; (c) CNP = 1 mg/mL; (d) CNP = 2 mg/mL.
Applsci 12 03621 g008
Figure 9. Variation of normalized microbubble number with time at different gas/liquid flow rates (unit: mL/h/mL/h).
Applsci 12 03621 g009
Figure 10. Size distributions of microbubbles at different gas/liquid flow rates.
Applsci 12 03621 g010
Figure 11. (a) Variation of average bubble size with voltage. (b) Variation of normalized bubble number over time with different voltages. (Ql = 10 mL/h, Qg = 50 mL/h, CNP = 1 mg/mL).
Applsci 12 03621 g011
Publisher’s Note: MDPI stays neutral with regard to jurisdictional claims in published maps and institutional affiliations.

