1. Introduction
Pipe jacking is widely used in long-distance natural resource transportation projects because of its high construction accuracy, good safety, and little impact on the surrounding environment [
1,
2]. During pipe jacking construction, the pipe is continuously pushed into the stratum under the action of jacking force. There is sliding friction between the pipe and the surrounding soil, and the resulting friction resistance of the pipe soil increases with the increase in the jacking distance, which may lead to the problem of insufficient jacking force. However, blindly increasing the jacking force causes structural damage to the working shaft and endangers the construction safety. In addition, the friction resistance has a disturbing effect on the soil, and the increase in the friction resistance results in an enhanced disturbance action on the soil. This may lead to the soil body collapsing, resulting in land subsidence, which seriously endangers the structural stability of surrounding buildings and the safety of pipe jacking construction. Therefore, reducing the friction resistance of pipe soil has become an important link to ensure the smooth construction and construction safety of pipe jacking engineering.
After injecting bentonite slurry into the annular space between the pipe and the surrounding soil, the dry sliding friction between the pipe and the surrounding soil can be transformed into wet sliding friction, which can effectively reduce the friction coefficient of pipe soil to reduce the friction resistance of pipe soil and act as a lubricant. In addition, under the action of grouting pressure, the slurry penetrates and diffuses into the stratum, and combines with the surrounding soil to form a relatively dense mud cake. The mud cake transfers the grouting pressure, which exceeds the formation water pressure, to the soil particles, resulting in soil compaction and support of the stratum [
3,
4,
5]. Traditional bentonite slurry is generally composed of bentonite, water, soda ash, and CMC according to a certain mass ratio, in which the mass of bentonite usually does not exceed 10% of the mass of water.
Many scholars have carried out a series of research work on pipe jacking slurry. Stein (1989) summarized the friction coefficient between the pipe and the soil in pipe jacking engineering under different stratum conditions, and believed that under the condition of grouting, the friction coefficient between the pipe and soil was in the range of 0.1~0.3 [
6]. Jeffferis and Grouts (1992) believed that the ideal drag reduction effect can be achieved only when the slurry is wrapped on the outer pipe wall and the pipe is under the action of buoyancy [
7]. Zhou et al. (2009) studied the influence of slurry injection on the jacking force and land subsidence during jacking in the silt stratum through a model test. The test showed that traditional thixotropic slurry has a better drag reduction effect and HL compound slurry is better suited to controlling subsidence [
8]. Zhang et al. (2016) optimized lubrication slurry with PAC-HV (polyanionic cellulose high viscosity) as a treatment agent using the orthogonal test for the curved pipe jacking pipe roof project in the Gongbei tunnel [
9]. Wang et al. (2018) found that highly viscous bentonite slurry mixed with polymer is more suitable for the lubrication of long-distance steel jacking by comparing the drag reduction effect and grouting amount with traditional bentonite slurry [
10]. Chen et al. (2019) studied the influence of bentonite, caustic soda, sodium carboxymethyl cellulose, and hydrolyzed polyacrylamide on the performance parameters of drag reduction slurry, and proposed a formula for drag reduction slurry that is suitable for large-section rectangular pipe jacking [
11].
Laboratory tests are a common method used to study the friction characteristics of the pipe–soil interface and calculate the friction coefficient of the interface. Shou et al. (2010) studied the friction characteristics of different kinds of lubricants using a simple laboratory test. The test showed that when “bentonite” is used as the lubricant, the friction coefficient of the interface is reduced by about 23%; and when “bentonite + plasticizer” is used as the lubricant, the friction coefficient of the interface is reduced by about 63% [
12]. Namli and Guler (2016) studied the influence of the slurry pressure on the lubricating effect using a laboratory test. The test results showed that when bentonite slurry is continuously injected, even under very low pressure, a lubrication interface is formed between the slurry and the pipe, and the friction coefficient of the interface is reduced by almost 90% [
13]. Li et al. (2019) tested the friction coefficient between sandstone and a concrete pipe under seven different contact conditions using the direct shear test. The test showed that the friction coefficient of the pipe–soil under the contact condition of pure bentonite slurry is the smallest [
14]. Feng et al. (2022) performed a direct shear test to study the friction characteristics of seven kinds of soil and concrete pipes with or without lubrication slurry. The results showed that under slurry-lubricated conditions, the friction coefficient of the concrete–sand interface could be reduced by 60~80%, and the friction coefficient of the concrete–silty clay interface and the concrete–clay interface could be reduced by about 90% [
15].
In summary, the existing research has mainly focused on the friction coefficient of the pipe–soil interface under different contact conditions, drag reduction slurry formula, and traditional performance parameters. Less research has focused on high-concentration bentonite slurry and the addition of a treatment agent to achieve an improvement, especially regarding the influence of the slurry concentration and standing time on the friction characteristics of the pipe–soil interface. However, research on the mechanical characteristic of the interface has mainly concentrated on geotechnical engineering, such as pile foundations, retaining walls, and the soil behind the wall. The influence law of different normal loads, mud skin moisture contents, and mud skin thicknesses on the mechanical properties of soil and the structural surface have mainly been studied through direct shear and single shear tests [
16,
17,
18,
19,
20].
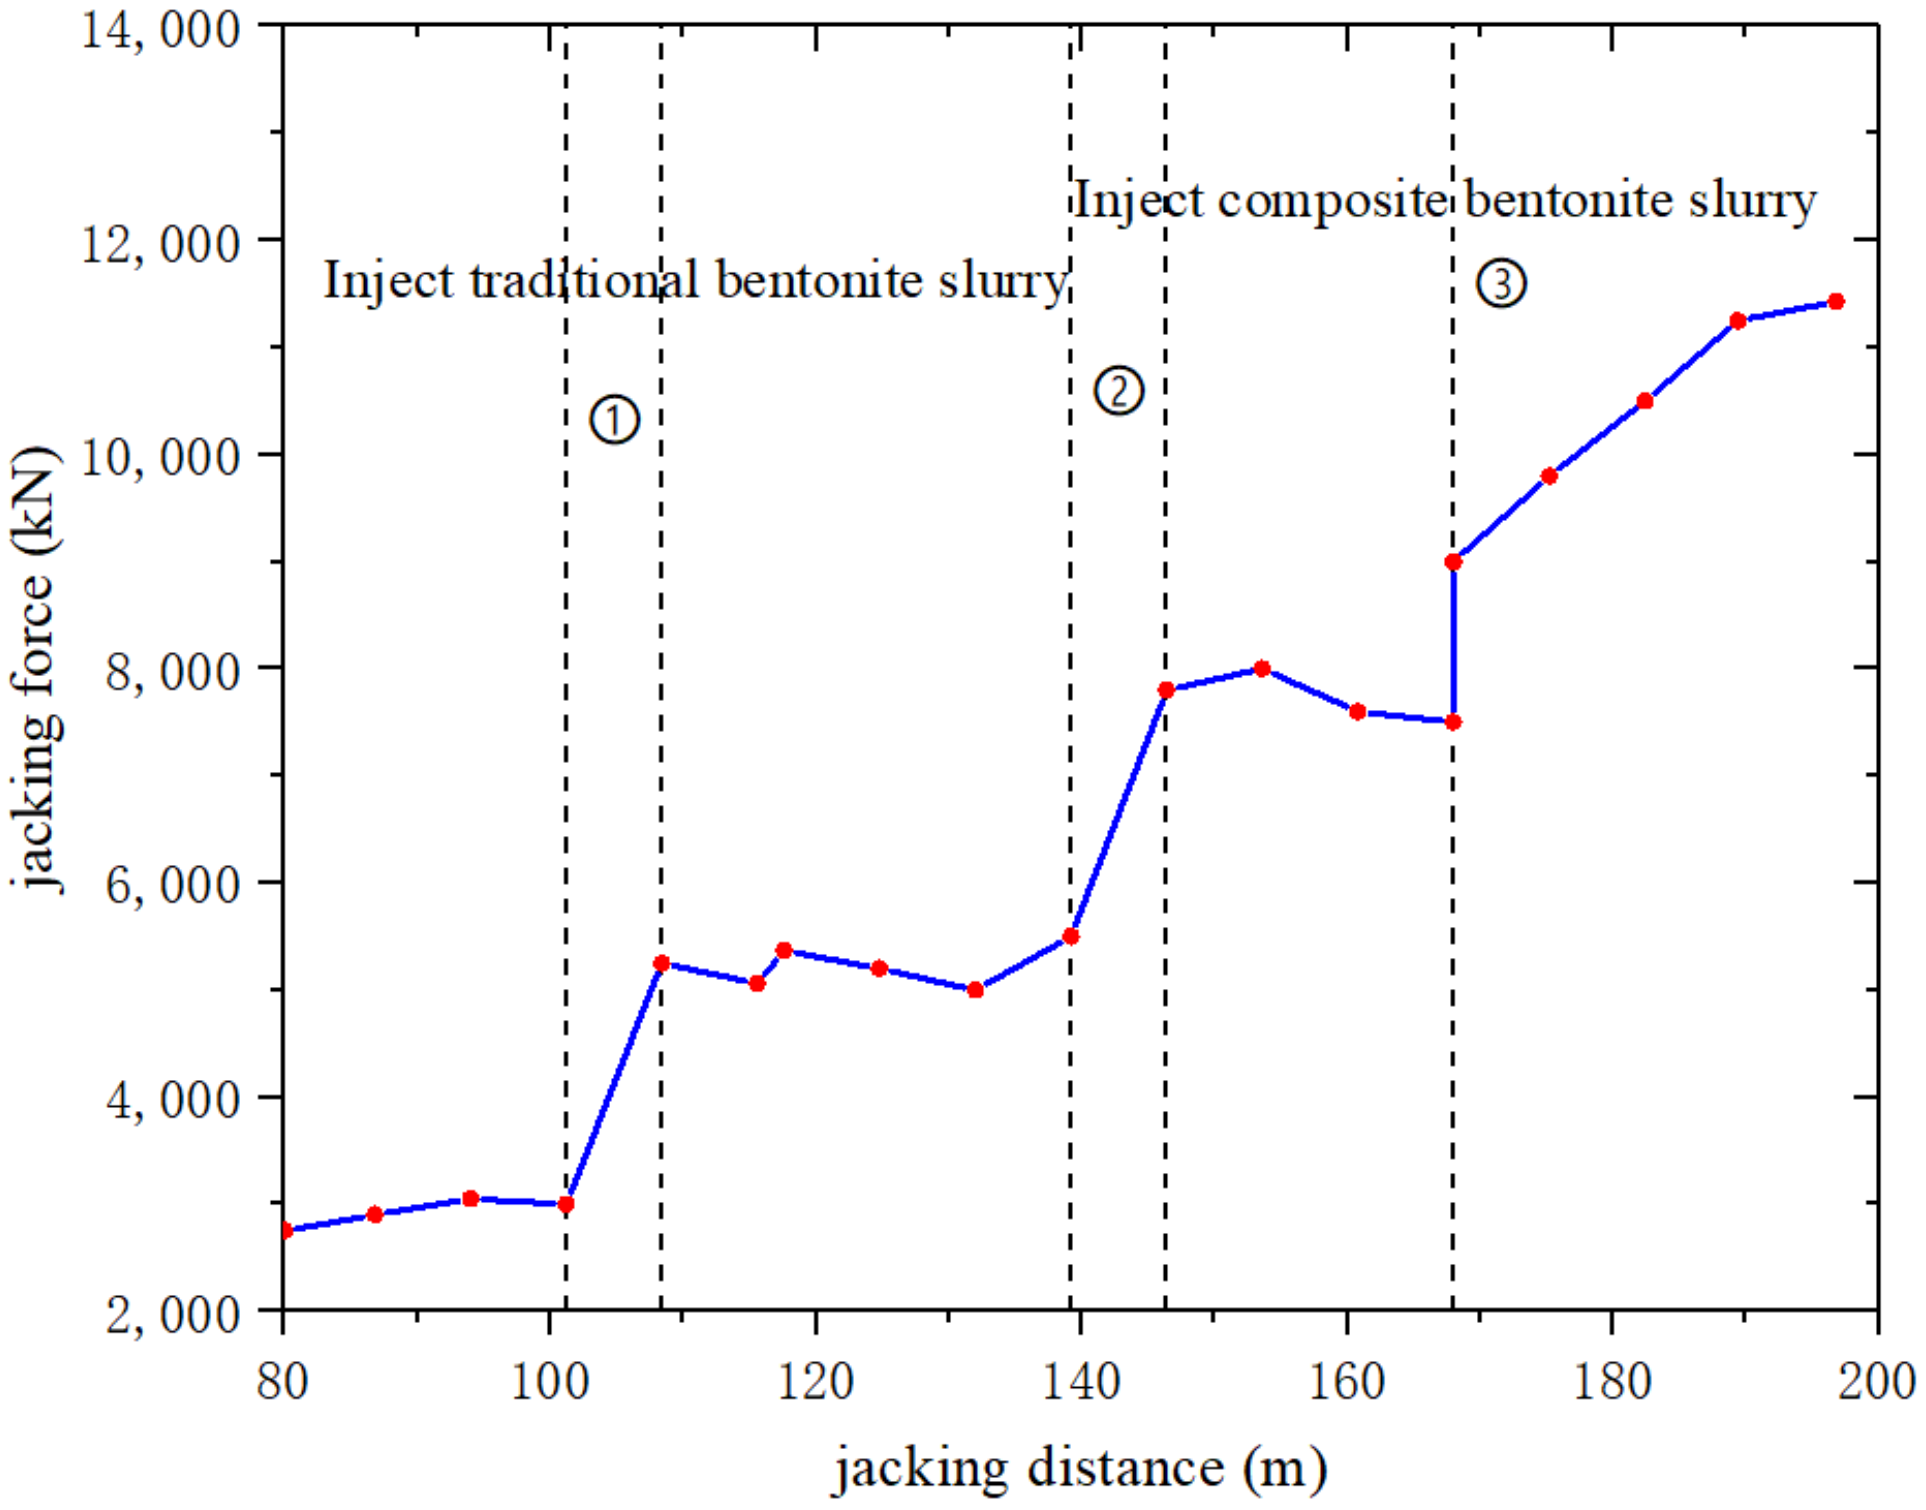
However, during downgrade jacking of a curved pipe in a water resources transportation project, due to the good fluidity and low viscosity of the traditional slurry, the slurry flows into the tunnel boring machine. In the front pipe, under the action of gravity, and the suction effect of the slag discharge pump of the machine, the slurry is then pumped into the slag discharge pipe, which cannot form a dense mud cake around the pipe wall, resulting in a poor lubrication effect. As such, the compound bentonite is used to prepare a liquid drag reduction slurry and “concentrated slurry” on site. The “concentrated slurry” is injected into the outer pipe wall of two pipes behind the tunnel boring machine, and the liquid drag reduction slurry is injected into the outer pipe wall of a subsequent pipe to alleviate the flow of traditional bentonite slurry into the tunnel boring machine due to gravity to achieve a better drag reduction effect. After the above grouting method is adopted, although the flow of liquid slurry into the tunnel boring machine is effectively alleviated, the jacking force surges in the normal jacking stage and rejacking stage. The jacking force curve is shown in
Figure 1. The above problems may be due to unreasonable control of the slurry concentration during slurry configuration and the long interval of the rejacking construction.
Therefore, this study carried out indoor direct shear tests to deeply study the influence of the compound bentonite slurry on the friction characteristics of the pipe–soil interface from two aspects: the slurry concentration (the mass ratio of the compound bentonite to water, “ω”) and the slurry standing time. By analyzing the test data and phenomena, combined with the physical properties of the slurry, the influencing mechanisms of the concentration and standing time on the friction characteristics of the interface were revealed.
3. Test Result
3.1. Influence of the Slurry Concentration on the Friction Characteristics of the Interface
The normal load has no effect on the variation trend of the shear stress (“
τ”)–shear displacement (“
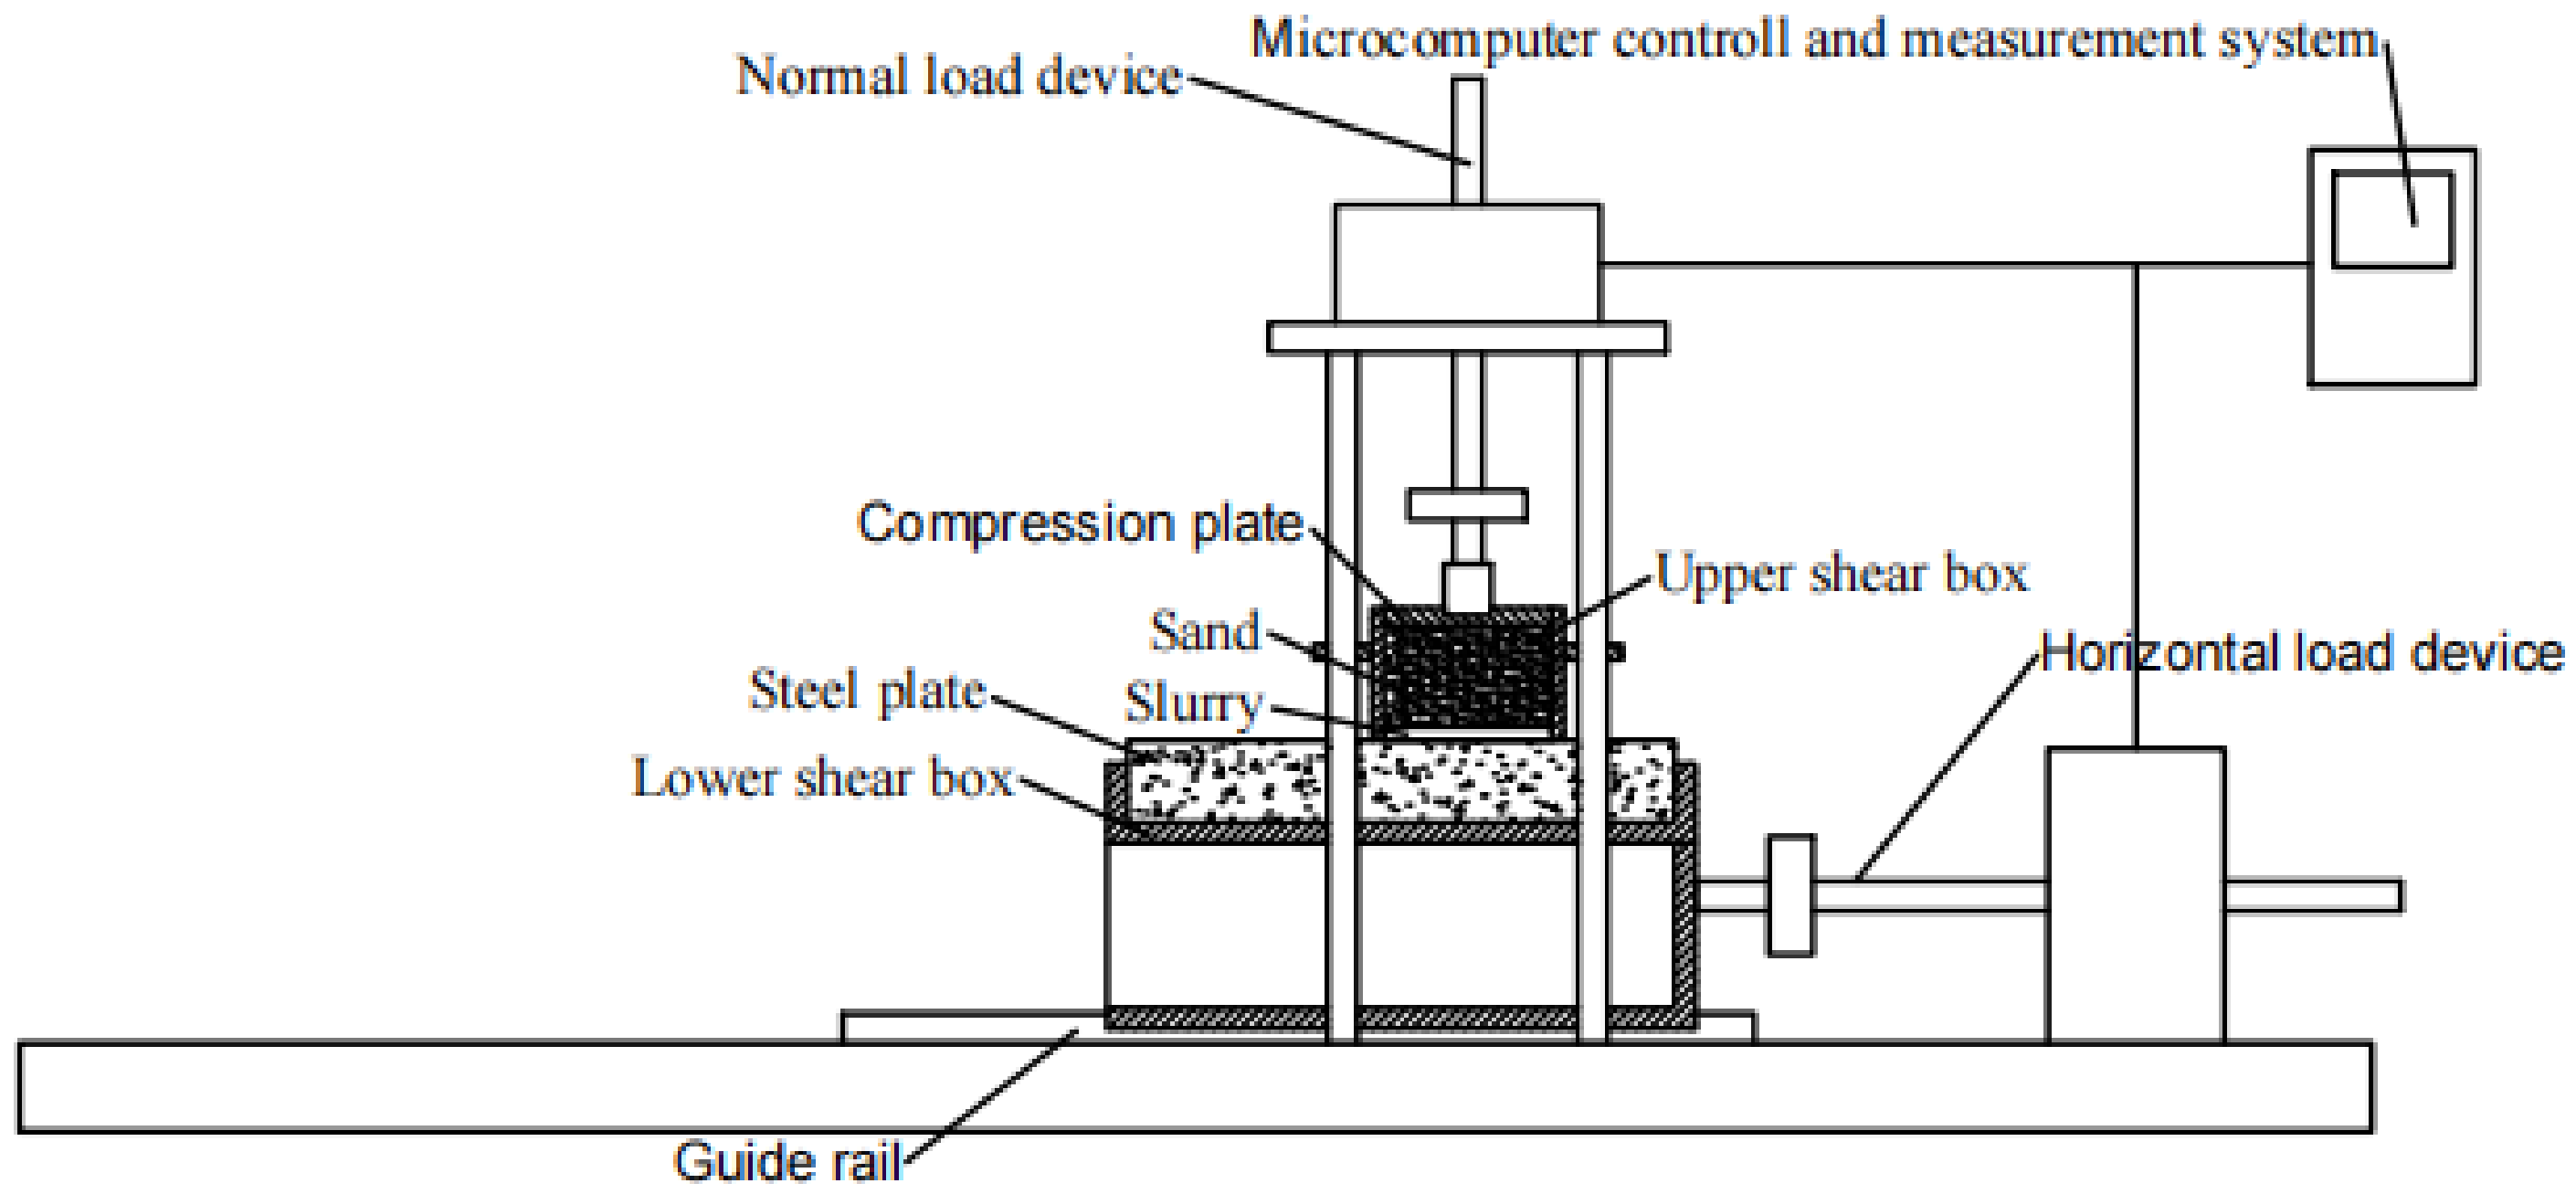
s”) curve of the interface and the friction coefficient of the interface, but only for the value of the shear stress of the interface. Therefore, taking the normal load of 100 kPa as an example, the variation trend of the shear stress–shear displacement curve of the pipe–soil interface under the normal load was analyzed (to facilitate the analysis of the friction characteristics of the interface, the pipe–soil interface without slurry was recorded as “interface I”, and the pipe–soil interface with slurry was recorded as “interface II”), and the curve is shown in
Figure 5. The following test results are shown in
Figure 5.
The peak value and stable value of the “τ–s” curve of “interface I” were greater than those of the “interface II” curve. This shows that the slurry reduced the shear stress on the interface between the pipe and soil, which means that the slurry reduced the friction when the pipe wall slid relative to the sand, and the slurry had a lubrication effect.
The “τ–s” curve of “interface I” had an obvious peak value. When the shear displacement continued to increase, the shear stress of the interface gradually declined and tended to a constant value, and the curve showed obvious strain softening characteristics. This occurred as the compacted sand particles were closely arranged, and the sand particles underwent physical changes, such as tumbling and dislocation, during the shear process, resulting in relative rolling between the particles. With the continuous shear, the particle positions were rearranged.
The “
τ–s” curve of “interface II” also showed that was a strain softening type. This was because the slurry is thixotropic, which under the action of shear, caused the viscosity and static shear stress of the slurry to decrease while after standing, the viscosity and static shear stress increased. Under the action of slurry thixotropy, when the pipe wall and sand slid relatively, the shear stress on the interface rose rapidly and reached the peak value. With the further development of shear, the viscosity and static shear stress of the slurry under shear declined. At this time, the shear stress decreased from the peak value and tended to a stable value [
21].
3.1.1. Concentration Less Than or Equal to 20%
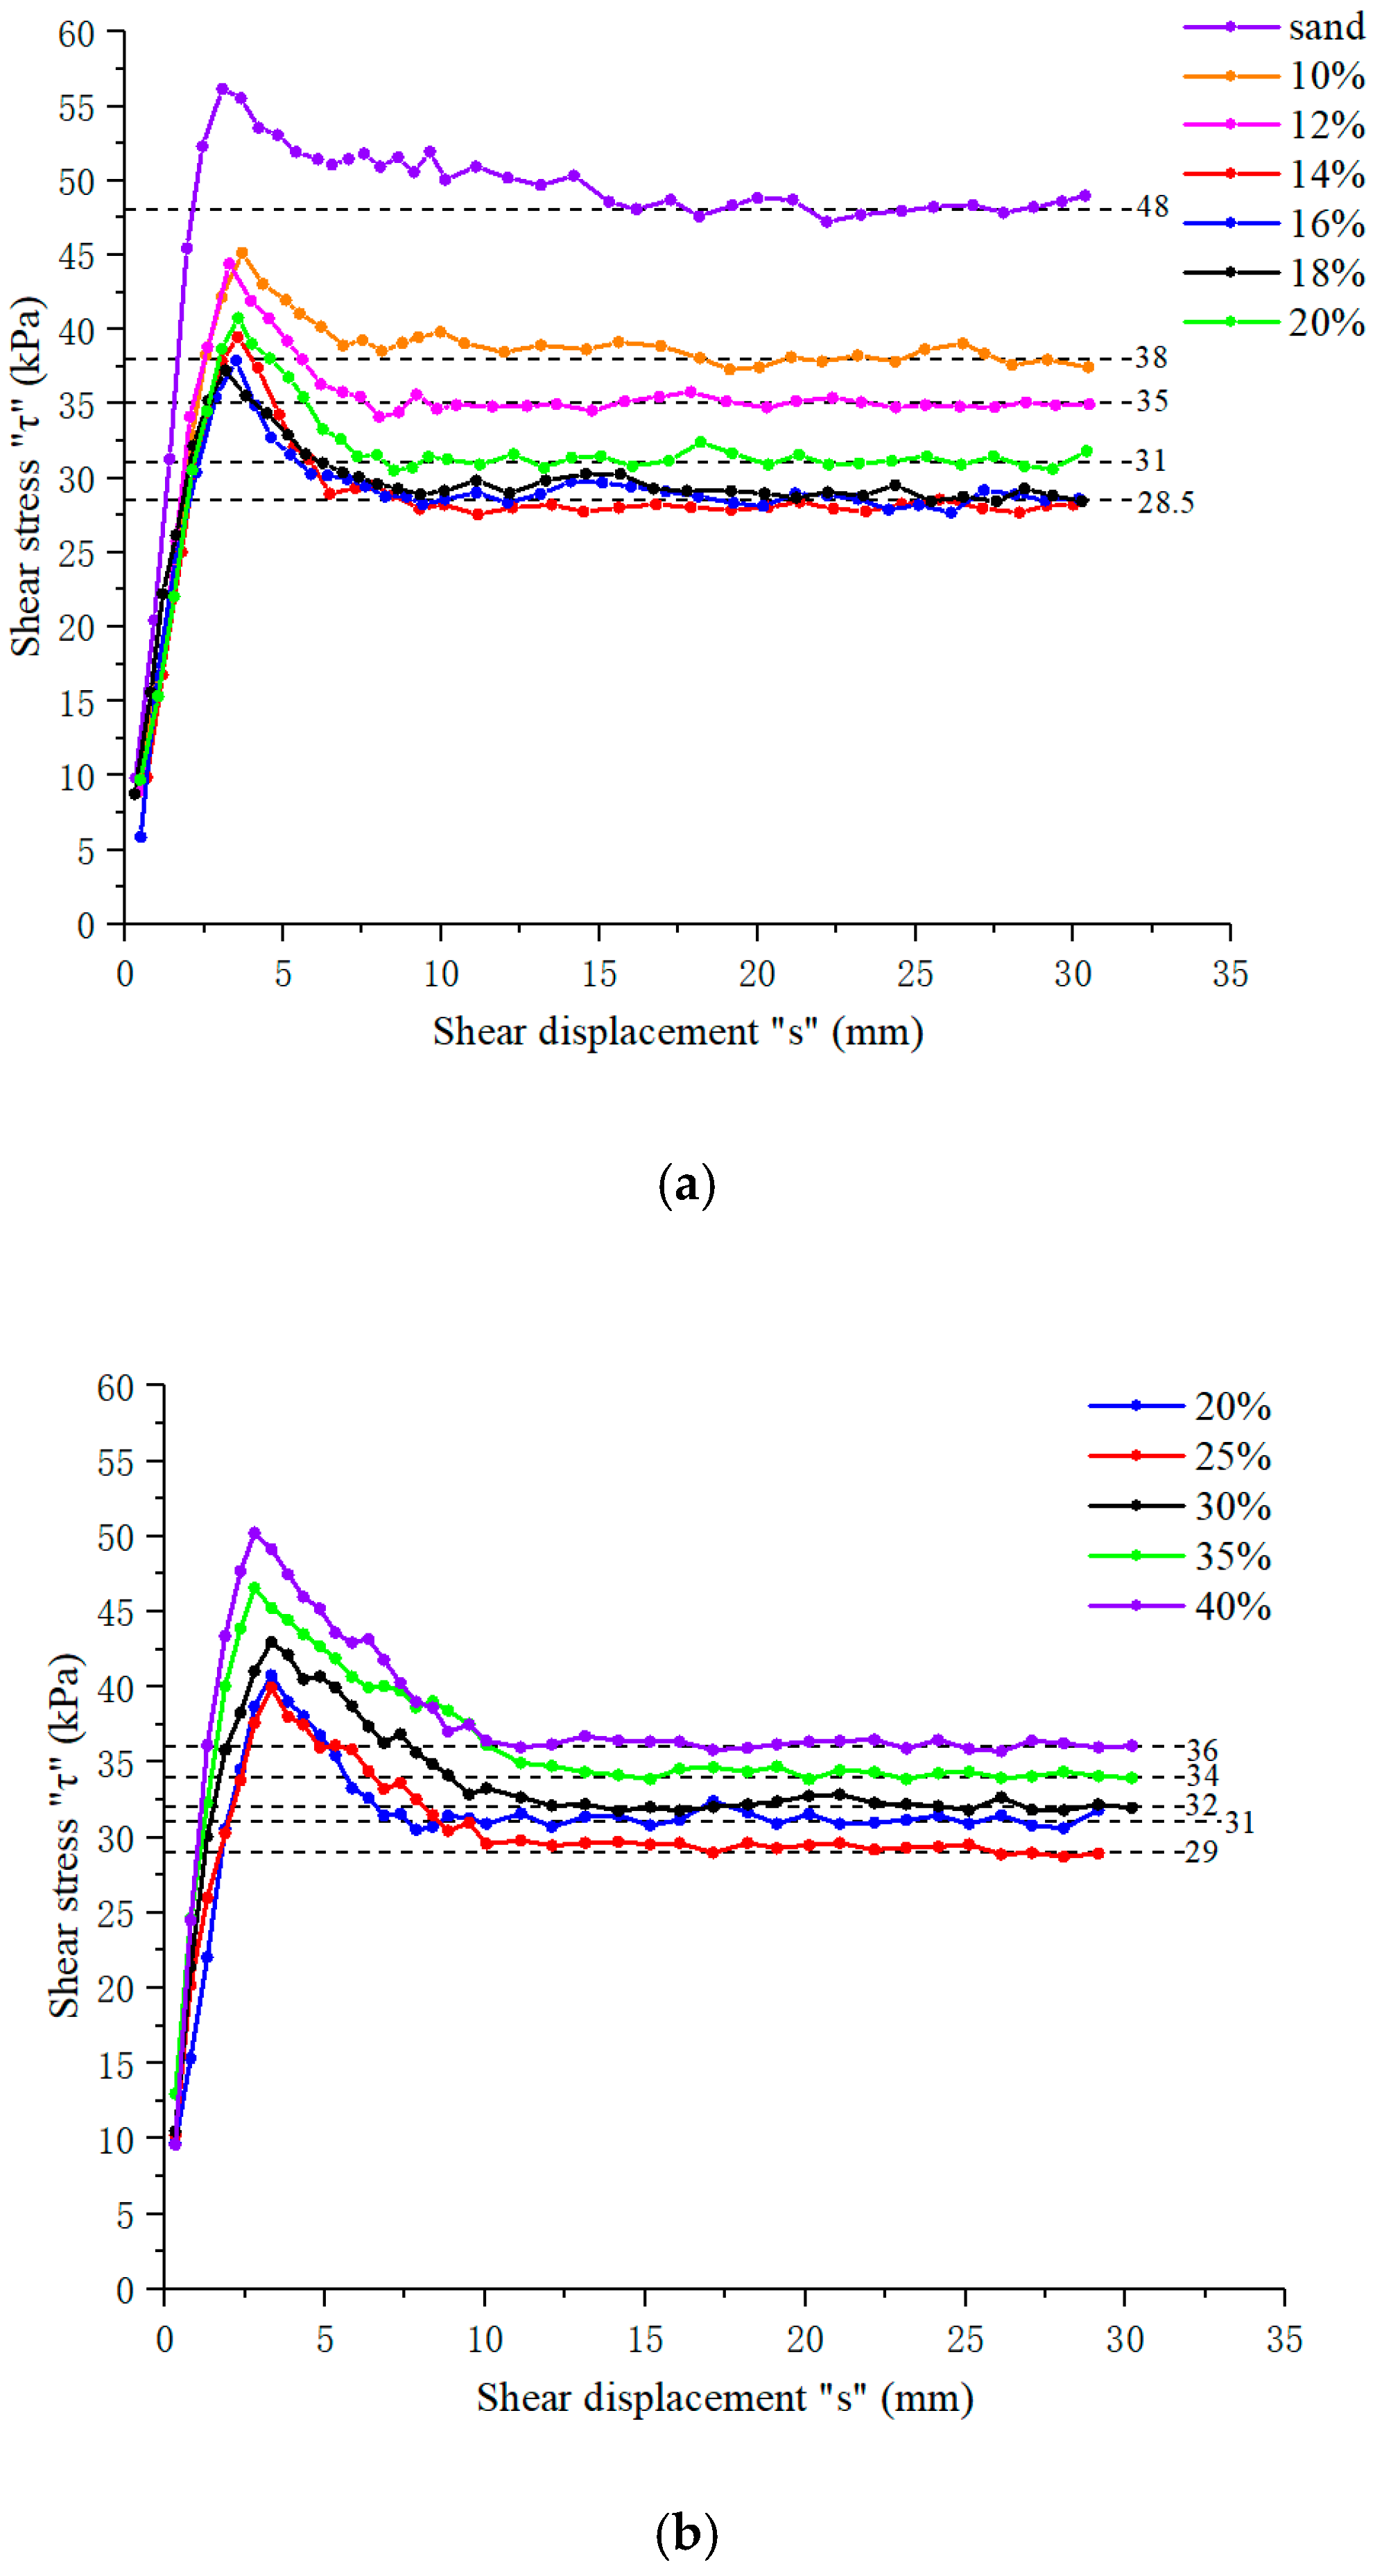
The test data listed in
Table 2 show that the peak shear stress (“
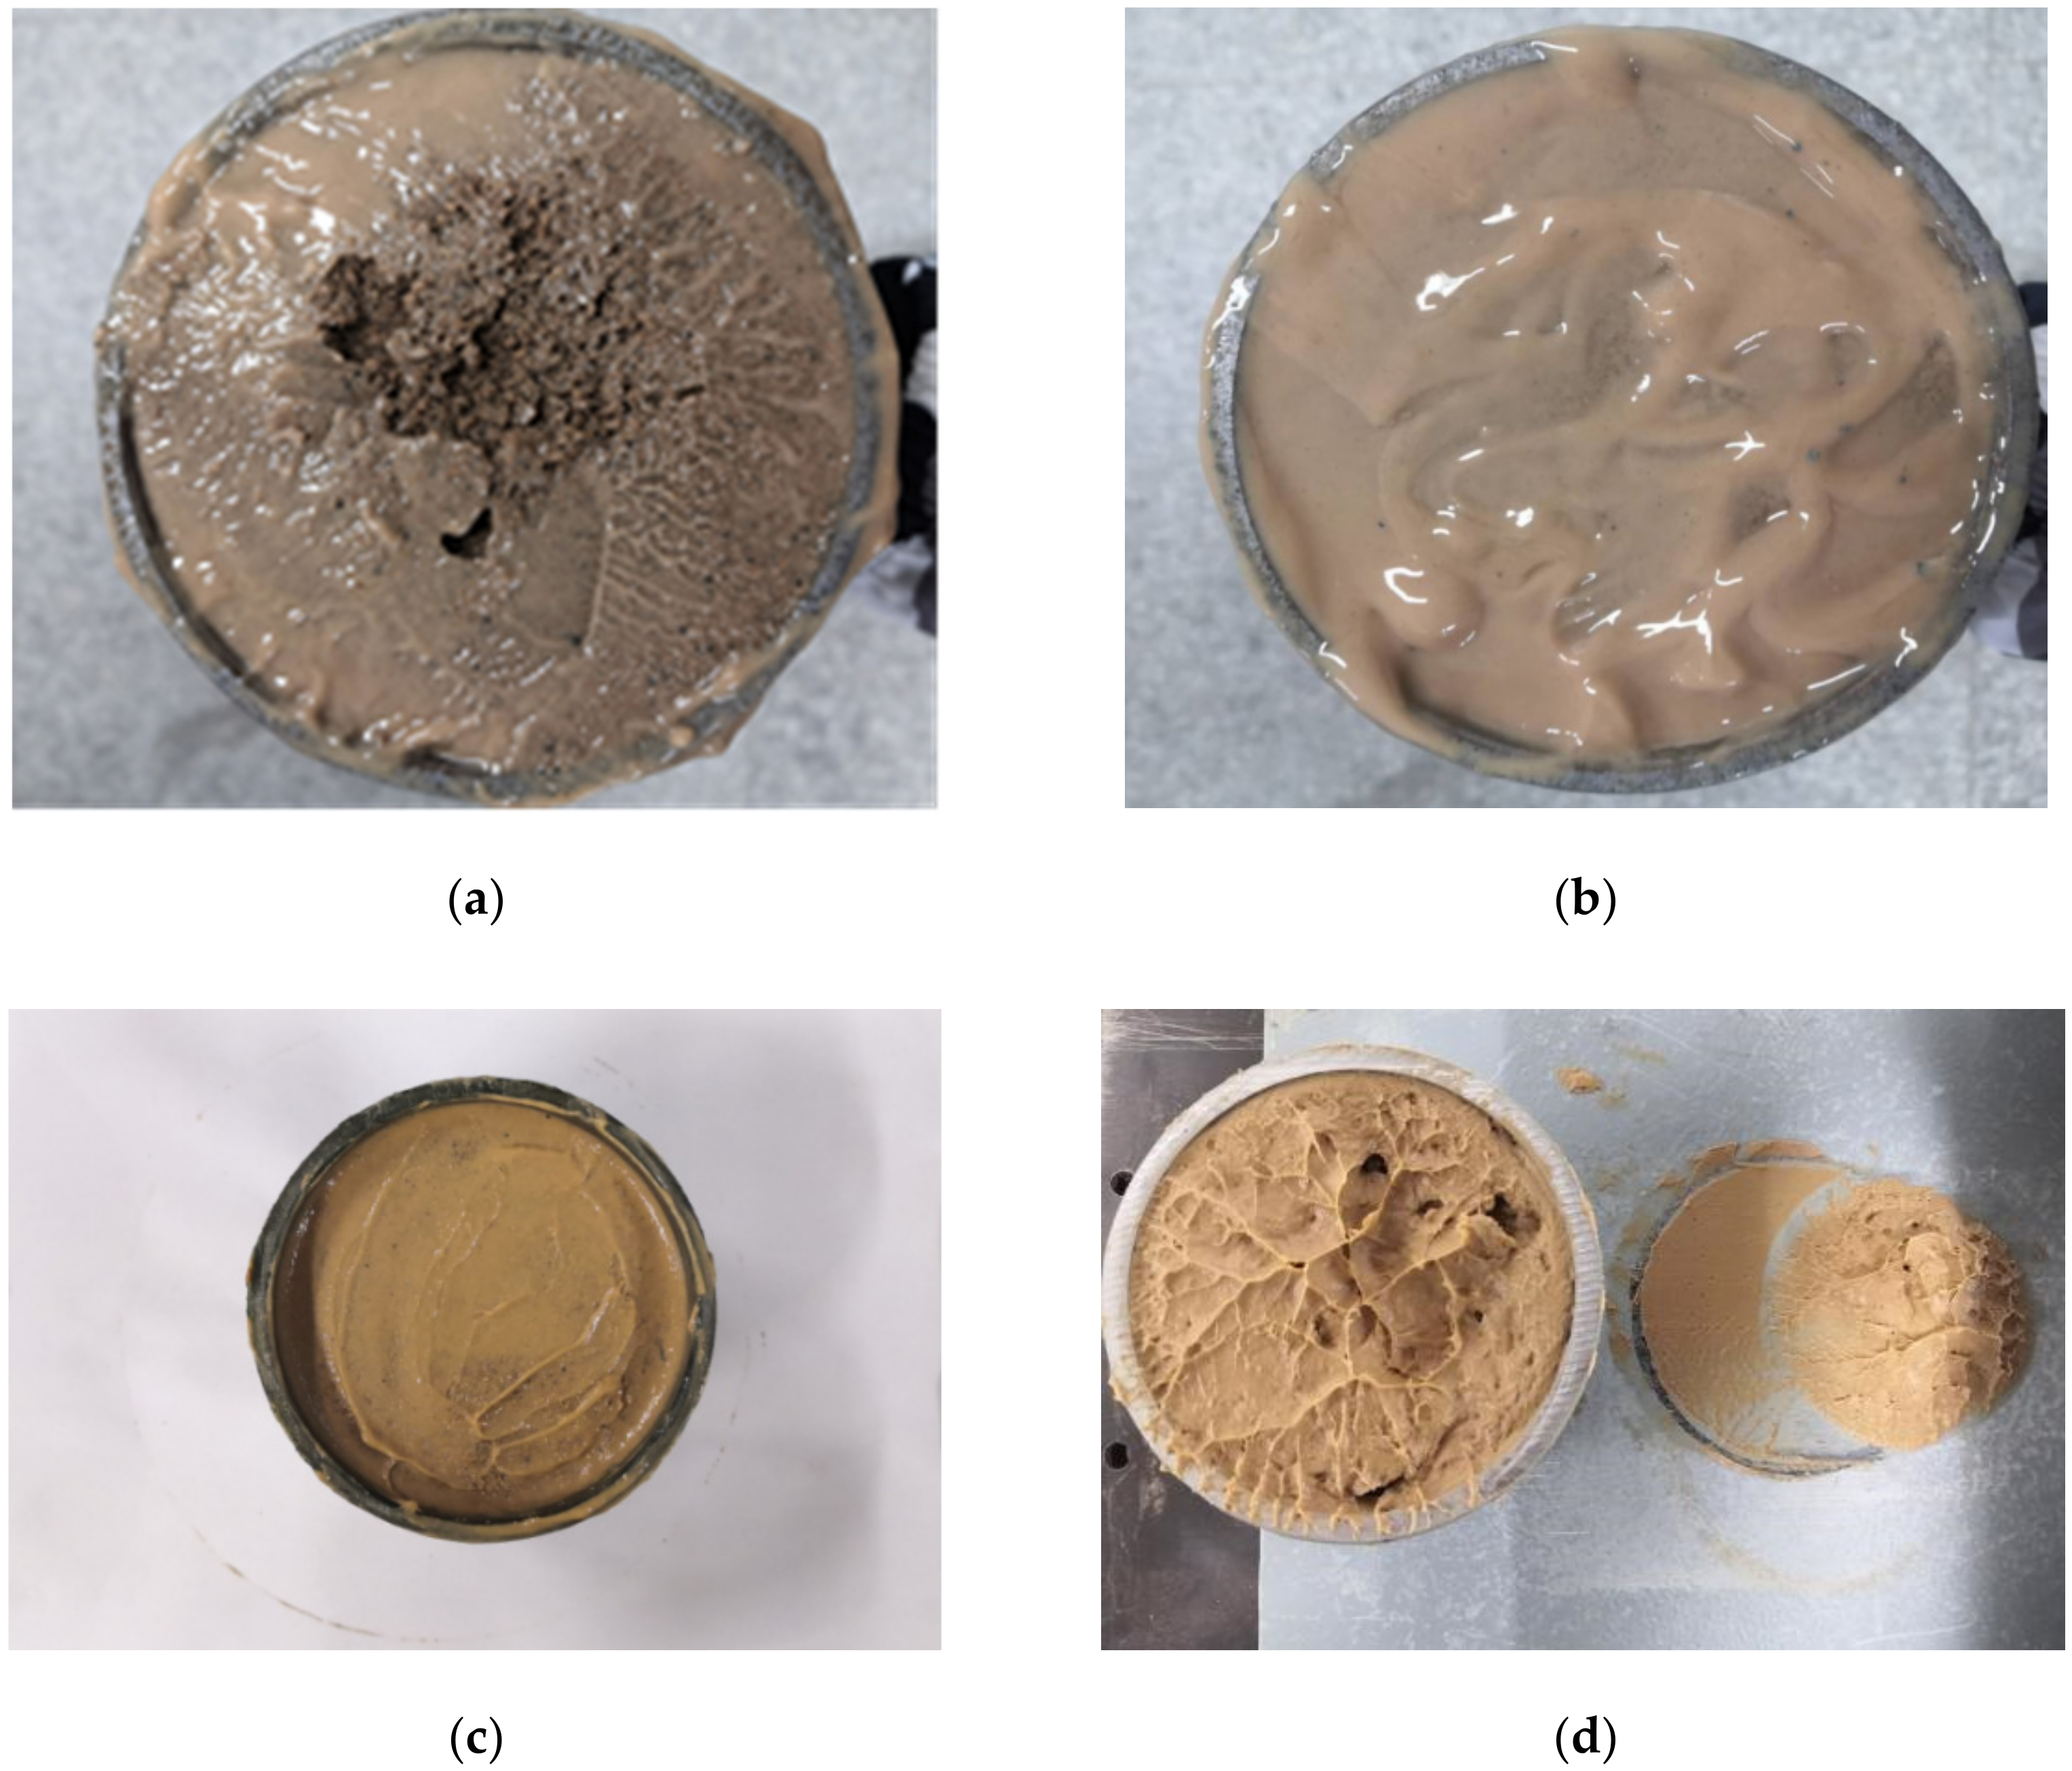
τmax”) first decreased and then increased with the increase in the concentration, which is less than or equal to 20%. This was because the slurry with a concentration less than or equal to 12% did not support the soil well, resulting in contact between the slurry soil mixture and the pipe wall during shearing, and the occurrence of shear failure between the slurry soil mixture and the pipe wall (as shown in
Figure 6a). With the increase in the slurry concentration, the contact degree between the sand and pipe wall was reduced and the supporting effect of the soil improved. The shear failure occurred between the pipe wall and slurry (as shown in
Figure 6b,c), and the shear stress required to produce relative sliding decreased, so
τmaxω=10% >
τmaxω=12% >
τmaxω=14% >
τmaxω=16% >
τmaxω=18%. However, with the increase in the concentration, the viscosity of the slurry increased and the degree of adhesion to the pipe wall increased, so
τmaxω=20% >
τmaxω=16% >
τmaxω=18%.
The friction coefficient (“μ”) first decreased and then increased with the increase in the concentration, which is less than or equal to 20%. This occurred because the lower-concentration slurry did not support the soil and did not have a good lubrication effect. With the increase in the slurry concentration, the “barrier-lubrication” effect of the slurry improved, so μω=14% < μω=12% < μω=10%. However, the further increase in the slurry concentration increased the viscosity of the slurry and reduced its lubricity. Therefore, for slurry to have a good lubrication effect, it must have a good supporting role.
3.1.2. Concentration Greater Than 20%
Table 2 shows that the peak shear stress and friction coefficient increased with the increase in the concentration, which is greater than 20%. This is occurred because the slurry with a concentration greater than 20% was semi-solid, its “support-barrier” soil effect was remarkable, and the adhesion degree with the pipe wall was greatly improved. When the sand slid relative to the pipe wall, shear failure occurred in the slurry interior (as shown in
Figure 6d). Therefore, when the pipe soil slid relatively, it had to overcome the spatial structure strength of the slurry, which is the gel strength. With the further development of shear, the relative sliding of the pipe soil was subjected to the cohesion of particles in the slurry, which is internal friction. As the gel strength (or static shear stress) of the slurry increased with the increase in the solid particle content, and the internal friction increased with the increase in the solid particle content, the greater the slurry concentration, the greater the peak shear stress and friction coefficient.
After comparing the test data of the slurry with a concentration of 20% and 25%, it was found that μω=25% < μω=20% τmaxω=25% < τmaxω=20%. This is because shear failure of the former occurred between the pipe wall and the slurry while the shear failure of the latter occurred in the slurry interior, and the slurry with a concentration equal to 25% slurry had a lower solid particle content than the other higher-concentration slurry, so the lubricity was better.
In summary, the concentration has a critical value, which is 20%. When the concentration does not exceed the critical concentration, the slurry state is liquid; otherwise, it is semi-solid. Liquid slurry is mainly used for lubrication, and semi-solid slurry is mainly used to support soil. Different concentrations of slurry have different effects on the peak shear stress and friction coefficient of the pipe–soil interface. For liquid slurry, the peak shear stress of the interface depends on the structural shear strength of the interface, and the friction coefficient depends on the degree of friction between the slurry and the pipe wall. For semi-solid slurry, the peak shear stress depends on the spatial structure strength of the slurry, which is the static shear stress, and the friction coefficient depends on the internal friction of the slurry.
3.2. Influence of the Standing Time on the Friction Characteristics of the Interface
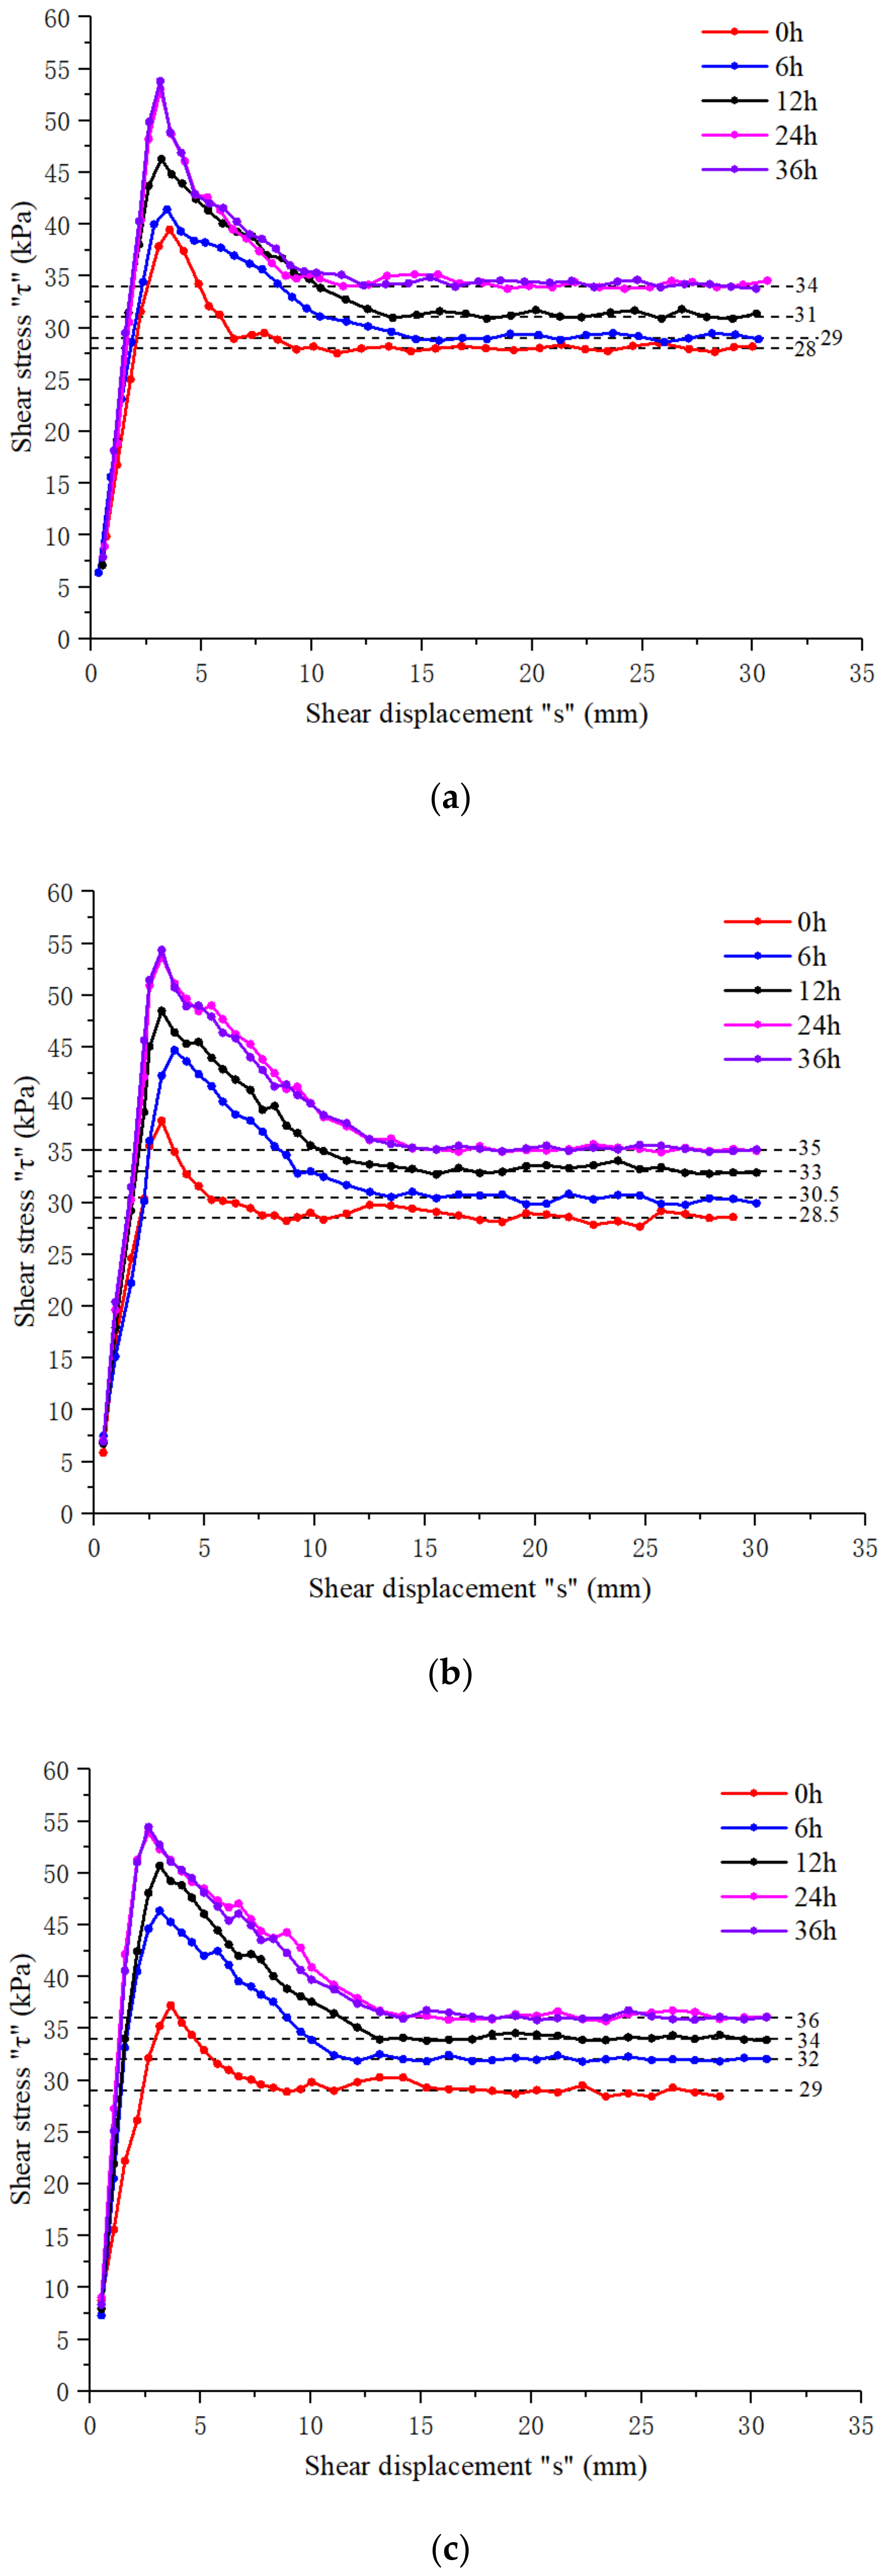
By analyzing the test data of the last stage and considering the slurry performance parameters, 3 groups of slurries with an improved lubrication performance of 14%, 16%, and 18% were selected for the test of this stage.
As shown in
Figure 7, the standing time had little effect on the “
τ–s” curve of the interface, and the curve was still the strain softening type. Under the same concentration condition, the “
τ–s” curve of the interface of the slurry standing times of 24 and 36 h approximately coincided. According to the data shown in
Table 3, under the same concentration, the peak shear stress and friction coefficient increased first and then stabilized with the increase in the slurry standing time.
The reason for this change trend was that, on the one hand, the slurry is thixotropic. After standing for a period of time, the viscosity and static shear stress of the slurry increased. For the slurry with a concentration range of 14~18%, shear failure occurred between the pipe wall and slurry. With the further development of shear, part of the slurry damaged by shear overflowed from the upper shear box. The other part was mixed with the slurry that was not damaged by shear and continued to contact with the pipe wall and produce shear. When the shear rate was smaller and the shear displacement was limited, the peak shear stress and friction coefficient increased with time. On the other hand, the thixotropy of the slurry is related to the type and content of the solid particles and whether treatment agent is added. When the contents of bentonite and treatment agent are certain, the viscosity and static shear stress of the slurry will not increase indefinitely with time [
21], so the peak shear stress and friction coefficient will tend to be stable.
Under the same standing time, the friction coefficient increased with the increase in the concentration. This occurred because the slurry with a concentration range of 14~18% had a better “barrier-lubrication” effect, and its lubricity decreased with the increase in the concentration. However, when the standing time was greater than or equal to 6 h, the peak shear stress increased with the increase in the concentration, which is the opposite to what occurred when the standing time was 0 h. This occurred because after the slurry had stood for a period of time, its solid particles were overlapped with each other and formed a network structure, which made the slurry flocculate into colloid, and its viscosity and shear stress increased, which had a significant role in supporting the soil. At this time, the increase in the concentration increased the adhesion between the slurry and the pipe wall, resulting in the increase in the peak shear stress.
After comparing the data in
Table 4, it can be seen that under the same standing time, the peak shear stress and friction coefficient of the pipe–soil interface with higher concentrations of slurry increased greatly. However, with the increase in the standing time, the amplification gap of the peak shear stress and friction coefficient on the interface with different concentrations of slurry gradually declined.
4. Discussion
Considering that the time interval of normal re-jacking on site generally does not exceed 6 h, by comparing the data in
Table 4, it was found that the amplification of the peak shear stress and friction coefficient of the interface with a slurry concentration equal to 18% was the greatest. However, excessive amplification of the friction coefficient and peak value of the shear stress will lead to a significant increase in the jacking force required for re-jacking, which is highly likely to lead to surging of the jacking force and increase the difficulty of re-jacking. Combined with the influence law of the concentration and standing time on the friction characteristics of the pipe–soil interface, the slurry with a concentration range of 14~16% showed a better lubrication effect and was less affected by the standing time.
According to the test data, the friction coefficient of the pipe–soil interface first decreased and then increased with the increase in the slurry concentration. This is because when the slurry concentration was less than or equal to 12%, the slurry did not support the soil well, resulting in contact between the slurry soil mixture and the pipe wall during shearing, and the friction coefficient of the interface was larger. When the slurry concentration increased, the “barrier-lubrication” effect of the slurry was improved, so the interface friction coefficient decreased. With the further increase in the slurry concentration, the adhesion between the slurry and pipe wall increased, so the friction coefficient increased. Within a certain standing time range, the interface friction coefficient increased with the increase in the standing time. This is because slurry is thixotropic. The standing time changes the state of the slurry, changing the slurry from a flowing state to a flocculation state. The viscosity of the slurry increases and the adhesion degree with the pipe wall increases, so the friction coefficient also increases. This is also almost consistent with Li’s conclusion regarding the influence of the pipe jacking stagnation time on the pipe–soil interface [
22].
Staheli (2006) proposed an equation to calculate the jacking force as follows [
23]:
where
JFfrict is the frictional component of the jacking force,
μint is the soil pipe residual interface frictional coefficient,
γ is the unit weight of the soil,
ϕr is the residual friction angle of the soil,
d is the outer diameter of the pipe,
r is the pipe radius, and
l is the length of the pipe.
According to the above formula, the frictional component of the jacking force is mainly related to the friction coefficient of the interface. The factors of the slurry concentration and slurry standing time studied in this paper have a significant effect on the friction coefficient of the interface, thus affecting the jacking force. Therefore, in future engineering practice, experiments should be carried out to study the effects of the slurry concentration and standing time on the friction characteristics of the pipe–soil interface, and to test the friction coefficient of the interface under the conditions of different slurry concentrations and standing times. This will provide an important basis for the calculation of the jacking force and provide guiding significance for the configuration of drag reduction slurry in engineering practice.
5. Conclusions
In this study, through the indoor direct shear test, the influence law of the slurry concentration and standing time on the friction characteristics of the pipe–soil interface was explored, and the following five conclusions were obtained.
The concentration changes the location of shear failure. When the concentration is greater than or equal to 25%, the shear failure occurs in the slurry interior; when the concentration is less than or equal to 12%, the shear failure occurs between the slurry soil mixture and the pipe wall; and when the concentration is more than 12% and less than 25%, the shear failure occurs between the pipe wall and the slurry.
Different concentrations of slurry have different effects on the peak shear stress and friction coefficient of the pipe–soil interface. For the pipe–soil interface with a slurry concentration of less than or equal to 20%, the peak shear stress depends on the structural shear strength of the interface, and the friction coefficient depends on the degree of friction between the slurry and the pipe wall. For the pipe–soil interface with a slurry concentration greater than 20%, the peak shear stress depends on the gel strength of the slurry, which is the static shear stress, and the friction coefficient depends on the internal friction of the slurry.
When the concentration is less than or equal to 20%, the peak shear stress and friction coefficient first decrease and then increase with the increase in the concentration. When the concentration is more than 20%, the peak shear stress and friction coefficient increase with the increase in the concentration.
When the concentration is unchanged, within a certain standing time range, the peak shear stress and friction coefficient of the interface increase with the increase in the standing time, and then are unchanged. When the standing time is greater than or equal to 6 h, the peak shear stress and friction coefficient increase with the increase in the concentration. Under the same standing time, the amplification of the peak shear stress and friction coefficient of the interface with different slurry concentrations increase with the increase in the concentration.
Unreasonable control of the slurry concentration and long standing times will increase the risk of the jacking force surging and adversely affect pipe jacking construction. Slurry with a concentration range of 14~16% has a better lubrication effect and is less affected by the standing time. Although the friction coefficient of the pipe–soil interface of the slurry within this concentration range belongs to the range of 0.1~0.3, the friction coefficient is slightly larger. Therefore, it is suggested that the slurry concentration should be within 16% and lubricants, such as polyacrylamide and graphite powder, should be added to further reduce the friction coefficient of the pipe–soil interface.


