1. Introduction
Due to the rapid development of technology and industry, it is found that many organic pollutants (dyes, drugs, pesticides, etc.) in natural water have gradually increased and will affect the ecosystem for a long time [
1]. Acid Red 73 (AR73) is an azo dye with a good dyeing effect and low price and is widely used in the dyeing of leather, plastics and wool fabrics. However, Acid Red 73 is toxic, and the waste liquid discharged in the dyeing process will lead to environmental pollution and harm to human beings. Therefore, the degradation of Acid Red 73 in the discharged wastewater is particularly important. For example, solar energy has the characteristics of environmental protection. Utilizing solar energy efficiently is one of the hotspots of scientific research. Because solar energy is difficult to use, the research can only focus on solar conversion. In 1972, A. Fujishima and K. Honda first proposed the photocatalytic phenomenon. A crystalline TiO
2 electrode and a Pt electrode were placed in water. It was found that the whole circuit would produce photocurrent under light, and the water was successfully cracked into H
2 and O
2 [
2]. In 1976, Craey et al. reported the photocatalytic degradation of polychlorinated biphenyls and haloalkanes by TiO
2 as a photocatalyst [
3]. In 1983, Purden et al. published research on the degradation of trichloroethylene by TiO
2. A series of research results showed that the TiO
2 semiconductor catalyst had a strong degradation ability for a variety of organic pollutants, which opened a new direction for the application of semiconductor catalytic materials in environmental protection research [
4]. An effective pollution control method is the semiconductor photocatalytic degradation of pollutants in water. Common photocatalysts include C
3N
4 [
5], TiO
2 [
1] and SiC [
6]. TiO
2 has the characteristics of good chemical stability, strong oxidation and high photocatalytic activity, but the particles of TiO
2 are small and cannot precipitate rapidly in solution, which will cause problems such as difficult recovery and secondary pollution. As a typical magnetic material, Fe
3O
4 has become the most popular magnetic carrier material due to its excellent magnetism and simple preparation process. The photocatalyst can be separated and recovered by a magnetic field by loading magnetic materials on TiO
2. Recyclable Fe
3O
4@TiO
2 composites can be prepared by the sol–gel method [
7]. Fe
3O
4@TiO
2 core–shell nanocomposites with rapid magnetic separation were prepared by the solvothermal method, and the photocatalytic performance was significantly enhanced [
8]. An Fe
3O
4@TiO
2 magnetic photocatalyst was prepared for photocatalytic degradation of bisphenol A under visible and long-wavelength UV light irradiation [
9]. Fe
3O
4/TiO
2 nanocomposites were prepared by precipitation method and sol–gel mixed method. The prepared nanocomposites have good optical properties and can be used for photocatalytic degradation of dyes [
10]. Compared with TiO
2, the prepared composites have higher photocatalytic performance and better reusability. The methods to improve the photocatalytic effect of TiO
2 mainly include increasing the exposure ratio of (001) high-energy facets [
11], composites [
12,
13] and doping [
14]. TiO
2 has three different crystal forms: rutile, plate titanium and anatase. For anatase-type TiO
2, the (001) high-energy facets have better photocatalytic performance than the (101) low-energy facets. It was found that there were physical and chemical adsorption and decomposition reactions between water molecules and (001) facets, but only physical adsorption on (101) facets. Since separated water can facilitate the transfer of photogenerated carriers and the formation of active free radicals, it may make (001) facets have a stronger redox effect than (101) facets, causing the (001) facets to exhibit higher photocatalytic activity [
15]. Many of the Fe
3O
4 and TiO
2 composites studied now are core–shell structures. When the outer surface of Fe
3O
4 powder is coated with a layer of TiO
2, it inhibits the transport of photoexcited electrons to a certain extent.
In this paper, the photocatalytic performance of TiO2 was improved by increasing the exposure ratio of (001) high-energy facets and compounding with Fe3O4 to change its band gap. HF was used as an inhibitor, which on the one hand destroyed the spherical structure of the previous Fe3O4 and on the other hand inhibited the growth of (101) surfaces. TiO2 and Fe3O4@TiO2 composite materials were prepared by the solvothermal method as photocatalysts. TiO2 and Fe3O4@TiO2 were characterized by X-ray diffraction spectroscopy, field emission scanning electron microscopy, ultraviolet–visible diffuse reflectance spectroscopy and Raman spectroscopy. Acid Red 73 (AR73) solution was used to simulate dye wastewater. The degradation ability of TiO2 and Fe3O4@TiO2 can be observed through the experiment of photocatalytic degradation of Acid Red 73. Fe3O4@TiO2 was recycled by magnetic recovery to degrade AR73. The photocatalytic degradation mechanism was studied.
2. Methods and Experiment Details
Tetrabutyl titanate AR 98%, polyethylene glycol-4000 AR, ferric chloride hexahydrate (FeCl
3·6H
2O) AR 99% and L-ascorbic acid 99.99% were purchased from Shanghai Macklin Biochemical Technology Co., Ltd. (Shanghai, China). Sodium hydroxide (NaOH) AR, hydrofluoric acid (HF) GR 40%, sodium acetate AR, ethylene glycol AR and absolute ethanol AR were obtained from Sinopharm Chemical Reagent Co., Ltd. (Shanghai, China). The test water was ultrapure water. The power of the high-pressure mercury lamp (GGZ300) was 300 W. The concentration of Acid Red 73 solution before and after the photocatalytic experiment was determined with a TU-1950 Beijing Puxi UV-VIS spectrophotometer at the maximum absorption wavelength of 508 nm. The morphology of all samples was characterized by a field emission scanning electron microscope (FESEM: JSM-7800, Tokyo, Japan) operated at 3 kV. The elemental analysis of samples was performed with an energy dispersive spectrometer (EDS). The Raman spectra were obtained using a Raman spectrometer, and the excitation source was a 532 nm Ar laser. The crystalline structure of all samples was characterized by X-ray diffraction (XRD: Empyrean, Panaco Netherlands, Cu-K
α radiation). The 2
θ scan range was 20 to 80°, the step length was 0.06 and the scan speed was 4°/min. The diffuse reflectance spectra (DRS) of all samples were measured using a ultraviolet–visible–near-infrared spectrophotometer (UV-VIS-NIR: Shimadzu Solid Spece-3700) equipped with an integrating sphere; the test wavelength range was 200–800 nm at room temperature, and barium sulfate was used as a reference. The DRS were converted to absorption coefficient F(R) by Kubelka–Munk function. The energy band gap (E
bg) of the samples was determined according to the Tauc method from the plot of (F(R)h𝜈)
1/2 versus h𝜈 [
1].
The preparation method of TiO
2 was the solvothermal method, with tetrabutyl titanate as the titanium source, HF as (101) surface inhibitor of the anatase phase and absolute ethanol as dispersant [
16]. Firstly, 80 mL ethanol and 3 mL HF were stirred magnetically for 10 min. After stirring evenly, 10 mL tetrabutyl titanate was slowly put into the solution and stirred for 30 min. Then the mixture was moved to a Teflon-lined autoclave. The reaction temperature was 180 °C, and the reaction time was 10 h. After the reactor was cooled, TiO
2 was washed alternately with absolute ethanol and 1% NaOH solution and finally washed with ultrapure water and filtered. Then, the white TiO
2 powder was put into a vacuum drying box; the drying temperature was 40 °C, and the drying time was 24 h.
The preparation method of Fe3O4 particles was as follows: Firstly, 80 mL ethylene glycol and 2.7 g FeCl3·6H2O were magnetically stirred for 30 min, and then 2 g polyethylene glycol-4000 was added into the above solution and stirred until the solution color was orange red. Finally, 7.2 g sodium acetate was added and stirred until the color of the solution was orange red, and then the solution was moved to the Teflon-lined autoclave. The reaction temperature was 200 °C, and the reaction time was 10 h. After the reaction, the black Fe3O4 powder was selected by magnetic separation, washed three times with absolute ethanol, and put into the vacuum drying box and dried at 40 °C.
The preparation process of Fe3O4@TiO2 particles was as follows: Firstly, 0.1 g of L-ascorbic acid and 0.25 g of Fe3O4 prepared nanoparticles were dispersed into 80 mL of ethanol; then, 10 mL tetrabutyl titanate and 3 mL HF were added successively and stirred until they become evenly dispersed, and the above solution was transferred to the Teflon-lined autoclave. The reaction temperature was 180 °C, and the reaction time was 10 h. After cooling, Fe3O4@TiO2 nanoparticles were washed alternately with absolute ethanol and 1% NaOH solution and magnetically separated.
In order to study the photocatalytic performance of Fe3O4@TiO2 and TiO2, dye wastewater was simulated by AR73 solution. The photocatalytic degradation effect of TiO2 and Fe3O4@TiO2 on AR73 was studied. Photocatalytic experiments were carried out in a photocatalytic workstation. The power of the high-pressure mercury lamp used in the experiment was 300 W and the main radiation wavelength was 365 nm. The lamp was 50 mm above the sample. Quantities of 50 mg Fe3O4@TiO2 and 50 mg TiO2 were weighed and placed at the bottom of two quartz tubes, respectively. Then, 25 mL AR73 solution with a concentration of 20 mg L−1 was added to the two quartz tubes mentioned above. The mixtures in the two quartz tubes were first placed in a dark chamber for 25 min and then in a photocatalytic reaction chamber.
Recyclability of photocatalysts is also important in practical applications. After each photocatalytic degradation experiment, the Fe3O4@TiO2 particles were collected by a permanent magnet, washed alternately with ultrapure water and absolute ethanol three times, and dried at 40 °C in a vacuum drying oven for 24 h.
The rate of dye degradation (η) in wastewater was measured according to the following equation:
where C
0 (mg L
−1) and C
t (mg L
−1) are the initial concentration of dye and the concentration of dye at time t (min), respectively.
3. Results and Discussion
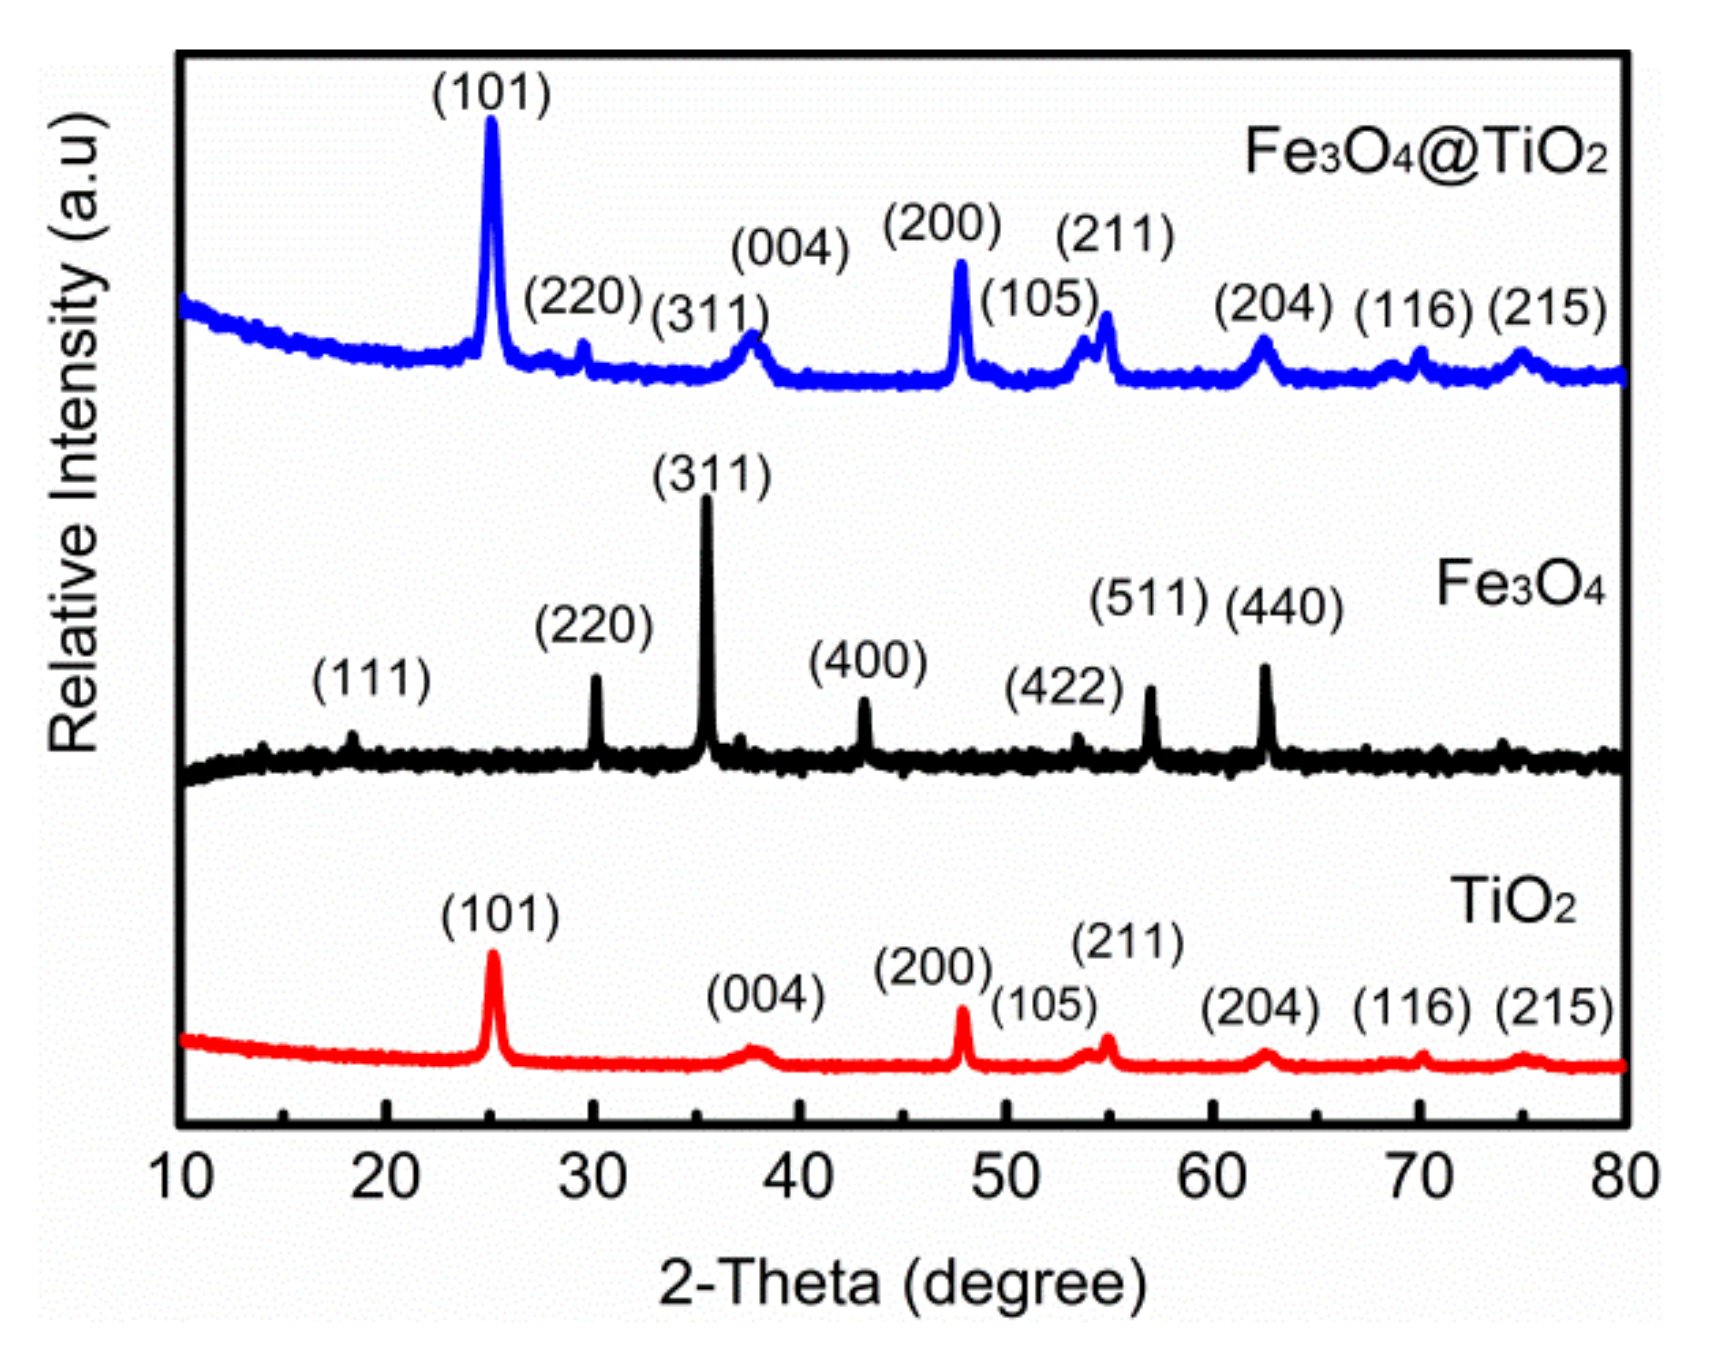
XRD patterns of TiO
2, Fe
3O
4 and Fe
3O
4@TiO
2 are shown in
Figure 1. The prepared TiO
2 powder displayed a good crystallinity; the diffraction peaks of TiO
2 exhibited at 25°, 38°, 48°, 54°, 55.14° and 62.5° corresponded to the (101), (004), (200), (105), (211) and (204) lattice planes of TiO
2 (JCPDS No. 65-3369), respectively. The results show that no crystals are formed except the anatase crystals. The diffraction peaks of Fe
3O
4 exhibited at 30.15°, 35.59°, 43.12°, 53.45°, 56.99° and 62.53° corresponded to the (220), (311), (400), (422), (511) and (440) lattice planes of the magnetite phase (JCPDS card 02-0387) [
17], respectively. As shown in the XRD pattern of Fe
3O
4@TiO
2, there are (101), (004), (200), (105), (211) and (204) diffraction peaks of TiO
2 and (220), (422) and (400) diffraction peaks of Fe
3O
4.
The crystallite sizes of TiO
2 and Fe
3O
4@TiO
2 were calculated by applying the Scherrer formula to the diffraction peaks of the anatase crystallite plane. The calculation of crystallite sizes (D) was [
18]:
where D is the grain size (nm), λ is the X-ray wavelength (nm), β is the full width at half maximum (rad), K is the Scherrer constant and θ is the diffraction angle (°). According to the above formula, the grain sizes of TiO
2 and Fe
3O
4@TiO
2 are about 13.64 nm and 23.97 nm, respectively.
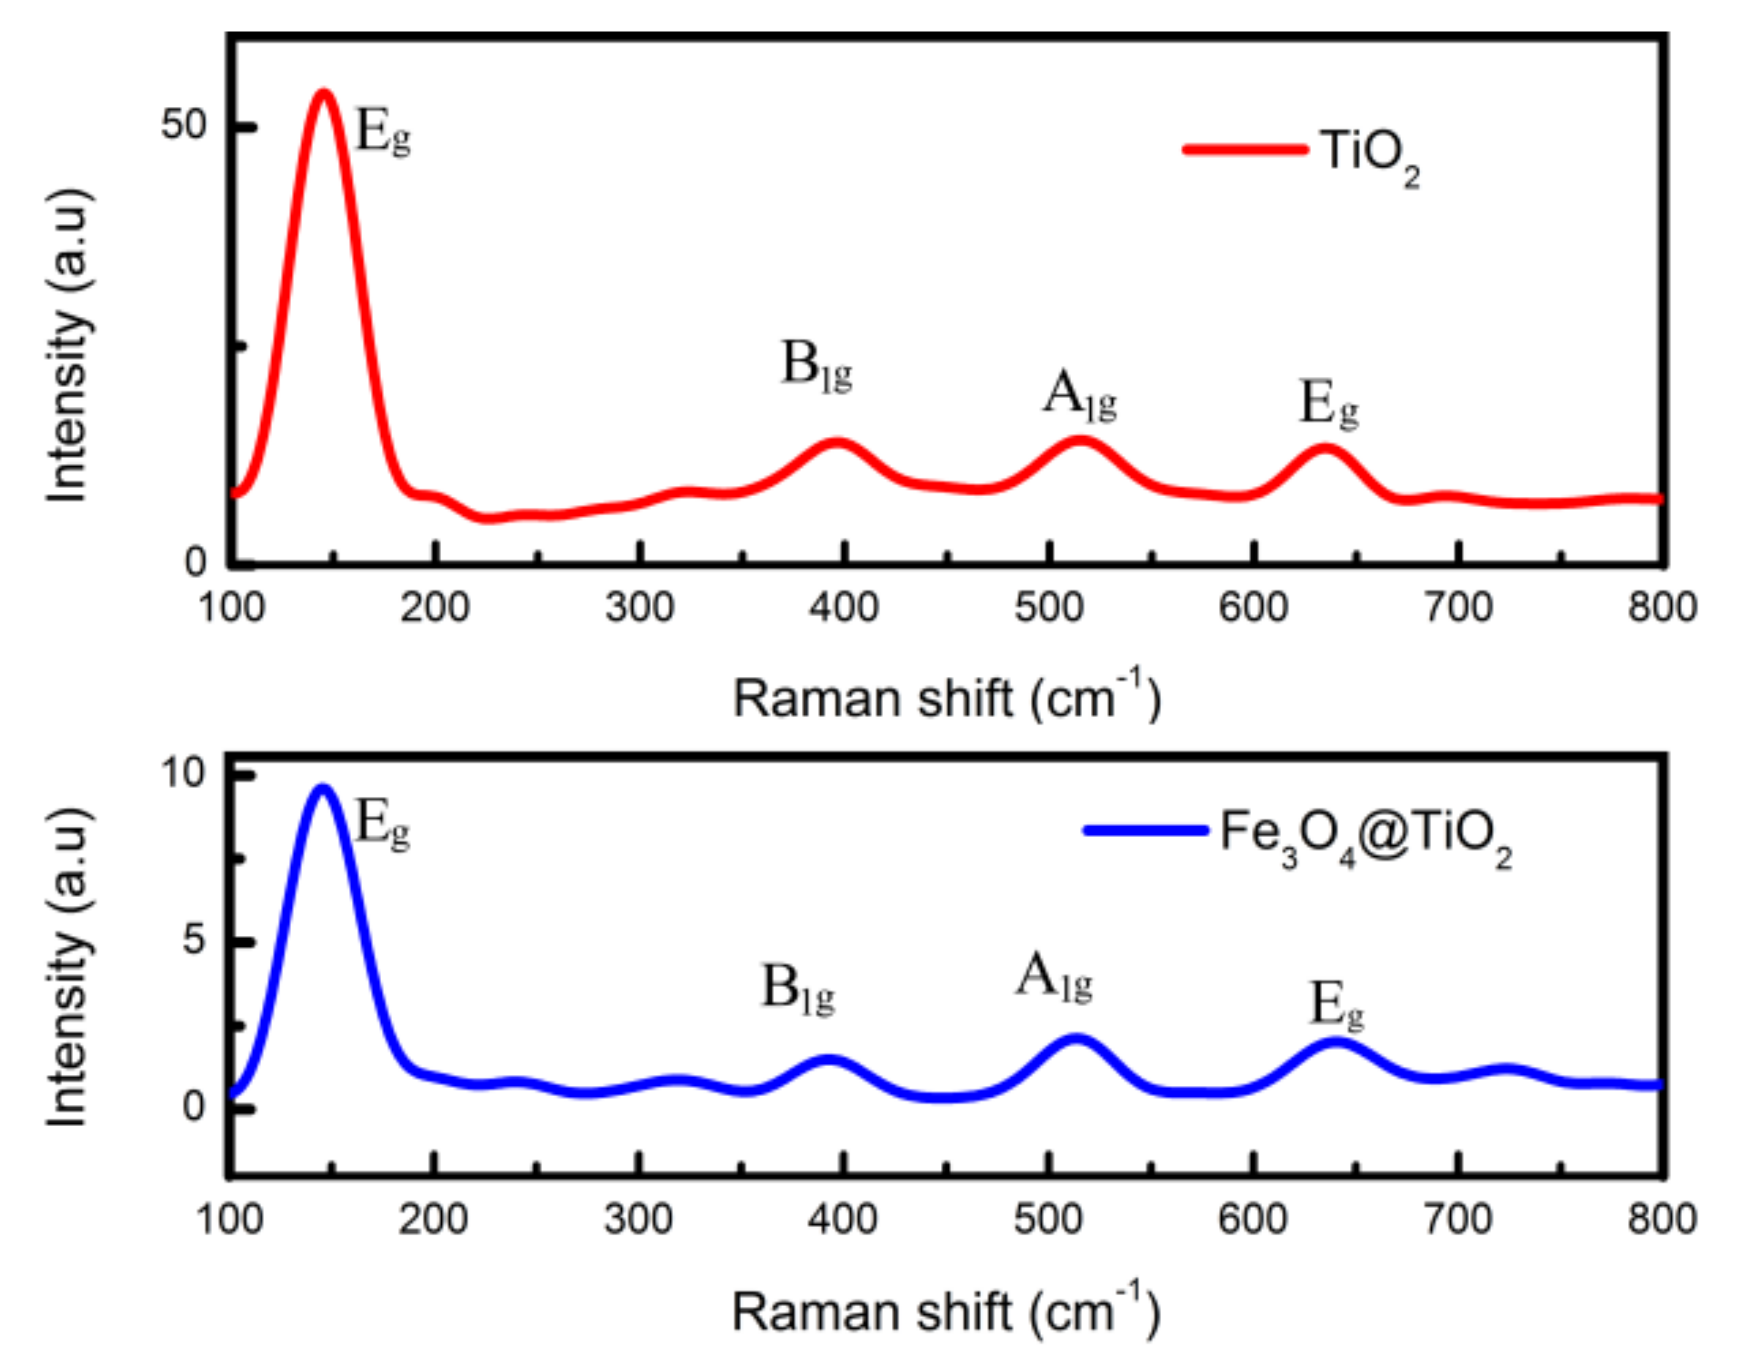
The results of Raman spectroscopy are shown in
Figure 2. The peaks of basic vibration modes of anatase TiO
2 were 144, 394, 514 and 636 cm
−1 [
19]. The vibration at 144 cm
−1 of the Eg peak was due to the symmetric stretching vibration of the O-Ti-O bond in TiO
2, and its intensity decreases with the increase in exposed (001) facets. The A
1g peak at 514 cm
−1 was generated by the antisymmetric bending vibration of O-Ti-O in TiO
2 and its intensity increased with the increase in exposed (001) facets. Therefore, the percentage of exposed (001) facets exposed for TiO
2 and Fe
3O
4@TiO
2 can be calculated by measuring the peak intensity ratio of the Eg and A
1g modes [
20]. The percentages of exposed (001) facets of TiO
2 and Fe
3O
4@TiO
2 were estimated to be 12.1% and 25.2%, respectively.
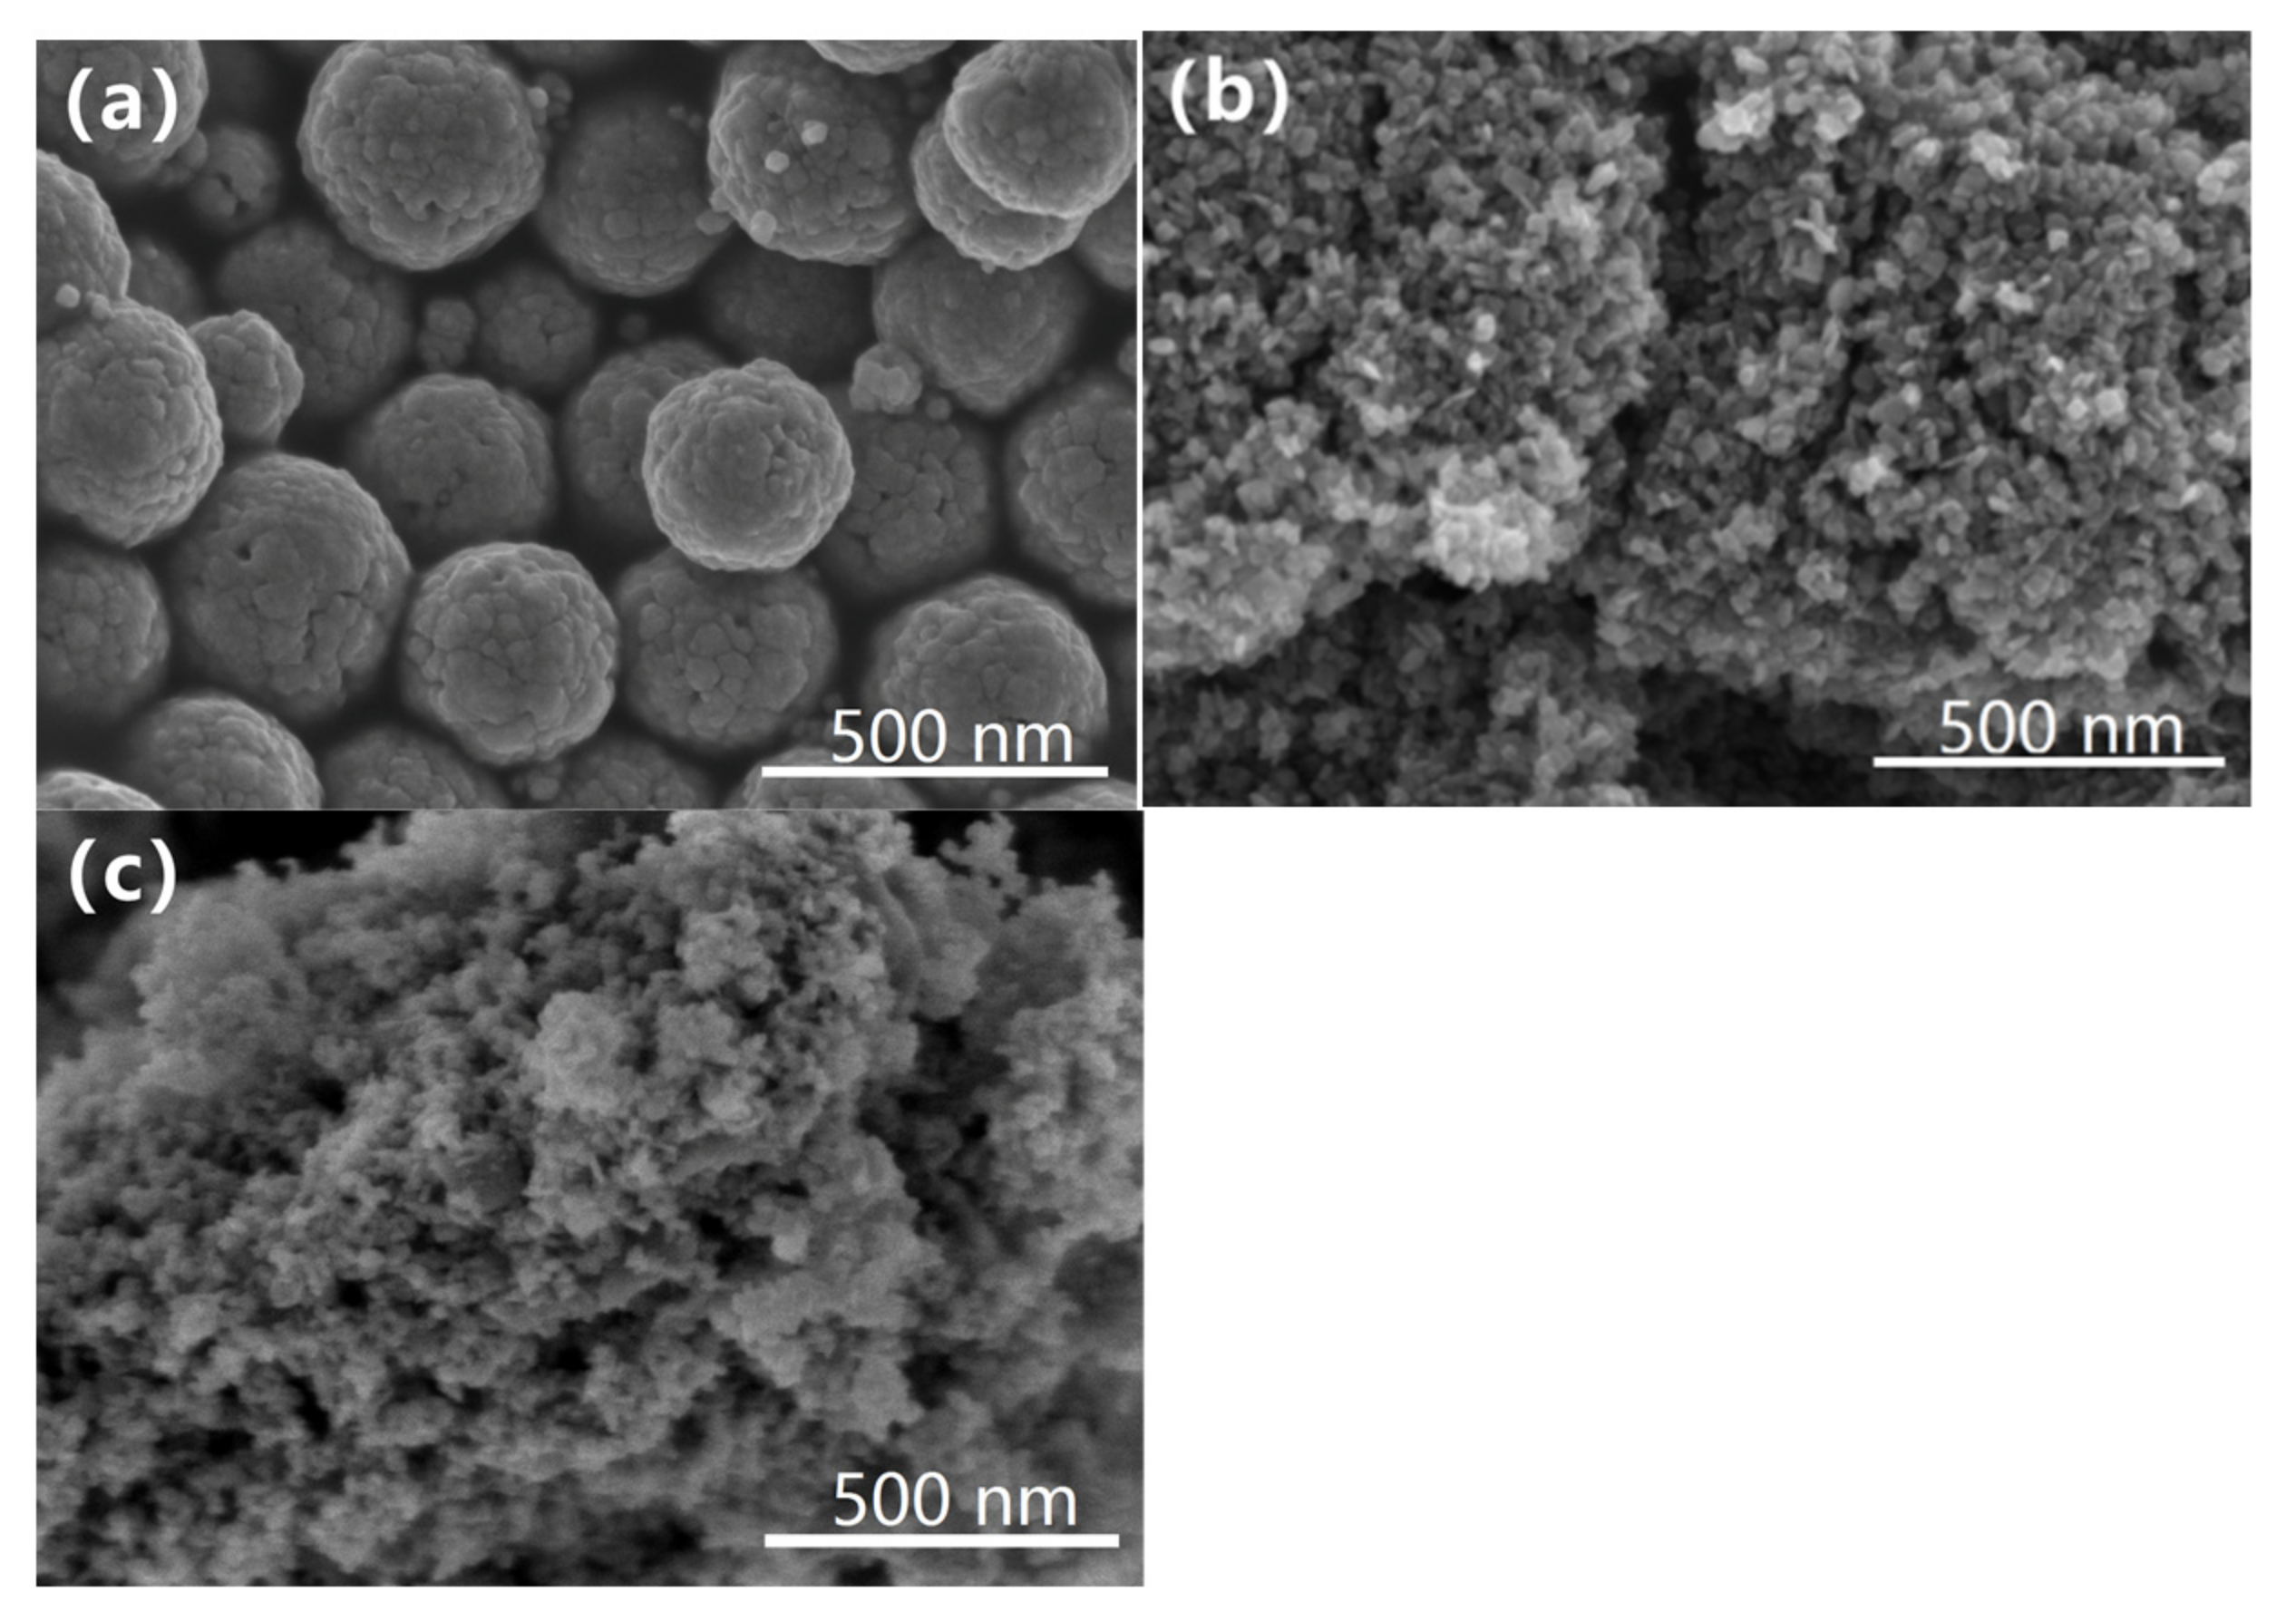
The morphologies of Fe
3O
4, TiO
2 and Fe
3O
4@TiO
2 are shown in
Figure 3. The particle diameters of Fe
3O
4, TiO
2 and Fe
3O
4@TiO
2 are about 390 nm, 100 nm and 120 nm, respectively. The size of Fe
3O
4@TiO
2 and TiO
2 particles is uniform, but there is particle agglomeration. The possible reason is that the spherical structure is corroded by acid during the compounding process. Combined with the results of FESEM and XRD, it is found that the particle size inferred from FESEM is larger than that obtained by XRD. It is suggested that the shape of larger particles is determined by the agglomeration of adjacent smaller crystallites [
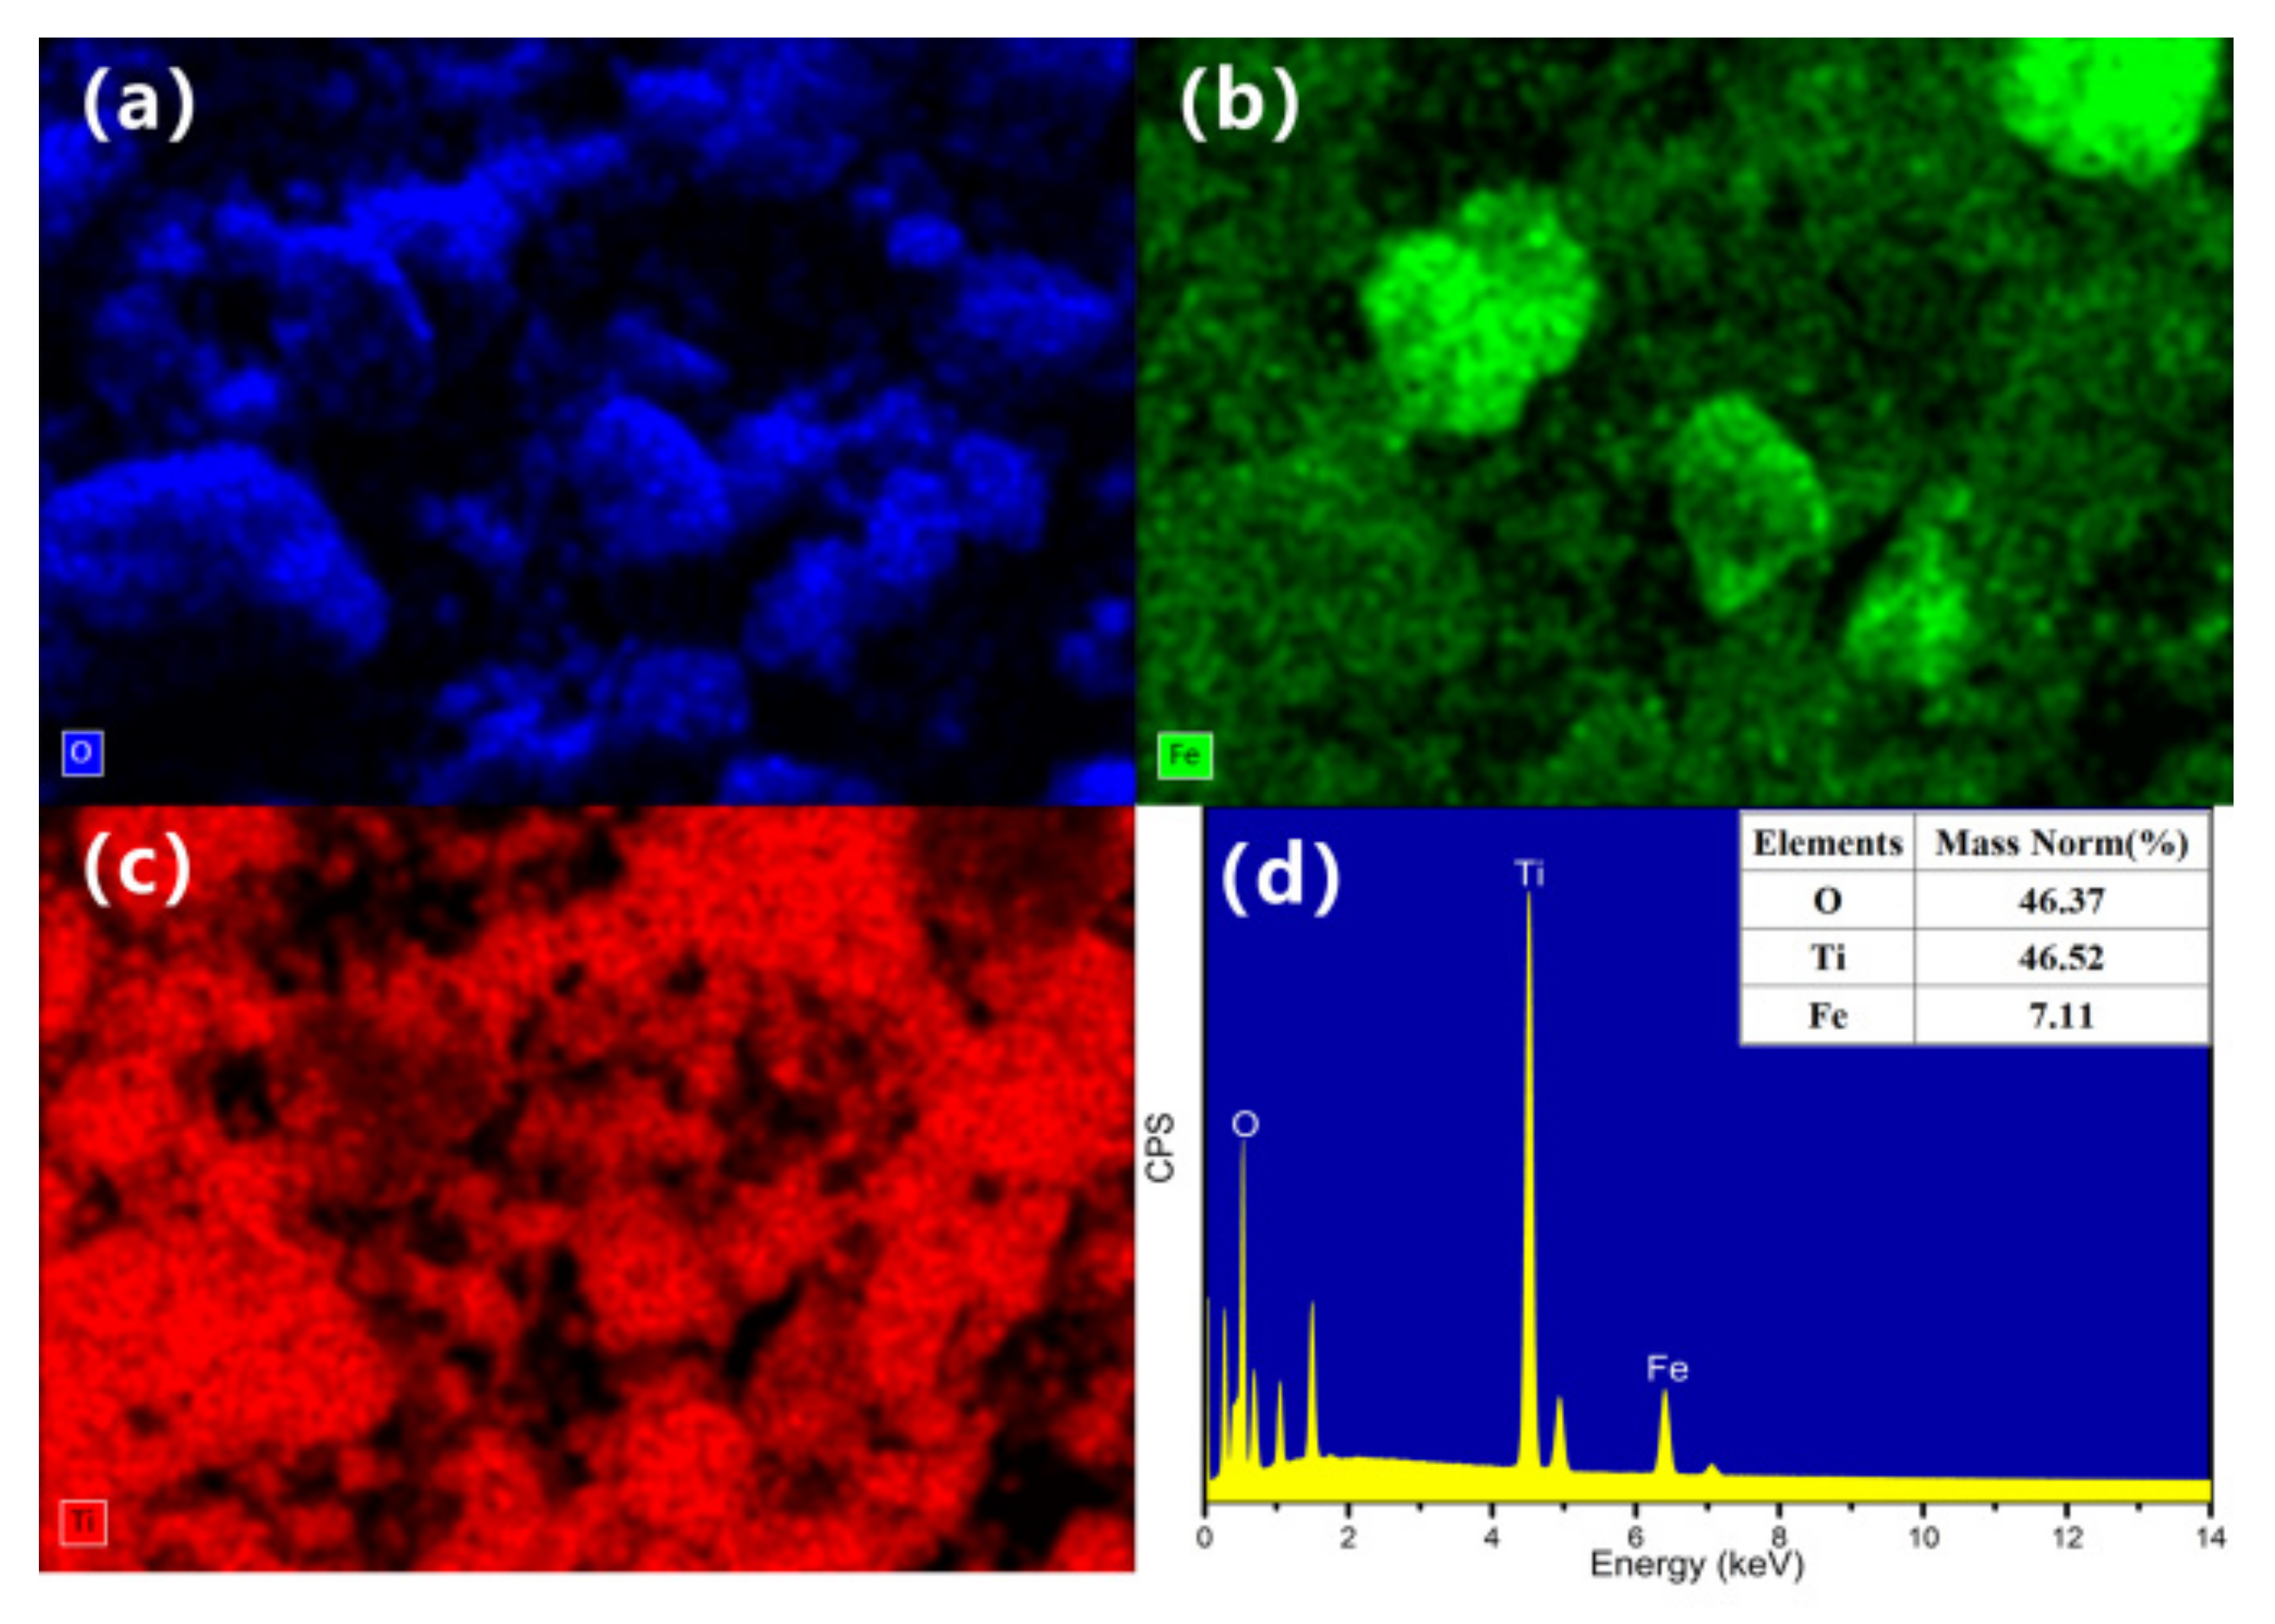
21]. EDS patterns and FESEM elemental mapping of Fe
3O
4@TiO
2 are shown in
Figure 4. The results indicate that Ti and Fe elements are evenly distributed, which firmly confirms the incorporation of TiO
2 and Fe
3O
4 in the composite.
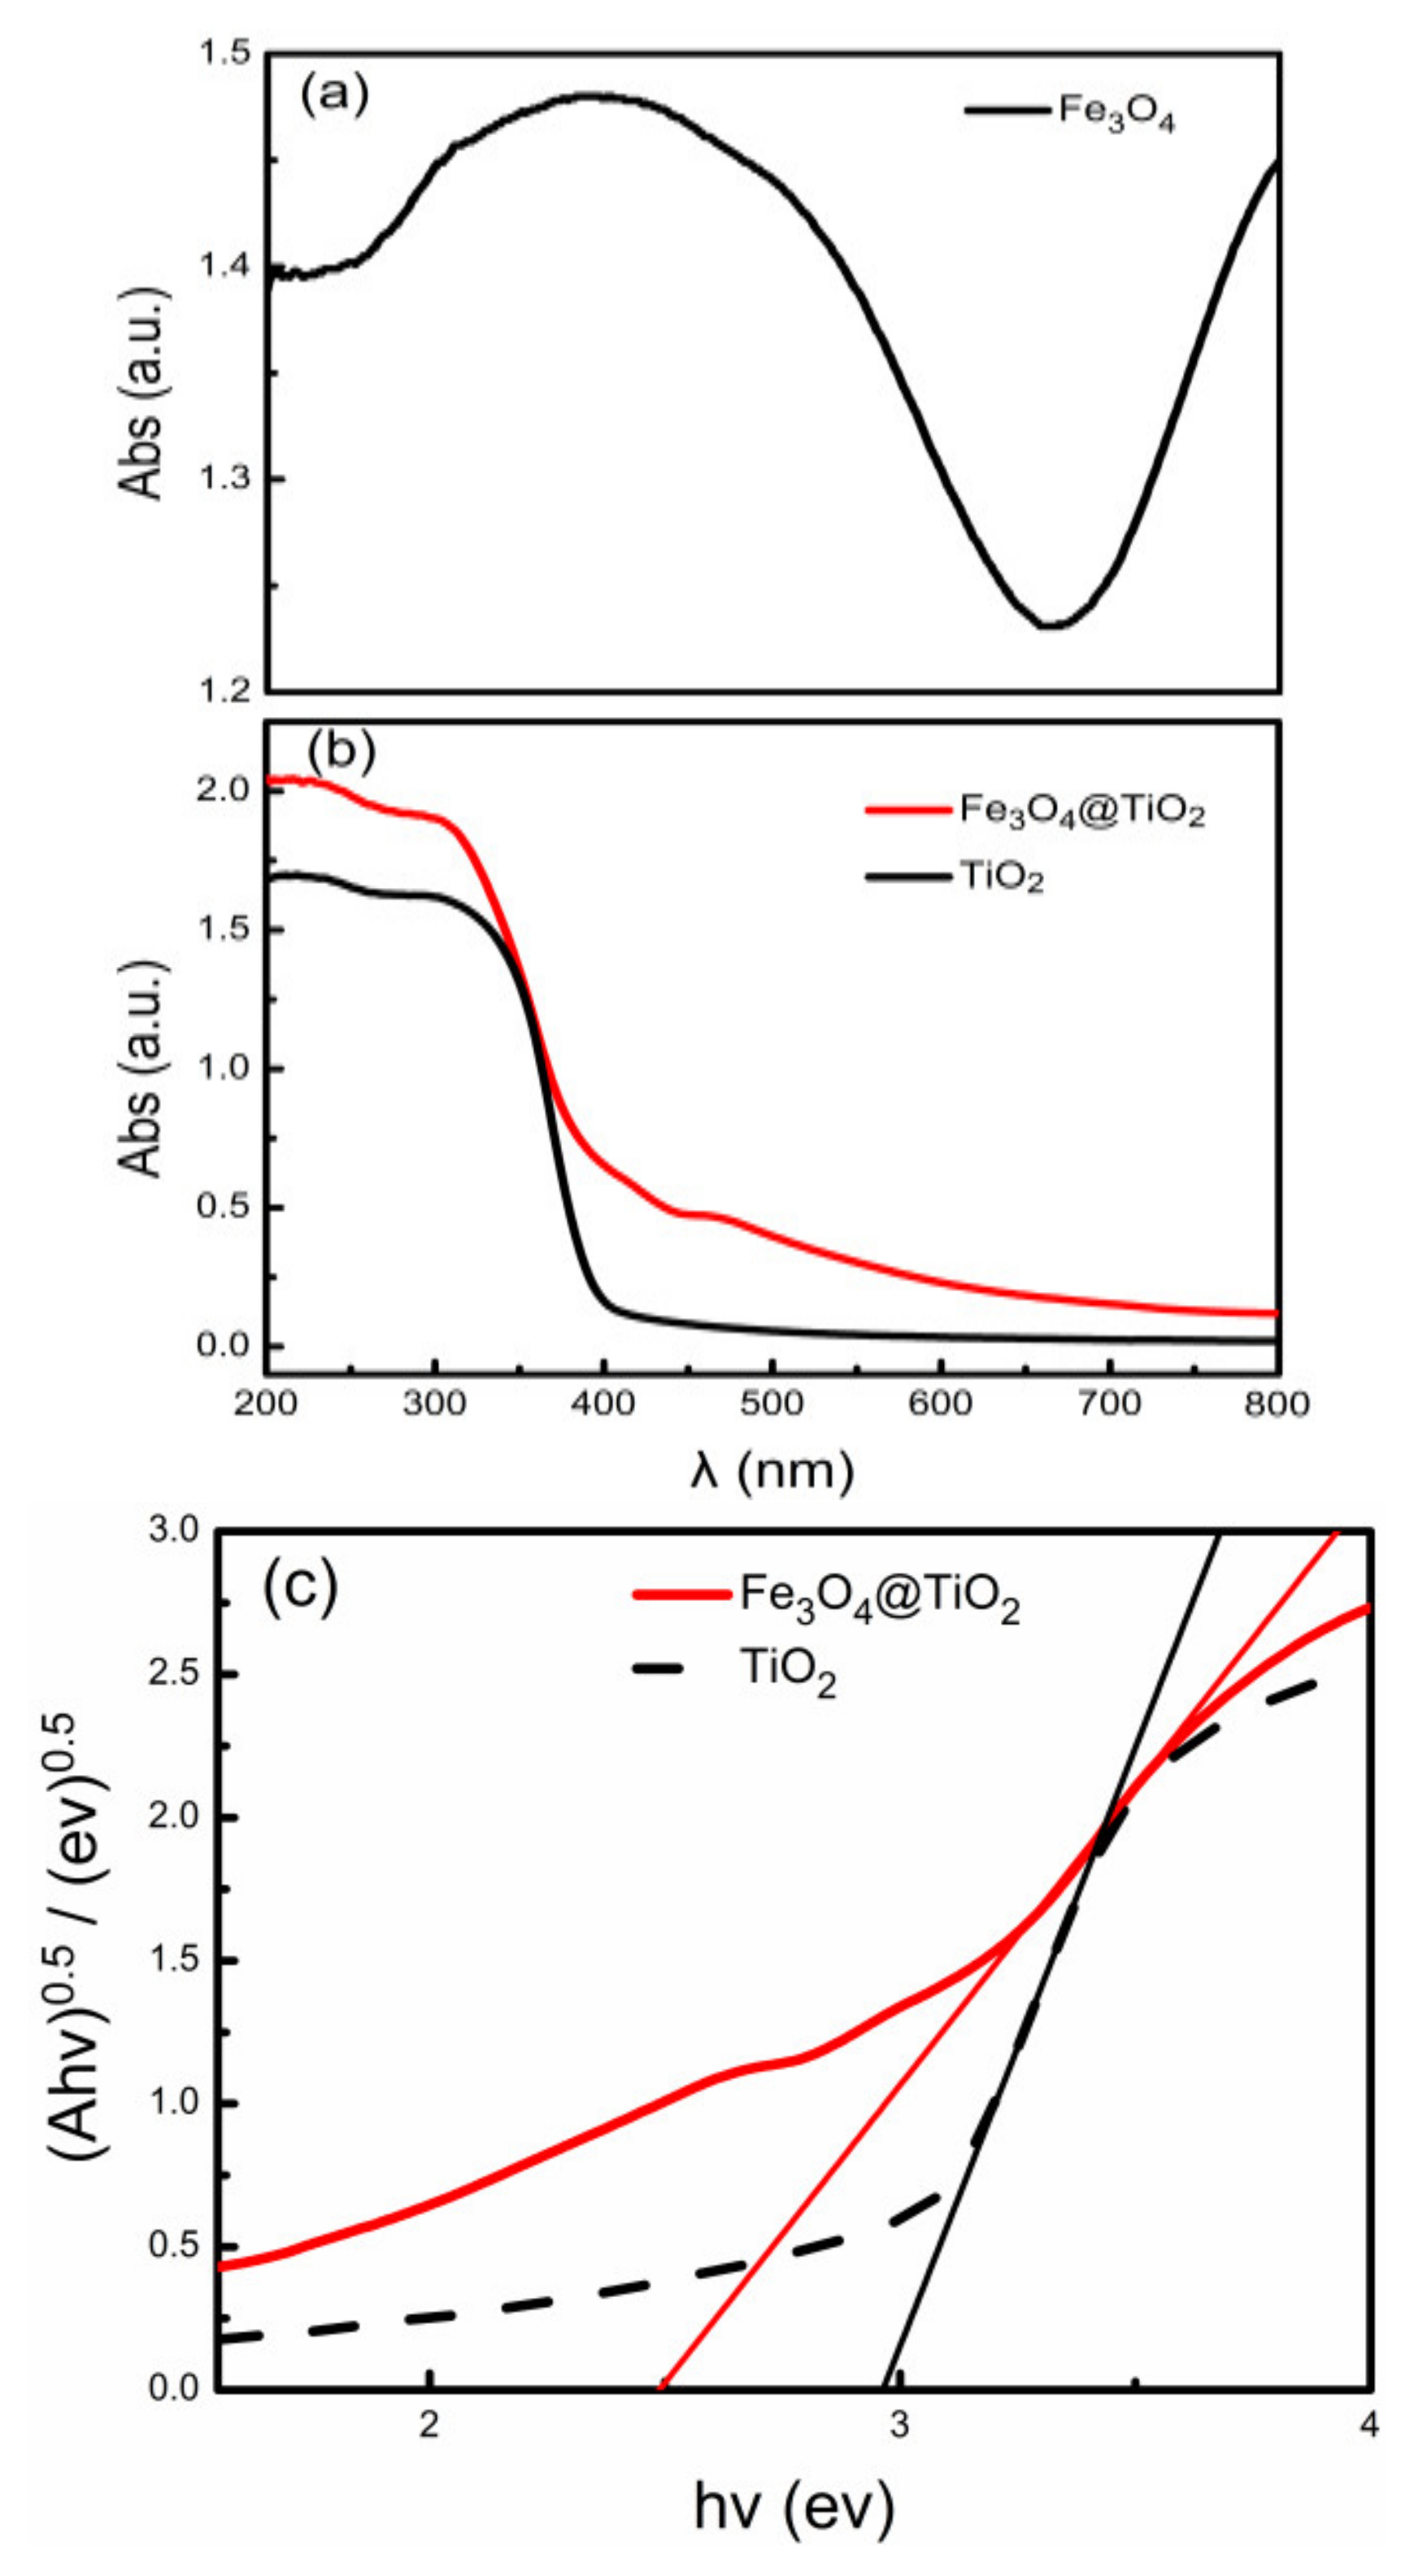
The UV-VIS diffuse reflectance spectra of Fe
3O
4, TiO
2 and Fe
3O
4@TiO
2 particles are shown in
Figure 5a,b. The Fe
3O
4@TiO
2 spectrum shows a ‘red shift’ compared with the TiO
2 spectrum, indicating that Fe
3O
4@TiO
2 can absorb light in a wider wavelength range compared with TiO
2, and its photocatalytic activity is significantly improved. According to the Kubelka–Munk function, the absorption threshold is estimated. The energy band gap (E
bg) of Fe
3O
4@TiO
2 and TiO
2 is determined by the relationship between (F(R)h𝜈)
1/2 and h𝜈 (Tauc plot). The value of E
bg is measured in the high absorption region. The zero F(R) (i.e., E
bg) is measured by extrapolating the linear region to the horizontal axis in the high absorption region [
22].
Figure 5c shows band gap spectra of TiO
2 and Fe
3O
4@TiO
2 obtained by Kubelka–Munk method. The band gaps of TiO
2 and Fe
3O
4@TiO
2 are 2.9 eV and 2.5 eV, respectively. The possible reasons for the decrease in the band gap of composite materials are that after HF ionization, H
+ ions react with Fe
3O
4 to promote ionization and increase the concentration of F
¯, causing it to have a stronger inhibitory effect on the (101) surface. The photogenerated electron–hole rate of Fe
3O
4@TiO
2 is higher than that of TiO
2, and Fe
3O
4@TiO
2 has good light absorption in the wider wavelength range.
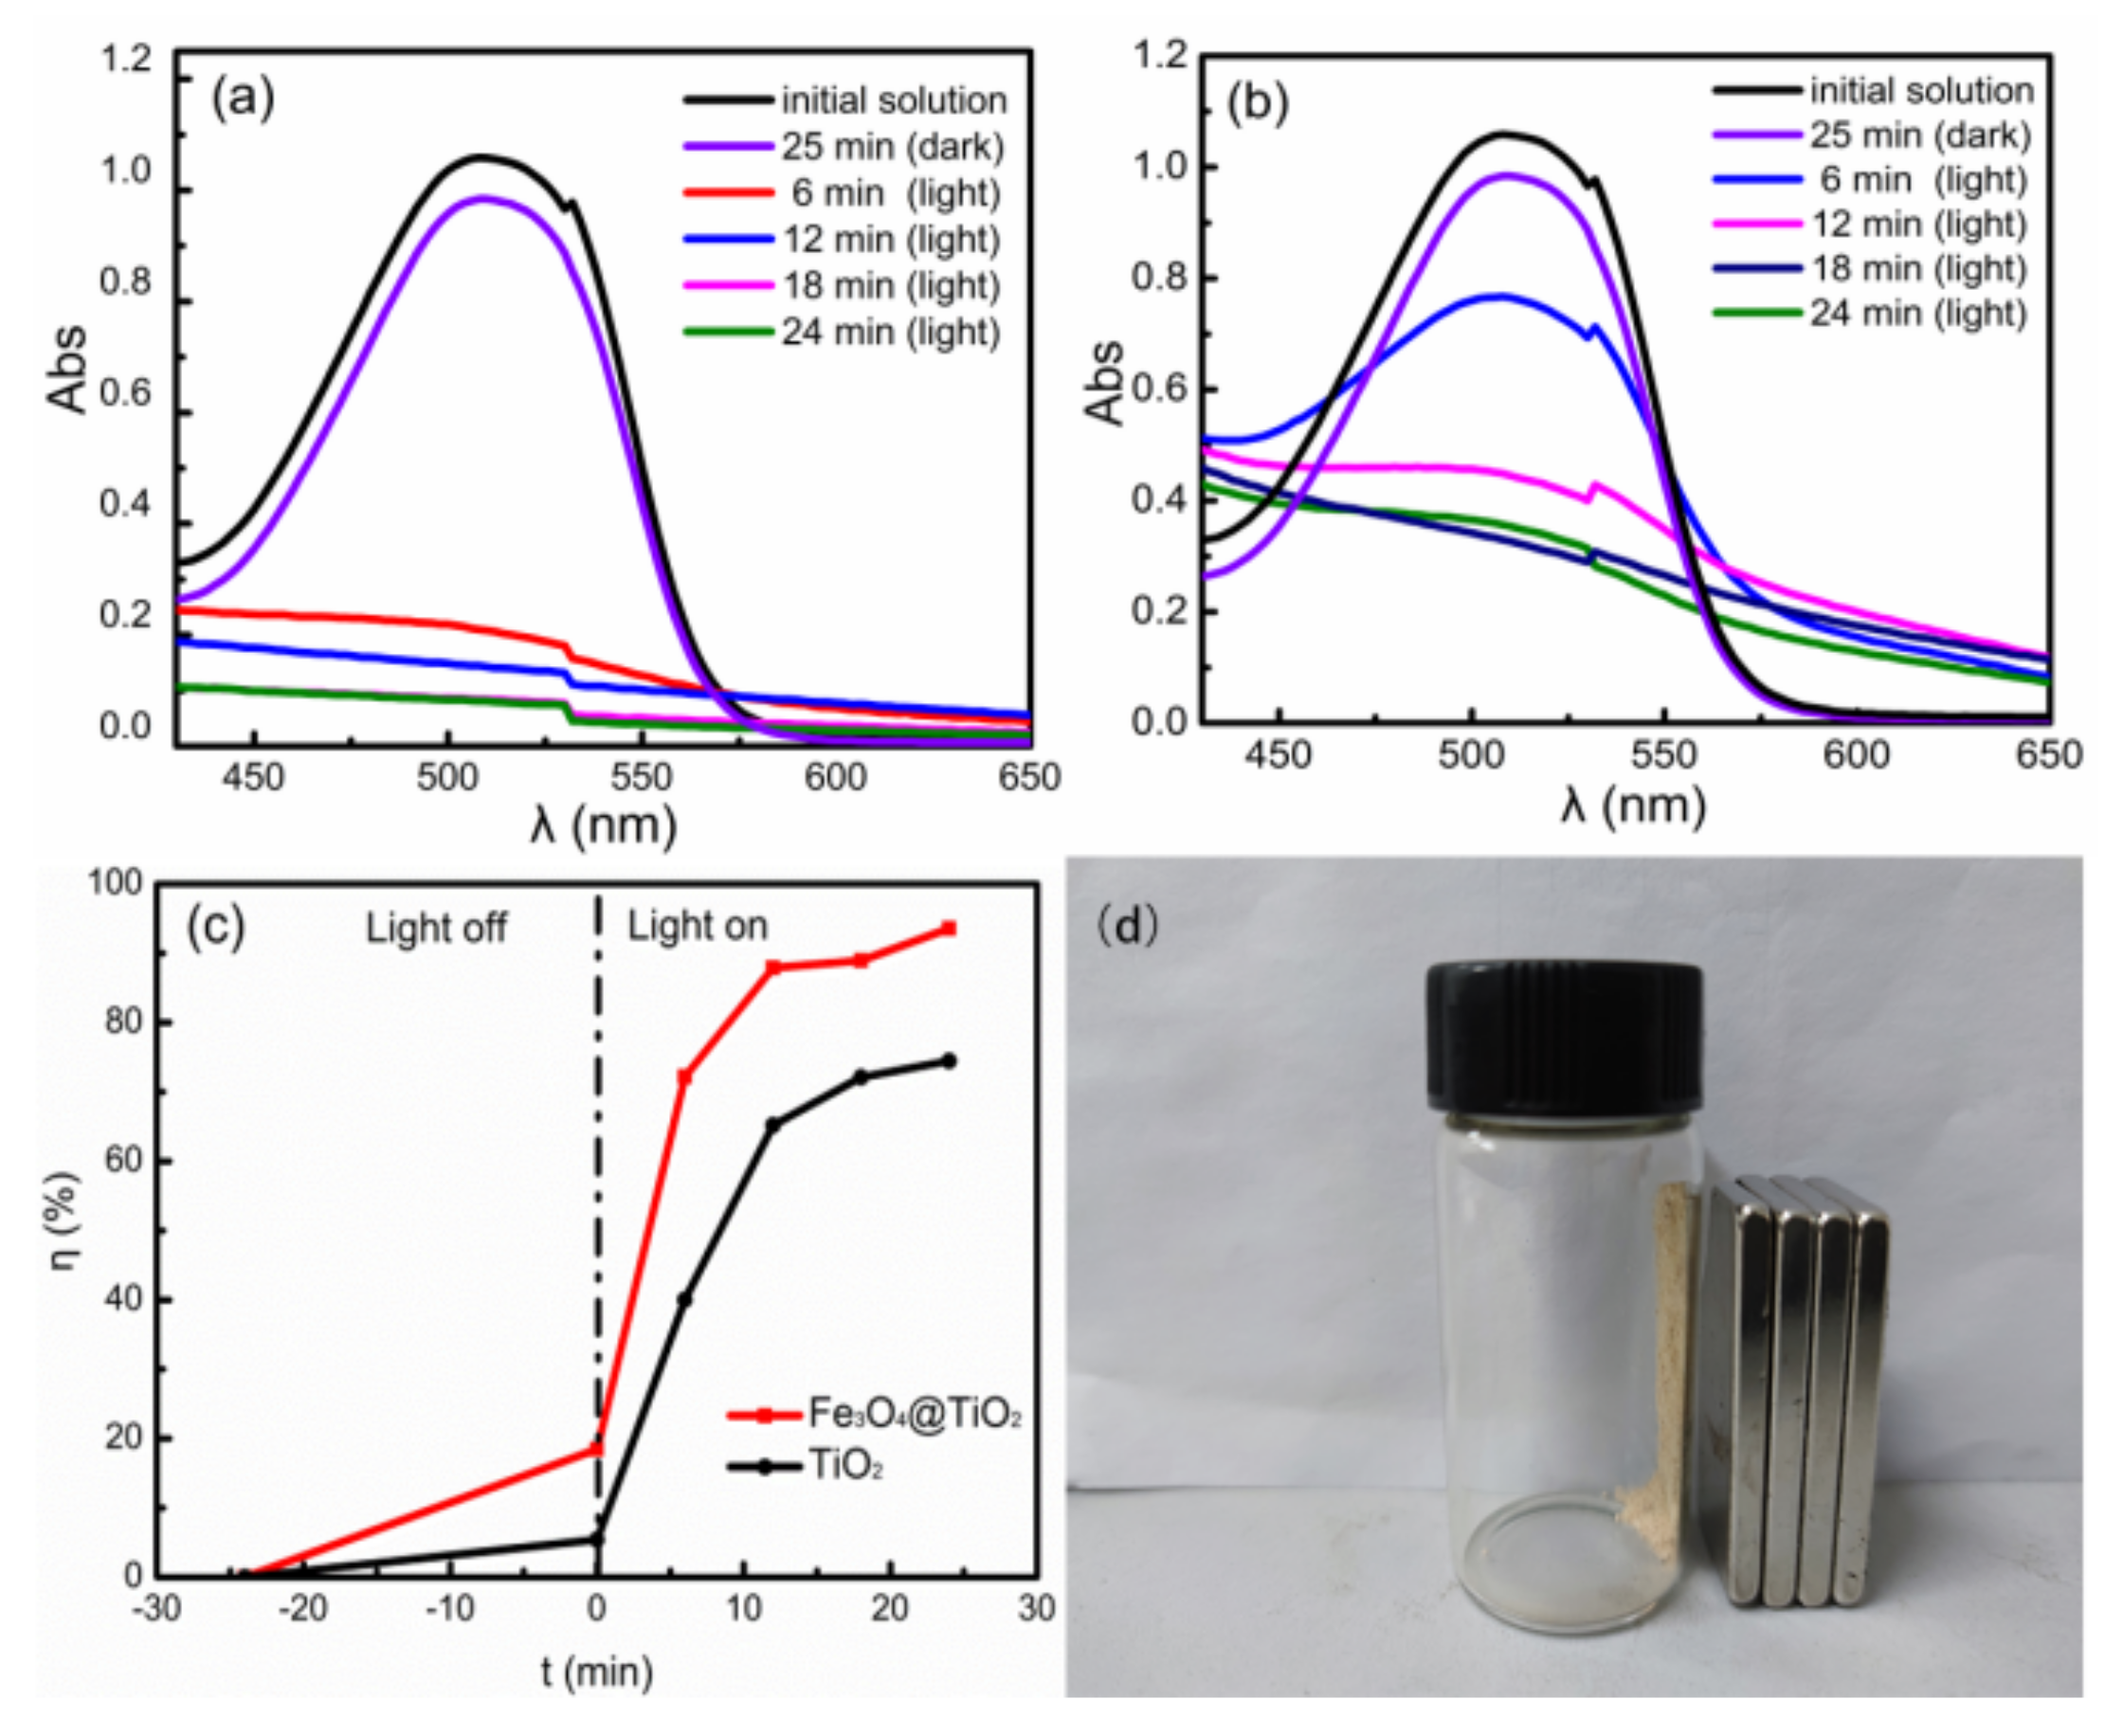
The dark reaction showed that both Fe
3O
4@TiO
2 and TiO
2 had good adsorption of AR73, as shown in
Figure 6. In the initial stage of photocatalytic reaction, the concentration of AR73 was high, and the rate of dye degradation was not high, but the rate of dye degradation increased rapidly. The intermediate products generated by the degraded AR73 occupied the activity of the photocatalyst and increased as time went on, so the photocatalytic degradation rate was high, but the rate of dye degradation increased slowly, as shown in
Figure 6c. After the combination of Fe
3O
4 and TiO
2, the band gap decreased and the exposure ratio of (001) high-energy facets increased, which improved the photocatalytic activity. This result is consistent with
Figure 2 and
Figure 5c. With the extension of the photocatalytic time, there were too many intermediates generated by AR73, which led to a significant reduction in the contact dimensions between the AR73 and Fe
3O
4@TiO
2, inhibiting the photocatalytic degradation and causing the degradation rate to increase slowly or even not increase. The photocatalytic degradation rates of TiO
2 and Fe
3O
4@TiO
2 at 24 min were 74.47% and 93.56%, respectively, which indicated that under the same experimental conditions, the rate of dye degradation by Fe
3O
4@TiO
2 was better than that by TiO
2. Fe
3O
4@TiO
2 was recovered by magnetism, as shown in
Figure 6d.
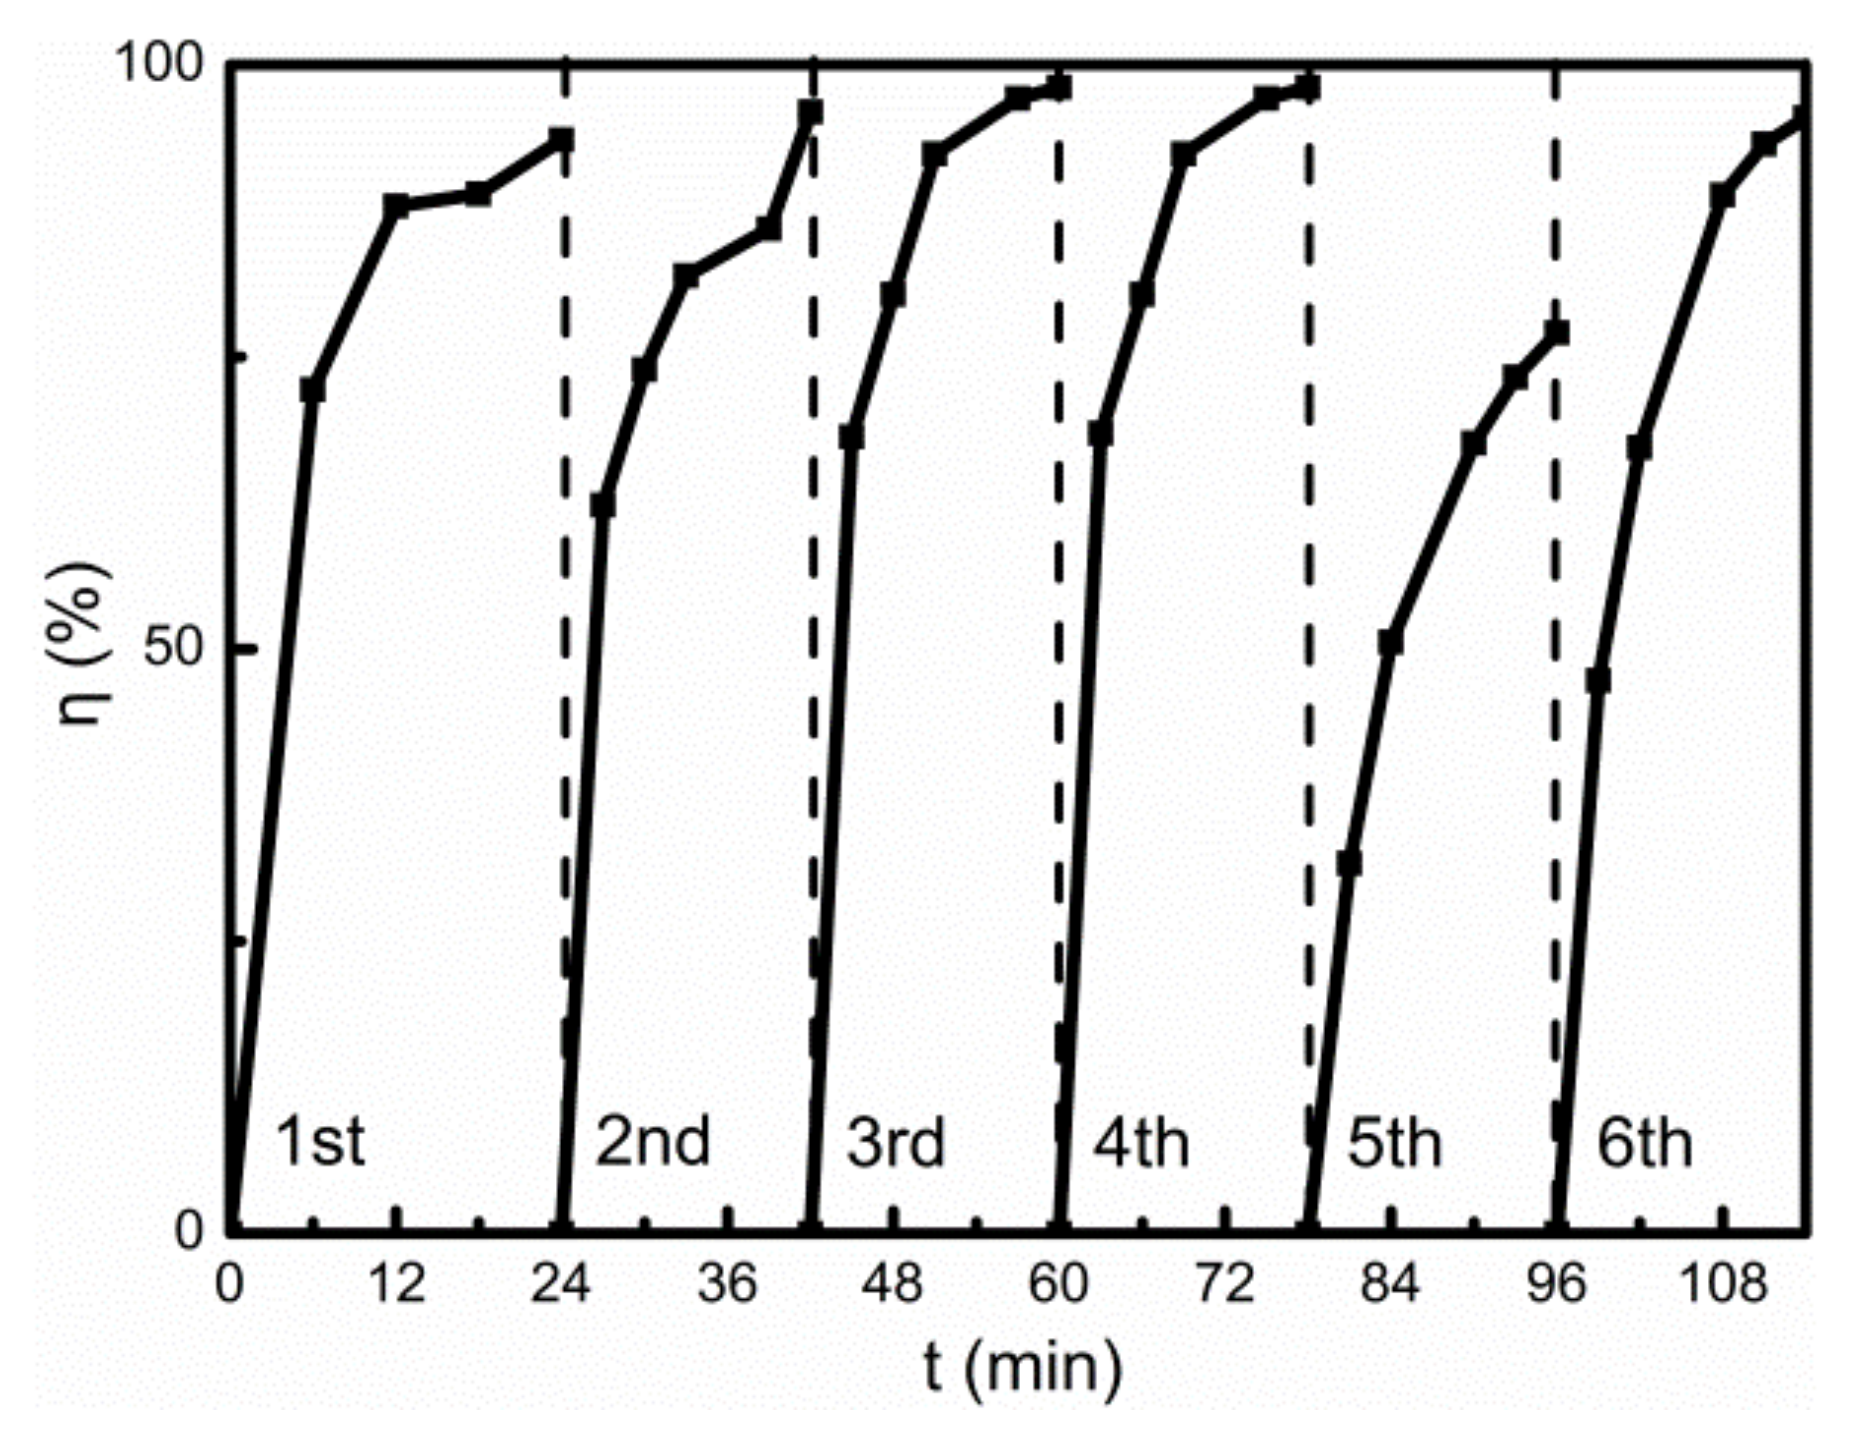
The recovered photocatalyst degraded AR73 under the same experimental conditions. The photocatalytic effect of the recycled photocatalyst is shown in
Figure 7. The abscissae 0–24 min, 24–42 min, 42–60 min, 60–78 min, 78–96 min and 96–114 min correspond to the first, second, third, fourth, fifth and sixth photocatalytic reactions, respectively. The result indicates that the rate of photocatalytic degradation of AR73 by the photocatalyst recycled for the fifth time is lower than those of the previous four times, but it can still reach 77.05%, as shown in
Figure 7. This phenomenon may be caused by the adsorption of some insoluble or insoluble intermediates on the catalyst surface, which occupies the activity of the photocatalyst, affects the absorbance of the catalyst and reduces the yield of photogenerated electron–hole pairs. Fe
3O
4@TiO
2 in water was irradiated with a high-pressure mercury lamp for 40 min to achieve self-cleaning, and the conditions for self-cleaning were the same as those for photocatalytic degradation of AR73. In the sixth photocatalytic degradation experiment of AR73, the concentration of AR73 was 0.91 mg L
−1 and the degradation rate was 95.45% after irradiation for 18 min. This indicated that through self-cleaning, the precipitation on the surface was further degraded by the photocatalyst to soluble small molecules, restoring the photocatalytic activity of Fe
3O
4@TiO
2.
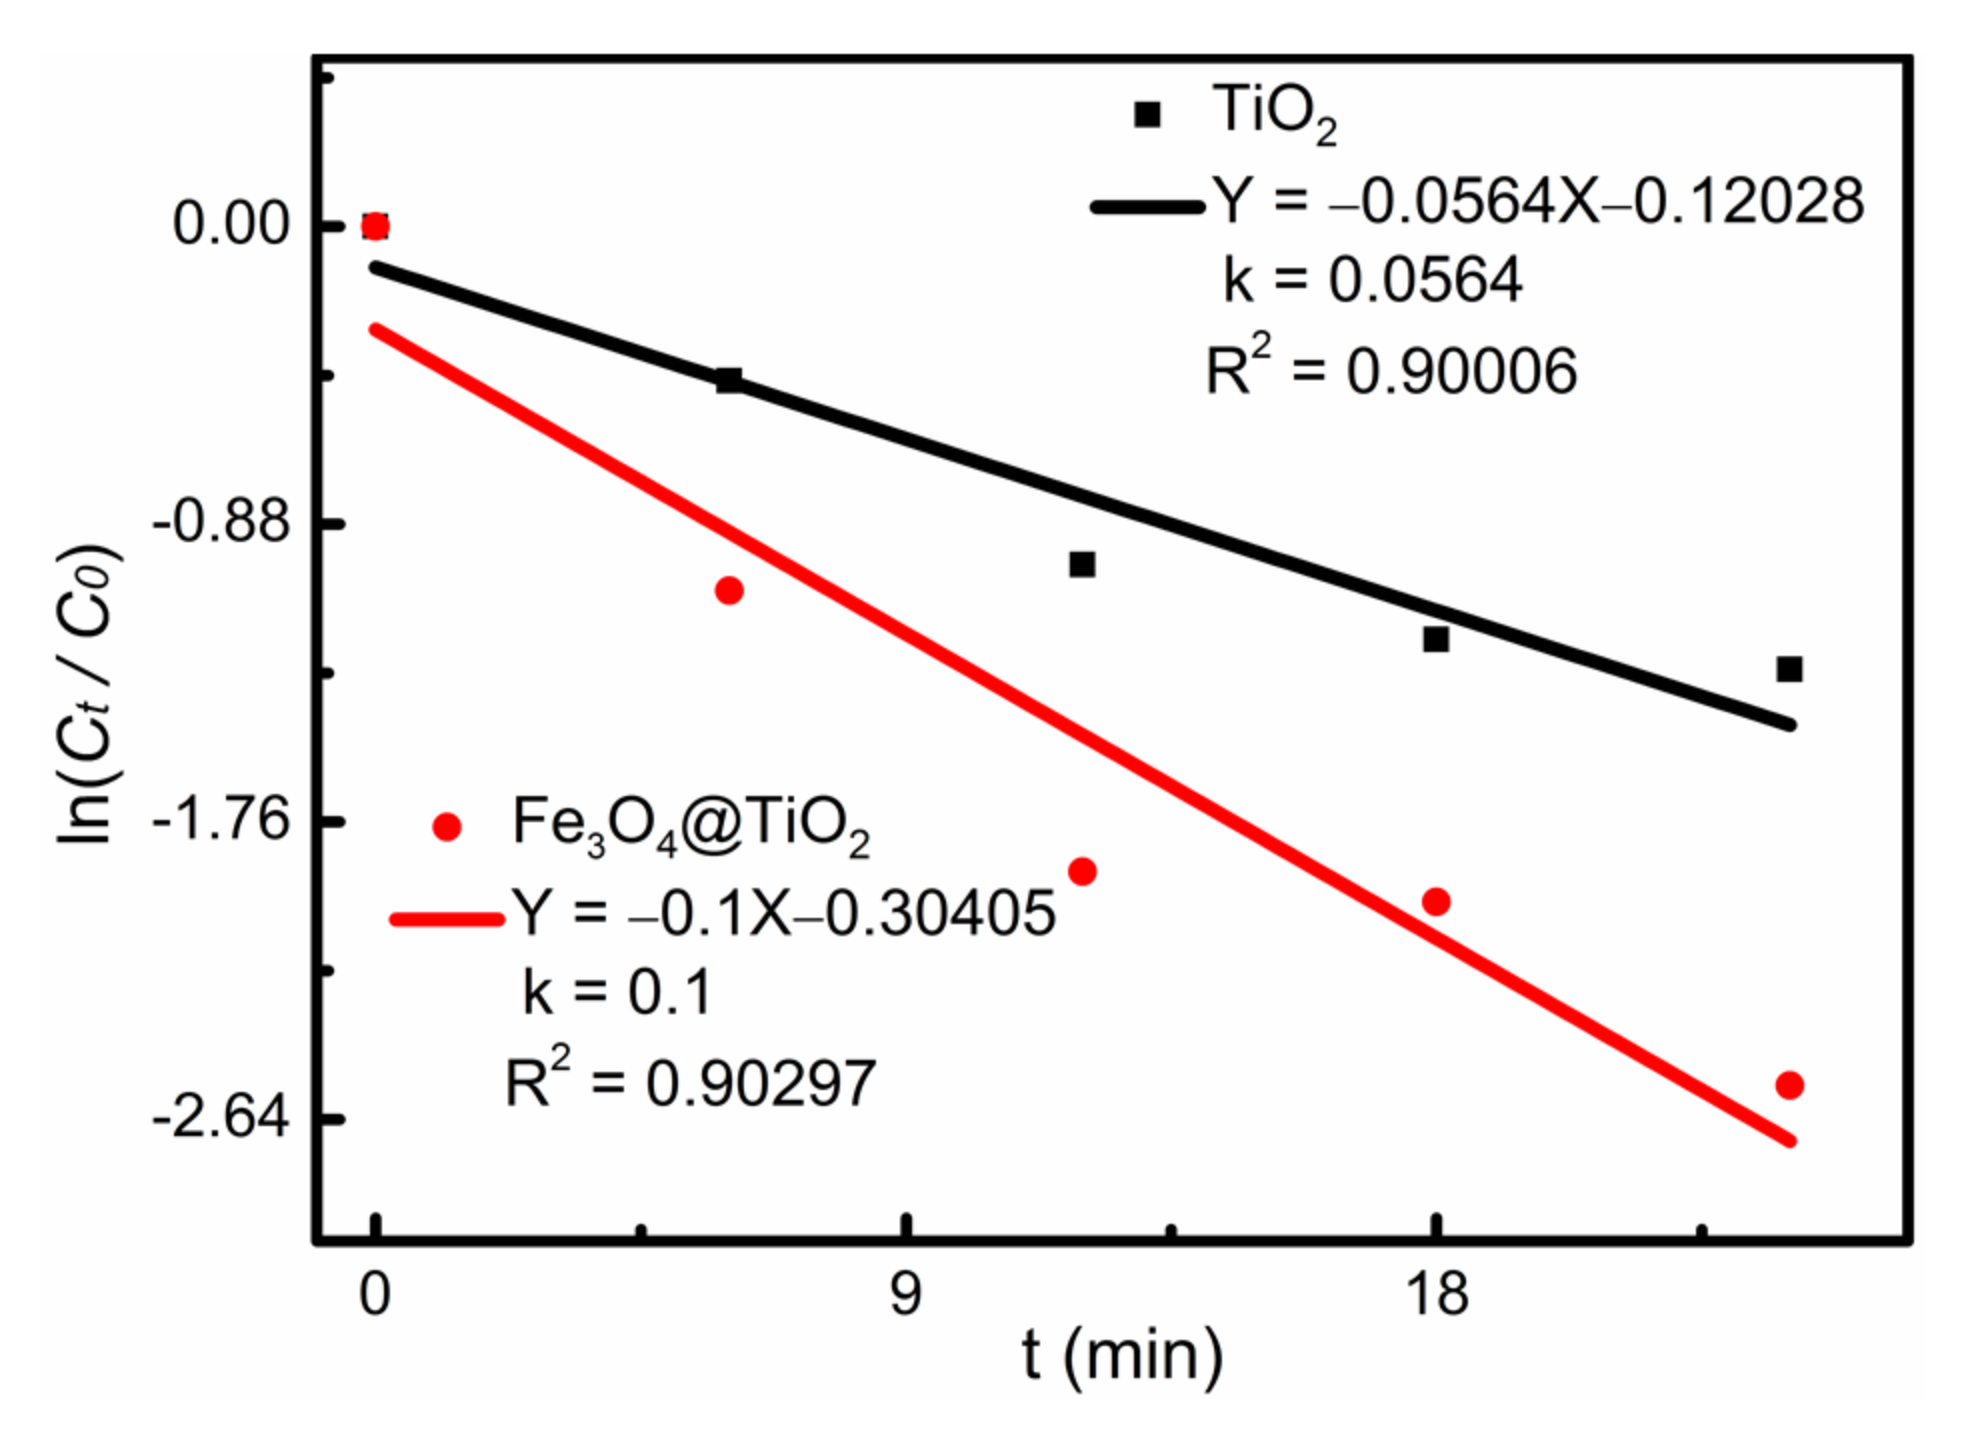
Figure 8 shows the linear fitting of first-order kinetics of photocatalytic degradation of AR73 by Fe
3O
4@TiO
2 and TiO
2. The degradation reaction rate constant K can be acquired with the following equation [
23]:
where C
0 (mg L
−1) and C
t (mg L
−1) have the same meaning as in formula (1). The fitting results are shown in
Figure 8. It shows that the photocatalytic process has a concentration-controlled reaction rate. The degradation reaction rate constant of Fe
3O
4@TiO
2 was better than that of TiO
2. This result is consistent with
Figure 6c.
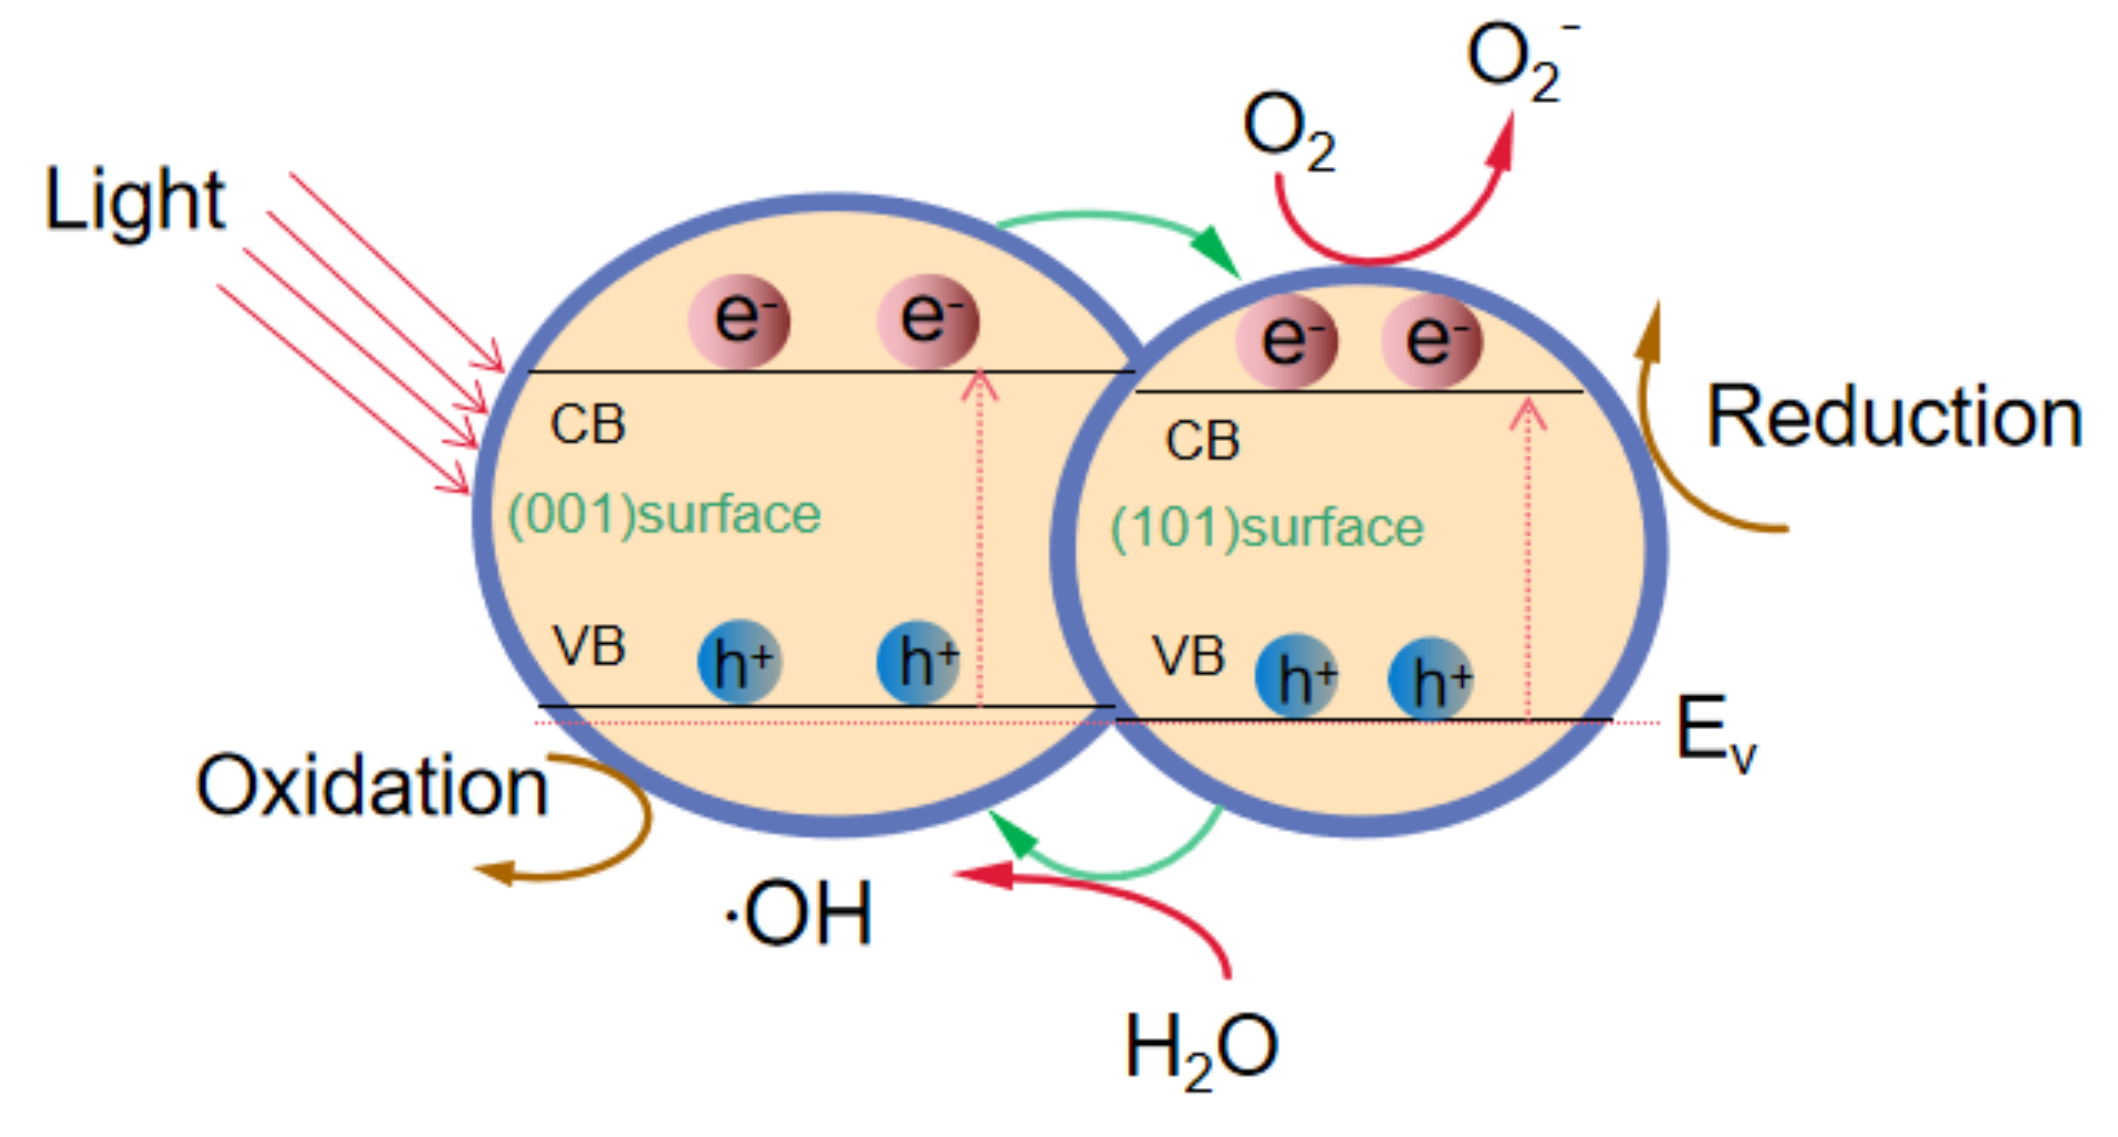
When the ultraviolet light irradiates on the surface of the sample, the electrons in the conduction band come from electrons of Fe
3O
4@TiO
2 in the valence band absorbing the energy of photons. Photogenerated electrons are formed in the conduction band, photogenerated holes are formed in the valence band, and highly active hole–electron pairs are formed, forming a redox system. Under the action of an electric field, photogenerated electrons and holes are separated and transferred to Fe
3O
4@TiO
2 (001) and (101) crystal planes, respectively [
24]. Photogenerated holes (h
+) can oxidize OH
− and H
2O molecules absorbed on the surface of TiO
2 to generate ·OH and ·O
2−. Photogenerated electrons (e
−) can also react with dissolved oxygen (O
2) in water to form superoxide radicals (·O
2−), and ·O
2− further reacts with H
2O to form OH
− [
25]. ·OH, h
+ and·O
2− can decompose AR73 dye under UV irradiation, and a schematic illustration is shown in
Figure 9. The reaction process is as follows:


 ,
, 