Article

Performance Evaluation of a Long-Span Cable-Stayed Bridge Using Non-Destructive Field Loading Tests

1
Bridge Engineering Research Institute, Guangxi Transportation Science and Technology Group Co., Ltd., Nanning 530007, China
2
School of Civil Engineering, Southeast University, Nanjing 211189, China
3
Postdoctoral Workstation, Guangxi Beibu Gulf Investment Group Co., Ltd., Nanning 530029, China
4
College of Transportation, Jilin University, Changchun 130025, China
*
Authors to whom correspondence should be addressed.
Appl. Sci. 2022, 12(5), 2367; https://doi.org/10.3390/app12052367
Submission received: 17 January 2022 / Revised: 22 February 2022 / Accepted: 23 February 2022 / Published: 24 February 2022

Abstract

:
As an important part of the transportation network, the reliability of bridge structures is of great significance to people’s personal safety, as well as to the national economy. In order to evaluate the performance of complex bridge structures, their mechanical behavior and fundamental characteristics need to be studied. Structural health monitoring (SHM) has been introduced into bridge engineering, and the structural response assessment, load effects monitoring, and reliability evaluation have been developed based on the collected SHM information. In this study, a performance evaluation method for complex bridge structures based on non-destructive field loading tests is proposed. The cable-stayed bridge in Guangxi with the largest span (Pingnan Xiangsizhou Bridge) was selected as the research object, and loading on the main girder was transferred to the piers and tower through the stay cables, whose structural responses are critical in the process of bridge operation. Therefore, the field loading tests—including deflection and strain testing of the main girder, as well as cable force tests—were also conducted for Pingnan Xiangsizhou Bridge by using non-destructive measurement techniques (multifunctional static strain test system, radar interferometric deformation measurement technology, etc.). Based on the numerically simulated results of a finite element model for Pingnan Xiangsizhou Bridge, reasonable field loading test conditions and loading arrangement were determined. Non-destructive field loading test results showed that the quality of the bridge’s construction is up to standard, due to a good agreement between the calculated and measured frequencies of the bridge. In addition, the calibration coefficients of displacement and strain were less than 1, indicating that Pingnan Xiangsizhou Bridge has satisfactory stiffness and strength.

1. Introduction

With the rapid development of China’s national economy, the demand for transportation infrastructure is increasing [1,2]. As an important part of transportation networks, the reliability of bridge structures is of great significance to people’s personal safety, as well as to the national economy [3,4,5]. Mechanical properties are complicated for bridge structures with large spans or complex structural systems throughout their whole life cycle [6]. In order to evaluate the performance of complex bridge structures, mechanical behavior and fundamental characteristics need to be studied.
During recent decades, the concept of structural health monitoring (SHM) has been introduced into bridge engineering [7,8]. The rapid development of modern technologies—such as communication networks, signal processing, and artificial intelligence—has accelerated the advancement of bridge structural health monitoring [9,10]. Research has been devoted to structural response assessment, load effects monitoring, and reliability evaluation based on the collected SHM information [11,12]. Ni et al. [13] proposed a method for assessing the in-service condition of bridge decks based on monitored strain data, and a wavelet decomposition method was applied to extract live load effects from the original SHM data. Xu et al. [14] took a suspension bridge in Hong Kong as an example, and illustrated how SHM systems are used to investigate various load effects, as well as in structural damage evaluation. Carrion et al. [15] established a comprehensive data-based monitoring framework to measure, reproduce, and evaluate the structural behavior during and after a failure event, and illustrated the applicability of the proposed framework using a cable-stayed bridge case study. Catbas et al. [16] used SHM data to evaluate the main components’ reliability and system reliability of a long-span bridge, and incorporated temperature-induced responses into the analysis. The development of SHM technology has evolved from monitoring-based evaluation to monitoring-based prediction. Fan et al. [17] proposed a model for predicting structural extreme stress and reliability indices using SHM data, and verified the effectiveness and feasibility of the proposed model through monitored extreme stress data. Xu et al. [18] proposed a comprehensive framework for performance assessment of suspension bridges based on the analytical hierarchy process, and the analytic hierarchy model was constructed by integrating SHM data. Wan et al. [19] proposed a probabilistic prediction method of structural stress responses based on a Bayesian modeling approach with the help of SHM data. Patryk Kot et al. [20] summarized the recent advancements in non-destructive testing techniques—namely, sweep frequency approach, ground-penetrating radar, infrared techniques, fiber-optic sensors, camera-based methods, laser scanner techniques, acoustic emission, and ultrasonic techniques—by applying artificial intelligence. Although the SHM data on these mechanical parameters can update the prediction results of structural safety status, there are still uncertainties arising from errors in modelling and measuring [21]. Meanwhile, large-scale application of SHM in engineering structures would bring significant investments [22].
Considering the disadvantages of SHM systems, and the fact that not all bridges are equipped with them, field load testing is still an effective way to investigate the structural behavior of structurally complex bridges, and their performance can be evaluated with the aid of finite element models [23]. Fang et al. [24] used static field loading tests to investigate the static behavior of a long-span cable-stayed bridge in Taiwan; the results showed that the bridge had linear characteristics, and the analytical results were in good agreement with the test results. V. Romanova et al. [25] discussed experimental and numerical studies on deformation-induced surface roughening in a commercial-purity aluminum alloy. Vásárhelyi et al. [26] introduced the micro-computed tomography (CT) technique in detail. Ren et al. [27,28] conducted ambient vibration tests (AVTs) and finite element analysis of a cable-stayed bridge, and successfully identified the significant mode frequency of a long-span cable-stayed bridge below 1.0 Hz. Armendariz et al. [29] proposed an improved method for determining load rating based on field static load tests and finite element analysis. Compared with traditional methods, the improved method can provide more accurate load rating results for all limit states. Harris et al. [30] presented a performance evaluation method for steel–concrete composite beam bridge superstructures based on dynamic loading tests, and analyzed lateral load distribution, internal force redistribution, and dynamic load allowance. Ren et al. [31] carried out an experimental study on Qingzhou Bridge, and presented the results of static field loading tests and numerical analyses on deck displacement, tower displacement, and stresses of the bridge deck. The results showed that the bridge possessed an adequate load-carrying capacity. A significant number of studies have been devoted to the performance evaluation of complex bridge structures based on field load tests. Previous studies have made some contributions to the loading testing of long-span bridges, but there are still some disadvantages. Due to the complexity of cable-stayed bridges’ structure, most studies only focus on either static load testing or dynamic load testing. Moreover, the advanced level of instruments and equipment used in loading tests is not enough, leading to greater labor costs, and possibly causing large test error.
This study proposed a field-loading-test-based non-destructive performance evaluation method for long-span stayed-cable bridges, and carried out the experimental study of mode, displacement, strain, and cable force. The load test scheme and non-load test scheme were introduced in detail. Then, cable-stayed bridge in Guangxi with the largest span (Pingnan Xiangsizhou Bridge) was selected as a case study to illustrate the applicability of the proposed method. This proposed method can simultaneously analyze the static and dynamic characteristics of the complex long-span cable-stayed bridge, comprehensively test the key performance indices, and accurately evaluate the safety performance of the bridge system. The reasonable test method and specific test scheme, as well as advanced, high-precision testing instruments, were adopted in order to obtain reliable test results. The findings of this study can provide reference for the non-destructive testing research of long-span cable-stayed bridges.

2. Non-Destructive Field Loading Test for Pingnan Xiangsizhou Bridge

2.1. Objective of Non-Destructive Field Loading Tests

The purpose of the field loading test was to ascertain the bearing capacity and predict the future reliability of Pingnan Xiangsizhou Bridge. The specific objectives of the load test included:
(1)
Defining the real load of the bridge under static load conditions;
(2)
Verifying the rationality of the design, and providing reference for similar bridge design;
(3)
Verifying the validity of the finite element model, which provides the basis for the model’s improvement and optimization;
(4)
Providing data for bridge monitoring and maintenance.
For cable-stayed bridges, loading on the main girder is transferred to the piers and tower through the stay cables. Thus, the structural responses of the main girder and the stay cables are critical in the process of bridge operation. Therefore, the main measurement tasks of the load test of Pingnan Xiangsizhou Bridge included deflection and strain testing of the main girder, strain testing of the cable tower, and cable force testing.

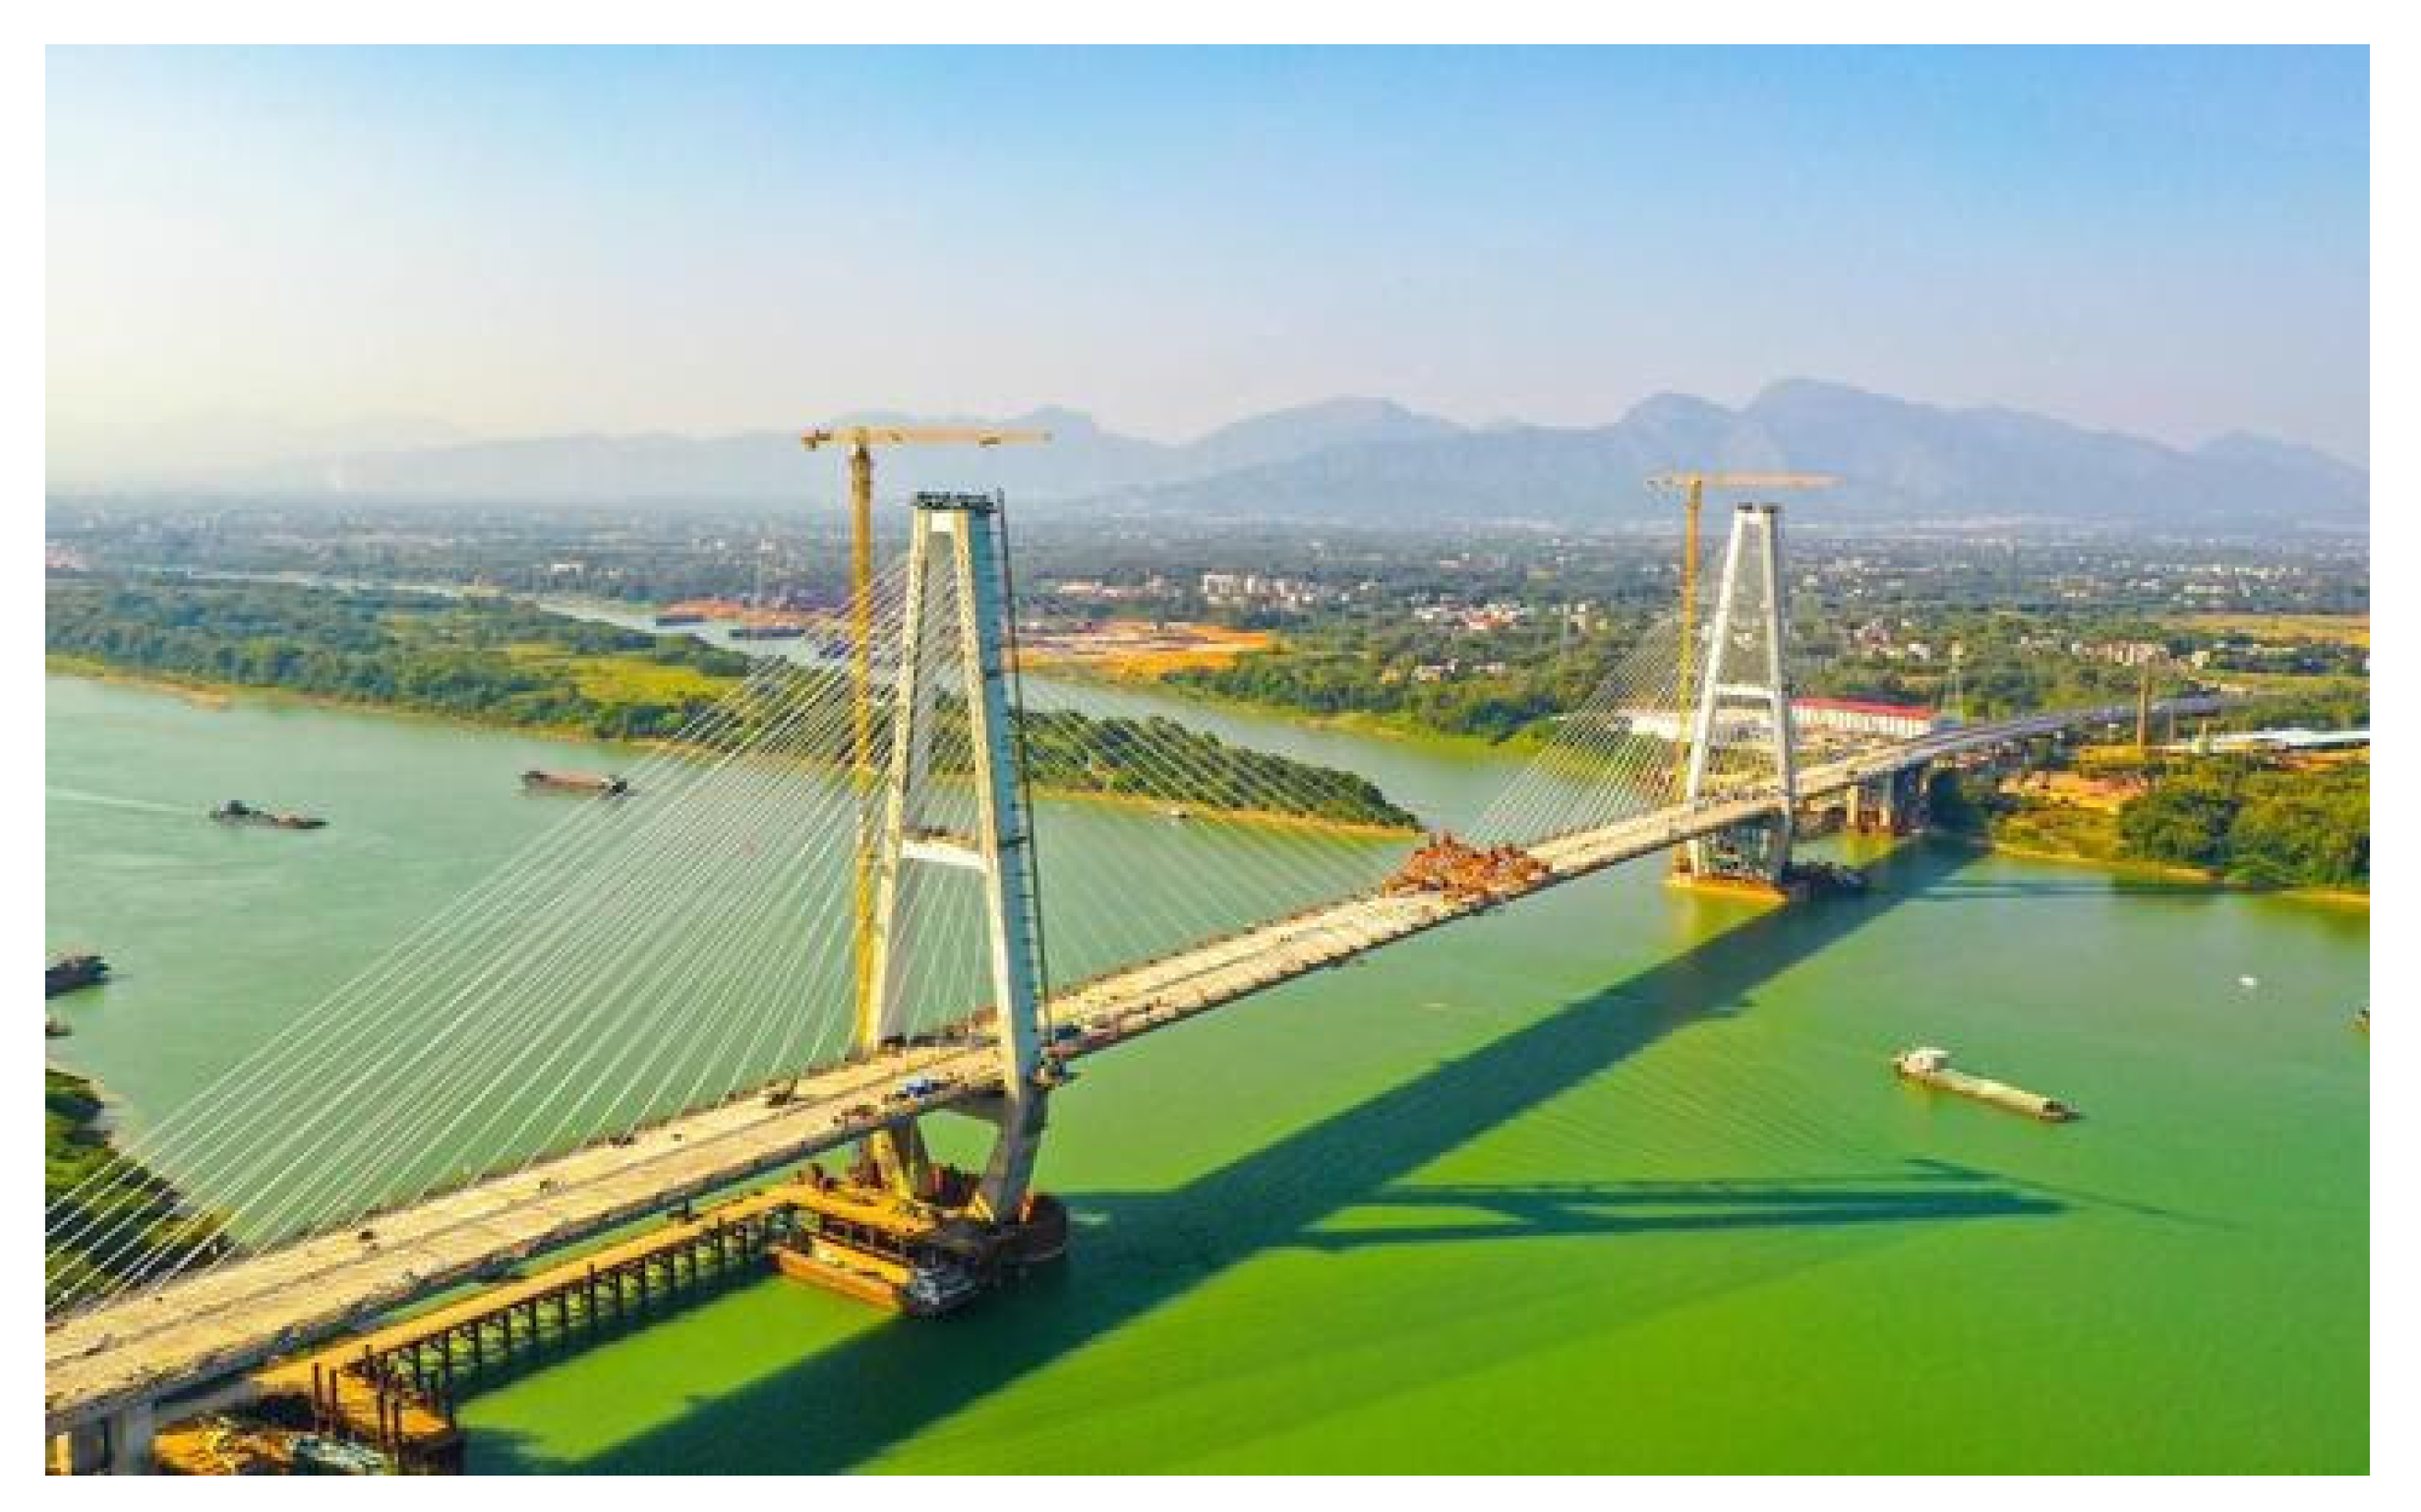
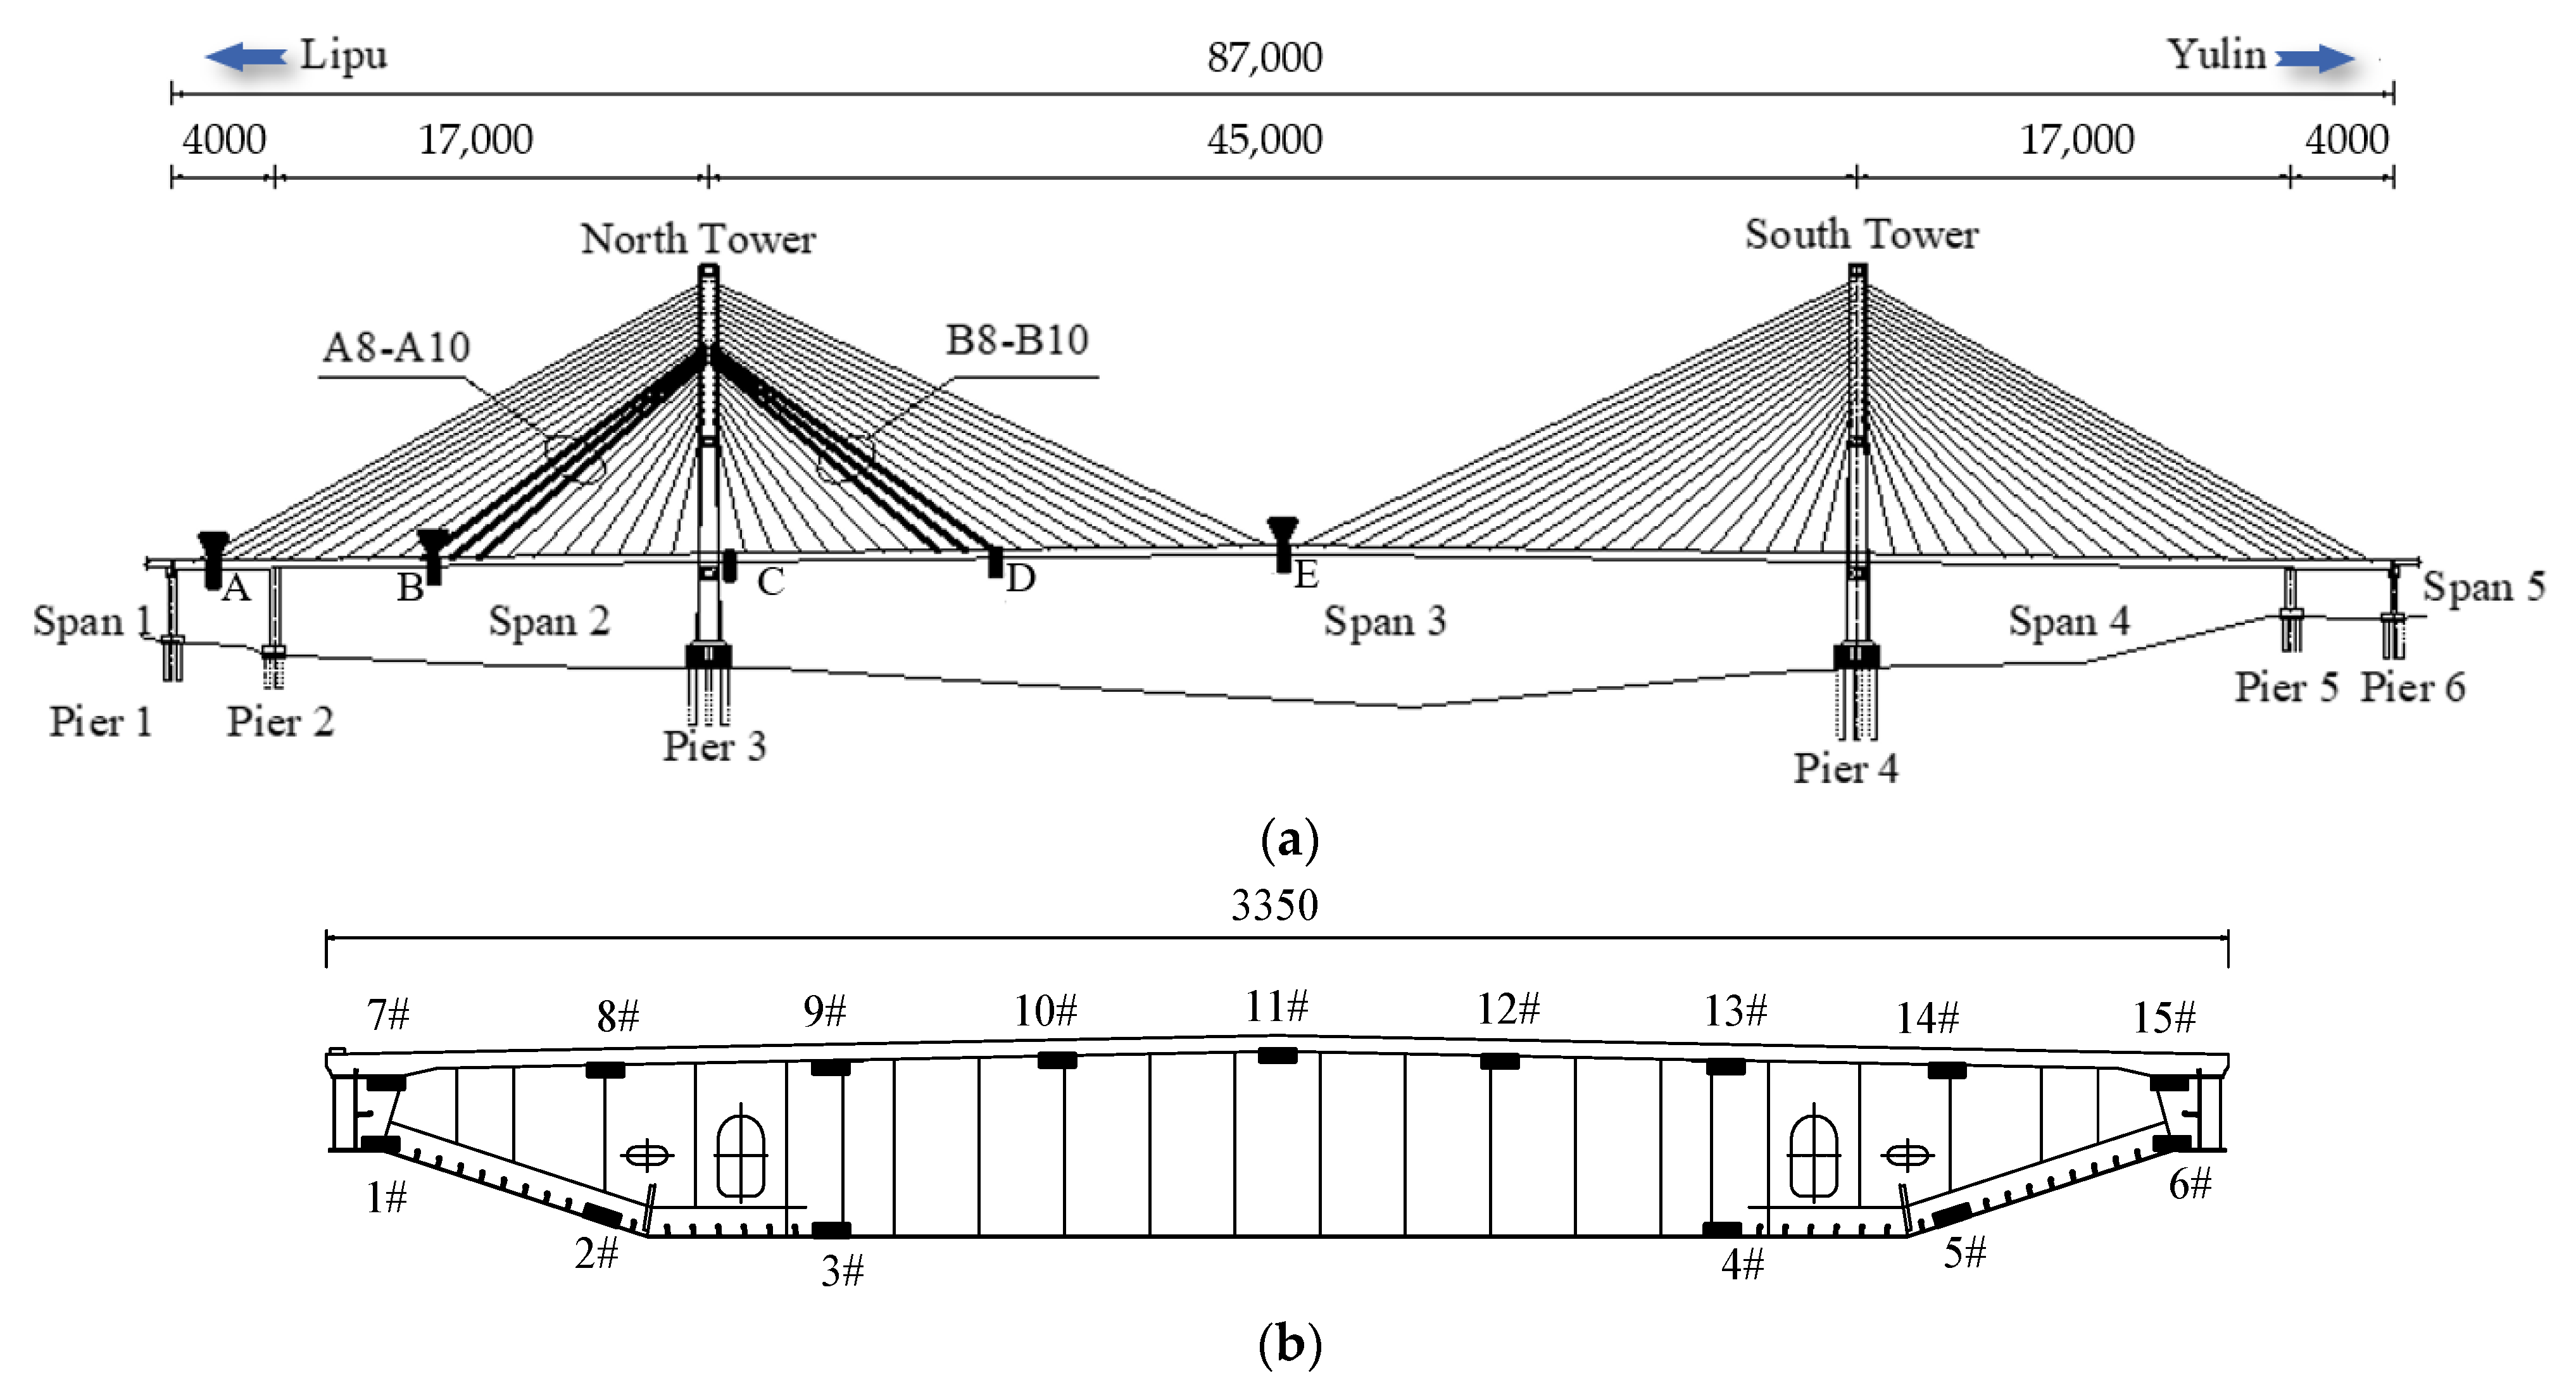
2.2. Structural Features of Pingnan Xiangsizhou Bridge

Pingnan Xiangsizhou Bridge spans over the Xun Jiang River in China, and it is the cable-stayed bridge with the largest span in Guangxi Province. The structure of Pingnan Xiangsizhou Bridge is shown in Figure 1. The main span is a semi-floating cable-stayed structure with two towers and two cable planes. The total length of the bridge is 870 m (i.e., 40 m + 170 m + 450 m + 170 m + 40 m). The bridge deck is divided into four two-way lanes, with a full width of 33.50 m. The design speed is 120 km/h. The main structural features of the bridge are as follows:
  • The stay cables of the bridge are fan-shaped, with two cable planes in space; 20 pairs of cables are arranged on both sides of the main tower, with a total of 80 pairs of cables on the whole bridge. The stay cables are anchored by steel anchor beams on the towers, and by anchor plates on the beams. All stay cables are tensioned on the tower;
  • The bridge tower is diamond shaped. An upper beam is set on the top of the tower connecting the two tower columns. In order to strengthen the lateral stability of the cable tower, a middle beam is set. The elevation of the top of the bearing platform is 21.20 m, the elevation of the tower base is 23.20 m, and the elevation of the top of the tower is 170.50 m. The total height of the cable tower above the tower base is 147.30 m. The heights of the lower, middle, and upper tower columns are 26.186 m, 51.375 m, and 69.739 m, respectively;
  • The bridge deck is paved with asphalt concrete with a thickness of 10 cm. Column-type crash barriers are set on both sides of the carriageway. Sidewalks and maintenance railings are set on both sides of the bridge deck.

2.3. Non-Destructive Field Loading Test for Pingnan Xiangsizhou Bridge

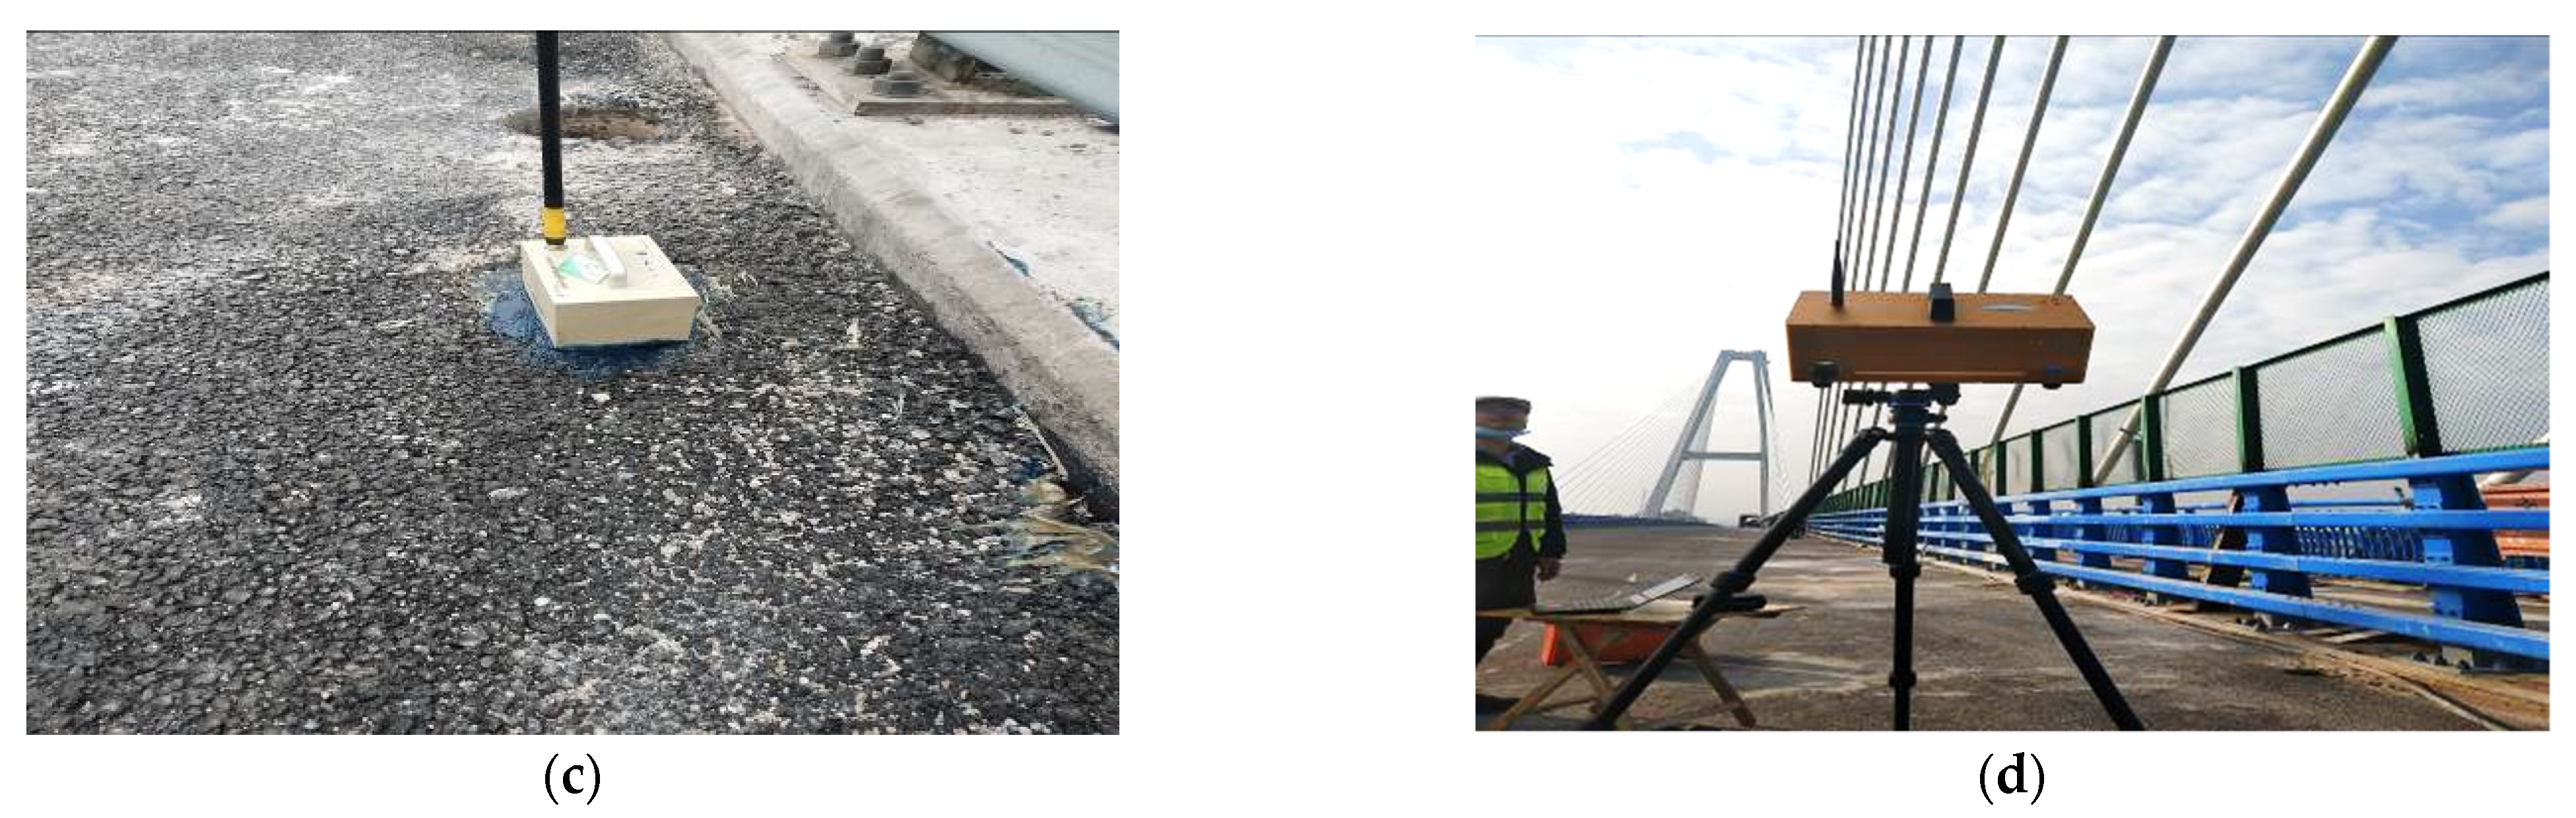
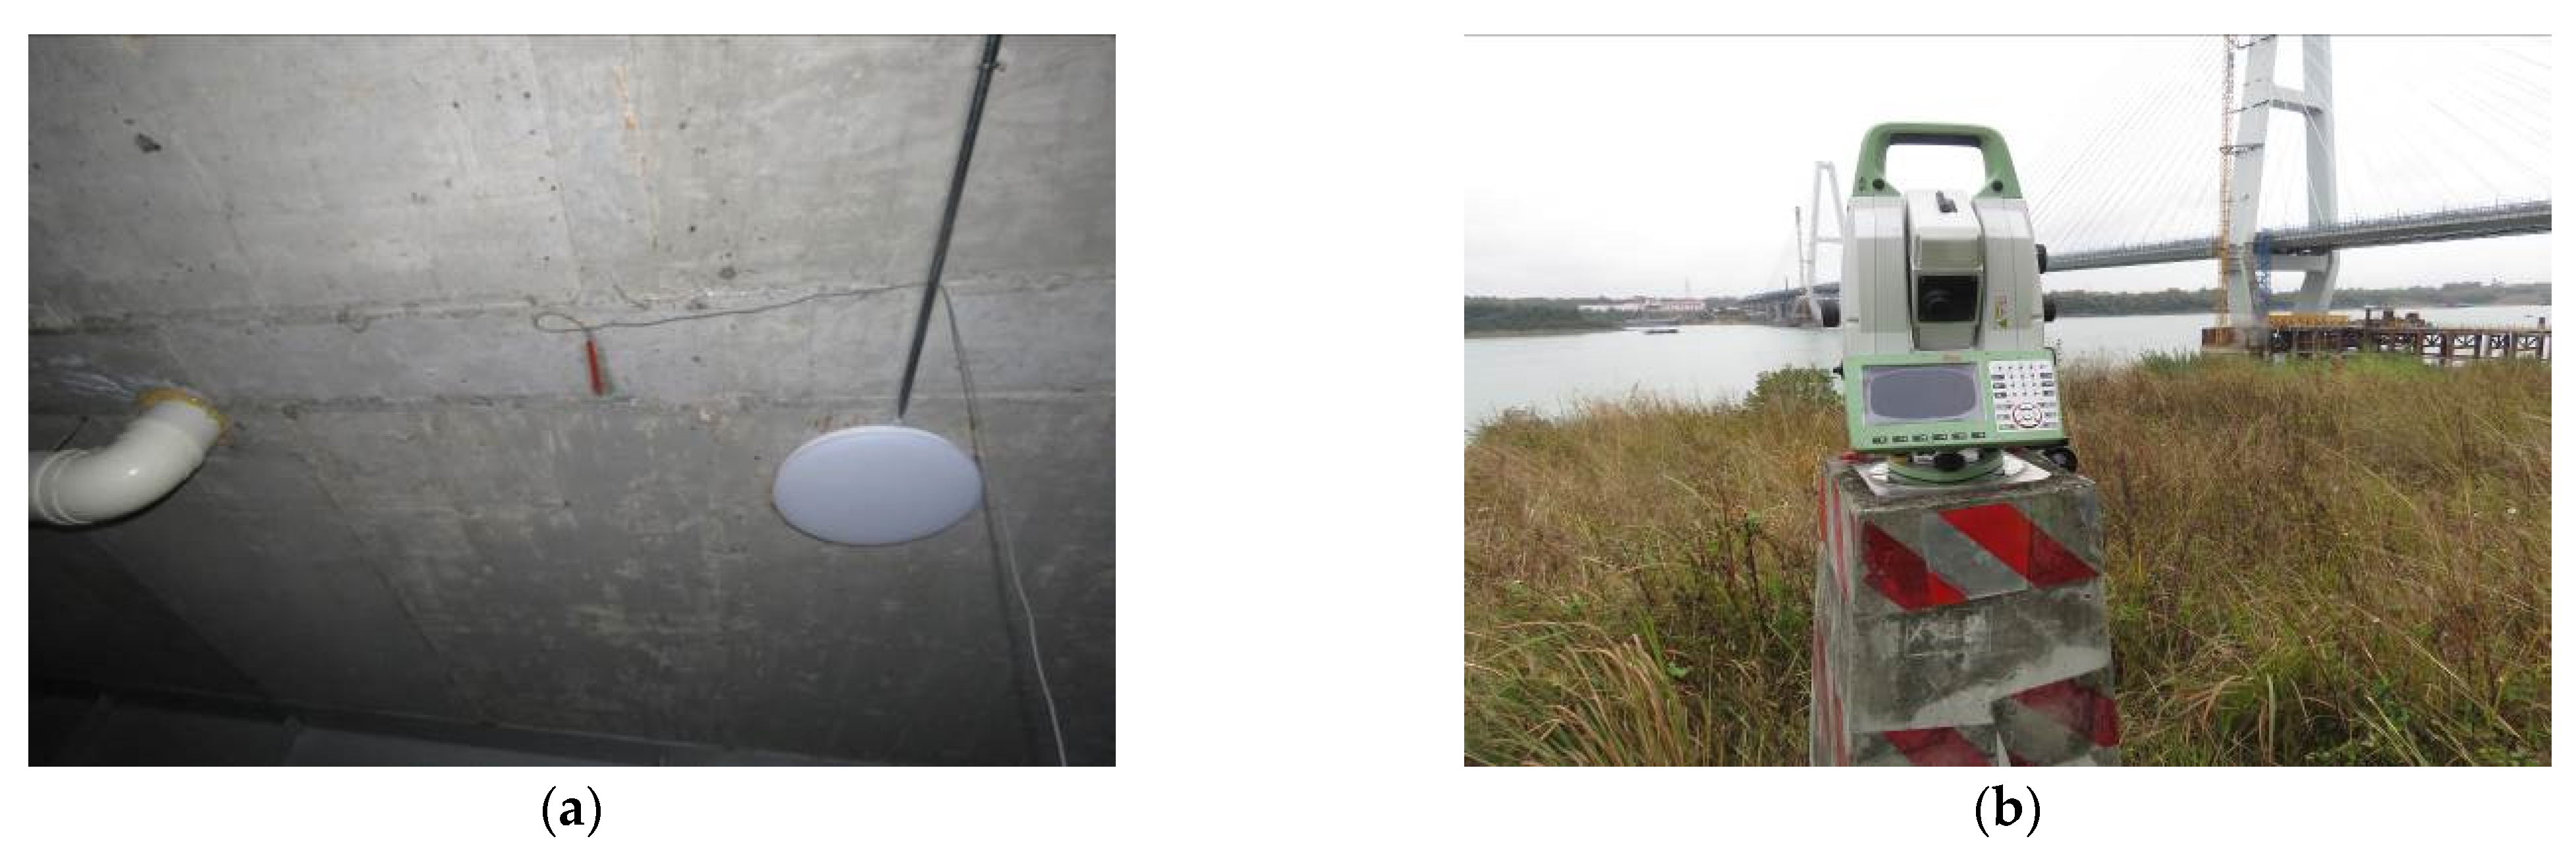
2.3.1. Non-Destructive Field Loading Test Instrumentations

The instruments for measuring strain, deflection, frequency, and cable force are shown in Figure 2. A multifunctional static strain test system was used in the bridge strain test. Each data acquisition module can measure 16 measuring points, and the communication distance between modules can reach up to 500 m. Eight test systems were used in the test. The deflection of the main girder was monitored by an electronic total station. Reflective lenses were installed at the test points, and the changes in elevation—and thus, deflection—at these test points were collected during the loading tests. Frequency was extracted using the wireless bridge modal test and analysis system. A high-communication-rate mode was used. Cable force was measured via radar interferometric deformation measurement technology, which extracts the frequency information of the received time signal via filtering and Fourier transform.

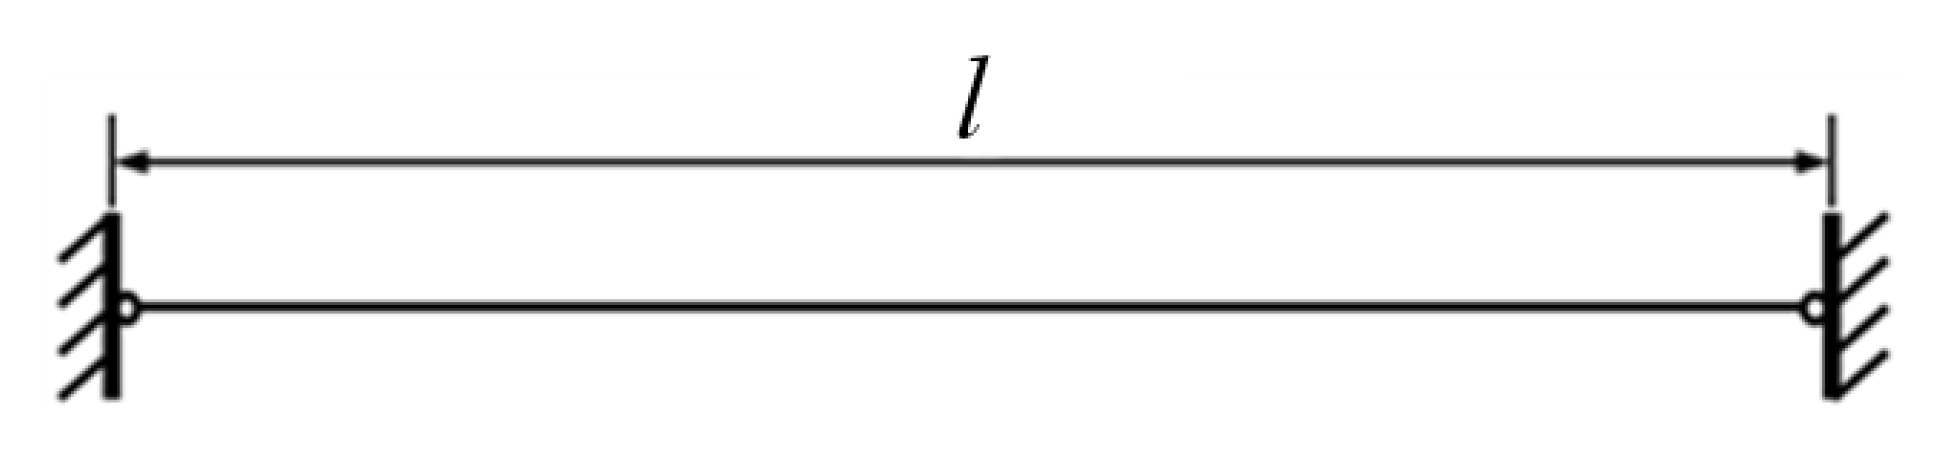
2.3.2. Cable Force Test and Principle in Non-Destructive Field Loading Test

According to the vibration theory, the relationship between the tension of the cable and its natural frequency for long cables hinged at both ends, as shown in Figure 3, can be written as:
ω n r 2 = π 2 r 2 T ρ l 2 + E I ρ ( π r l ) 4 ,
where ωnr is the r-th natural frequency (rad/s), T is the tension of the cable (N), l is the length of the cable (m), ρ is the density of the cable (kg/m), E is Young’s modulus (Pa), and I is the moment of inertia (kg·m2).
When the bending stiffness of the cable can be ignored, the relationship between the tension of the cable and its natural frequency becomes:
ω n r 2 = π 2 r 2 T ρ l 2 ,
and then the tension of the cable can be obtained via the following equation:
T = ω n r 2 ρ l 2 π 2 r 2 ,
Equation (2) can be further rewritten as:
ω n r = π r l T ρ ,
Thus, the following Equation (5) can be obtained:
ω n r ω n r 1 = π l T ρ ,
that is, the difference between two adjacent natural frequencies is a constant, and is equal to the first natural frequency. This characteristic is reflected as equally spaced peaks on the spectrum. According to the Equation (3), as long as any natural frequency of the cable is measured, the tension of the cable can be calculated.

2.4. Structural Theoretical Calculation for Pingnan Xiangsizhou Bridge

2.4.1. Geometric and Physical Parameters of Pingnan Xiangsizhou Bridge

The main beam adopts a split double-box composite beam section, in which the bridge deck of the composite beam is composed of C55 concrete (Elasticity modulus: Ec = 3.55 × 10⁴ MPa, bulk density: γ = 26 kN/m3) and the main body of the steel beam is composed of Q345C steel (Es = 2.06 × 10⁵ MPa, γ = 78.5 kN/m3). The center height of the composite beam is 3.50 m, the top plate is provided with 2% cross slope, the bottom plate is horizontal, and the full width of the main beam is 33.50 m. The stay cable adopts a parallel steel strand cable system. The cable body is composed of multiple unbonded high-strength galvanized steel strands with a tensile strength of 1860 MPa, and the outer layer is equipped with a high-density polyethylene (HDPE) cable sleeve. The cable tower uses a diamond-type cable tower structure and C50 concrete (Ec = 3.45 × 10⁴ MPa, γ = 26 kN/m3). The total height of the cable tower above the tower base is 147.30 m. C30 concrete (Ec = 3.0 × 10⁴ MPa, γ = 26 kN/m3) is used for the capping beam, transition pier body, auxiliary pier body, and bearing platform.

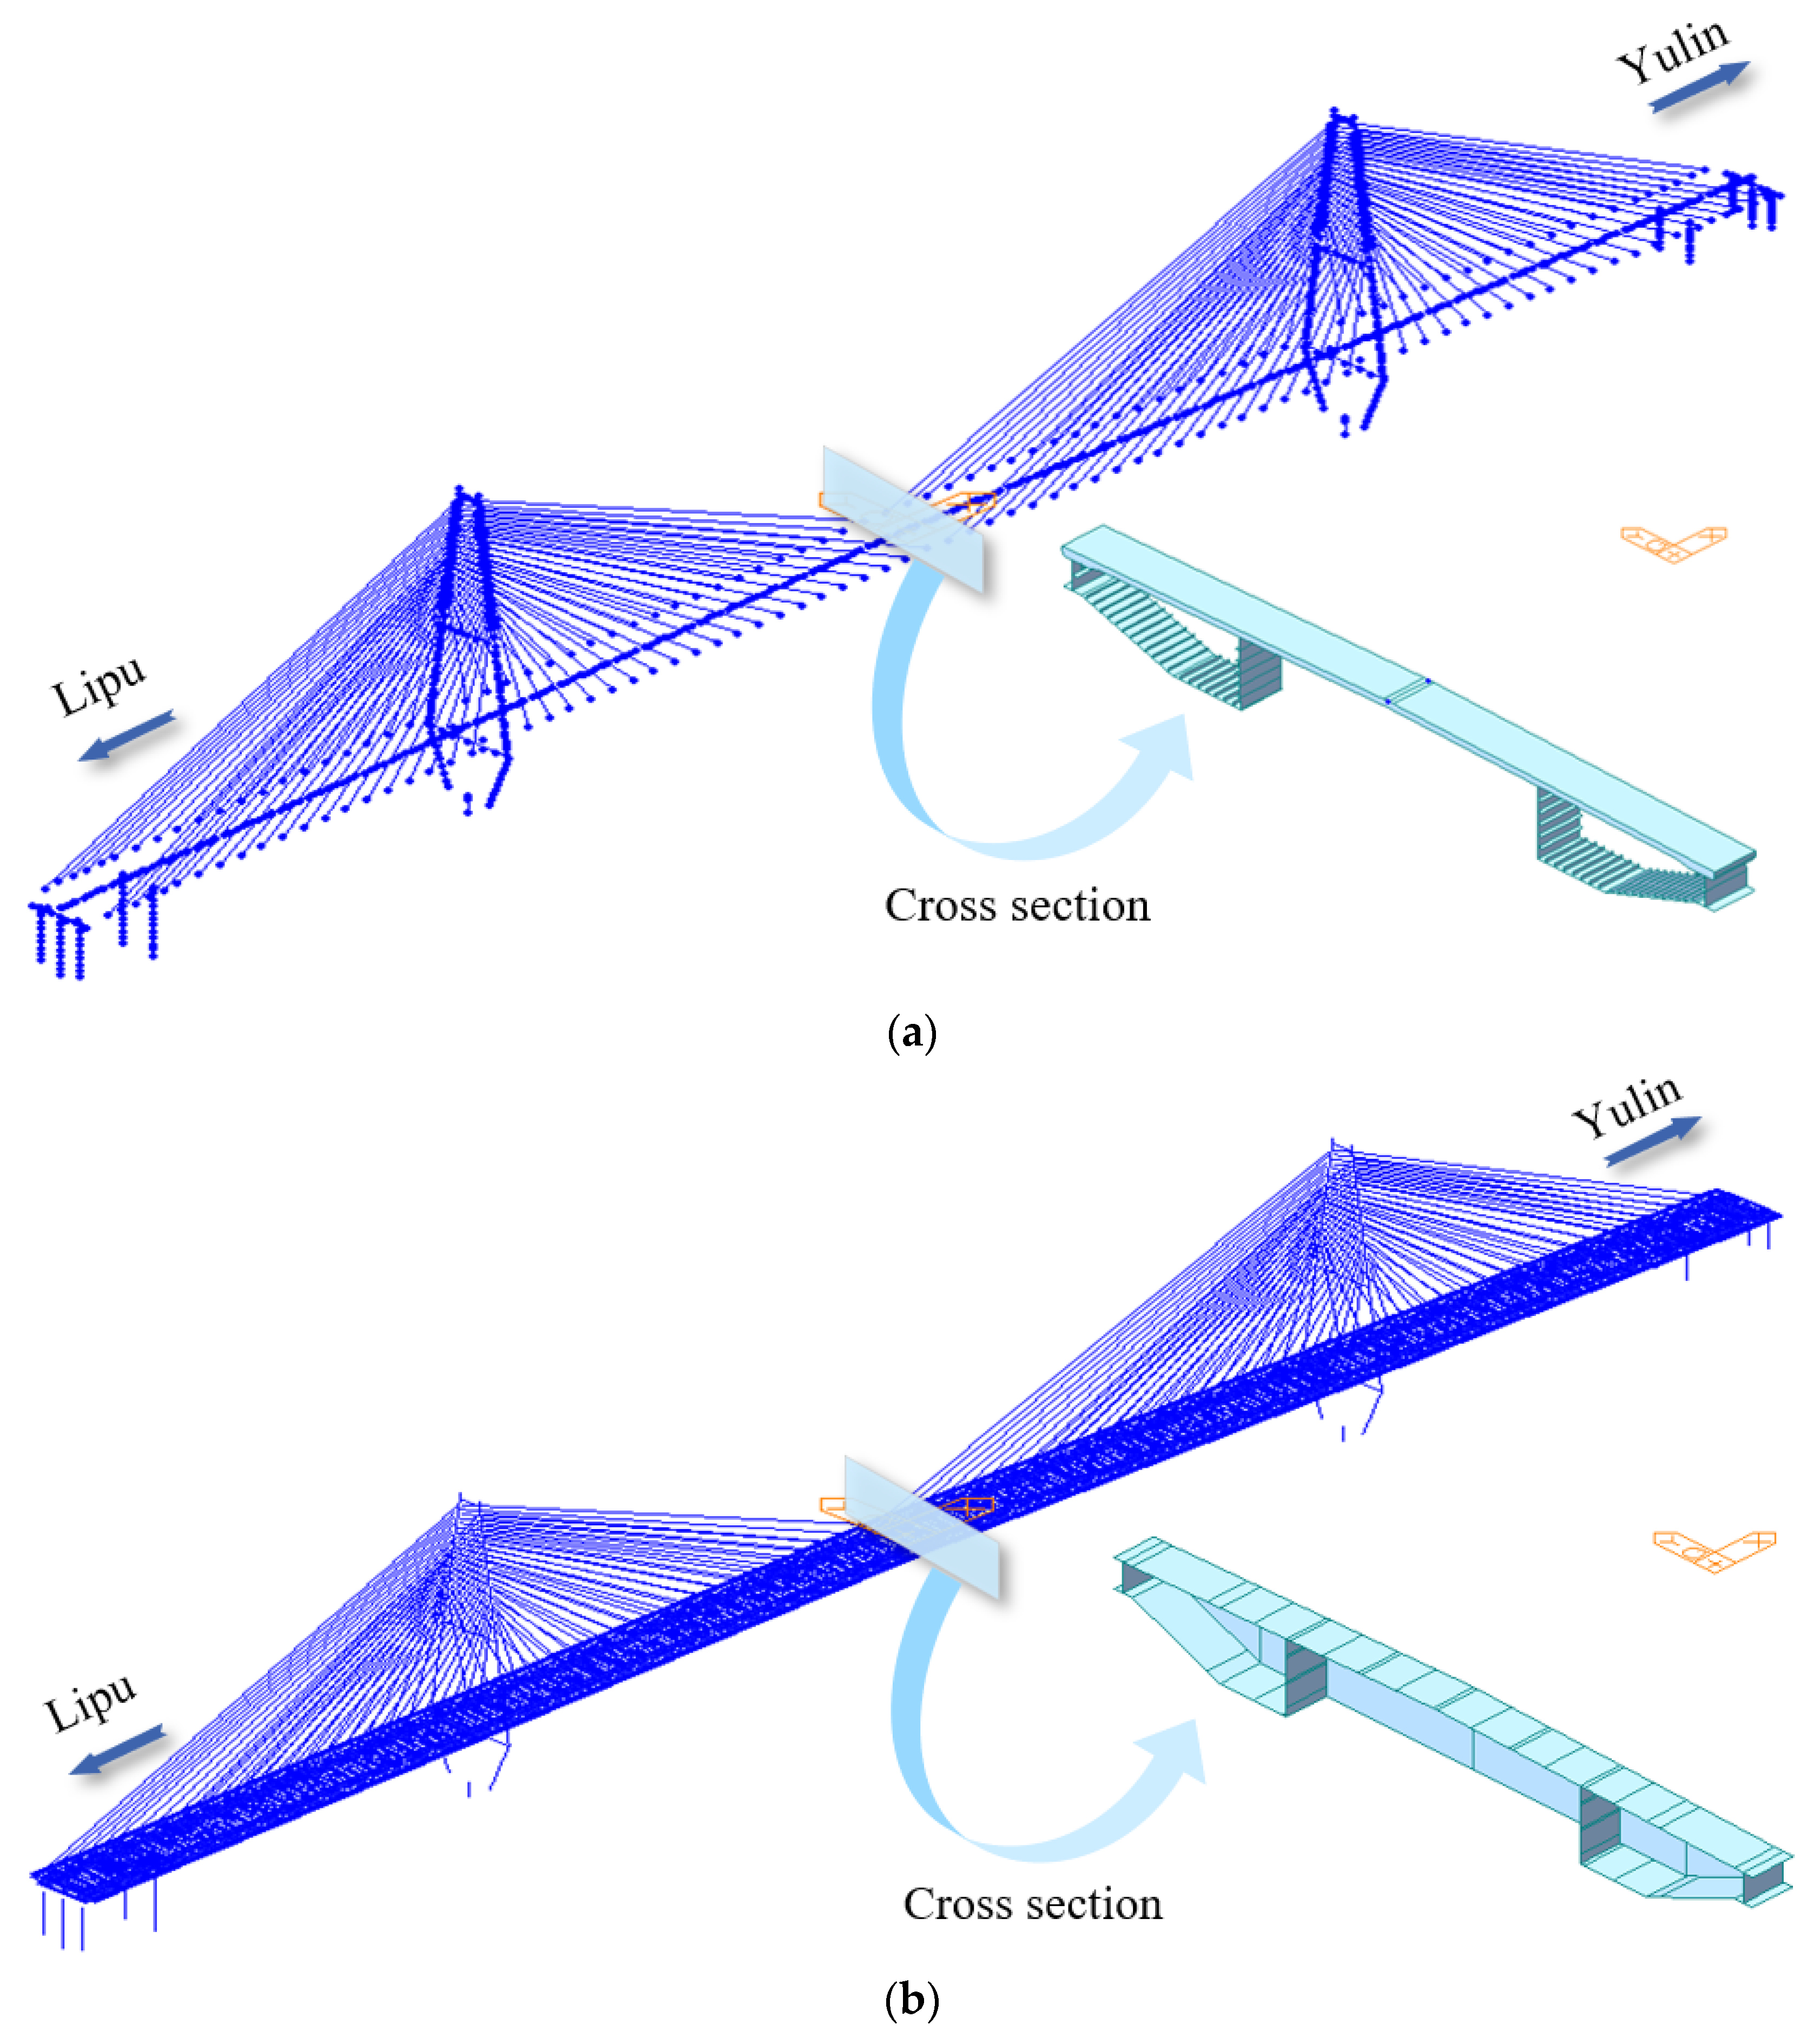
2.4.2. Establishment of a Finite Element Model for Pingnan Xiangsizhou Bridge

The finite element model of Pingnan Xiangsizhou Bridge could be established by using the general spatial finite element analysis software MIDAS/Civil, with the functions of linear analysis and nonlinear analysis [32]. Based on the “single-beam model”, the structural internal force of the bridge structure under the control load could be extracted, and the static load test condition was also designed. Based on the “plate element model”, the calculated deflection, strain, and cable force of the test section of the bridge structure under the test load were extracted for comparison with the measured results. The finite element models are shown in Figure 4. In the finite element model, ordinary reinforcement and steel strands are not considered in sections, which may cause the stiffness of the finite element model to be less than that of the actual bridge. However, this stiffness difference would be considered in the performance evaluation, and should not affect the accuracy of the bridge safety performance evaluation results. The single-beam model consists of 1064 nodes and 875 elements, of which the truss element is used for the stay cable, while the beam element is used for other components. The plate element model consists of 19,129 nodes and 20,946 elements, of which the steel–concrete composite girder uses the plate element, the stay cable uses the truss element, and other components use the beam element. The bottom of the pier has rigid nodes, which constrain all of the degrees of freedom. An elastic connection is adopted between the main beam and the bridge pier, and the corresponding stiffness and constraints are set according to the parameters and specifications of the beam in the design drawing. The following assumptions are adopted in modeling:
  • Concrete and steel are ideal elastic materials, and the elastic moduli of the concrete and steel of the new bridge are constant, being essentially consistent with the design values;
  • The section deformation of the beam element conforms to the plane section assumption;
  • Deformation coordination between the bridge’s concrete deck and the main beam’s steel plate, and there is no relative slip between the deck and the main beam.
According to the Chinese standard “General specifications for design of highway bridges and culverts” (JTG D60-2015), lane load (Highway Class I) and vehicle load should be considered in the test control load. When calculating the load distribution for 1~6 lanes, the lane transverse reduction coefficients are 1.20, 1.00, 0.78, 0.67, 0.60, and 0.55, respectively. Since the maximum span of the bridge is 450 m, which is greater than 150 m, the longitudinal reduction coefficient is 0.96. The impact coefficient of the local load of vehicle load is 0.3; the impact coefficient (μ) is calculated according to the following equation:
{ μ = 0.05 , f < 1.5 Hz μ = 0.1767 ln f 0.0157 , 1.5 Hz f 14 Hz μ = 0.45 , f > 14 Hz ,
where f is the structural fundamental frequency (Hz).

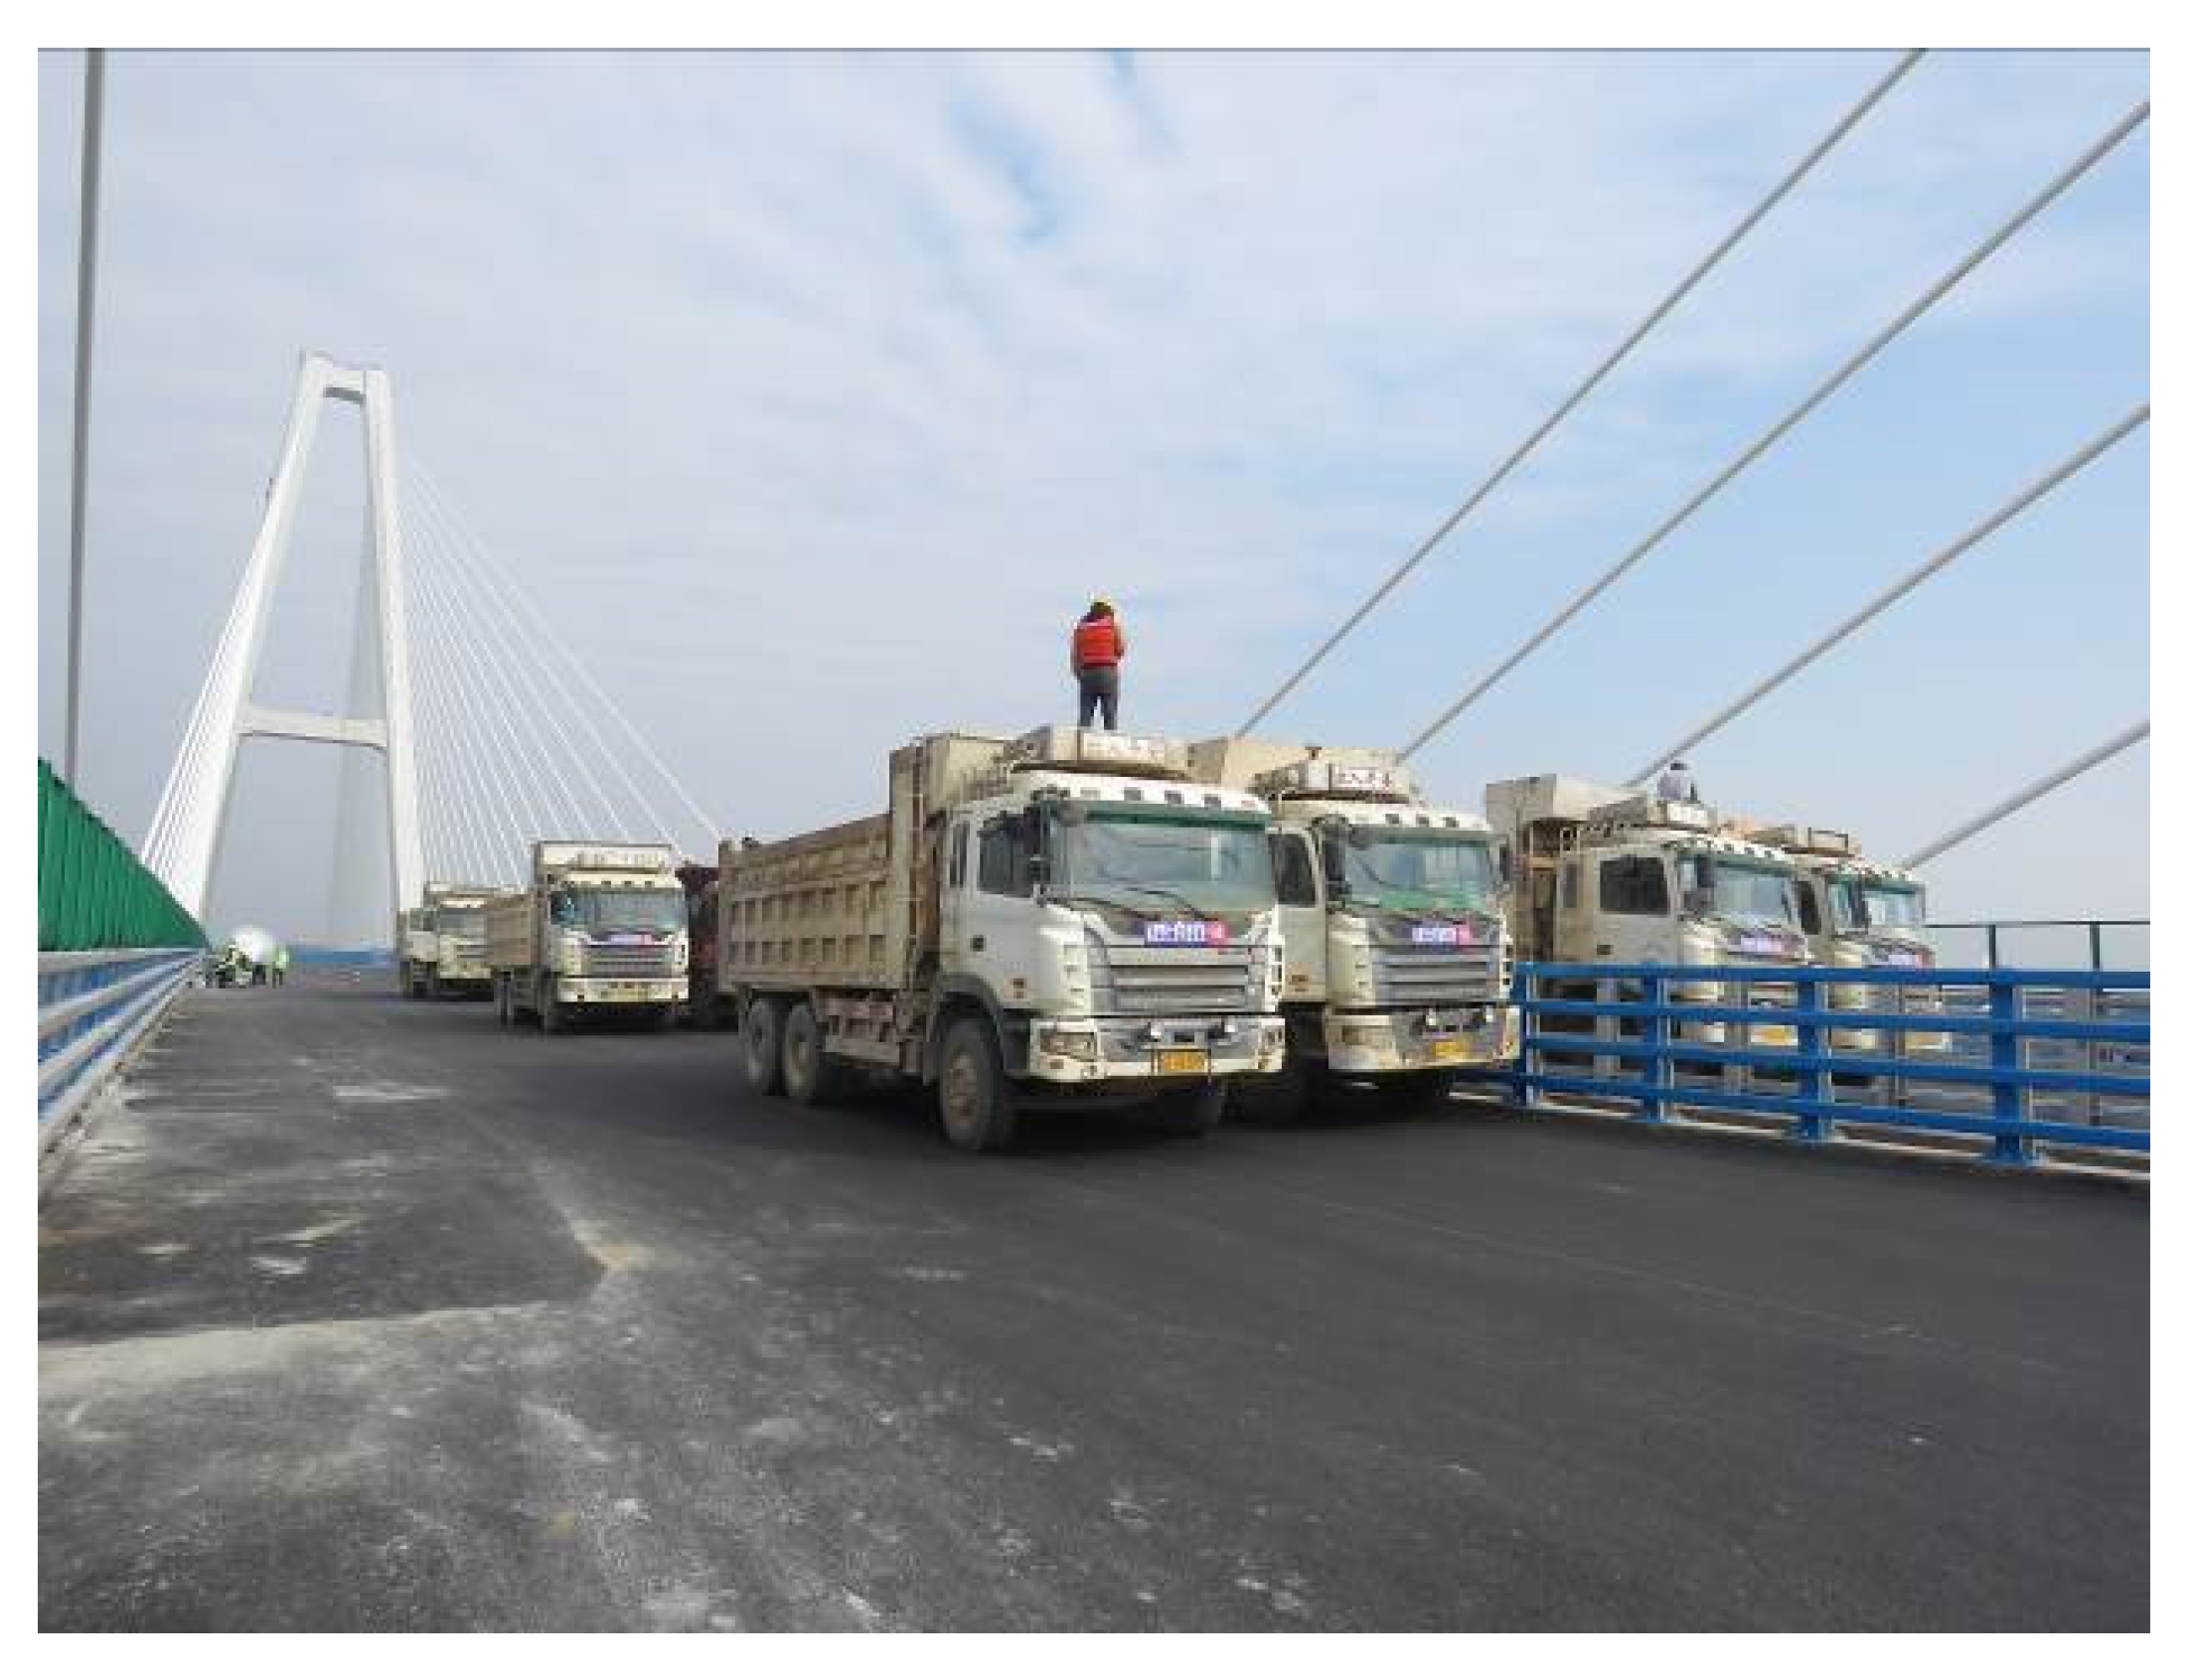
2.5. Field Loading Test Conditions and Loading Arrangement

Pingnan Xiangsizhou Bridge is a longitudinal symmetrical structure. Therefore, spans 1–3 shown in Figure 5a were selected for further analysis. Measurement data from a total of five sections of the main girder—numbered from position A to position E, as shown in Figure 5a—were selected for strain and deflection analysis. A total of 10 loading cases were designed, including centric loading and eccentric loading, where vehicles are deviated to the left side of the bridge in eccentric loading cases. The layout of a standard cross-section of the main beam is shown in Figure 5b. The detailed loading test setup and sensor instrumentation layout of all loading cases are shown in Figure 6 and Table 1, respectively. In Figure 5a, “▐” represents the position of the moment control section, while “▼” represents the position of the vertical deflection control section of the main girder.
According to the Chinese standard “Load test methods for highway bridges” (JTG/T J21-01–2015), the load efficiency of the static load test should be 0.85~1.05 for completion acceptance load tests; otherwise, it should be between 0.95 and 1.05. The load efficiency (ηq) of the static load test can be calculated according to Equation (7):
η q = S s S ( 1 + μ ) ,
where S is the calculated value of the most unfavorable effect generated by the control load, S(1 + μ) is the calculated effect value of the control load, and SS is the calculated effect value of the test load.
In the table above, the bending moment unit is kN·m, and the lower edge of the section is positive in tension and negative in compression. The displacement unit is mm, which is positive upward and negative downward. The unit of cable force increment is kN, which increases to be positive and decreases to be negative. The stress unit is MPa, and the tensile stress is positive while the compressive stress is negative. In Table 1, S(1 + μ) is the calculated effect value of the control load, SS is the calculated effect value of the test load, and ηq is the load efficiency.
A total of 24 three-axle trucks were used in the field loading test, and the technical parameters of the used vehicles are shown in Table 2.

3. Experimental Results and Analysis

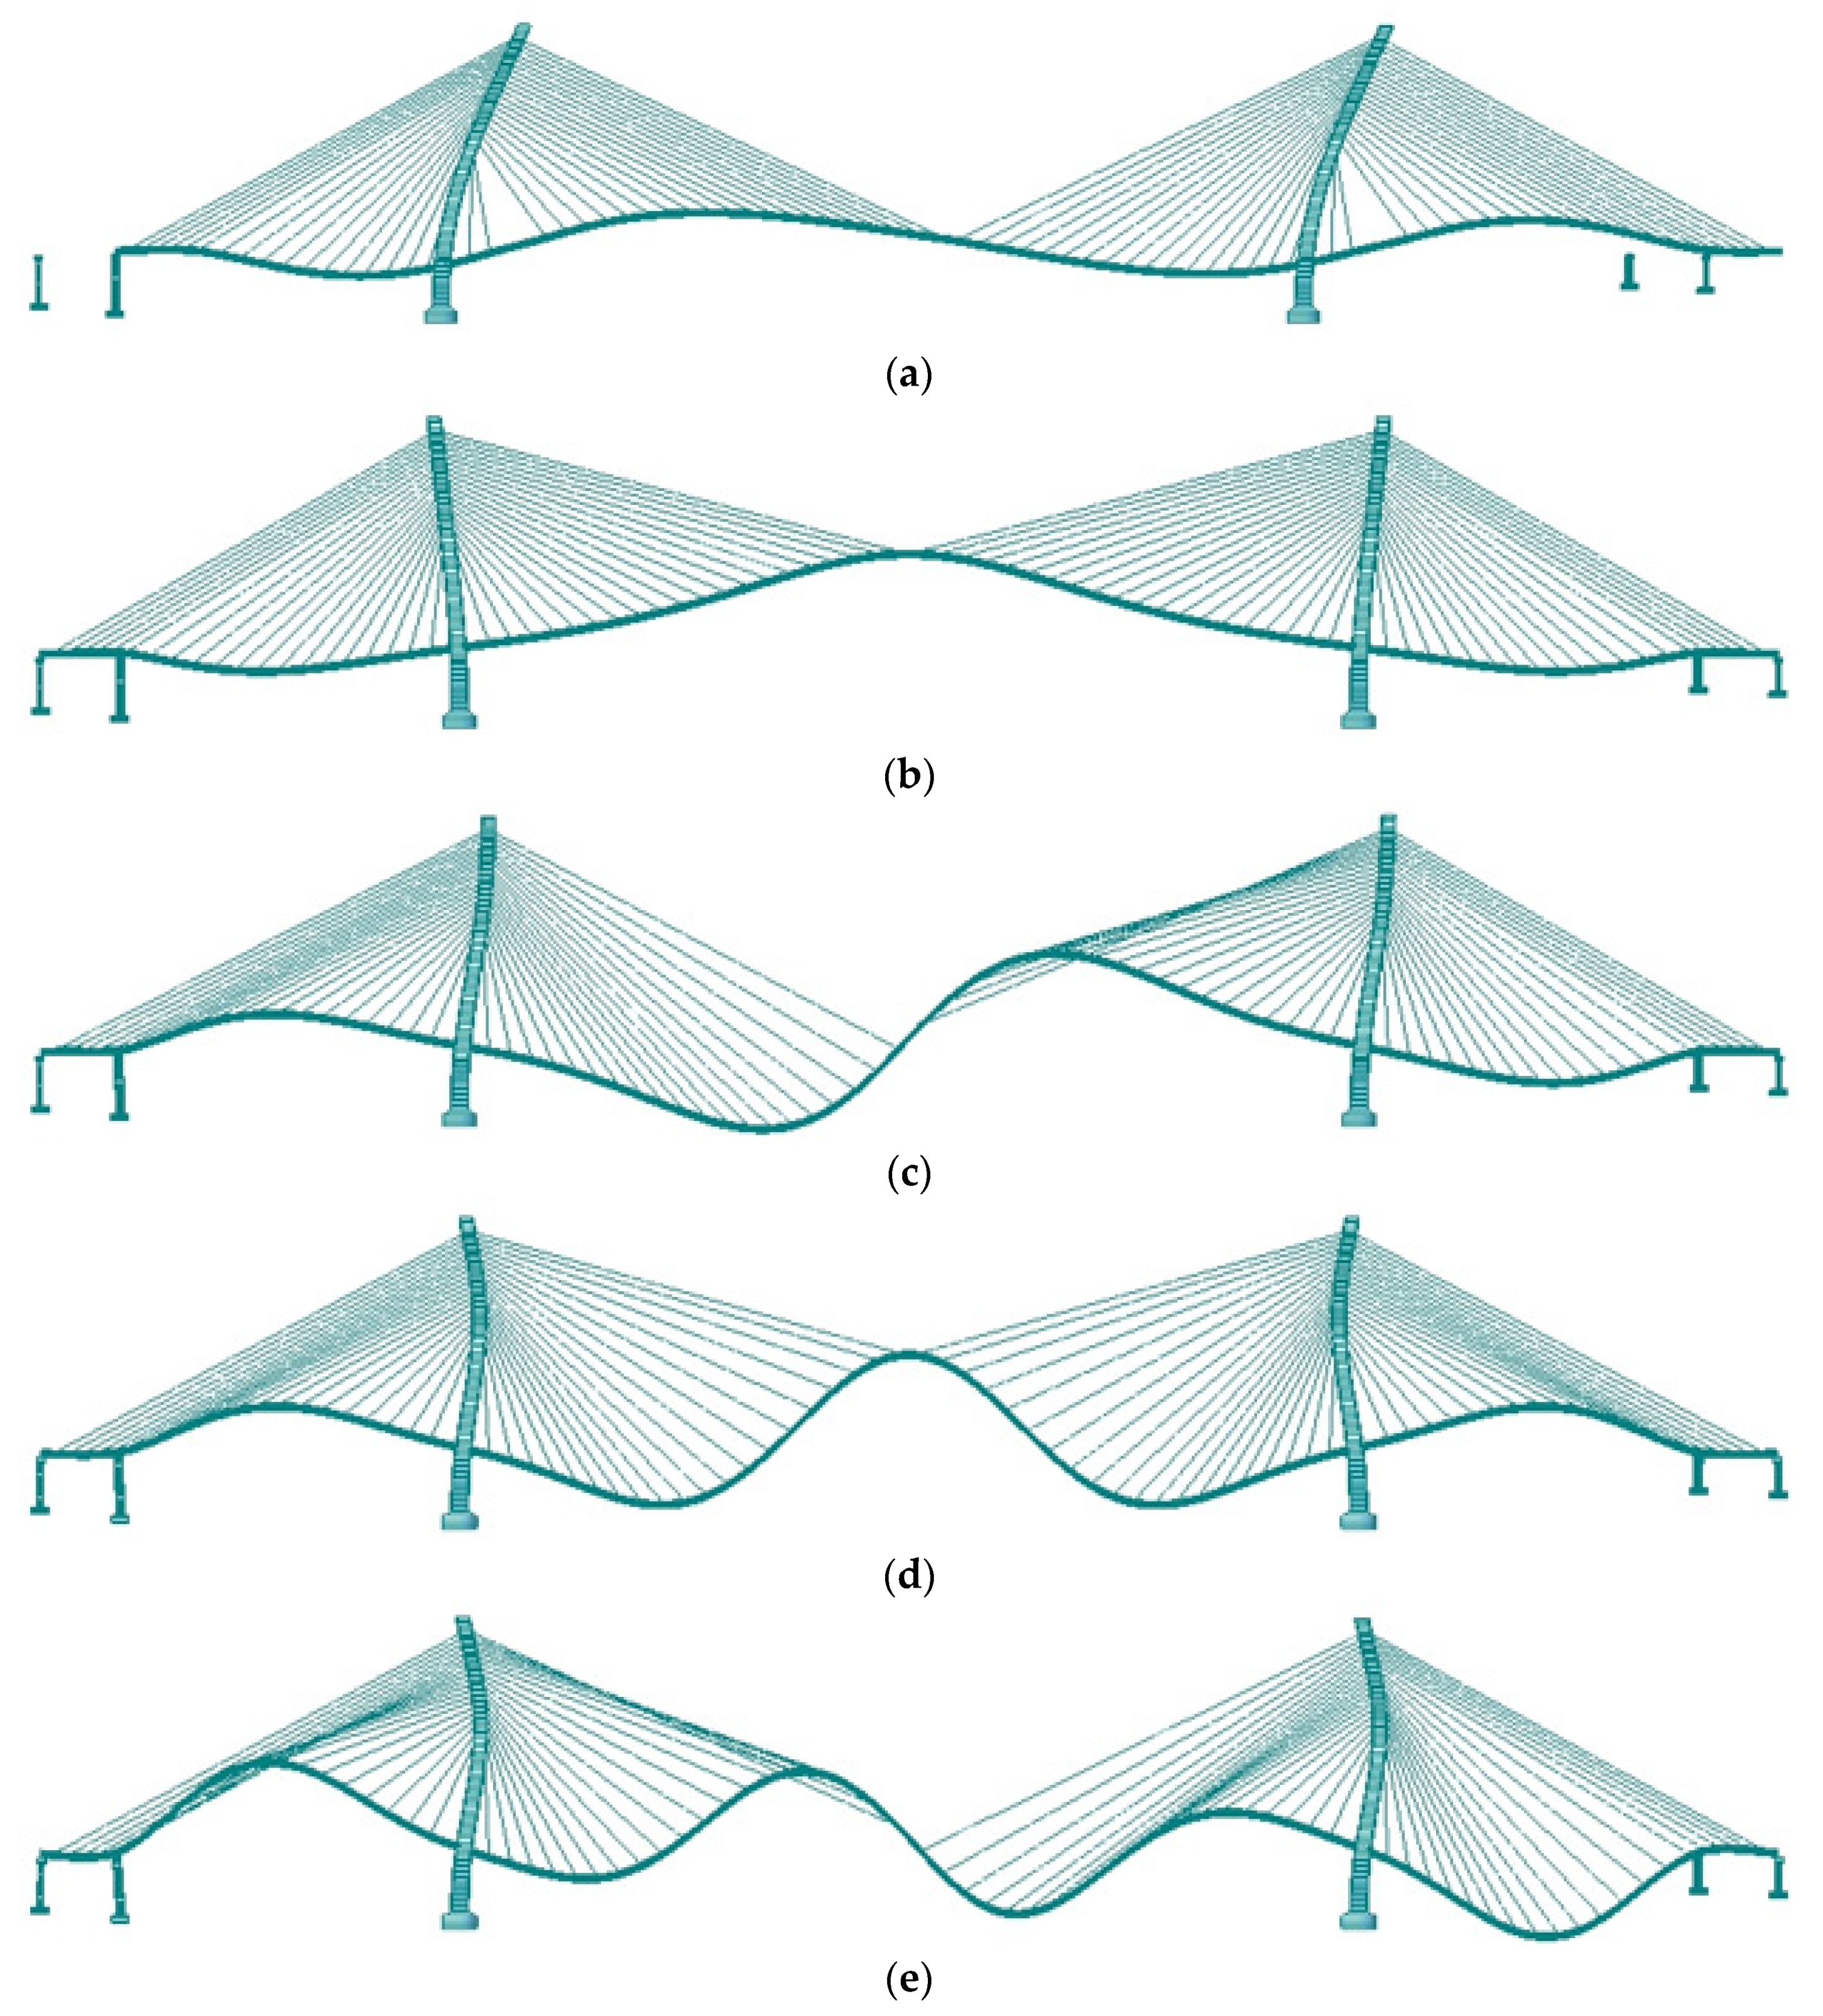
3.1. Vibration Mode and Frequency Analysis for the Field Loading Test of Pingnan Xiangsizhou Bridge

The dynamic characteristics of Pingnan Xiangsizhou Bridge were investigated according to the ambient vibration tests method introduced above. According to the finite element calculation results, the first four vertical bending vibration modes and the first transverse bending vibration mode of the main bridge of Pingnan Xiangsizhou Bridge are shown in Figure 7, and the experimental results are compared with the three-dimensional finite element analysis results, as shown in Table 3.
As can be seen from Table 3, the experimental results of vibration frequencies of Pingnan Xiangsizhou Bridge in the first four vibration modes vary from 0.313 Hz to 0.85 Hz, and the numerical results of frequencies vary from 0.303 Hz to 0.683 Hz for the finite element model, showing good consistency. The vibration frequency difference between the first vertical bending vibration mode and the second vertical bending mode is less than 0.01 Hz. In addition, it can be seen that the experimental vibration frequencies are slightly larger than the analytical numerical results of the finite element model, which may have been caused by systematic errors. Meanwhile, during the entire non-destructive field loading test for Pingnan Xiangsizhou Bridge, the vibration mode shape of vertical bending is easier to identify than the vibration mode shape of transverse bending.

3.2. Displacement Analysis for the Field Loading Test of Pingnan Xiangsizhou Bridge

The calibration coefficient (η) is an important index to evaluate the bearing capacity and working state of a bridge. If η is greater than 1, the structural design strength is considered to be insufficient and unsafe. The calibration coefficient (η) for the field loading test of Pingnan Xiangsizhou Bridge was calculated using Equation (8):
η = VC/VD,
where VC is the tested result and VD is the designed value.
In order to compare the experimentally measured displacement results and the theoretically calculated displacement values, the six loading cases listed in Table 1 were selected, and the displacement of the main girder for Pingnan Xiangsizhou Bridge under the six loading cases was also analyzed. The comparison results of the displacement values and calibration coefficients are shown in Table 4.
As shown in Table 4, according to Case No. 1, the calculated displacement on the left side of the bridge section at the maximum positive moment of the first span for Pingnan Xiangsizhou Bridge under symmetrical load was 6.73 mm, and the corresponding measured displacement was 4.5 mm. On the other hand, the calculated displacement on the right side of the bridge section for Pingnan Xiangsizhou Bridge was 6.73 mm, and the corresponding measured displacement was 4.28 mm. It can be seen from Table 4 that the experimentally measured displacement values on both sides of the bridge section were less than the theoretically calculated displacement values; this is because ordinary reinforcement and steel strand were not considered in the finite element model established for the bridge loading test, leading to the projected stiffness in the finite element model being less than that of the actual bridge; therefore, the experimentally measured displacement and strain values were smaller than the theoretically calculated values. At the same time, the corresponding calibration coefficients of both sides for Case No. 1 were 0.67 and 0.64, which are less than 1. For Case No. 2, the experimentally calculated displacement on the left side of the bridge section at the maximum negative moment of the first span for Pingnan Xiangsizhou Bridge under eccentric load was 7.24 mm, and the corresponding theoretically measured displacement was 4.18 mm. Meanwhile, it can be seen that the theoretically calculated displacement on the right side of the bridge section for Pingnan Xiangsizhou Bridge was 5.03 mm, and the corresponding experimentally measured displacement was 2.91 mm. The corresponding calibration coefficients of both sides for Case No. 2 were 0.58, which are also less than 1. The above displacement analysis results show that the first span of Pingnan Xiangsizhou Bridge has greater stiffness than its designed value.
Similarly, the experimentally measured deflection values of the second span and the third span of Pingnan Xiangsizhou Bridge were less than the theoretically calculated values, and the corresponding calibration coefficients were less than 1, indicating that the second span and the third span of Pingnan Xiangsizhou Bridge have greater stiffness than their designed values. The above displacement analysis for the field loading test of Pingnan Xiangsizhou Bridge shows that the actual bridge structure has higher stiffness and safety than the designed model.

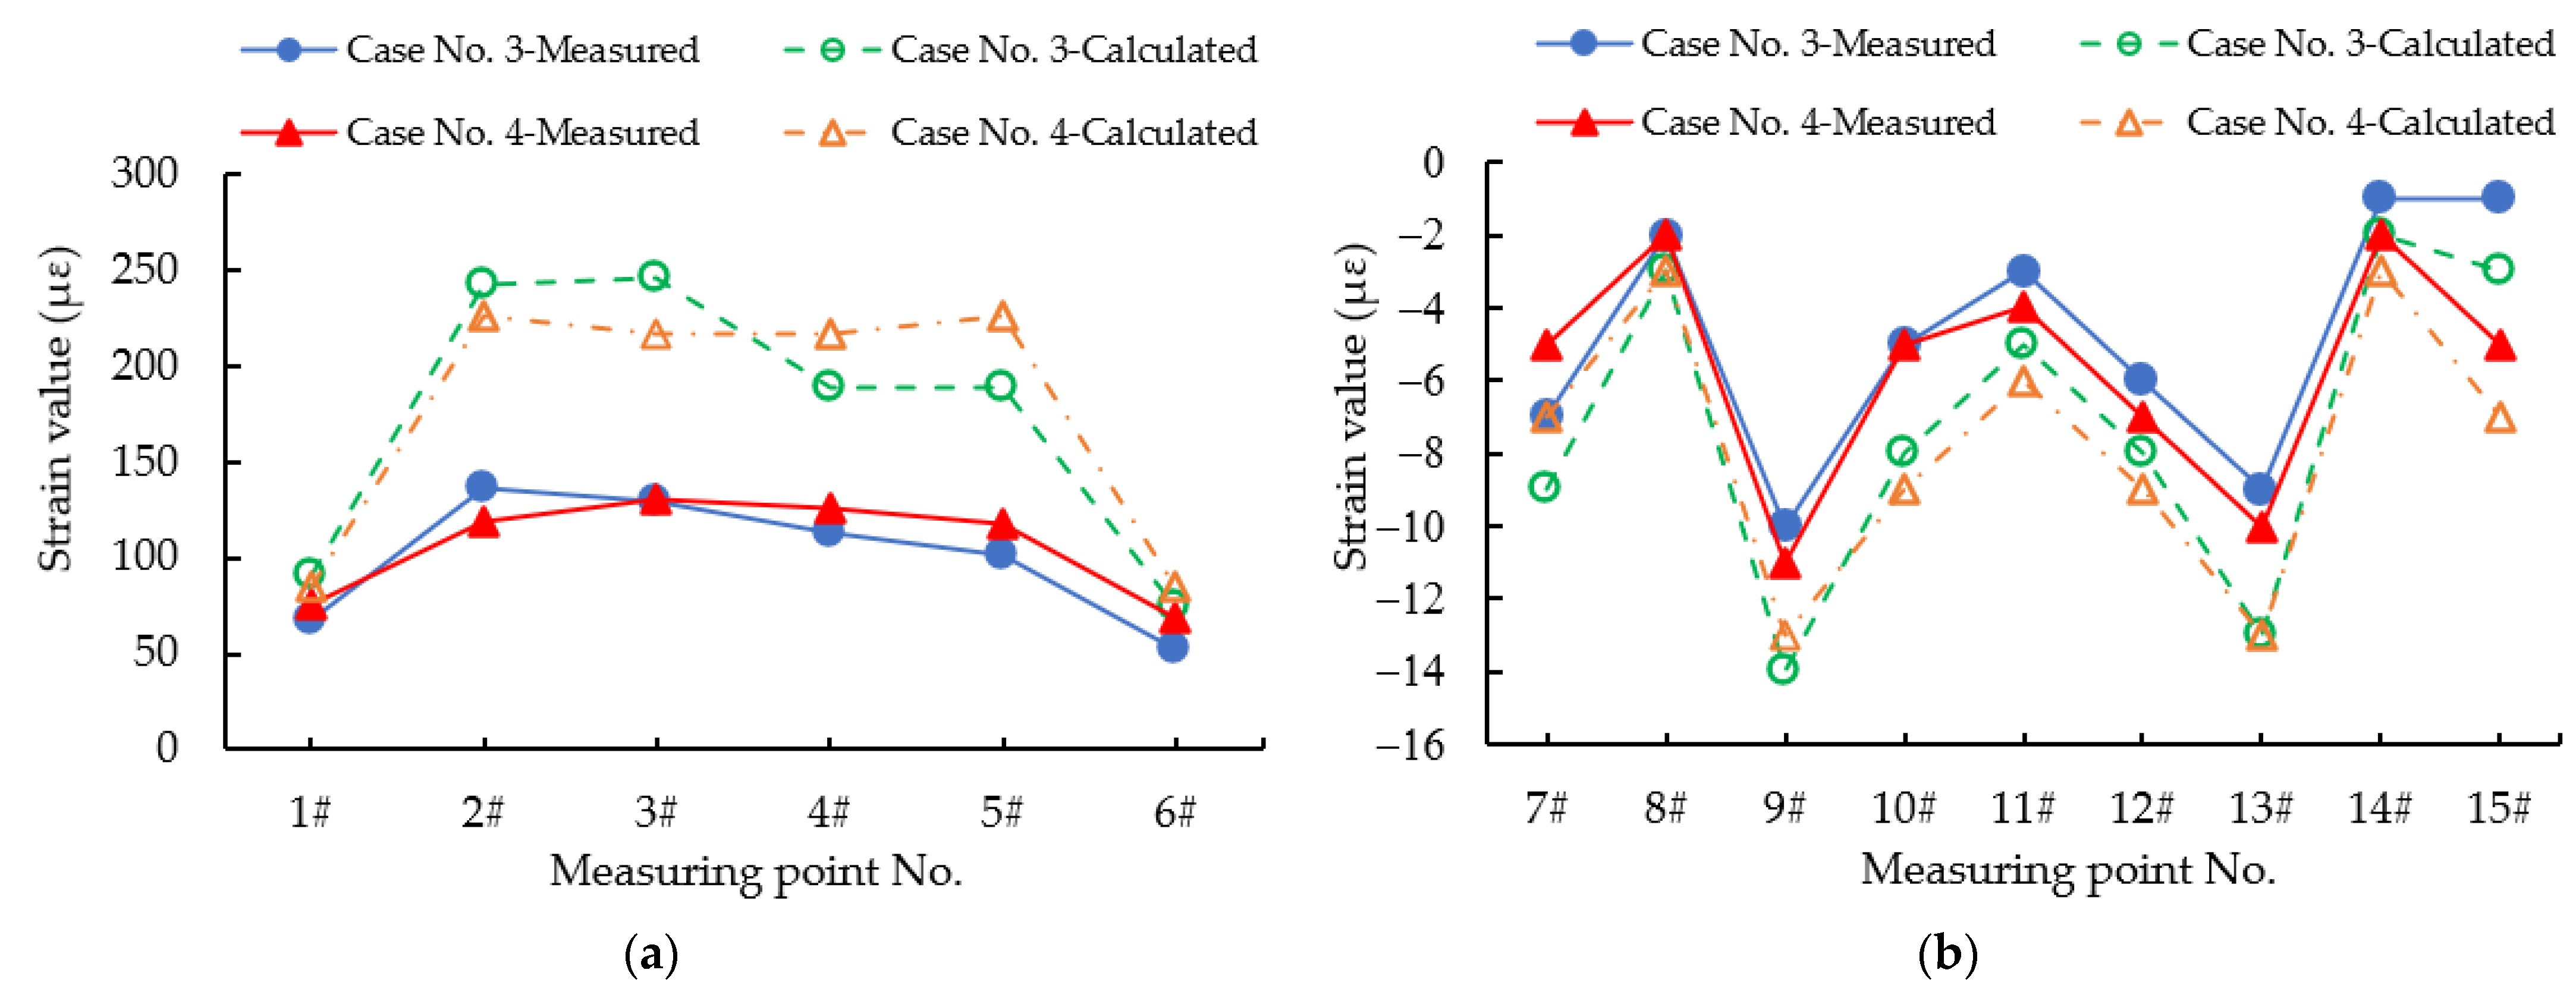
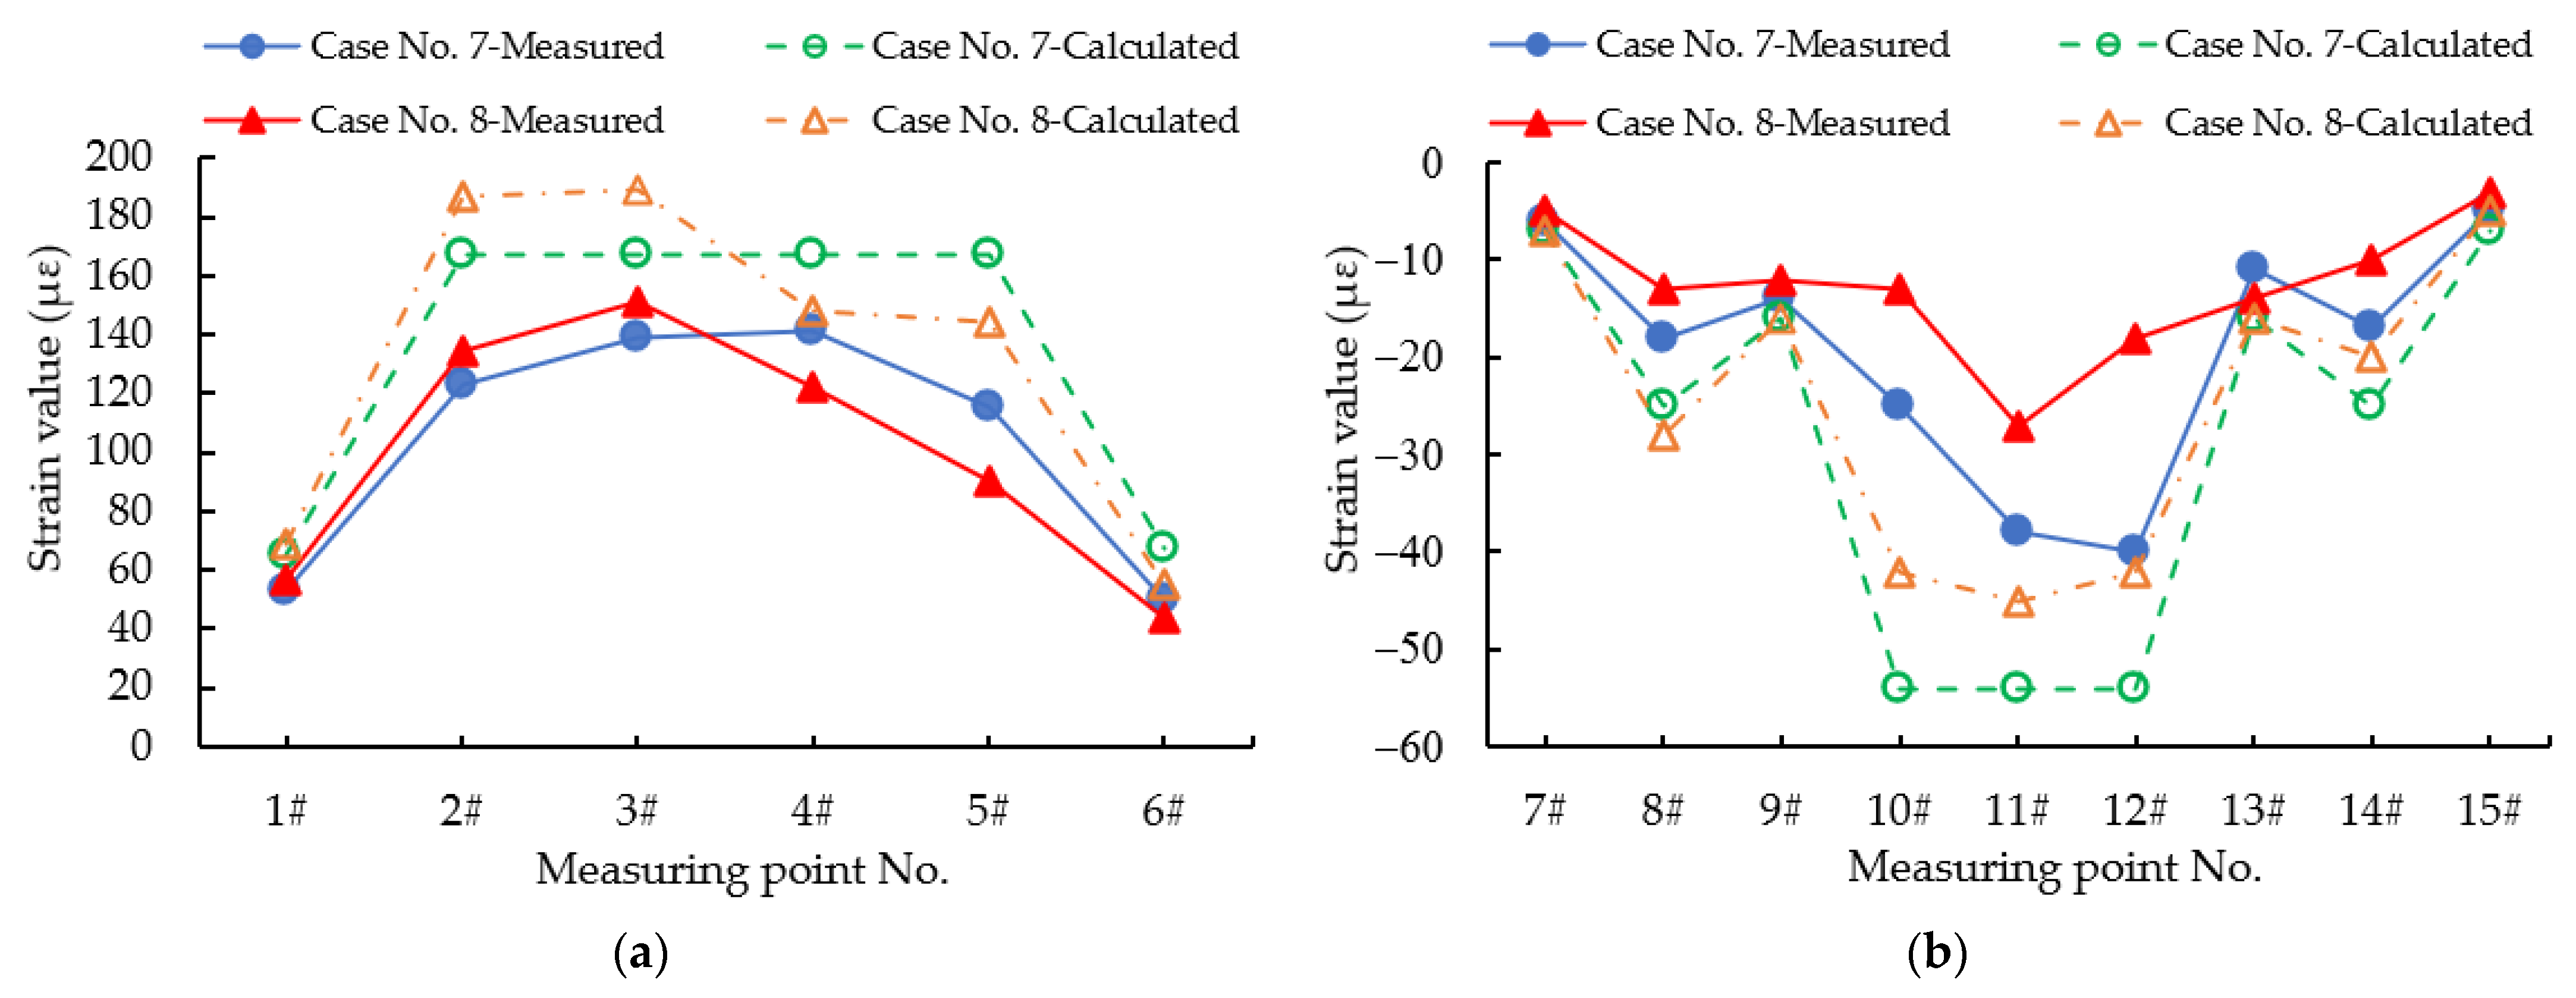
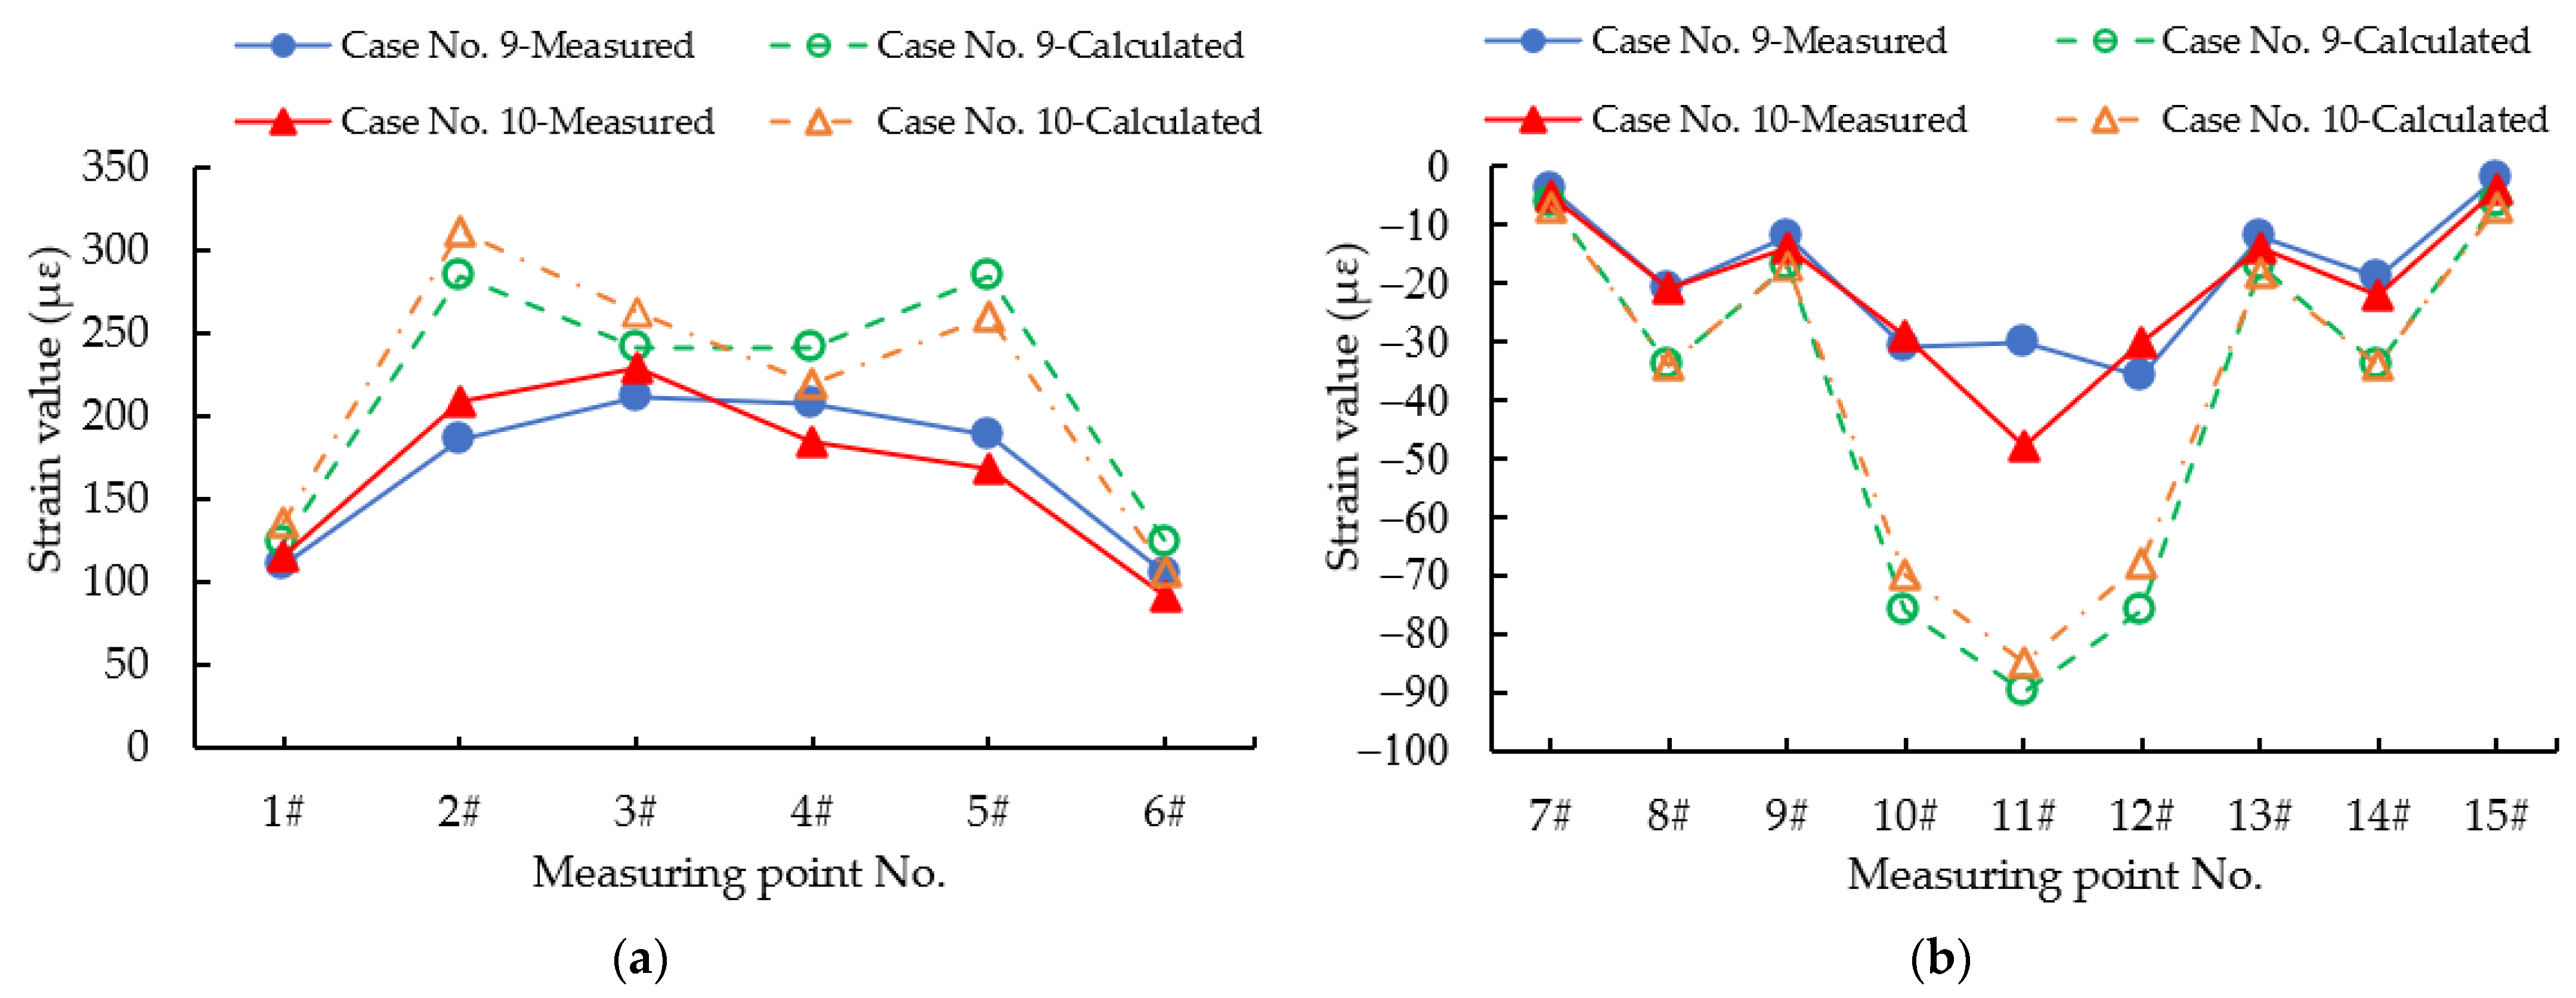
3.3. Strain Analysis for the Field Loading Test of Pingnan Xiangsizhou Bridge

Figure 8, Figure 9, Figure 10, Figure 11 and Figure 12 show the experimentally measured values and theoretically calculated values of strain of the main girder for Pingnan Xiangsizhou Bridge at different sections (as shown in Figure 5b), considering various field loading cases (as listed in Table 1). Among them, strain measuring points 1–6 are distributed at the bottom of the bottom plate of the main girder, while strain measuring points 7–15 are distributed at the bottom of the top plate of the main girder, for Pingnan Xiangsizhou Bridge.
It can be seen from Figure 8a,b that the measured strain values of the bottom plate section, which has maximum positive moment in all first-span cross-sections, are less than the calculated strain values under symmetrical loading and eccentric loading, and the corresponding calibration coefficient is between 0.5 and 0.86. Similarly, the measured strain values of the top plate are less than the corresponding calculated values, and the corresponding calibration coefficient is between 0.57 and 0.91. The results show that the strength of the first span of Pingnan Xiangsizhou Bridge meets the design requirement, and that the design is proved reasonable.
From Figure 9a,b, under the action of symmetrical loading, it can be seen that the calibration coefficient of the top plate strain for Pingnan Xiangsizhou Bridge is between 0.52 and 0.75 at the maximum positive moment section of the second span, and the calibration coefficient of the bottom plate strain is between 0.33 and 0.78. Under the action of eccentric loading, the calibration coefficient of the bottom plate strain for Pingnan Xiangsizhou bridge is between 0.52 and 0.81, and the calibration coefficient of the bottom plate strain is between 0.55 and 0.85. The strain values of the girder at the second span are less than the designed values. The results show that the strength of the second span for Pingnan Xiangsizhou Bridge meets the design requirement.
Similarly, according to the strain analysis in Figure 10, Figure 11 and Figure 12, the measured strain values of the maximum negative moment section, the L/4 section, and the maximum positive moment section at the third span for Pingnan Xiangsizhou Bridge are less than the calculated strain values. Moreover, the calibration coefficients are less than 1, which indicates that the strength of the third span meets the design requirement. Therefore, the whole bridge has adequate resistance to external loadings, and the design is reasonable.

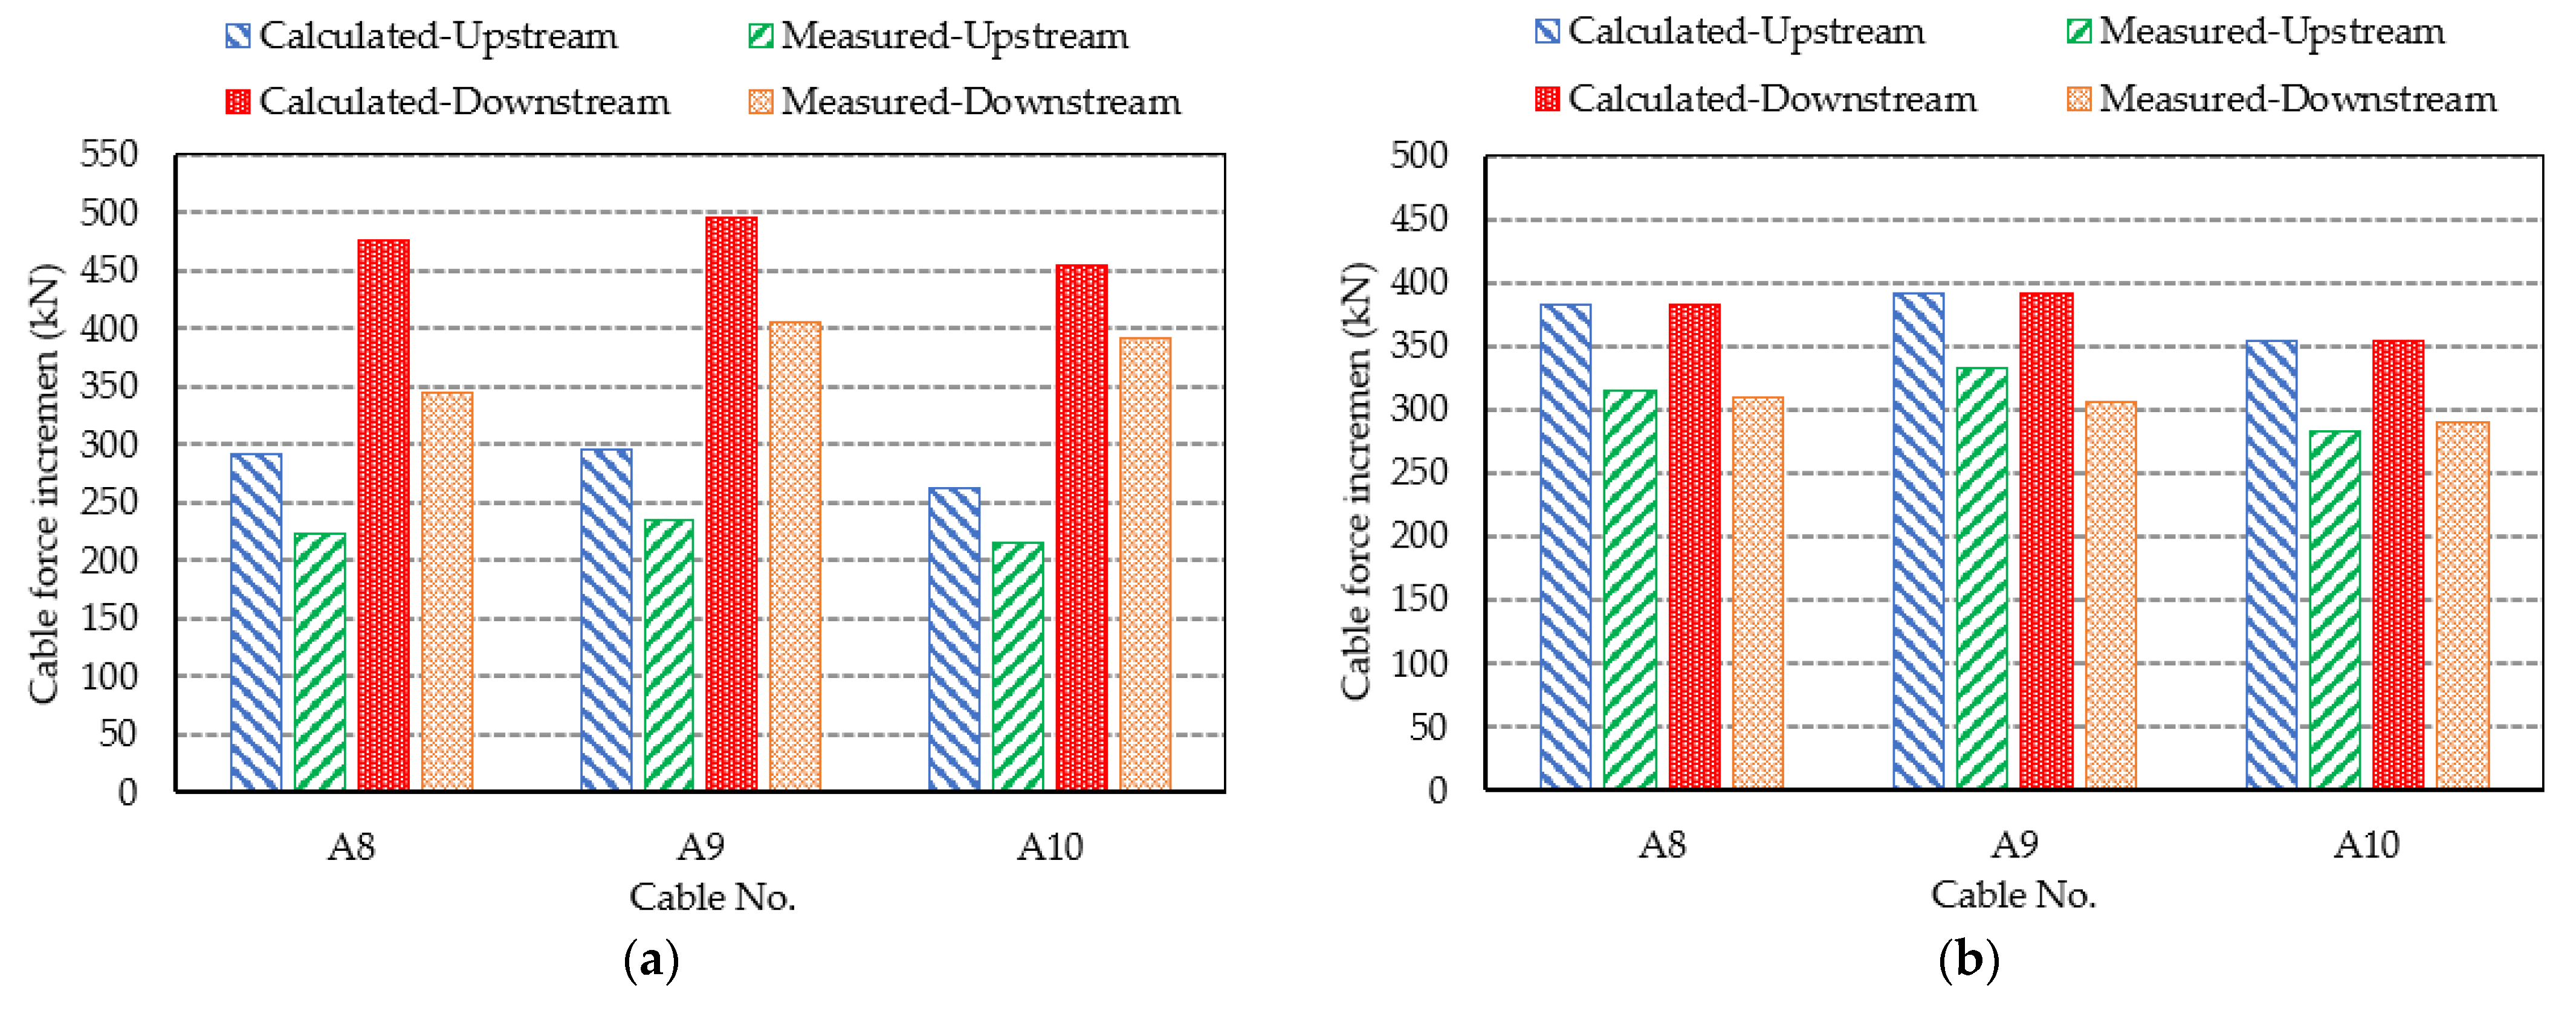
3.4. Cable Tension Increment Test Analysis for the Field Loading Test of Pingnan Xiangsizhou Bridge

There are 160 stay cables on Pingnan Xiangsizhou Bridge. The cable force test was carried out for the stay cables of the whole Pingnan Xiangsizhou Bridge. The test stay cables were numbered separately according to the upstream, downstream, and north–south ends. The outer stay cables of the tower are represented by “A + No.”, and the inner stay cables are represented by “B + No.”. The basic parameters of stay cables A8–A10 and B8–B10 after the completion of Pingnan Xiangsizhou Bridge are shown in Table 5.
As shown in Figure 5a, in the process of the static load test, the cables with large cable force increments were tested using a wireless cable force tester. Under the loading cases No. 2 and No. 4, the cable force increment of six outer stay cables numbered A8–A10 at the upstream and downstream of pier cable tower #3 (north tower) were measured. Under the loading cases No. 7 and No. 8, the cable force increment of six inner stay cables numbered B8–B10 at the upstream and downstream of pier cable tower #3 (north tower) were measured. For the cable tension force test of Pingnan Xiangsizhou Bridge, firstly, the deformation radar was used to measure the initial frequency of the stay cables when the bridge was unloaded. Then, the frequency of the stay cables was measured once for every loading case. The measured frequency of the stay cables was converted into stay cable tension force by the frequency method, as described in Section 2.3.2, and then the cable force increment could be obtained. The measured and calculated cable tension increment values of the inner and outer stay cables, considering various loading cases, are shown in Figure 13, where “Calculated-Upstream” is the theoretically calculated cable tension increment value of stay cables at the upstream, “Measured-Upstream” is the experimentally measured cable tension increment value of stay cables at the upstream, “Calculated-Downstream” is the theoretically calculated cable tension increment value of stay cables at the downstream, and “Measured-Downstream” is the experimentally measured cable tension increment value of stay cables at the downstream.
From Figure 13, it can be seen that under four loading cases (i.e., cases 2, 4, 7, and 8), the size relationships between the calculated values and the test results of cable tension increment at the corresponding upstream and downstream were the same. Taking case No. 2 as an example, the calculated and measured cable force increments of A8 at the upstream were 292.1 kN and 223.5 kN, respectively, while the corresponding calculated and measured cable force increments at the downstream were 477.2 kN and 344.1 kN, respectively. Overall, the measured cable tension increment values were less than the corresponding calculated values. These comparison results show that the measured displacement values of stay cables for Pingnan Xiangsizhou Bridge are smaller than the designed values, and the stiffness of the stay cables is competent.

4. Conclusions

Based on the numerically simulated results of Pingnan Xiangsizhou Bridge, reasonable loading mode and loading conditions were determined. On this basis, the experimental study of mode, displacement, strain, and cable force of the cable-stayed bridge was carried out. Our conclusions are as follows:
(1) The theoretically calculated results of bridge frequency are in good agreement with the experimentally measured results, indicating that the quality of Pingnan Xiangsizhou Bridge’s construction is up to standard. Additionally, in the whole field loading test process, the vertical bending mode was easier to identify than the transverse bending mode;
(2) The experimentally measured deflection values were less than the theoretically calculated values for all tested sections, and the corresponding calibration coefficients were less than 1, indicating that Pingnan Xiangsizhou Bridge has higher stiffness and safety than designed;
(3) The experimentally measured strain values were less than the theoretically calculated strain for all tested sections, and the calibration coefficients were also less than 1. Therefore, the whole bridge has adequate resistance to external loadings, and the design is reasonable;
(4) Under the same load state, the change in measured cable force was smaller than the designed value, proving that the actual stiffness of the stay cables is better than designed.

Author Contributions

Conceptualization, X.W., H.W. and W.W.; methodology, X.W., L.W., H.W. and W.W.; validation, Y.N. and K.H.; formal analysis, X.W., L.W. and H.W.; investigation, X.W., Y.N. and K.H.; writing—original draft preparation, X.W. and W.W.; writing—review and editing, L.W. and H.W.; project administration, X.W., H.W. and W.W.; funding acquisition, X.W., H.W. and W.W. All authors have read and agreed to the published version of the manuscript.

Funding

This research was funded by the Scientific and Technological Project of the Science and Technology Department of Jilin Province (grant number: 20210508028RQ), the Scientific and Technological Project of the Science and Technology Department of Guangxi Province (grant number: 2021AC19125), the Nanning Excellent Young Scientist Program (grant number: RC20180108), the Nanning Excellent Young Scientist Program and Guangxi Beibu Gulf Economic Zone Major Talent Program (grant number: RC20190206), the Science and Technology Base and Talent Special Project of Guangxi Province (grant number: AD19245152,) and the “Yongjiang plan” of Nanning Leading Talents in Innovation and Entrepreneurship (grant number: 2018-01-04). This research was also supported by the China Postdoctoral Science Foundation (grant number: 2021T140262).

Institutional Review Board Statement

Not applicable.

Informed Consent Statement

Not applicable.

Data Availability Statement

The testing and analysis data used to support the findings of this study are included within the article.

Conflicts of Interest

The authors declare no conflict of interest.

References

  1. Zhao, G.; Wang, Z.; Zhu, S.; Hao, J.; Wang, J. Experimental study of mitigation of wind-induced vibration in asymmetric cable-stayed bridge using sharp wind fairings. Appl. Sci. 2021, 12, 242. [Google Scholar] [CrossRef]
  2. Wu, Y.; Wu, X.; Li, J.; Xin, H.; Sun, Q.; Wang, J. Investigation of vortex-induced vibration of a cable-stayed bridge without backstays based on wind tunnel tests. Eng. Struct. 2022, 250, 113436. [Google Scholar] [CrossRef]
  3. Herrera, D.; Varela, G.; Tolentino, D. Reliability assessment of RC bridges subjected to seismic loadings. Appl. Sci. 2021, 12, 206. [Google Scholar] [CrossRef]
  4. Liu, H.; Wang, X.; Tan, G.; He, X. System reliability evaluation of a bridge structure based on multivariate copulas and the AHP–EW method that considers multiple failure criteria. Appl. Sci. 2020, 10, 1399. [Google Scholar] [CrossRef] [Green Version]
  5. Dong, F.; Shi, F.; Wang, L.; Wei, Y.; Zheng, K. Probabilistic assessment approach of the aerostatic instability of long-span symmetry cable-stayed bridges. Symmetry 2021, 13, 2413. [Google Scholar] [CrossRef]
  6. Liu, F.; Xu, Q.; Liu, Y. Condition diagnosis of long-span bridge pile foundations based on the spatial correlation of high-density strain measurement points. Sustainability 2021, 13, 12498. [Google Scholar] [CrossRef]
  7. Frangopol, D.M.; Strauss, A.; Kim, S. Bridge reliability assessment based on monitoring. J. Bridge Eng. 2008, 13, 258–270. [Google Scholar] [CrossRef]
  8. Sharry, T.; Guan, H.; Nguyen, A.; Oh, E.; Hoang, N. Latest advances in finite element modelling and model updating of cable-stayed bridges. Infrastructures 2022, 7, 8. [Google Scholar] [CrossRef]
  9. Rizzo, P.; Enshaeian, A. Challenges in bridge health monitoring: A review. Sensors 2021, 21, 4336. [Google Scholar] [CrossRef]
  10. Wedel, F.; Marx, S. Application of machine learning methods on real bridge monitoring data. Eng. Struct. 2022, 250, 113365. [Google Scholar] [CrossRef]
  11. Yue, Z.; Ding, Y.; Zhao, H.; Wang, Z. Case Study of deep learning model of temperature-induced deflection of a cable-stayed bridge driven by data knowledge. Symmetry 2021, 13, 2293. [Google Scholar] [CrossRef]
  12. Okazaki, Y.; Okazaki, S.; Asamoto, S.; Chun, P. Applicability of machine learning to a crack model in concrete bridges. Comput. Civ. Infrastruct. Eng. 2020, 35, 775–792. [Google Scholar] [CrossRef]
  13. Ni, Y.-Q.; Xia, H.W.; Wong, K.Y.; Ko, J.M. In-service condition assessment of bridge deck using long-term monitoring data of strain response. J. Bridge Eng. 2012, 17, 876–885. [Google Scholar] [CrossRef]
  14. Xu, Y.-L. Making good use of structural health monitoring systems of long-span cable-supported bridges. J. Civ. Struct. Health Monit. 2018, 8, 477–497. [Google Scholar] [CrossRef]
  15. Carrión, F.J.; Quintana, J.A.; Crespo, S.E. SHM of a stayed bridge during a structural failure, case study: The Rio Papaloapan bridge. J. Civ. Struct. Health Monit. 2017, 7, 139–151. [Google Scholar] [CrossRef]
  16. Catbas, F.N.; Susoy, M.; Frangopol, D.M. Structural health monitoring and reliability estimation: Long span truss bridge application with environmental monitoring data. Eng. Struct. 2008, 30, 2347–2359. [Google Scholar] [CrossRef]
  17. Fan, X.P.; Liu, Y.F. New dynamic prediction approach for the reliability indexes of bridge members based on SHM data. J. Bridge Eng. 2018, 23, 06018004. [Google Scholar] [CrossRef]
  18. Xu, X.; Huang, Q.; Ren, Y.; Zhao, D.-Y.; Zhang, D.-Y.; Sun, H.-B. Condition evaluation of suspension bridges for maintenance, repair and rehabilitation: A comprehensive framework. Struct. Infrastruct. Eng. 2019, 15, 555–567. [Google Scholar] [CrossRef]
  19. Wan, H.-P.; Ni, Y.-Q. Bayesian modeling approach for forecast of structural stress response using structural health monitoring data. J. Struct. Eng. 2018, 144, 04018130. [Google Scholar] [CrossRef]
  20. Kot, P.; Muradov, M.; Gkantou, M.; Kamaris, G.; Hashim, K.; Yeboah, D. Recent advancements in non-destructive testing techniques for structural health monitoring. Appl. Sci. 2021, 11, 2750. [Google Scholar] [CrossRef]
  21. Ter Berg, C.J.A.; Leontaris, G.; Boomen, M.V.D.; Spaan, M.T.J.; Wolfert, A.R.M. Expert judgement based maintenance decision support method for structures with a long service-life. Struct. Infrastruct. Eng. 2019, 15, 492–503. [Google Scholar] [CrossRef] [Green Version]
  22. Daneshvar, M.H.; Gharighoran, A.; Zareei, S.A.; Karamodin, A. Early damage detection under massive data via innovative hybrid methods: Application to a large-scale cable-stayed bridge. Struct. Infrastruct. Eng. 2021, 17, 902–920. [Google Scholar] [CrossRef]
  23. Bayraktar, A.; Türker, T.; Tadla, J.; Kurşun, A.; Erdiş, A. Static and dynamic field load testing of the long span nissibi cable-stayed bridge. Soil Dyn. Earthq. Eng. 2017, 94, 136–157. [Google Scholar] [CrossRef]
  24. Fang, I.-K.; Chen, C.-R.; Chang, I.-S. Field static load test on kao-ping-hsi cable-stayed bridge. J. Bridge Eng. 2004, 9, 531–540. [Google Scholar] [CrossRef]
  25. Romanova, V.; Shakhidzhanov, V.; Zinovieva, O.; Nekhorosheva, O.; Balokhonov, R. A Correlation between deformation-induced surface roughness and in-plane plastic strain in an aluminum alloy at the mesoscale. Procedia Struct. Integr. 2022, 35, 66–73. [Google Scholar] [CrossRef]
  26. Vásárhelyi, L.; Kónya, Z.; Kukovecz, Á.; Vajtai, R. Microcomputed tomography–based characterization of advanced materials: A review. Mater. Today Adv. 2020, 8, 100084. [Google Scholar] [CrossRef]
  27. Ren, W.-X.; Peng, X.-L.; Lin, Y.-Q. Experimental and analytical studies on dynamic characteristics of a large span cable-stayed bridge. Eng. Struct. 2005, 27, 535–548. [Google Scholar] [CrossRef]
  28. Ren, W.-X.; Peng, X.-L. Baseline finite element modeling of a large span cable-stayed bridge through field ambient vibration tests. Comput. Struct. 2005, 83, 536–550. [Google Scholar] [CrossRef]
  29. Armendariz, R.R.; Bowman, M.D. Improved load rating of an open-spandrel reinforced-concrete arch bridge. J. Perform. Constr. Facil. 2018, 32, 04018035. [Google Scholar] [CrossRef]
  30. Harris, D.K.; Civitillo, J.M.; Gheitasi, A. Performance and behavior of hybrid composite beam bridge in Virginia: Live load testing. J. Bridge Eng. 2016, 21, 04016022. [Google Scholar] [CrossRef]
  31. Ren, W.-X.; Lin, Y.-Q.; Peng, X.-L. Field load tests and numerical analysis of qingzhou cable-stayed bridge. J. Bridge Eng. 2007, 12, 261–270. [Google Scholar] [CrossRef]
  32. Ge, J.Y. Guide for Using Bridge Engineering Software Midas Civil; China Communications Press: Beijing, China, 2013. [Google Scholar]
Figure 1. The main structural features of Pingnan Xiangsizhou Bridge.
Applsci 12 02367 g001
Figure 2. Non-destructive field loading test instrumentation: (a) strain; (b) deflection; (c) frequency; (d) cable force.
Applsci 12 02367 g002aApplsci 12 02367 g002b
Figure 3. Long cables hinged at both ends.
Applsci 12 02367 g003
Figure 4. Finite element models of Pingnan Xiangsizhou Bridge: (a) single-beam model and (b) plate element model.
Applsci 12 02367 g004
Figure 5. Strain measuring point arrangement of Pingnan Xiangsizhou Bridge: (a) layout elevation and (b) layout of a standard cross-section of the main beam (unit: cm).
Applsci 12 02367 g005
Figure 6. The on-site loading test conditions in this study.
Applsci 12 02367 g006
Figure 7. Vibration modes of Pingnan Xiangsizhou Bridge: (a) 1st vertical bending; (b) 1st transverse bending; (c) 2nd vertical bending; (d) 3rd vertical bending; (e) 4th vertical bending.
Applsci 12 02367 g007
Figure 8. Measured and calculated strain values of the main girder at section A, considering loading cases 1 and 2: (a) 1–6 at the bottom of the bottom plate; (b) 7–15 at the bottom of the top plate.
Applsci 12 02367 g008
Figure 9. Measured and calculated strain values of the main girder at section B, considering loading cases 3 and 4: (a) 1–6 at the bottom of the bottom plate; (b) 7–15 at the bottom of the top plate.
Applsci 12 02367 g009
Figure 10. Measured and calculated strain values of the main girder at section C, considering loading cases 5 and 6: (a) 1–6 at the bottom of the bottom plate; (b) 7–15 at the bottom of the top plate.
Applsci 12 02367 g010
Figure 11. Measured and calculated strain values of the main girder at section D, considering loading cases 7 and 8: (a) 1–6 at the bottom of the bottom plate; (b) 7–15 at the bottom of the top plate.
Applsci 12 02367 g011
Figure 12. Measured and calculated strain values of the main girder at section E, considering loading cases 9 and 10: (a) 1–6 at the bottom of the bottom plate; (b) 7–15 at the bottom of the top plate.
Applsci 12 02367 g012
Figure 13. Measured and calculated cable tension increment values of inner and outer stay cables, considering various loading cases: (a) loading case No. 2; (b) loading case No. 4; (c) loading case No. 7; (d) loading case No. 8.
Applsci 12 02367 g013aApplsci 12 02367 g013b
Table 1. Field loading test arrangement and load efficiency in this study.
Case No.Loading Test ArrangementS(1 + μ)SSηq
1Symmetrical loading of the maximum positive
moment (section A) of No. 1 span
22,944.020,725.70.903
2Eccentric loading of the maximum negative
moment (section A) of No. 1 span
−21,392.8−19,305.60.902
3Eccentric loading of the maximum positive
moment (section B) of No. 2 span
38,815.635,583.70.917
4Symmetrical loading of the maximum positive
moment (section B) of No. 2 span
38,782.735,533.50.916
5Symmetrical loading of the maximum
negative bending moment (section C)
of the main girder at No. 3 pier
−31,122.2−27,352.10.879
6Eccentric loading of the maximum negative
bending moment (section C) of the main
girder at No. 3 pier
−31,122.0−27,395.30.880
7Symmetrical loading at L/4 (section D)
of No. 3 span
28,259.229,494.41.044
8Eccentric loading at L/4 (section D)
of No. 3 span
28,260.929,324.41.038
9Symmetrical loading of the maximum positive
moment (section E) of No. 3 span
40,677.540,040.80.984
10Eccentric loading of the maximum negative
moment (section E) of No. 3 span
40,677.540,040.80.984
Table 2. Technical parameters of vehicles in the field loading test.
Vehicle No.Wheelbase 1
(m)
Wheelbase 2
(m)
Mass of Front Axle
(kN)
Mass of Rear Axle
(kN)
Total Weight of Vehicle
(kN)
1#~24#3.801.3570300370
Table 3. The first six experimental and analytical frequencies of Pingnan Xiangsizhou Bridge.
Mode No.Vibration ModeVibration Frequency (Hz)
NumericalExperimentalError (%)
11st vertical bending0.3030.3133.30
21st transverse bending0.3840.46922.14
32nd vertical bending0.3920.414.59
43rd vertical bending0.5810.6257.57
54th vertical bending0.6830.8524.45
Table 4. Comparison between measured and calculated displacement values and calibration coefficients.
Case No.LeftRight
Measured
(mm)
Calculated
(mm)
Calibration
Coefficient
Measured
(mm)
Calculated
(mm)
Calibration
Coefficient
14.56.730.674.286.730.64
24.187.240.582.915.030.58
380.5116.790.6954.691.130.60
468.22103.180.6667.92103.180.66
9287.13328.250.87270.68328.250.82
10340.23379.060.90250.63277.940.90
Table 5. Basic parameters of stay cables after the completion of Pingnan Xiangsizhou Bridge.
Cable No.Number
per Bundle
Anchor
Spacing (m)
Total Length
(m)
Cable Elevation
(°)
Cable Density
(kg/m3)
A855116.180118.19140.65971.0
A955126.236128.22538.42471.0
A1055136.460138.41836.54971.0
B843116.312118.25639.82156.3
B955126.404128.39237.47071.0
B1055136.661138.62335.56871.0
Publisher’s Note: MDPI stays neutral with regard to jurisdictional claims in published maps and institutional affiliations.

