Article

Comparative Analysis of Human Operators and Advanced Technologies in the Visual Inspection of Aero Engine Blades

Department of Mechanical Engineering, University of Canterbury, Christchurch 8041, New Zealand
*
Author to whom correspondence should be addressed.
Appl. Sci. 2022, 12(4), 2250; https://doi.org/10.3390/app12042250
Submission received: 19 January 2022 / Revised: 15 February 2022 / Accepted: 16 February 2022 / Published: 21 February 2022

Abstract

:
Background—Aircraft inspection is crucial for safe flight operations and is predominantly performed by human operators, who are unreliable, inconsistent, subjective, and prone to err. Thus, advanced technologies offer the potential to overcome those limitations and improve inspection quality. Method—This paper compares the performance of human operators with image processing, artificial intelligence software and 3D scanning for different types of inspection. The results were statistically analysed in terms of inspection accuracy, consistency and time. Additionally, other factors relevant to operations were assessed using a SWOT and weighted factor analysis. Results—The results show that operators’ performance in screen-based inspection tasks was superior to inspection software due to their strong cognitive abilities, decision-making capabilities, versatility and adaptability to changing conditions. In part-based inspection however, 3D scanning outperformed the operator while being significantly slower. Overall, the strength of technological systems lies in their consistency, availability and unbiasedness. Conclusions—The performance of inspection software should improve to be reliably used in blade inspection. While 3D scanning showed the best results, it is not always technically feasible (e.g., in a borescope inspection) nor economically viable. This work provides a list of evaluation criteria beyond solely inspection performance that could be considered when comparing different inspection systems.

1. Introduction

Regular inspection of aircraft engines is essential for safe flight operations. Yet maintenance is a major contributor to aircraft accidents and incidents [1,2,3,4]. According to the Federal Aviation Authority (FAA) and the International Air Transport Association (IATA), incorrect maintenance has started the event chain of every third accident and of every fourth fatality [2,3]. Human factors are the dominant contributor to maintenance errors and account for approximately 80% of them [2,3,5]. Within those, search and judgement errors are the primary issue [6,7]. Furthermore, it is known that structural failures are the main reason for maintenance-related incidents and that those are likely to occur on the engine, e.g., facture of a blade [2]. Thus, engine inspection is arguable one of the most important maintenance, repair and overhaul (MRO) activities and is responsible for ensuring that all engine parts conform to the standard and meet all safety critical requirements. Any defect must be detected at the earliest stage to avoid propagation and any negative outcome.
The visual inspection of engine blades, which is the area under examination here, is a highly repetitive, tedious and time-consuming task [8], performed by human operators, who are unreliable, inconsistent, subjective, prone to error and have different personal judgements based on the individual’s risk appetite [9,10,11]. Furthermore, inspectors must balance two conflicting aspects of visual inspection, namely safety and performance [12]. On one hand, no critical defect can be missed to ensure safe flight operation, while keeping the false-positive rate as low as possible. On the other hand, inspectors do not have a great deal of time and must meet the takt time to avoid causing a bottle neck to the operation. Beside the human element, there are other factors influencing the visual inspection of engine blades, including operational, environmental, procedural and part and equipment related factors [13,14].
Hence, there was an interest to assess whether there is a technical system equivalent to the human that might overcome those limitations of human error and improve visual inspection quality and reliability, thus contributing to flight safety. The purpose of this research was to compare the human operators’ inspection abilities and performance in engine blade inspection with those of advanced technologies including image processing (IP), artificial intelligence (AI) and 3D scanning.

2. Literature Review

2.1. Inspection of Aero Engine Parts

In engine maintenance, there are two main types of engine blade inspection, namely: (a) borescope and (b) piece-part. A borescope inspection is the first means of assessing the engine’s health and is performed in situ, where the engine is still assembled (Figure 1a). If during borescope inspection a critical defect is found, the engine is subsequently committed to a tear-down. The disassembled engine blades are then inspected one by one during piece-part inspection (Figure 1b). As Figure 1 shows, the inspection environments differ significantly from each other. While piece-part inspection can be standardised and provides somewhat ideal inspection conditions, a borescope inspection, in contrast, has a much higher variability e.g., due to space and illumination constraints.

2.2. Advanced Technologies

In aviation maintenance, several attempts have been made to either aid the operator or fully automate the inspection and repair process by introducing new technologies such as artificial intelligence in combination with robots [15,16,17,18,19] or drones [20,21] for defect detection of aircraft wings and fuselage structures [22,23,24,25,26,27,28], wing fuel tanks [29], tires [30] and composite parts [22,31,32,33,34]. The inspection and serviceability of engine parts such as shafts [35,36], fan blades [26,37], compressor blades [38,39] and turbine blades [8,40,41,42,43,44,45] is of particular interest as they are safety-critical, and thus unsurprisingly the most rejected parts during engine maintenance [46]. From a hardware perspective, the automation of inspection and repair processes is commonly done using robots. For in situ operations, recent developments focused on continuum robots, i.e., snakelike robots that combine the functionality of a borescope and a repair tool, comparable to endoscopic surgery in the health sector. The use of these continuum robots has been successfully demonstrated on coating repairs in the combustion chamber using thermal spraying [18,19] and blending, i.e., smoothing of edge defects on engine blades such as nicks and dents [16,17]. The following literature review focuses on studies that compared the performance of humans and advanced technologies. Advanced technologies are often referred to as machines [47,48,49], software [50], computers [51], artificial intelligence [52,53,54], neural networks [55,56], deep learning [57,58,59,60], machine learning [61,62], image processing [63], technological support [64] or automation [65], depending on the nature of the approach and underlying principles. In this paper, we use the term ‘advanced technologies’ representatively for image processing and artificial intelligence software and 3D scanning, being the main methods under examination.

2.2.1. Software

The performance of humans and software (predominantly AI) has been compared in various industries and different applications including speech and face recognition [54,65,66,67], object recognition and classification [48,55,57], translation [54], gaming [54], music classification and prediction [49,68], teaching [69,70], learning ability [61], communication [52] and autonomous driving [71,72].
The healthcare industry in particular has had an increasing interest in developing advanced technologies in recent years [58,73,74,75,76]. The motivation lies in the necessity to assist the clinician and avoid incorrect diagnosis that could have severe, or even fatal consequences for the patient. Medical diagnosis is quite similar to quality inspections in the sense that professionals (clinicians or inspectors) perform an assessment of the human body or aircraft parts and search for any indications or alarming conditions that might hint at a disease of defect, respectively [6,9,10]. The consequences of a missed adverse anomaly can be critical in both cases. Moreover, no defect or condition is identical to another, although the human body can be seen as being more complex than manufactured engine blades [9]. In both cases the assessor needs to be versatile to be able to detect these various anomalies.
The diagnostics performance of clinicians and AI software for medical imaging has been analysed and compared for a variety of medical assessments, including detection and characterisation of acute ischemic stroke [50], age-related macular degeneration [60], breast cancer [76] and lesions [59]. Liu et al. provided a comprehensive literature review on deep learning and performed a meta-analysis using contingency tables to derive and compare the software performance with healthcare professionals [58]. Those authors showed that the results of deep learning models are comparable to the human performance. They also noted that the performance of AI is often poorly reported in the literature, which makes human–software comparisons difficult. Only a few studies were found that used the same sample to measure both the performance of AI and human [50,59,60,76]. This limits the reliable interpretation of the reported performances in [58] and the results should be viewed with caution.
For quality inspections, Kopardekar et al. [77] reviewed the literature on manual, hybrid and automated inspection systems and provided a comprehensive summary of those studies, including factors influencing human inspection performance and an overview of advanced digital technologies used for automated visual inspection systems (AVIS). The authors concluded that some inspection tasks cannot be fully automated due to the nature and complexity of the inspection, thus a human is unlikely to be replaced by a machine. Likewise, there are inspections that cannot be performed by human operator due to the inspection environment, e.g., inspection of hot steel slabs [77].
Different image processing approaches for defect detection in textiles were compared in the work of Conci and Proença [63]. This study suggests that the performance highly depends on the selected approach and defect type. Thus, in the present study we analysed the inspection performance of a variety of defects.
Only one study by Drury and Sinclair [47] was found that compared human and machine performances. The study analysed an inspection task of small steel cylinders for any defects, including nicks and dents, scratches, pits and toolmarks. Neither the human nor the automated inspection system showed an outstanding performance, specifically for nicks and dents. The inspection machine was able to detect most faults but was inconsistent in the decision, i.e., whether the finding was acceptable or had to be rejected. Overall, the inspectors outperformed the inspection machine due to their more sophisticated decision-making capabilities. The field of automated inspection and artificial intelligence has since evolved significantly [78,79]. Thus, it must be evaluated if the findings and such statements are still valid.

2.2.2. 3D Scanning

3D scanners are commonly used to measure the shape of an object. The literature review revealed that like AI, most research on this topic was conducted in the medical sector. Previous performance comparisons of 3D scanners with humans were done for measuring wounds [80], foot and ankle morphology [81], and other body parts [82]. An interesting study by Reyes et al. used an intraoral scanner for colour scans of teeth and compared the performance on dental shade matching with those of dentists [83]. In their study a colour scale was used as opposed to a metric scale to measure the characteristic of (body) parts. Kustrzycka et al. [84] compared the accuracy of different 3D scanners and scanning techniques for interoral examination. The only work in an industrial context was undertaken by Mital et al. [85], who analysed the measurement accuracy of a manual and hybrid inspection system. The measurement results of the manual examination being performed by human operators using a vinier calliper were compared to the outcomes of a hybrid inspection system aiding the human operators with a coordinate measuring machine (CMM). The findings show that the hybrid system led to shorter inspection times and fewer errors than the manual measurement. Khasawneh et al. [86] addressed trust issues in automated inspection and how the different inspection tasks can be allocated in hybrid systems that combine the human operator and an automated inspection system.
No work was found that applied 3D scanning for inspections and compared the performance to a human operator in an industrial environment such as manufacturing or maintenance.

3. Materials and Methods

3.1. Research Objective and Methodology

The purpose of this research was to compare a human operators’ inspection abilities and performance with those of advanced technologies including image processing (IP), artificial intelligence (AI) and 3D scanning. The study comprised three human-technology comparisons for three different inspection types, namely: piece-part inspection, borescope inspection and visual-tactile inspection. We introduced the term ‘inspection agent’ when referring to both the human operator and technology. The performance of the inspection agent was measured in form of inspection accuracy, assessor agreement (consistency) and inspection time. The results were statistically analysed and compared against each other. The assessment of the inspection abilities was done using a weighted factor analysis and included additional criteria such as technology readiness level, agility, flexibility, interoperability, automation, standardisation, documentation and compliance.

3.2. Research Design

An overview of the research design, research sample, study population, demographics and technological comparison partner is provided in Table 1 and will be further described below. For a fair human–technology comparison, we followed the guidelines of [48] and constrained the human with software-like limitations, and vice-versa. For example, in comparisons 1 and 2 both inspecting agents had to inspect photographs as opposed to physical parts. This was done to generate equal study conditions.
This research project received ethics approval from the University of Canterbury Ethics Committee (HEC 2020/08/LR-PS, HEC 2020/08/LR-PS Amendment 1, and HEC 2020/08/LR-PS Amendment 2).

3.3. Research Sample

The research motivation was to assess the performance of advanced technologies and whether they can assist a human operator with difficult detectable defects that are often missed. Thus, the research sample was intended to cover a variety of different defect types and severities, with specific focus on the challenging threshold defects. High-pressure compressor (HPC) blades of V2500 gas turbines with airfoil dents, bends, dents, nicks, tears, tip curls and tip rubs were tested in the study. Non-defective blades were also included. The sample size varied between the three comparisons and included 118 blade images, 20 borescope images and 26 physical parts for piece-part, borescope, and visual-tactile inspection, respectively. For each comparison, the exact same set of blades was presented to both the human operator and technological inspection agent. For more details about the image acquisition process please see [88].

3.4. Research Population and Technological Systems

For this research, we recruited 50 industry practitioners from our industry partner. More specifically, there were 18 inspectors who performed visual inspections on a daily basis. Another 16 engineers occasionally inspected parts typically during failure analyses. The job of the remaining 16 assembly operators involved checking the parts for inhouse damage. Thus, all participants had some form of inspection experience. Overall, participants had between 1.5 and 35 years of practical work experience in the field of engine maintenance, repair and overhaul. More detailed information about the participants’ demographics can be found in [9,87].
For the comparison, three different technologies were tested, namely image processing software, deep learning artificial intelligence (AI) software, and 3D scanning. Each of those is introduced in the following.

3.4.1. Software for Piece-Part Inspection

Self-developed software using an image processing approach was used for the inspection of the piece-part images [88]. The software fundamentally applies a series of algorithms to pre-process the image, create a model and compare it to a reference model. After the image undergoes noise reduction and greyscale conversion, an edge detector is used to extract the features, specifically the contour of the blade. This is then compared to a reference model of an undamaged blade. Any deviation from the reference models is highlighted by a rectangular bounding box. A detailed description of the image processing approach is described in [88].

3.4.2. Software for Automated Borescope Inspection

Artificial intelligence (AI) approaches use deep learning algorithms that are trained on labelled images. It is well understood that training AI requires several thousands of images for each defect type (class) to create a reliable model [90,91,92,93], with a borescope inspection necessitating even larger datasets due to its nature and inherent variability [94]. The current project used a commercial prototype AI, the development and training of which was external to the present project. For all practical purposes it was a black box in the present study, and merely represents a point of comparison as to what AI is currently capable of achieving. The purpose of the present study was not to compare between different AI systems.

3.4.3. 3D Scanning

There are several technologies available to scan an object, both with contact and contactless. The most common 3D scanning systems are coordinate measuring machines (CMM) that physically scan (‘touch’) the part via tactile probing; and contactless 3D scanners that typically use a source of light, laser, ultrasound or x-ray and measure the wave reflection or residual radiation when sensing the part [95]. The 3D scanner used in this project was an Atos Q (manufactured by GOM, Braunschweig, Germany). This device works with structured light, which means that different light patterns are projected onto the object and the distortion is measured when the patterns are reflected on the object. Stereoscopic cameras take images of those patterns which are triangulated to calculate millions of data points forming a point cloud that resembles the scanned part. Thus, 3D scanning allows the sensing of the blade’s contour and detects any irregularities, just like the operator with their hands.
This technology has already been used in the quality assurance process of blade manufacturing to ensure that blade dimensions are correct and within limits, e.g., to confirm the minimum airfoil thickness of turbine blades is met [96]. However, it has not yet been applied to MRO whereby operational damages such as FOD must be detected, assessed and a serviceability decision made.

3.5. Data Interpretation

Human operators assessed in previous studies [9,10,11,87] were asked to mark their findings on the computer screen by drawing a circle around the defect. The only exception was the visual–tactile study, whereby participants were asked to verbalise their findings as opposed to mark them on the physical blade. Further details regarding this can be found here [87].
Both of the software, image processing for piece-part inspection and AI software for the borescope inspection, were presented with the same images as the human operator. The software output was in both cases the input images with marked defects in the form of a bounding box drawn around the identified area, if the software detected any anomaly. If no defect was found, the software returned the input image without a bounding box.
In 3D scanning, any anomaly identified by the system was highlighted (colour coded in red) in the output file.
All collected data were interpreted using the performance metrics of the confusion matrix, as highlighted in Table 2. The same interpretation ‘rules’ apply to the output data of all inspection agents, no matter if the finding was manually marked by a human operator, highlighted by the software with the bounding box, or colour-coded in the 3D scanning files.

3.6. Data Analysis and Comparative Methodology

This study used a mix of quantitative, qualitative and semi-quantitative assessment methods for the analysis and comparison of a human operator and advanced technologies. First, the inspection performance of the different inspection agents was quantitatively analysed by determining the inspection accuracy, inspection time and inspection consistency. Hypothesis testing was used to analyse whether the results of the operator statistically differed from the technological counter partner, or if the difference was purely due to chance (Table 3). As the data were not normally distributed, nonparametric testing was required. Mann–Whitney U Test and Wald–Wolfowitz Runs Test were chosen for comparing two independent non-normally distributed samples. The statistical analysis was done in Statistica, version 13.3.0 (developed by TIBCO, Palo Alto, CA, USA).
Next, the strengths, weaknesses, opportunities and threats of each inspection agent were identified using a SWOT analysis.
Finally, an attempt of proof of concept was made to semi-quantitatively assess the different agents and rank them using a weighted factor analysis. The importance (weighting) of each criterion was determined performing a pairwise comparison, also called paired comparison [97]. This was done in close collaboration with our industry partner to incorporate the industrial aspect.

4. Inspection Results

The inspection accuracy (reliability), inspection time, and inspection consistency (repeatability) of each inspection agent are reported along with some general observations made that will be important for the subsequent human–technology comparison. It should be noted that the inspection time refers solely to the processing time of the inspection agent.

4.1. Human Operator

The performance of the human operator has been evaluated in depth in previous work [9,10,11,87] and the results are summarised as follows. The combined inspection accuracy for screen-based piece-part inspection of engine blades with a variety of defect types, severity levels and part conditions is 76.2% [9,10,11,87]. When operators were given the actual (physical) part and allowed to use their hands to feel the blade and apply their tactile sense, an accuracy of 84.0% was achieved [87]. In borescope operations the inspection is always made based on a digital presentation of the parts on a screen. The inspection accuracy in such situation was determined to be 63.8% [10].
The inspection time differed between the different inspection types. Screen-based piece-part inspection was the fastest with 14.972 s, followed by the borescope inspection with 20.671 s on average. Allowing the operators to touch and feel the blade led to the longest inspection times of 22.140 s [87].
The assessment of the inspection consistency and repeatability revealed that operators agreed with themselves 82.5% of the time, and 15.4% of the time with each other [11].
For a detailed evaluation of the human inspection, please refer to [9,10]. The authors applied eye tracking technology to assess the search strategies applied by different operators and to determine the inspection errors.

4.2. Piece-Part Inspection Software

The software for piece-part inspection correctly detected 42.2% of defects, while incorrectly identified 27.8% of non-defective blades as defective. This equals an inspection accuracy of 48.8%. The processing time for each image ranged from 186 to 219 ms. An average inspection time of 203 ms was achieved. When processing the same set of images twice, the results remained unchanged. Thus, the repeatability of the inspection software was 100%.
Several observations were made, when processing the images and analysing the results. Since the software was developed for defects on the leading and trailing edges (e.g., nicks, dents, bends and tears), defects on the airfoil surface such as airfoil dents as well as defects on the tip (e.g., tip rub) were often missed. An example of a missed airfoil dent is shown in Figure 2d.
Furthermore, it was found that defects with a pronounced or ‘sharp/rough’ deformation of the edge led to higher detection rates. This was evident from the high inspection accuracies of tip curls, tears and nicks (example in Figure 2a), while smoother deformations like bends and dents showed lower performances (example in Figure 2c). Dirty blades with built-up deposits on the edges were the main reasons for false positives (refer to Figure 2b).
Moreover, a white background led to the best detection rates, followed by a yellow background colour. It should be noted that the images are transformed into greyscale as part of the image processing. The difference in performance could be explained by lighter colours, such as white and yellow, leading to lighter grey tones, thus showing a higher contrast between the blade and background. This was also evident when processing images of shiny, silvery blades that showed a poor contrast to the background, when transformed into greyscale.

4.3. Borescope Inspection Software

The AI software achieved an inspection accuracy of 47.4%, with a processing speed of 30 to 60 images per second. This translates to 17–33 ms per image, which on average results in a processing time of 25 ms. Repeating the assessment of the dataset led to the same inspection results, thus the software was 100% consistent.
AI was able to successfully detect anomalies on the blade edges (Figure 3a) and airfoil surfaces (Figure 3b). However, one of the challenges the software experienced was to differentiate defects and deposits. In several cases acceptable deposits were marked as defects (Figure 3c,d). Since the software was developed to assist the human operator, it was trained to pick up any anomalies and present the results to the operator, who then makes a serviceability decision. Thus, highlighting deposits is a safety cautious approach and is desirable to assure no critical defects are missed. However, it is concerning that other critical defects were missed (Figure 3f) although their appearance is somewhat similar to the previously mentioned deposits (Figure 3d), i.e., salient due to the high contrast between the defect and blade.
Performance was highly dependent on the borescope camera perspective and lighting. Particularly difficult to detect were defects on blades that were poorly lit, as shown in Figure 3e. Furthermore, the location of the defect in the image (centre vs. corner) might have influenced the detectability (Figure 3d). Without a detailed understanding of how the algorithm works, no further interpretations of the results can be made.
It shall be noted that for the purpose of this study, borescope stills were presented to the AI. This was done to allow for an ‘equal’ comparison of the human operator and software performance. In practice however, the AI would be presented with a borescope video (i.e., a series of images), thus having multiple opportunities to detect a defect when the blade rotates past the borescope camera. This would further provide some slightly different angles and lighting conditions depending on the relative position of the blade, camera and light source. Therefore, the inspection performance is likely to improve when processing borescope videos and could be analysed in future work.

4.4. 3D Scanning Technology

The 3D scanner successfully detected any deviations from the gold standard, i.e., 100% defect detection. The full blade scan and processing of the scan data took just under a minute (approx. 55 s). Repeated scanning resulted in the same inspection outcome, i.e., blades rejected in the first round of inspection were also rejected in the second round. The same applied for accepted blades. Thus, the scan repeatability was 100%. While it is known that any measurement systems including 3D scanning have a measurement error, this did not affect the inspection results of this study.
The results can be visualised in different ways using colour coding to highlight the deviation based on (a) metric measurements, (b) severity levels and (c) as accept/reject criteria. An example of each representation is given in Figure 4. For the purpose of this study, the accept/reject representation was chosen, since it allows comparison of the results with the IP and AI software. In the scan output, any deviations between the scanned and nominal blade are coloured in red. This corresponds to the bounding boxes in the borescope and piece-part inspection software.
The scanner was successful in detecting a variety of defects including tears (Figure 4a), nicks and dents (Figure 4b and Figure 5c), bends (Figure 4c), tip curls (Figure 5a), as well as airfoil dents (Figure 5b). The effect of deposit build-up on the edges—a common cause for false positives in human inspection—was not tested in the present study. Accepting ‘offsets’ to the ground truth model might lead to better inspection results since deposits are being accepted (avoiding false positives), or contrarily, it could decrease the inspection performance as other defects (e.g., corrosion) might be incorrectly accepted (increasing false negatives). This would be an interesting assessment for future work.

5. Human–Technology Comparison

The inspection agents were compared quantitatively, qualitatively and with a combination of both. First, a comparison of the inspection performance was made and statistically analysed. Subsequently, the strengths, weaknesses, opportunities and threats were identified. A weighted factor analysis was applied to allow for the inclusion of other factors that were more difficult to quantify than the inspection performance.

5.1. Performance Comparison

Performance was compared based on the achieved inspection accuracy, inspection time and consistency. Furthermore, the defect types that were difficult to detect by either or both inspection agents were identified.

5.1.1. Piece-Part Inspection

The achieved inspection accuracy of the human operator in the piece-part inspection was 76.2% and was significantly higher than the software with 48.8%, U = 179,252.0, p < 0.001. The operators agreed, on average, 82.5% of the time with themselves when inspecting the same blade twice. The technological systems in contrast made the same serviceability determination each time, thus showing higher repeatability than the human operator, Z = −2.347, p < 0.05. A similar observation was made for the inspection time that differed significantly between the two inspection agents, Z = −4.950, p < 0.001. The software took 203 ms which was only a fraction of the time of the human operator, who needed, on average, 14.972 s. In other words, the software was able to process 74 blade images in the same amount of time the operator needed for a single blade.
Figure 6 shows the mean plot of the inspection accuracies achieved by each inspection agent for each type of defect. The operator consistently outperformed the software on all defects except tip curl and non-defective blades. The biggest difference in detection accuracy occurred for airfoil dents. This was because the software was programmed to detect edge damage, not airfoil defects. Furthermore, it was noticed that the software performance was proportional to the amount of deformation of the blade, i.e., smaller defects such as nicks, dents and minor tip rub were more difficult to detect than more advanced and salient detects including bends, tears and tip curls (airfoil dents < dents < tip rub < nicks < bends < tears < tip curl). The human operator had a similar but not identical order of successful defect detection (dents < airfoil dents < bends < tip rub < tip curl < nicks < tears). This order represents the criticality of the different defect types rather than solely their appearance, although the two were somewhat correlated. There is a chance that the operators consciously or unconsciously applied their underlying mental model [9], which might have influenced their decision making, i.e., they know what defect types are more critical than others. The software does not have that contextual knowledge and relies solely on the visual appearance of the defect.
All tip curls were successfully detected by the software, while the operator missed 11% on average. The second category for which the inspection accuracy was higher for the software than the operator was non-defective blades. This indicates that the software is not as sensitive to anomalies as the human operator is. While it is generally desirable to reduce the false-positive rate, this should not be at the expenses of high false-negative rates, i.e., missing critical defects. A high detection rate (even if incorrect) might be acceptable if the software is used as an inspector-assisting tool that highlights any anomalies but leaves the judgement to the human operator.

5.1.2. Borescope Inspection

In the borescope inspection, the human operators detected 63.8% of defects and inspected more accurately than the software (47.4%), U = 6963.5, p < 0.001. However, the software was significantly faster at processing the image, Z = −4.950, p < 0.001. The average inspection time per blade was 25 ms for the AI and 20.671 s for the human operator.
The false-positive rate of the software was twice as low as the human operators’ (Figure 7). As previously shown, a low false-positive rate is generally preferred as it means that less serviceable (i.e., good) parts are scrapped or committed to unnecessary repair work. However, this should not be at the expense of missing critical defects, as is the case here. The software was not able to detect any bends and also struggled to detect some nicks and dents on the edges, with both detection rates being 50% below the operators’ performance. Tears were the only defect type where the performance of AI was comparable to the human operator.
Surprisingly, the location of the defect in terms of leading or trailing edge did not play a crucial role, but rather the absolute location in the image did (centre better than corners). Another interesting finding was that the operator seemed to be more cautious in the borescope inspection. This was evident in the higher false-positive rates, i.e., more conditions were identified as defects than in the piece-part inspection.

5.1.3. Visual–Tactile Inspection

In the last comparison, the operators’ performance was compared to a 3D scanner. While the human was able to detect 84.0% of defects, the scanner was able to perceive any deviations in shape (even very small ones), thus outperforming the human, U = 1703.0, p < 0.05. This outstanding performance was at the expense of inspection time. The 3D scanner took approximately 55 s for a full scan of the blade. In contrast, the human operators, with 22.140 s, were twice as fast and thus more efficient, Z = −1.581, p < 0.05.
The mean plot of achieved detection rates in Figure 8 shows that the greatest potential for 3D scanning lies in the inspection of bends, dents and nicks. Moreover, the incorrect removal of serviceable blades from service could be eliminated by 3D scanning the parts. The scanning and processing time of the data took approximately 55 s—twice as long as the operator—and did not include the setup time. Thus, while scanning each blade might lead to optimum inspection accuracy and quality, it is a time-consuming task that could create a bottle neck in the operation. Thus, both measures should be taken into account when considering 3D scanning for blade inspection.

5.2. SWOT Analysis

A SWOT analysis was performed to identify the strengths, weaknesses, opportunities and threats. The results are summarised in Table 4. Following the definition of SWOT analysis for project management, strengths and weaknesses have internal origins (attributes of the organisation), while opportunities and threats are of an external nature (attributes of the environment). In the context of this study, we defined the internal factors as attributes related to the inspection agent and their performance, while external factors concerned the inspection environment including operational processes and procedures, policies and regulation compliance, interoperability, automation and connectivity.

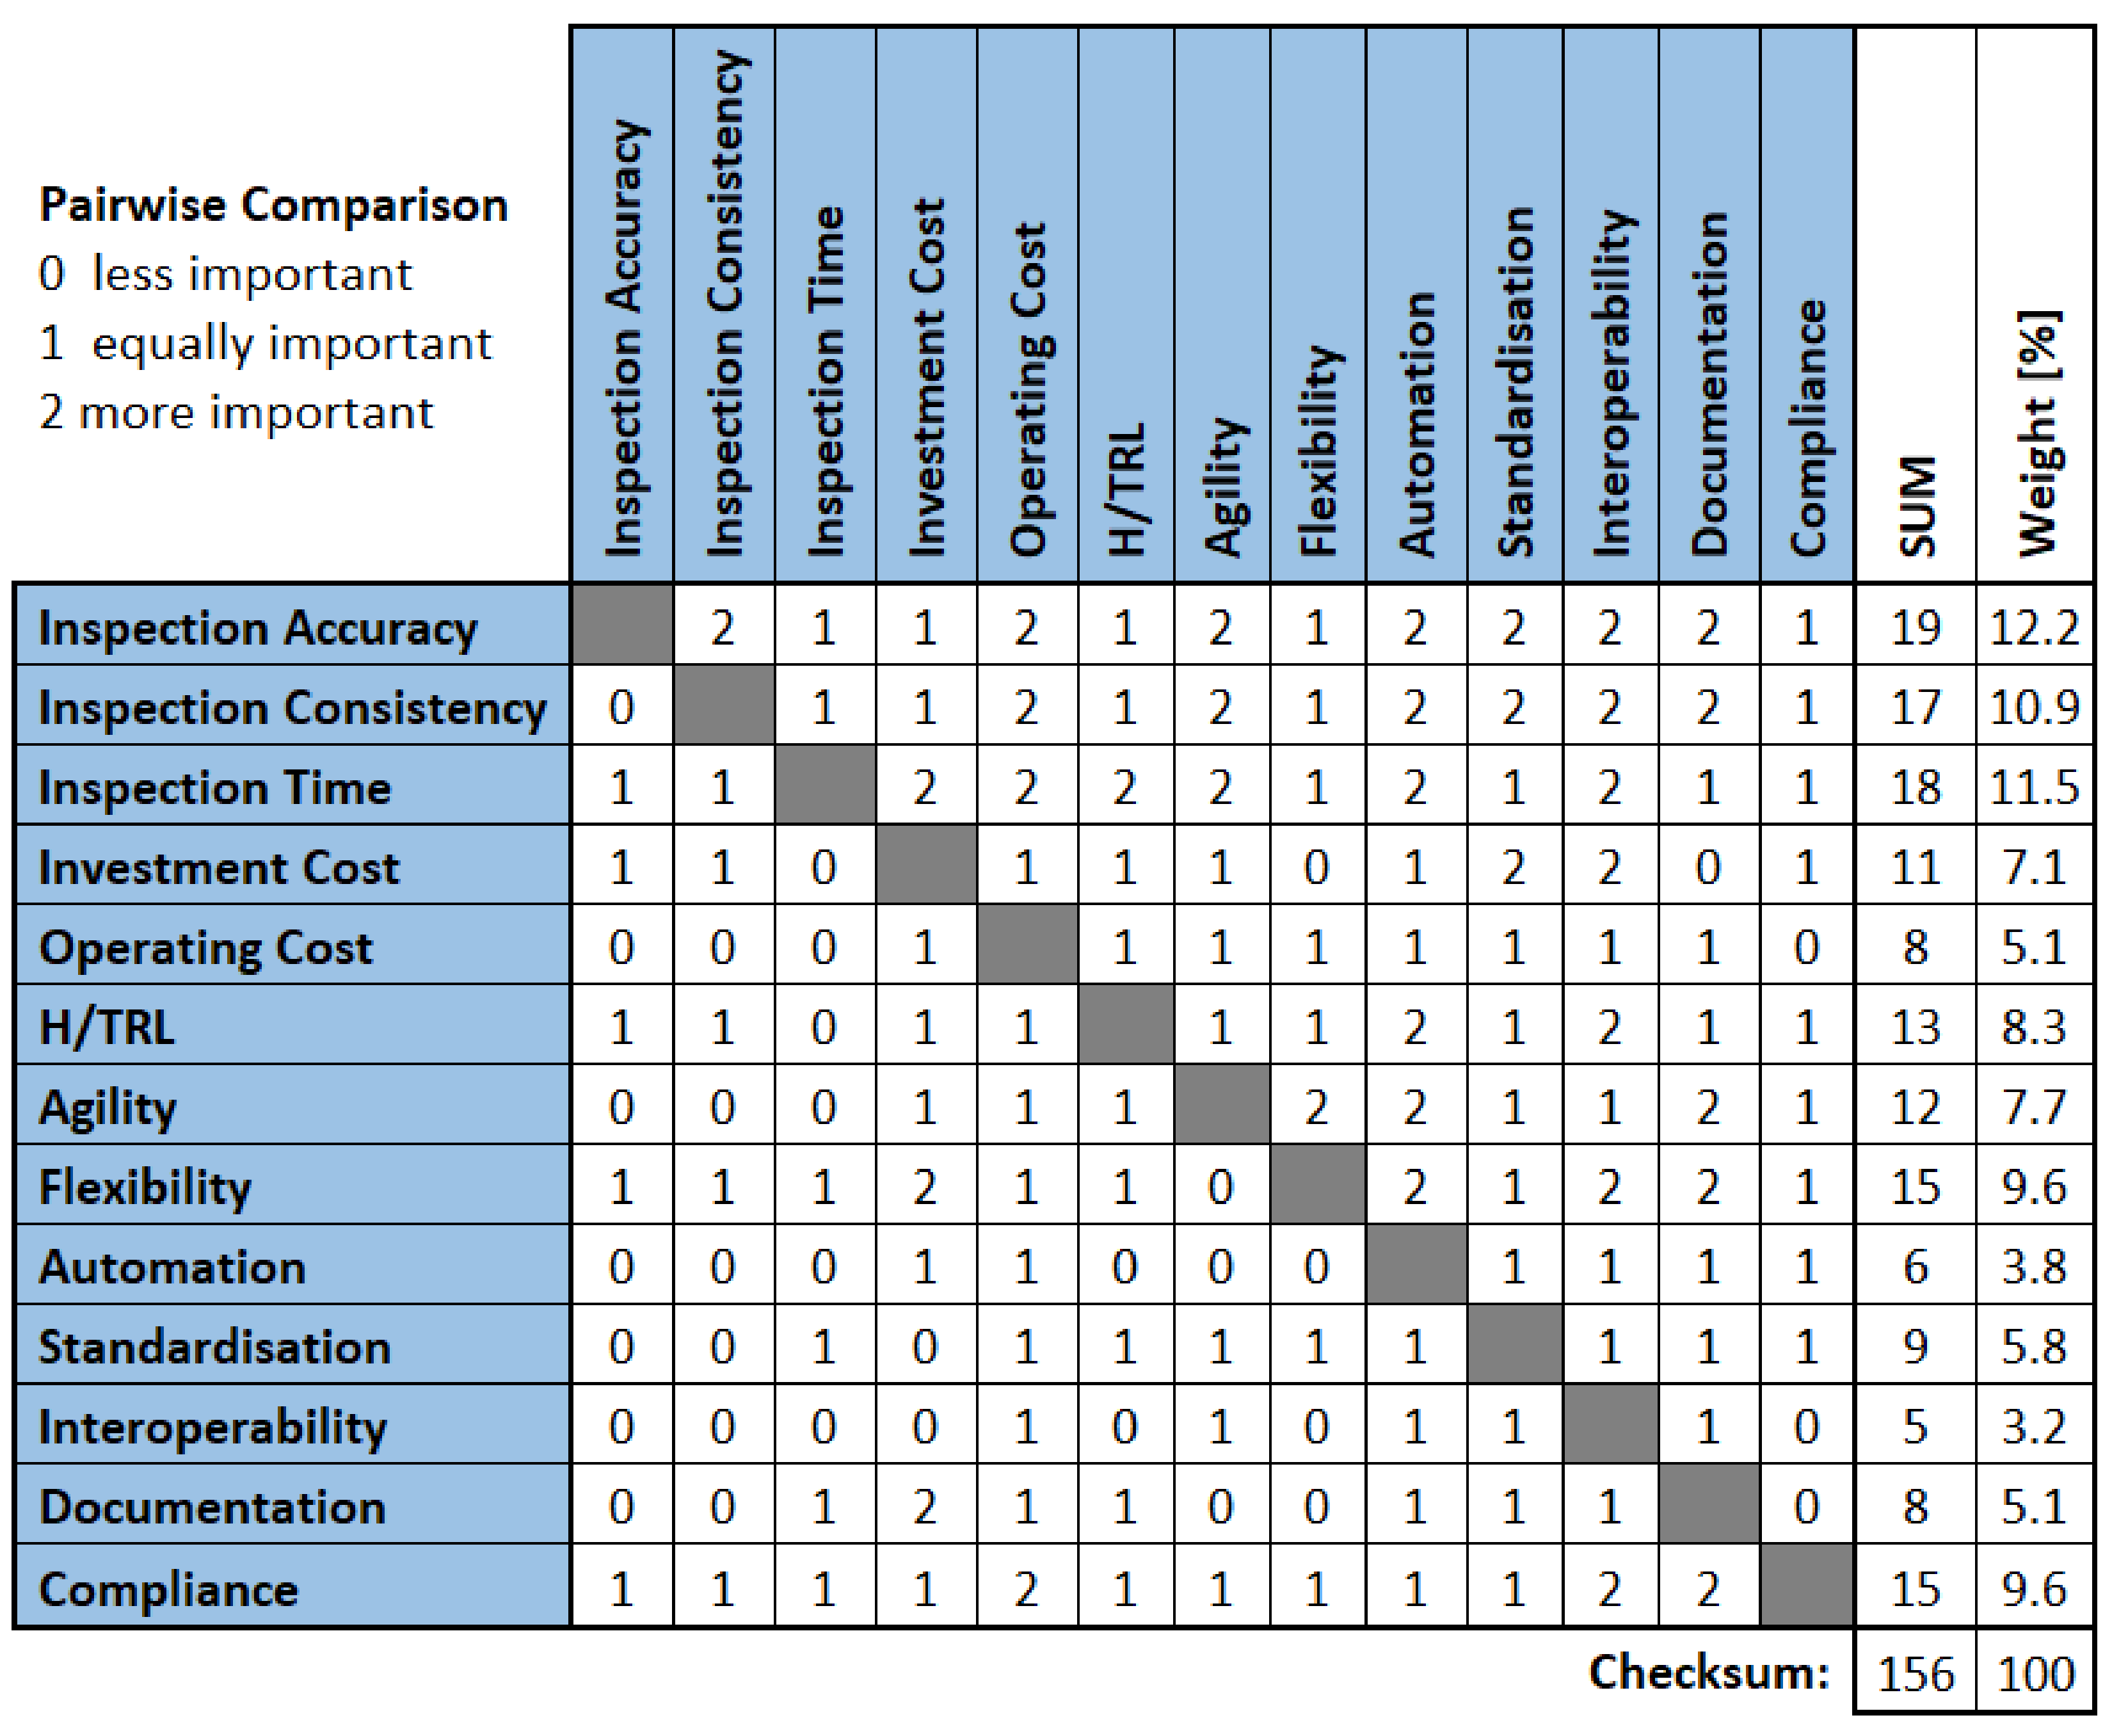
5.3. Weighted Factor Analysis

First, criteria had to be established based on which the inspection agents would be compared against each other. This was done in a brainstorming session with industry practitioners to capture the operational relevance of each factor. The chosen factors and a description thereof are listed in Table 5.
Next, the weightings of the criteria had to be determined. Therefore, a pairwise comparison was used (Figure 9). Each criterion was compared against the others. If criterion A (first column) was less important than criterion B (first row), it received a score of 0. In contrast, if criterion B was more relevant than criterion A, a score of 2 was given. If the criteria were of equal importance a score of 1 was given. Subsequently, the points were summed up for each criterion and the percentage calculated. The results showed that inspection accuracy, inspection time and inspection consistency were most important, followed by flexibility and compliance. The ranking can be explained by the necessity to of achieve a performance similar to or better than the human operator in order to consider an alternative inspection agent. Thus, the performance metrics can be seen as a ‘circuit breaker’.
The weightings were used for the subsequent weighted factor analysis (Figure 10). Each inspection agent was rated based on the criteria on a scale from 1 to 5, with 5 representing the highest fulfilment of the criteria. The score was multiplied by the weighting into a weighted score. The weighted scores were then summed for each inspection agent to form the total score. The ranking of the different agents was based on the total score. In this study the inspection performance and capabilities of blade inspection were assessed. The weighted factor analysis revealed that 3D scanning was the most suitable option for this type of inspection (total score of 380.8). The AI software came second with a score of 327.6, closely followed by the human operator, who achieved a weighted score of 319.2. The image processing software received the lowest score of 241.0.
It should be noted that the pair-wise comparison and weighted factor analyses were a proof-of-concept to demonstrate that these methods are useful for human–technology comparisons in general. However, the ratings depend on the specific application, industry needs and user case. Thus, the presented ranking of the criteria and the scoring of the different inspection agents is case specific and should not be seen as representative.

6. Discussion

6.1. Summary of Work

This study compared a human operator to advanced technologies including image processing and AI software, and 3D scanning. The comparison comprised a quantitative assessment and statistical analysis of the inspection performance. Subsequently, the strengths, weaknesses, opportunities and threats of each inspection agent were identified, and a weighted factor analysis was introduced as a method to semi-quantitatively compare and rank the different options.

6.1.1. Inspection Performance

A summary of the achieved inspection performance, measured in inspection accuracy, inspection time and inspection consistency of each inspection agent is presented in Table 6 and further discussed below.
Each technological system was limited to the type of inspection it was developed for, while the human operator was able to accomplish all the different inspections. The human operator was more tolerant of different inspection conditions such as dirty blades, different types of defects and different inspection environments (in situ vs. on bench) along with their viewing and lighting restrictions, e.g., in the borescope inspection. This is consistent with [86] who found that the human’s cognitive abilities of irregularity recognition, decision-making and adaptability to new inspection environments was superior to advanced technologies.
There was only one study in the field of visual inspection that allowed for a direct comparison to the present work, which was Drury and Sinclair [47]. Those authors found that human operators outperformed the automated inspection system. This aligns with our findings, which compared a human to inspection software (image processing or AI based). In the visual–tactile inspection however, the opposite was the case. The 3D scanner did not miss a single defect, whereas the human operator was, on average, only 84% accurate with their inspection. Drury and Sinclair further stated that humans showed a lower false-positive rate than the automated system [47]. This finding was not supported by the present study, as the software seemed to be less sensitive to anomalies and accepted more non-defective blades than the human operator. While a low false-positive rate is generally desirable, this should not be at the expense of missing critical defects (false-negatives). Another interesting finding of the previous study [47] was that only 56.8% of inspectors detected low-contrast defects such as nicks and dents. Of those, another 24.8% of operators incorrectly classified the defect as acceptable, making it a total of 42.7% of the research population who missed or incorrectly accepted those two defect types. This was somewhat similar to the 38% reported in [10]. The present study confirmed this difficulty that human operators demonstrate when inspecting low-contrast defects in all three inspection types. Particularly in a challenging environment such as in borescope inspections, the detection rate for nicks and dents was poor [10]. Nonetheless, the detection rate was 83% and 87% for nicks and dents, respectively, which is still higher than in [47]. This might be explained by the negative impact a missed defect has in this industry. Those were the same types of defects the IP and AI software struggled with. Thus, there was a similar performance curve for the software across the different types of defects, but overall, it was lower than the human operator. As previously mentioned, this was different for the 3D scanner that detected all defects.
Furthermore, [47] concluded that the inspection device had a worse false-alarm rate than the operator. Based on our findings, we would tentatively suggest that a higher false-positive rate would have been acceptable if the majority of defects had been found. However, since this was not the case, the sensitivity of both software must be improved to be comparable to the human operator.
The strength of the inspection software lies in the computational power and fast processing speed [98,99]. Results showed that both algorithms (IP and AI) required a fraction of the time of the human, excluding the setup time. However, as mentioned above, the defect detection rates were not comparable. Conversely, the inspection time of the 3D scanner for a full scan and analysis of the scan data was twice as long as the human operator.
Kopardekar et al. [77] stated that the image processing speed should not limit the throughput. However, there is also the time required for part preparation and image acquisition in software inspection. For 3D scanning, there is also a setup time, which can take up to four times the processing time. If not fully automated, the setup time can account for the greatest proportion of the overall time. This must be considered from an operational perspective when making the decision to implement advanced technologies and selecting the most appropriate one.
All three technological systems showed perfect repeatability for the present research sample, i.e., the systems consistently made the same serviceability decision when presented with the same part twice. The human operator in contrast was, on average, consistent only 82.5% of the time. However, five operators (10%) showed a consistency of 100%. No previous study was found that applied repeated inspection to measure the repeatability of the inspection performance, possibly because it is expected that any technology would perform highly repeatably.

6.1.2. Benefits and Limitations of Humans and Advanced Technologies

The strengths, weaknesses, opportunities and threats of each technology were identified and compared with the human operator. In summary, both humans and advanced technology were not perfect and came with their own benefits and limitations. An overview of the generic pros and cons is provided in Table 7. Generally, the strength of one system (human) is the weakness of the other (technology), and vice versa. Thus, some factors may be listed only once to avoid repetition.

6.2. Implications for Practitioners

This work assessed the performance of different technologies for visual blade inspection. In this context, 3D scanning showed the highest inspection accuracy, while offering the ability to quantify the defect. However, it is not always technically feasible (e.g., in a borescope inspection) nor economically viable. In such instances, software might be a more suitable option. The choice of the type of software is dependent on the number of parts being inspected each year and the ratio of defective blades. If the sample size is sufficiently large for deep learning, then an AI approach could be used, which provides the most flexibility. Previous research [88] showed that similar performance can be achieved using conventional image processing approaches. This is particularly beneficial if only a few samples parts are available.
One of the advantages of advanced technologies is the documentation of inspection findings. 3D scanning would enable the creation of a digital twin (model) of the blade. This might enable tracking the deterioration and wear of a part over time and could possibly be fed back into the design process of new engine blades (reverse engineering).
The visual–tactile inspection of engine blades is a tedious and highly repetitive task. There is a risk of causing numbness, wrist joint pain or upper limb disorder [101,102]. Thus, considering 3D-scanning could not only improve the inspection quality, but might be also interesting from an ergonomics and health & safety perspective.
To ascertain if advanced technologies can be superior to the human performance by overcoming human factors, more comparisons are required [85]. The most suitable inspection tasks for automation are typically ones with large volumes, high speeds and simultaneous checks. Less suitable are inspections of complex parts with rare defects under varying conditions that require contextual knowledge and complex reasoning.
When the assessment of advanced technology does not provide satisfying performance results, an alternative improvement strategy should be chosen. Rather than investing into potentially expensive technologies, a company could, in such circumstances, aim to provide better training [103], optimised workplace design [104], revised standards [105] and improved processes [105]. This might be a more cost-efficient and effective way of improving an inspection system.
Organisations might consider implementing advanced technologies when aiming for one or more of the following: (a) improving inspection quality, i.e., the accuracy and consistency, (b) increasing efficiency by reducing inspection time that is considered as waste, (c) streamlining inspection processes, (d) reducing labour cost, (e) avoiding manual handling either to protect the part (sensitive) or the operator (unsafe environment), (f) monitoring the inspection process in real time or (g) reducing human error by eliminating subjective evaluation.
The findings of this study could be useful for organisations that are considering investing into advanced technologies. While the present work specifically addressed the visual inspection of engine blades, the applied approach and insights might be transferable to other part inspections, processes and industries. The SWOT analysis and weighted factor analysis have been proven to be useful when comparing factors that are difficult to quantify and for unequal inspection agents, such as humans and technologies. Since the three agents were applied to three different types of inspection, companies could repeat the assessment using those methods and their own list of criteria that are relevant to the specific organisation and operational situation.
It is a matter of debate whether new technologies such as artificial intelligence will cause job losses or will create new and possibly more interesting jobs. The World Economic Forum predicts that significantly more jobs will be created than lost [106]. Advanced technologies such as automated inspection machines have the potential to take on the highly repetitive and tedious tasks and free up the human operator. For the operator this means less strain and being able to focus on their expertise, higher skills and more fulfilling tasks, which may provide more motivation and excitement, leading to higher job satisfaction. From an organisation perspective, employees can do more difficult and value-added activities that cannot be automated and require fundamental knowledge and more sophisticated decision-making abilities, e.g., development of new innovations to enhance productivity and processes. There is also potential for ‘hybrid intelligence’, as discussed later.

6.3. Limitations

There are several limitations, some of which have already been addressed in previous sections. The attempt was made to perform a ‘fair’ (equal) comparison [48] by presenting the same dataset in each comparison to both inspection agents. While the research sample was equal it was not necessarily equitable. The authors acknowledge that the research design was rather in favour of the technology and might have limited the human performance. This limitation was accepted to allow for the utilisation of eye tracking as part of this research project [9,10]. In concrete terms, this means that in comparisons 1 and 2 the inspection agents were presented with images as opposed to borescope videos or physical parts. Only in comparison 3 were the operators given the blades, which allowed them to view them from different angles and use their tactile sense (further discussed below).
The image processing software in comparison 1 was developed for detecting edge defects, such as nicks, dents, tears, tip curls and tip rub, and was unable to detect defects on the airfoil surface, e.g., airfoil dents. This decision was made due to edge defects being the most critical and common types of defects. To represent the real situation in MRO, a similar defect distribution was assessed, and thus most blades had damage on the leading and trailing edges. Only a small proportion of airfoil defects were included due to their rare occurrence. Therefore, the performance of the software was only marginally affected by this limitation.
The limitation in the borescope comparison was that both the human and AI were presented with images rather than borescope videos for the same reason as above. Seeing the blade rotating past the borescope camera from slightly different angles and under varying lighting conditions might provide additional information. With 30–60 frames per blade (depending on frame rate) the AI has a higher chance of detecting a defect than on a single image. Likewise, the operator has multiple frames per blade to detect any anomaly. However, the computational power of the software is much greater, and the AI can process every single frame, whereas the human operator might only perceive every fifth frame due to the rotational speed [107]. On the other hand, the operator has contextual knowledge and the cognitive ability to perceive motion, which might provide additional cues that hint at defects. In summary, both inspection agents were tested under somewhat non-ideal conditions; and performance might improve when presented with videos. This would be an interesting topic for future work.
The 3D scanner created a model of the blade and compared it quantitatively with the nominal. The operator, in contrast, had to sense the blade using their eyes and fingertips to look for and feel for any irregularities in the shape. However, they were unable to quantify the deviation (in metric terms). Measuring tools (e.g., shadowgraphs) were not provided because in practice the operator would make a serviceability determination based on a (subjective) perception. Measuring every blade is time consuming and not economical.
The weighted factor analysis in Section 5 attempted to provide a proof-of-concept for rating different inspection agents based on a variety of criteria. Both, the scores of the pairwise comparison and of the weighted factor analysis were assigned to the authors’ best knowledge, but could be subjective, particularly for non-quantifiable factors. In future, the scoring process could apply the nominal group technique [108] to reduce the subjectivity of the scoring system.

6.4. Future Work

Several future work streams have been proposed previously and are not repeated here. It is well understood that manual inspection is not error free, while full automation of the inspection processes is not always technically feasible or economical [77]. Thus, hybrid systems, combining the strengths of both human operators and advanced technologies, offer potential for future research. Rather than comparing the individual performances and capabilities of each inspection agent independently, the combined performance of such technology integrated inspection systems could be assessed, i.e., do human operators perform better when aided by technology? Attribute agreement analysis and eye tracking could be used to extract any improvements in their performance and search approach. There are several conceivable scenarios concerning the integration of human operator and technology: (a) the technology could be used as a ‘pre-scan’ highlighting any anomalies and leaving the defect confirmation and serviceability decision to the operator, (b) both agents inspect the parts independently and only in cases of disagreement is the expert is consulted. Those and other options could be evaluated to ensure optimal utilisation of both agents.
There is a potential that by implementing a hybrid inspection system, the operator undergoes some form of training, as they must evaluate not only their own findings but also the ones of the aide. This might improve the underlying mental model [9,10] of the operator to the extent that their sensing gets stimulated by the findings of the aide, i.e., other conditions and defect manifestations that would have otherwise not attracted the operators’ attention. Future work could investigate the possibility of using advanced technology for training purposes.
Previous work [10,87] has indicated that human operators have been inaccurate in their defect classification. The classification performance was not tested in the present study due to the limitations of the technological systems. In principle, however, it is possible to program a classification algorithm and compare it to the accuracy of the human operator. The classification accuracy could then be added to the weighted factor analysis.
SHERPA (developed by [109]) applies hierarchical task analysis to anticipate deeper causes of human error. The present study did not explore for such deeper causality, and to do so would require the prior development of a classification system or taxonomy of human errors. This might be an interesting and useful avenue of future research. The SHERPA taxonomy (action, check, retrieval, communication, selection) may or may not be the best way forward for the specific case of visual inspection, as it is weaker on the cognitive processes than the existing visual inspection framework [10]. Somewhat related work, from a SHERPA perspective, is evident in [110] for the construction industry. Possibly a Bowtie approach might be considered because this is well attested in the aerospace industry. Furthermore, a taxonomy of blade defects already exists [111], as does a Bowtie of human error for the inspection task [13,14].

7. Conclusions

This research makes several novel contributions to the field. First, 3D scanning technology was applied to scan damaged blades. This was different to previous applications in manufacturing, where parts were inspected as part of the quality assurance process to ensure that they conformed to the standard and the critical sizes were within manufacturing limits. In a maintenance environment however, parts are in used condition and need to be inspected for operational damage, such as nicks, dents or tears. To the authors’ best knowledge, this is the first study that applied 3D scanning to attribute inspection.
Second, this work presents the first human–technology comparison in the field of visual blade inspection with ‘state-of-the-art’ technology (at the time the research was conducted). The basis for the comparison was the inspection performance measured in accuracy, time and consistency. Furthermore, this work provides a list of additional evaluation criteria beyond the sole inspection performance that could be considered when weighing up different inspection systems. An attempt was made to semi-quantitatively compare the different agents based on those criteria using a SWOT and weighted factor analysis. The defect types that were difficult to detect by the different inspection agents were identified and compared.
Several implications for practitioners and future work streams were suggested, specifically regarding hybrid inspection systems. The results of this work may contribute to a better understanding of the quality management system, the current performance of both humans and advanced technologies, and the strengths and weaknesses of each inspection agent.

Author Contributions

Conceptualization, J.A.; methodology, J.A.; validation, J.A.; formal analysis, J.A.; investigation, J.A.; resources, D.P.; data curation, J.A.; writing—original draft preparation, J.A.; writing—review and editing, J.A. and D.P.; visualization, J.A.; supervision, D.P.; project administration, D.P.; funding acquisition, D.P. All authors have read and agreed to the published version of the manuscript.

Funding

This research project was funded by the Christchurch Engine Centre (CHCEC), a maintenance, repair and overhaul (MRO) facility based in Christchurch and a joint venture between the Pratt and Whitney (PW) division of Raytheon Technologies Corporation (RTC) and Air New Zealand (ANZ).

Institutional Review Board Statement

The study was conducted according to the guidelines of the Declaration of Helsinki and approved by the Human Ethics Committee of the University of Canterbury (HEC 2020/08/LR-PS approved on the 2 March 2020; HEC 2020/08/LR-PS Amendment 1 approved on the 28 August 2020).

Informed Consent Statement

Written informed consent was obtained from all subjects involved to commence the study and publish the research results.

Data Availability Statement

The data are not publicly available due to commercial sensitivity and data privacy.

Acknowledgments

We sincerely thank staff at the Christchurch Engine Centre for participating in this study and contributing to this research. In particular, we want to thank Ross Riordan and Marcus Wade. We further thank Kevin Warwick and Benjamin Singer from Scan-Xpress for 3D-scanning the blades. Finally, we thank everyone who supported this research in any form.

Conflicts of Interest

J.A. was funded by a PhD scholarship through this research project. The authors declare no other conflicts of interest.

References

  1. Allen, J.; Marx, D. Maintenance Error Decision Aid Project (MEDA). In Proceedings of the Eighth Federal Aviation Administration Meeting on Human Factors Issues in Aircraft Maintenance and Inspection, Washington, DC, USA, 16–17 November 1993. [Google Scholar]
  2. Marais, K.; Robichaud, M. Analysis of trends in aviation maintenance risk: An empirical approach. Reliab. Eng. Syst. Saf. 2012, 106, 104–118. [Google Scholar] [CrossRef]
  3. Rankin, W.L.; Shappell, S.; Wiegmann, D. Error and error reporting systems. Hum. Factors Guide Aviat. Maint. Insp. 2003. Available online: https://www.faa.gov/about/initiatives/maintenance_hf/training_tools/media/hf_guide.pdf (accessed on 17 November 2018).
  4. Reason, J.; Hobbs, A. Managing Maintenance Error: A Practical Guide; CRC Press: Boca Raton, FL, USA, 2017. [Google Scholar]
  5. Campbell, R.D.; Bagshaw, M. Human Performance and Limitations in Aviation; John Wiley & Sons: Hoboken, NJ, USA, 2002.
  6. Drury, C.G.; Watson, J. Good Practices in Visual Inspection. Available online: https://www.faa.gov/about/initiatives/maintenance_hf/library/documents/#HumanFactorsMaintenance (accessed on 14 June 2021).
  7. Illankoon, P.; Tretten, P. Judgemental errors in aviation maintenance. Cogn. Technol. Work. 2020, 22, 769–786. [Google Scholar] [CrossRef] [Green Version]
  8. Shen, Z.; Wan, X.; Ye, F.; Guan, X.; Liu, S. Deep Learning based Framework for Automatic Damage Detection in Aircraft Engine Borescope Inspection. In Proceedings of the 2019 International Conference on Computing, Networking and Communications (ICNC), Honolulu, HI, USA, 18–21 February 2019; pp. 1005–1010. [Google Scholar]
  9. Aust, J.; Mitrovic, A.; Pons, D. Assessment of the Effect of Cleanliness on the Visual Inspection of Aircraft Engine Blades: An Eye Tracking Study. Sensors 2021, 21, 6135. [Google Scholar] [CrossRef] [PubMed]
  10. Aust, J.; Pons, D.; Mitrovic, A. Evaluation of Influence Factors on the Visual Inspection Performance of Aircraft Engine Blades. Aerospace 2022, 9, 18. [Google Scholar] [CrossRef]
  11. Aust, J.; Pons, D. Assessment of Human Performance in Aircraft Engine Blade Inspection using Attribute Agreement Analysis. Safety 2022. [Google Scholar]
  12. Nickles, G.; Him, H.; Koenig, S.; Gramopadhye, A.; Melloy, B. A Descriptive Model of Aircraft Inspection Activities. 2019. Available online: https://www.faa.gov/about/initiatives/maintenance_hf/library/documents/media/human_factors_maintenance/a_descriptive_model_of_aircraft_inspection_activities.pdf (accessed on 20 September 2021).
  13. Aust, J.; Pons, D. Bowtie Methodology for Risk Analysis of Visual Borescope Inspection during Aircraft Engine Maintenance. Aerospace 2019, 6, 110. [Google Scholar] [CrossRef] [Green Version]
  14. Aust, J.; Pons, D. A Systematic Methodology for Developing Bowtie in Risk Assessment: Application to Borescope Inspection. Aerospace 2020, 7, 86. [Google Scholar] [CrossRef]
  15. Technik, L. Mobile Robot for Fuselage Inspection (MORFI) at MRO Europe. Available online: http://www.lufthansa-leos.com/press-releases-content/-/asset_publisher/8kbR/content/press-release-morfi-media/10165 (accessed on 2 November 2019).
  16. Dong, X.; Axinte, D.; Palmer, D.; Cobos, S.; Raffles, M.; Rabani, A.; Kell, J. Development of a slender continuum robotic system for on-wing inspection/repair of gas turbine engines. Robot. Comput. -Integr. Manuf. 2017, 44, 218–229. [Google Scholar] [CrossRef] [Green Version]
  17. Troncoso, D.; Nasser, B.; Rabani, A.; Nagy-Sochacki, A.; Dong, X.; Axinte, D.; Kell, J. Teleoperated, In Situ Repair of an Aeroengine: Overcoming the Internet Latency Hurdle. IEEE Robot. Autom. Mag. 2018, 26, 10–20. [Google Scholar] [CrossRef]
  18. Wang, M.; Dong, X.; Ba, W.; Mohammad, A.; Axinte, D.; Norton, A. Design, modelling and validation of a novel extra slender continuum robot for in-situ inspection and repair in aeroengine. Robot. Comput. -Integr. Manuf. 2021, 67, 102054. [Google Scholar] [CrossRef]
  19. Dong, X.; Wang, M.; Ahmad-Mohammad, A.-E.-K.; Ba, W.; Russo, M.; Norton, A.; Kell, J.; Axinte, D. Continuum robots collaborate for safe manipulation of high-temperature flame to enable repairs in extreme environments. IEEE/ASME Trans. Mechatron. 2021. [Google Scholar] [CrossRef]
  20. Warwick, G. Aircraft Inspection Drones Entering Service with Airline MROs. Available online: https://www.mro-network.com/technology/aircraft-inspection-drones-entering-service-airline-mros (accessed on 2 November 2019).
  21. Donecle Automated Aicraft Inspections. Available online: https://www.donecle.com/ (accessed on 2 November 2019).
  22. Bates, D.; Smith, G.; Lu, D.; Hewitt, J. Rapid thermal non-destructive testing of aircraft components. Compos. Part B Eng. 2000, 31, 175–185. [Google Scholar] [CrossRef]
  23. Wang, W.-C.; Chen, S.-L.; Chen, L.-B.; Chang, W.-J. A Machine Vision Based Automatic Optical Inspection System for Measuring Drilling Quality of Printed Circuit Boards. IEEE Access 2017, 5, 10817–10833. [Google Scholar] [CrossRef]
  24. Rice, M.; Li, L.; Gu, Y.; Wan, M.; Lim, E.; Feng, G.; Ng, J.; Jin-Li, M.; Babu, V. Automating the Visual Inspection of Aircraft. In Proceedings of the Singapore Aerospace Technology and Engineering Conference (SATEC), Singapore, 7 February 2018. [Google Scholar]
  25. Malekzadeh, T.; Abdollahzadeh, M.; Nejati, H.; Cheung, N.-M. Aircraft Fuselage Defect Detection using Deep Neural Networks. arXiv 2017, arXiv:1712.09213. [Google Scholar]
  26. Jovančević, I.; Orteu, J.-J.; Sentenac, T.; Gilblas, R. Automated visual inspection of an airplane exterior. In Proceedings of the Quality Control by Artificial Vision (QCAV), Le Creusot, France, 3–5 June 2015. [Google Scholar]
  27. Parton, B. The Robots Helping Air New Zealand Keep Its Aircraft Safe. Available online: https://www.nzherald.co.nz/business/the-robots-helping-air-new-zealand-keep-its-aircraft-safe/W2XLB4UENXM3ENGR3ROV6LVBBI/ (accessed on 2 November 2019).
  28. Dogru, A.; Bouarfa, S.; Arizar, R.; Aydogan, R. Using Convolutional Neural Networks to Automate Aircraft Maintenance Visual Inspection. Aerospace 2020, 7, 171. [Google Scholar] [CrossRef]
  29. Heilemann, F.; Dadashi, A.; Wicke, K. Eeloscope—Towards a Novel Endoscopic System Enabling Digital Aircraft Fuel Tank Maintenance. Aerospace 2021, 8, 136. [Google Scholar] [CrossRef]
  30. Jovančević, I.; Arafat, A.; Orteu, J.; Sentenac, T. Airplane tire inspection by image processing techniques. In Proceedings of the 2016 5th Mediterranean Conference on Embedded Computing (MECO), Bar, Montenegro, 12–16 June 2016; pp. 176–179. [Google Scholar]
  31. Baaran, J. Visual Inspection of Composite Structures; European Aviation Safety Agency (EASA): Cologne, Germany, 2009. [Google Scholar]
  32. Roginski, A. Plane Safety Climbs with Smart Inspection System. Available online: https://www.sciencealert.com/plane-safety-climbs-with-smart-inspection-system (accessed on 9 December 2018).
  33. Usamentiaga, R.; Pablo, V.; Guerediaga, J.; Vega, L.; Ion, L. Automatic detection of impact damage in carbon fiber composites using active thermography. Infrared Phys. Technol. 2013, 58, 36–46. [Google Scholar] [CrossRef]
  34. Andoga, R.; Fozo, L.; Schrötter, M.; Češkovič, M.; Szabo, S.; Breda, R.; Schreiner, M. Intelligent Thermal Imaging-Based Diagnostics of Turbojet Engines. Appl. Sci. 2019, 9, 2253. [Google Scholar] [CrossRef] [Green Version]
  35. Ghidoni, S.; Antonello, M.; Nanni, L.; Menegatti, E. A thermographic visual inspection system for crack detection in metal parts exploiting a robotic workcell. Robot. Auton. Syst. 2015, 74, 351–359. [Google Scholar] [CrossRef] [Green Version]
  36. Vakhov, V.; Veretennikov, I.; P’yankov, V. Automated Ultrasonic Testing of Billets for Gas-Turbine Engine Shafts. Russ. J. Nondestruct. Test. 2005, 41, 158–160. [Google Scholar] [CrossRef]
  37. Gao, C.; Meeker, W.; Mayton, D. Detecting cracks in aircraft engine fan blades using vibrothermography nondestructive evaluation. Reliab. Eng. Syst. Saf. 2014, 131, 229–235. [Google Scholar] [CrossRef]
  38. Zhang, X.; Li, W.; Liou, F. Damage detection and reconstruction algorithm in repairing compressor blade by direct metal deposition. Int. J. Adv. Manuf. Technol. 2018, 95, 2393–2404. [Google Scholar] [CrossRef]
  39. Tian, W.; Pan, M.; Luo, F.; Chen, D. Borescope Detection of Blade in Aeroengine Based on Image Recognition Technology. In Proceedings of the International Symposium on Test Automation and Instrumentation (ISTAI), Beijing, China, 17–21 November 2008; pp. 1694–1698. [Google Scholar]
  40. Błachnio, J.; Spychała, J.; Pawlak, W.; Kułaszka, A. Assessment of Technical Condition Demonstrated by Gas Turbine Blades by Processing of Images for Their Surfaces/Oceny Stanu Łopatek Turbiny Gazowej Metodą Przetwarzania Obrazów Ich Powierzchni. J. KONBiN 2012, 21, 41–50. [Google Scholar] [CrossRef] [Green Version]
  41. Chen, T. Blade Inspection System. Appl. Mech. Mater. 2013, 423–426, 2386–2389. [Google Scholar] [CrossRef]
  42. Ciampa, F.; Mahmoodi, P.; Pinto, F.; Meo, M. Recent Advances in Active Infrared Thermography for Non-Destructive Testing of Aerospace Components. Sensors 2018, 18, 609. [Google Scholar] [CrossRef] [PubMed] [Green Version]
  43. He, W.; Li, Z.; Guo, Y.; Cheng, X.; Zhong, K.; Shi, Y. A robust and accurate automated registration method for turbine blade precision metrology. Int. J. Adv. Manuf. Technol. 2018, 97, 3711–3721. [Google Scholar] [CrossRef]
  44. Klimanov, M. Triangulating laser system for measurements and inspection of turbine blades. Meas. Tech. 2009, 52, 725–731. [Google Scholar] [CrossRef]
  45. Ross, J.; Harding, K.; Hogarth, E. Challenges Faced in Applying 3D Noncontact Metrology to Turbine Engine Blade Inspection. In Dimensional Optical Metrology and Inspection for Practical Applications; SPIE: Bellingham, WA, USA, 2011; Volume 8133, pp. 107–115. [Google Scholar]
  46. Carter, T.J. Common failures in gas turbine blades. Eng. Fail. Anal. 2005, 12, 237–247. [Google Scholar] [CrossRef]
  47. Drury, C.; Sinclair, M. Human and Machine Performance in an Inspection Task. Hum. Factors J. Hum. Factors Ergon. Soc. 1983, 25, 391–399. [Google Scholar] [CrossRef]
  48. Firestone, C. Performance vs. competence in human–machine comparisons. Proc. Natl. Acad. Sci. USA 2020, 117, 26562–26571. [Google Scholar] [CrossRef]
  49. Zieliński, S.K.; Lee, H.; Antoniuk, P.; Dadan, O. A Comparison of Human against Machine-Classification of Spatial Audio Scenes in Binaural Recordings of Music. Appl. Sci. 2020, 10, 5956. [Google Scholar] [CrossRef]
  50. Lasocha, B.; Pulyk, R.; Brzegowy, P.; Latacz, P.; Slowik, A.; Popiela, T.J. Real-World Comparison of Human and Software Image Assessment in Acute Ischemic Stroke Patients’ Qualification for Reperfusion Treatment. J. Clin. Med. 2020, 9, 3383. [Google Scholar] [CrossRef] [PubMed]
  51. Whitworth, B.; Ryu, H. A comparison of human and computer information processing. In Encyclopedia of Multimedia Technology and Networking, 2nd ed.; IGI Global: Hershey, PA, USA, 2009; pp. 230–239. [Google Scholar]
  52. Banerjee, S.; Singh, P.; Bajpai, J. A Comparative Study on Decision-Making Capability between Human and Artificial Intelligence. In Nature Inspired Computing; Springer: Singapore, 2018; pp. 203–210. [Google Scholar]
  53. Korteling, J.E.; van de Boer-Visschedijk, G.C.; Blankendaal, R.A.M.; Boonekamp, R.C.; Eikelboom, A.R. Human- versus Artificial Intelligence. Front. Artif. Intell. 2021, 4, 622364. [Google Scholar] [CrossRef] [PubMed]
  54. Insa-Cabrera, J.; Dowe, D.L.; España-Cubillo, S.; Hernández-Lloreda, M.V.; Hernández-Orallo, J. Comparing Humans and AI Agents. In Artificial General Intelligence; Springer: Berlin/Heidelberg, Germany, 2011; pp. 122–132. [Google Scholar]
  55. Geirhos, R.; Janssen, D.; Schütt, H.; Rauber, J.; Bethge, M.; Wichmann, F. Comparing deep neural networks against humans: Object recognition when the signal gets weaker. arXiv 2017, arXiv:1706.06969. [Google Scholar]
  56. Oh, D.; Strattan, J.S.; Hur, J.K.; Bento, J.; Urban, A.E.; Song, G.; Cherry, J.M. CNN-Peaks: ChIP-Seq peak detection pipeline using convolutional neural networks that imitate human visual inspection. Sci. Rep. 2020, 10, 7933. [Google Scholar] [CrossRef] [PubMed]
  57. Dodge, S.; Karam, L. A Study and Comparison of Human and Deep Learning Recognition Performance Under Visual Distortions. In Proceedings of the 2017 26th International Conference on Computer Communication and Networks (ICCCN), Vancouver, BC, Canada, 31 July–3 August 2017. [Google Scholar]
  58. Liu, R.; Rong, Y.; Peng, Z. A review of medical artificial intelligence. Glob. Health J. 2020, 4, 42–45. [Google Scholar] [CrossRef]
  59. De Man, R.; Gang, G.J.; Li, X.; Wang, G. Comparison of deep learning and human observer performance for detection and characterization of simulated lesions. J. Med. Imaging 2019, 6, 025503. [Google Scholar] [CrossRef]
  60. Burlina, P.; Pacheco, K.D.; Joshi, N.; Freund, D.E.; Bressler, N.M. Comparing humans and deep learning performance for grading AMD: A study in using universal deep features and transfer learning for automated AMD analysis. Comput. Biol. Med. 2017, 82, 80–86. [Google Scholar] [CrossRef] [Green Version]
  61. Kühl, N.; Goutier, M.; Baier, L.; Wolff, C.; Martin, D. Human vs. supervised machine learning: Who learns patterns faster? arXiv 2020, arXiv:2012.03661. [Google Scholar]
  62. Kattan, M.W.; Adams, D.A.; Parks, M.S. A Comparison of Machine Learning with Human Judgment. J. Manag. Inf. Syst. 1993, 9, 37–57. [Google Scholar] [CrossRef]
  63. Conci, A.; Proença, C.B. A Comparison between Image-processing Approaches to Textile Inspection. J. Text. Inst. 2000, 91, 317–323. [Google Scholar] [CrossRef]
  64. Innocent, M.; Francois-Lecompte, A.; Roudaut, N. Comparison of human versus technological support to reduce domestic electricity consumption in France. Technol. Forecast. Soc. Change 2020, 150, 119780. [Google Scholar] [CrossRef]
  65. Burton, A.M.; Miller, P.; Bruce, V.; Hancock, P.J.B.; Henderson, Z. Human and automatic face recognition: A comparison across image formats. Vis. Res. 2001, 41, 3185–3195. [Google Scholar] [CrossRef] [Green Version]
  66. Phillips, P.J.; O’Toole, A.J. Comparison of human and computer performance across face recognition experiments. Image Vis. Comput. 2014, 32, 74–85. [Google Scholar] [CrossRef]
  67. Adler, A.; Schuckers, M.E. Comparing human and automatic face recognition performance. IEEE Trans. Syst. Man Cybern. B Cybern. 2007, 37, 1248–1255. [Google Scholar] [CrossRef] [PubMed] [Green Version]
  68. Witten, I.; Manzara, L.; Conklin, D. Comparing Human and Computational Models of Music Prediction. Comput. Music. J. 2003, 18, 70. [Google Scholar] [CrossRef] [Green Version]
  69. Bridgeman, B.; Trapani, C.; Attali, Y. Comparison of Human and Machine Scoring of Essays: Differences by Gender, Ethnicity, and Country. Appl. Meas. Educ. 2012, 25, 27–40. [Google Scholar] [CrossRef]
  70. Nooriafshar, M. A comparative study of human teacher and computer teacher. In Proceedings of the 2nd Asian Conference on Education: Internationalization or Globalization? Osaka, Japan, 2–5 December 2010. [Google Scholar]
  71. Remonda, A.; Veas, E.; Luzhnica, G. Comparing driving behavior of humans and autonomous driving in a professional racing simulator. PLoS ONE 2021, 16, e0245320. [Google Scholar] [CrossRef]
  72. Nees, M. Safer than the average human driver (who is less safe than me)? Examining a popular safety benchmark for self-driving cars. J. Saf. Res. 2019, 69, 61–68. [Google Scholar] [CrossRef] [Green Version]
  73. Aung, Y.Y.M.; Wong, D.C.S.; Ting, D.S.W. The promise of artificial intelligence: A review of the opportunities and challenges of artificial intelligence in healthcare. Br. Med. Bull. 2021, 139, 4–15. [Google Scholar] [CrossRef]
  74. Secinaro, S.; Calandra, D.; Secinaro, A.; Muthurangu, V.; Biancone, P. The role of artificial intelligence in healthcare: A structured literature review. BMC Med. Inform. Decis. Mak. 2021, 21, 125. [Google Scholar] [CrossRef] [PubMed]
  75. Yin, J.; Ngiam, K.Y.; Teo, H.H. Role of Artificial Intelligence Applications in Real-Life Clinical Practice: Systematic Review. J. Med. Internet Res. 2021, 23, e25759. [Google Scholar] [CrossRef] [PubMed]
  76. Young, K.; Cook, J.; Oduko, J.; Bosmans, H. Comparison of Software and Human Observers in Reading Images of the CDMAM Test Object to Assess Digital Mammography Systems; SPIE: Bellingham, WA, USA, 2006; Volume 6142. [Google Scholar]
  77. Kopardekar, P.; Mital, A.; Anand, S. Manual, Hybrid and Automated Inspection Literature and Current Research. Integr. Manuf. Syst. 1993, 4, 18–29. [Google Scholar] [CrossRef]
  78. Duan, Y.; Edwards, J.S.; Dwivedi, Y.K. Artificial intelligence for decision making in the era of Big Data—Evolution, challenges and research agenda. Int. J. Inf. Manag. 2019, 48, 63–71. [Google Scholar] [CrossRef]
  79. Lu, Y. Artificial intelligence: A survey on evolution, models, applications and future trends. J. Manag. Anal. 2019, 6, 1–29. [Google Scholar] [CrossRef]
  80. Shah, A.; Wollak, C.; Shah, J.B. Wound Measurement Techniques: Comparing the Use of Ruler Method, 2D Imaging and 3D Scanner. J. Am. Coll. Clin. Wound Spec. 2013, 5, 52–57. [Google Scholar] [CrossRef] [Green Version]
  81. Farhan, M.; Wang, J.Z.; Bray, P.; Burns, J.; Cheng, T.L. Comparison of 3D scanning versus traditional methods of capturing foot and ankle morphology for the fabrication of orthoses: A systematic review. J. Foot Ankle Res. 2021, 14, 2. [Google Scholar] [CrossRef]
  82. Rumbo-Rodríguez, L.; Sánchez-SanSegundo, M.; Ferrer-Cascales, R.; García-D’Urso, N.; Hurtado-Sánchez, J.A.; Zaragoza-Martí, A. Comparison of Body Scanner and Manual Anthropometric Measurements of Body Shape: A Systematic Review. Int. J. Environ. Res. Public Health 2021, 18, 6213. [Google Scholar] [CrossRef]
  83. Reyes, J.; Acosta, P.; Ventura, D. Repeatability of the human eye compared to an intraoral scanner in dental shade matching. Heliyon 2019, 5, e02100. [Google Scholar] [CrossRef] [Green Version]
  84. Kustrzycka, D.; Marschang, T.; Mikulewicz, M.; Grzebieluch, W. Comparison of the Accuracy of 3D Images Obtained fromDifferent Types of Scanners: A Systematic Review. J. Healthc. Eng. 2020, 2020, 8854204. [Google Scholar] [CrossRef]
  85. Mital, A.; Govindaraju, M.; Subramani, B. A comparison between manual and hybrid methods in parts inspection. Integr. Manuf. Syst. 1998, 9, 344–349. [Google Scholar] [CrossRef]
  86. Khasawneh, M.; Bowling, S.; Kaewkuekool, S.; Melloy, B. Measurement of Trust in Hybrid Inspection Systems: Review and Evaluation of Current Methodologies and Future Approach. In IIE Annual Conference. Proceedings; Institute of Industrial and Systems Engineers (IISE): Peachtree Corners, GA, USA, 2002. [Google Scholar]
  87. Aust, J.; Mitrovic, A.; Pons, D. Comparison of Visual and Visual–Tactile Inspection of Aircraft Engine Blades. Aerospace 2021, 8, 313. [Google Scholar] [CrossRef]
  88. Aust, J.; Shankland, S.; Pons, D.; Mukundan, R.; Mitrovic, A. Automated Defect Detection and Decision-Support in Gas Turbine Blade Inspection. Aerospace 2021, 8, 30. [Google Scholar] [CrossRef]
  89. GOM. Quality starts with a Q. Available online: https://www.gom.com/en/products/3d-scanning/atos-q (accessed on 11 December 2021).
  90. Mitsa, T. How Do You Know You Have Enough Training Data? Available online: https://towardsdatascience.com/how-do-you-know-you-have-enough-training-data-ad9b1fd679ee (accessed on 10 January 2021).
  91. Balki, I.; Amirabadi, A.; Levman, J.; Martel, A.L.; Emersic, Z.; Meden, B.; Garcia-Pedrero, A.; Ramirez, S.C.; Kong, D.; Moody, A.R.; et al. Sample-Size Determination Methodologies for Machine Learning in Medical Imaging Research: A Systematic Review. Can. Assoc. Radiol. J. 2019, 70, 344–353. [Google Scholar] [CrossRef] [Green Version]
  92. Abdulraheem, A.; Abdullah Arshah, R.; Qin, H. Evaluating the Effect of Dataset Size on Predictive Model Using Supervised Learning Technique. Int. J. Softw. Eng. Comput. Sci. (IJSECS) 2015, 1, 75–84. [Google Scholar] [CrossRef]
  93. Warden, P. How Many Images Do You Need to Train a Neural Network? Available online: https://petewarden.com/2017/12/14/how-many-images-do-you-need-to-train-a-neural-network/ (accessed on 10 January 2021).
  94. Qin, Y.F.; Cao, J.B.; Cao, J. Application of Wavelet Transform in Image Processing in Aviation Engine Damage. Appl. Mech. Mater. 2013, 347–350, 3576–3580. [Google Scholar] [CrossRef]
  95. Tóth, T.; Živčák, J. A Comparison of the Outputs of 3D Scanners. Procedia Eng. 2014, 69, 393–401. [Google Scholar] [CrossRef] [Green Version]
  96. GOM. Airfoil Inspection. Available online: https://www.gom-inspect.com/en/overview.php (accessed on 11 December 2021).
  97. Saaty, T.L. What is the analytic hierarchy process? In Mathematical Models for Decision Support; Springer: Berlin/Heidelberg, Germany, 1988; pp. 109–121. [Google Scholar]
  98. Jiang, X.; Gramopadhye, A.K.; Melloy, B.J.; Grimes, L.W. Evaluation of best system performance: Human, automated, and hybrid inspection systems. Hum. Factors Ergon. Manuf. Serv. Ind. 2003, 13, 137–152. [Google Scholar] [CrossRef]
  99. Mital, D.P.; Teoh, E.K. Computer based wafer inspection system. In Proceedings of the Proceedings IECON ‘91: 1991 International Conference on Industrial Electronics, Control and Instrumentation, Kobe, Japan, 28 October–1 November 1991; Volume 2493, pp. 2497–2503. [Google Scholar]
  100. Pomerol, J.-C. Artificial intelligence and human decision making. Eur. J. Oper. Res. 1997, 99, 3–25. [Google Scholar] [CrossRef]
  101. Kishi, K.; Hida, T.; Nakajima, R.; Matsumoto, T. Proposal of Tactile Inspection Conditions for Valid Defects Detection Focusing on Haptic Perception with Active Touch. 2016. Available online: https://apiems2016.conf.tw/site/userdata/1087/papers/0152.pdf (accessed on 16 August 2021).
  102. Yukinawa, T.; Hida, T.; Seo, A. Effect of object orientation and scanning direction on upper limb load during tactile inspection. J. Jpn. Ind. Manag. Assoc. 2013, 64, 138–144. [Google Scholar]
  103. Kleiner, B.M.; Drury, C.G. Design and evaluation of an inspection training programme. Appl. Ergon. 1993, 24, 75–82. [Google Scholar] [CrossRef]
  104. Chi, C.-F.; Drury, C. Limits to human optimization in inspection performance. Int. J. Syst. Sci. 2001, 32, 689–701. [Google Scholar] [CrossRef]
  105. Simion, C. Assessment of Human Capability, An Effective Tool to Obtain Confidence in the Visual Inspection Process. Acta Univ. Cibiniensis Tech. Ser. 2018, 70, 1–6. [Google Scholar] [CrossRef] [Green Version]
  106. Hanspal, A. Here’s Why Robots are Actually Going to Increase Human Employment. Available online: https://www.weforum.org/agenda/2021/02/world-economic-forum-automation-create-jobs-employment-robots (accessed on 29 December 2021).
  107. Read, P.; Meyer, M.-P. Restoration of Motion Picture Film; Butterworth-Heinemann: Oxford, UK, 2000. [Google Scholar]
  108. Gallagher, M.; Hares, T.; Spencer, J.; Bradshaw, C.; Webb, I. The nominal group technique: A research tool for general practice? Fam. Pract. 1993, 10, 76–81. [Google Scholar] [CrossRef]
  109. Embrey, D. SHERPA: A systematic human error reduction and prediction approach. In Proceedings of the International Topical Meeting on Advances in Human Factors in Nuclear Power Systems, Knoxville, TN, USA, 21–24 April 1986. [Google Scholar]
  110. Fargnoli, M.; Lombardi, M. Preliminary Human Safety Assessment (PHSA) for the Improvement of the Behavioral Aspects of Safety Climate in the Construction Industry. Buildings 2019, 9, 69. [Google Scholar] [CrossRef] [Green Version]
  111. Aust, J.; Pons, D. Taxonomy of Gas Turbine Blade Defects. Aerospace 2019, 6, 58. [Google Scholar] [CrossRef] [Green Version]
Figure 1. Two types of engine blade inspections: (a) in-situ borescope inspection, (b) on-bench piece-part inspection.
Applsci 12 02250 g001
Figure 2. Sample outputs of piece-part inspection software: (a) correctly detected nicks—true positive, (b) marked deposit and root radius—false positives, (c) missed bend—false negative, (d) missed airfoil dent—false negative. Software detections are indicated by red bounding boxes. Missed defects are highlighted by blue circles.
Applsci 12 02250 g002
Figure 3. Sample output of borescope inspection software: (a) Correctly detected airfoil dents, (b) correctly detected leading edge dent, (c) detected deposit, (d) detected deposit and missed dent on leading edge, (e) missed nick on trailing edge, (f) missed dent in leading edge. Software detections are indicated by red bounding boxes. Missed defects are highlighted by blue circles.
Applsci 12 02250 g003
Figure 4. Different visualisations of the 3D scanning result: (a) heat map indicating different degrees of deviation from reference model, (b) categorical visualisation of three severity levels, (c) categorical visualisation for accept/reject decisions. For illustration purposes only, this figure presents severe defects.
Applsci 12 02250 g004
Figure 5. Scan results for different defect types: (a) tip curl, (b) airfoil dents, (c) nicks and dents.
Applsci 12 02250 g005
Figure 6. Mean plot of inspection accuracy in piece-part inspection by defect type and for different inspection agents.
Applsci 12 02250 g006
Figure 7. Mean plot of inspection accuracy in the borescope inspection by defect type and for different inspection agents.
Applsci 12 02250 g007
Figure 8. Mean plot of inspection accuracy in the visual–tactile inspection by defect type and for different inspection agents.
Applsci 12 02250 g008
Figure 9. Pairwise comparison of criteria for weighted factor analysis.
Applsci 12 02250 g009
Figure 10. Weighted factor analysis for different inspection agents.
Applsci 12 02250 g010
Table 1. Overview of research design. Icons adapted from [87].
Comparison 1:
Piece-Part Inspection
Comparison 2:
Borescope Inspection
Comparison 3:
Visual–Tactile Inspection
Inspection modeScreen-based
Applsci 12 02250 i001
Screen-based
Applsci 12 02250 i002
Part-based
Applsci 12 02250 i003
Research sample118 blade images
Applsci 12 02250 i004
20 borescope images
Applsci 12 02250 i005
26 physical blades
Applsci 12 02250 i006
Research population50 industry
practitioners
50 industry
practitioners
6 industry
practitioners
Demographics47 male, 3 female
Mean age: 44.5 years
(SD = 10.3 years)
Mean work experience: 17.7 years (SD = 9.4 years)
47 male, 3 female
Mean age: 44.5 years
(SD = 10.3 years)
Mean work experience: 17.7 years (SD = 9.4 years)
5 male, 1 female
Mean age: 41.2 years
(SD = 12.1 years)
Mean work experience: 15.5 years (SD = 9.9 years)
Technological systemSelf-developed defect detection software [88]
Applsci 12 02250 i007
Commercially available AI software Applsci 12 02250 i008GOM Atos Q [89]
Applsci 12 02250 i009
Table 2. Data interpretation using confusion matrix principles.
Performance MetricData Interpretation
True positive (TP)If a defective blade shows a marking around the defect, then the defect was correctly detected.
False negative (FN)If a defective blade shows no marking box, then the defect was missed.
True negative (TN)If a non-defective blade shows no markings, then the blade was correctly accepted.
False negative (FN)If a non-defective blade shows a marking, then an incorrect detection was made.
Table 3. Research hypothesis.
Hypothesis
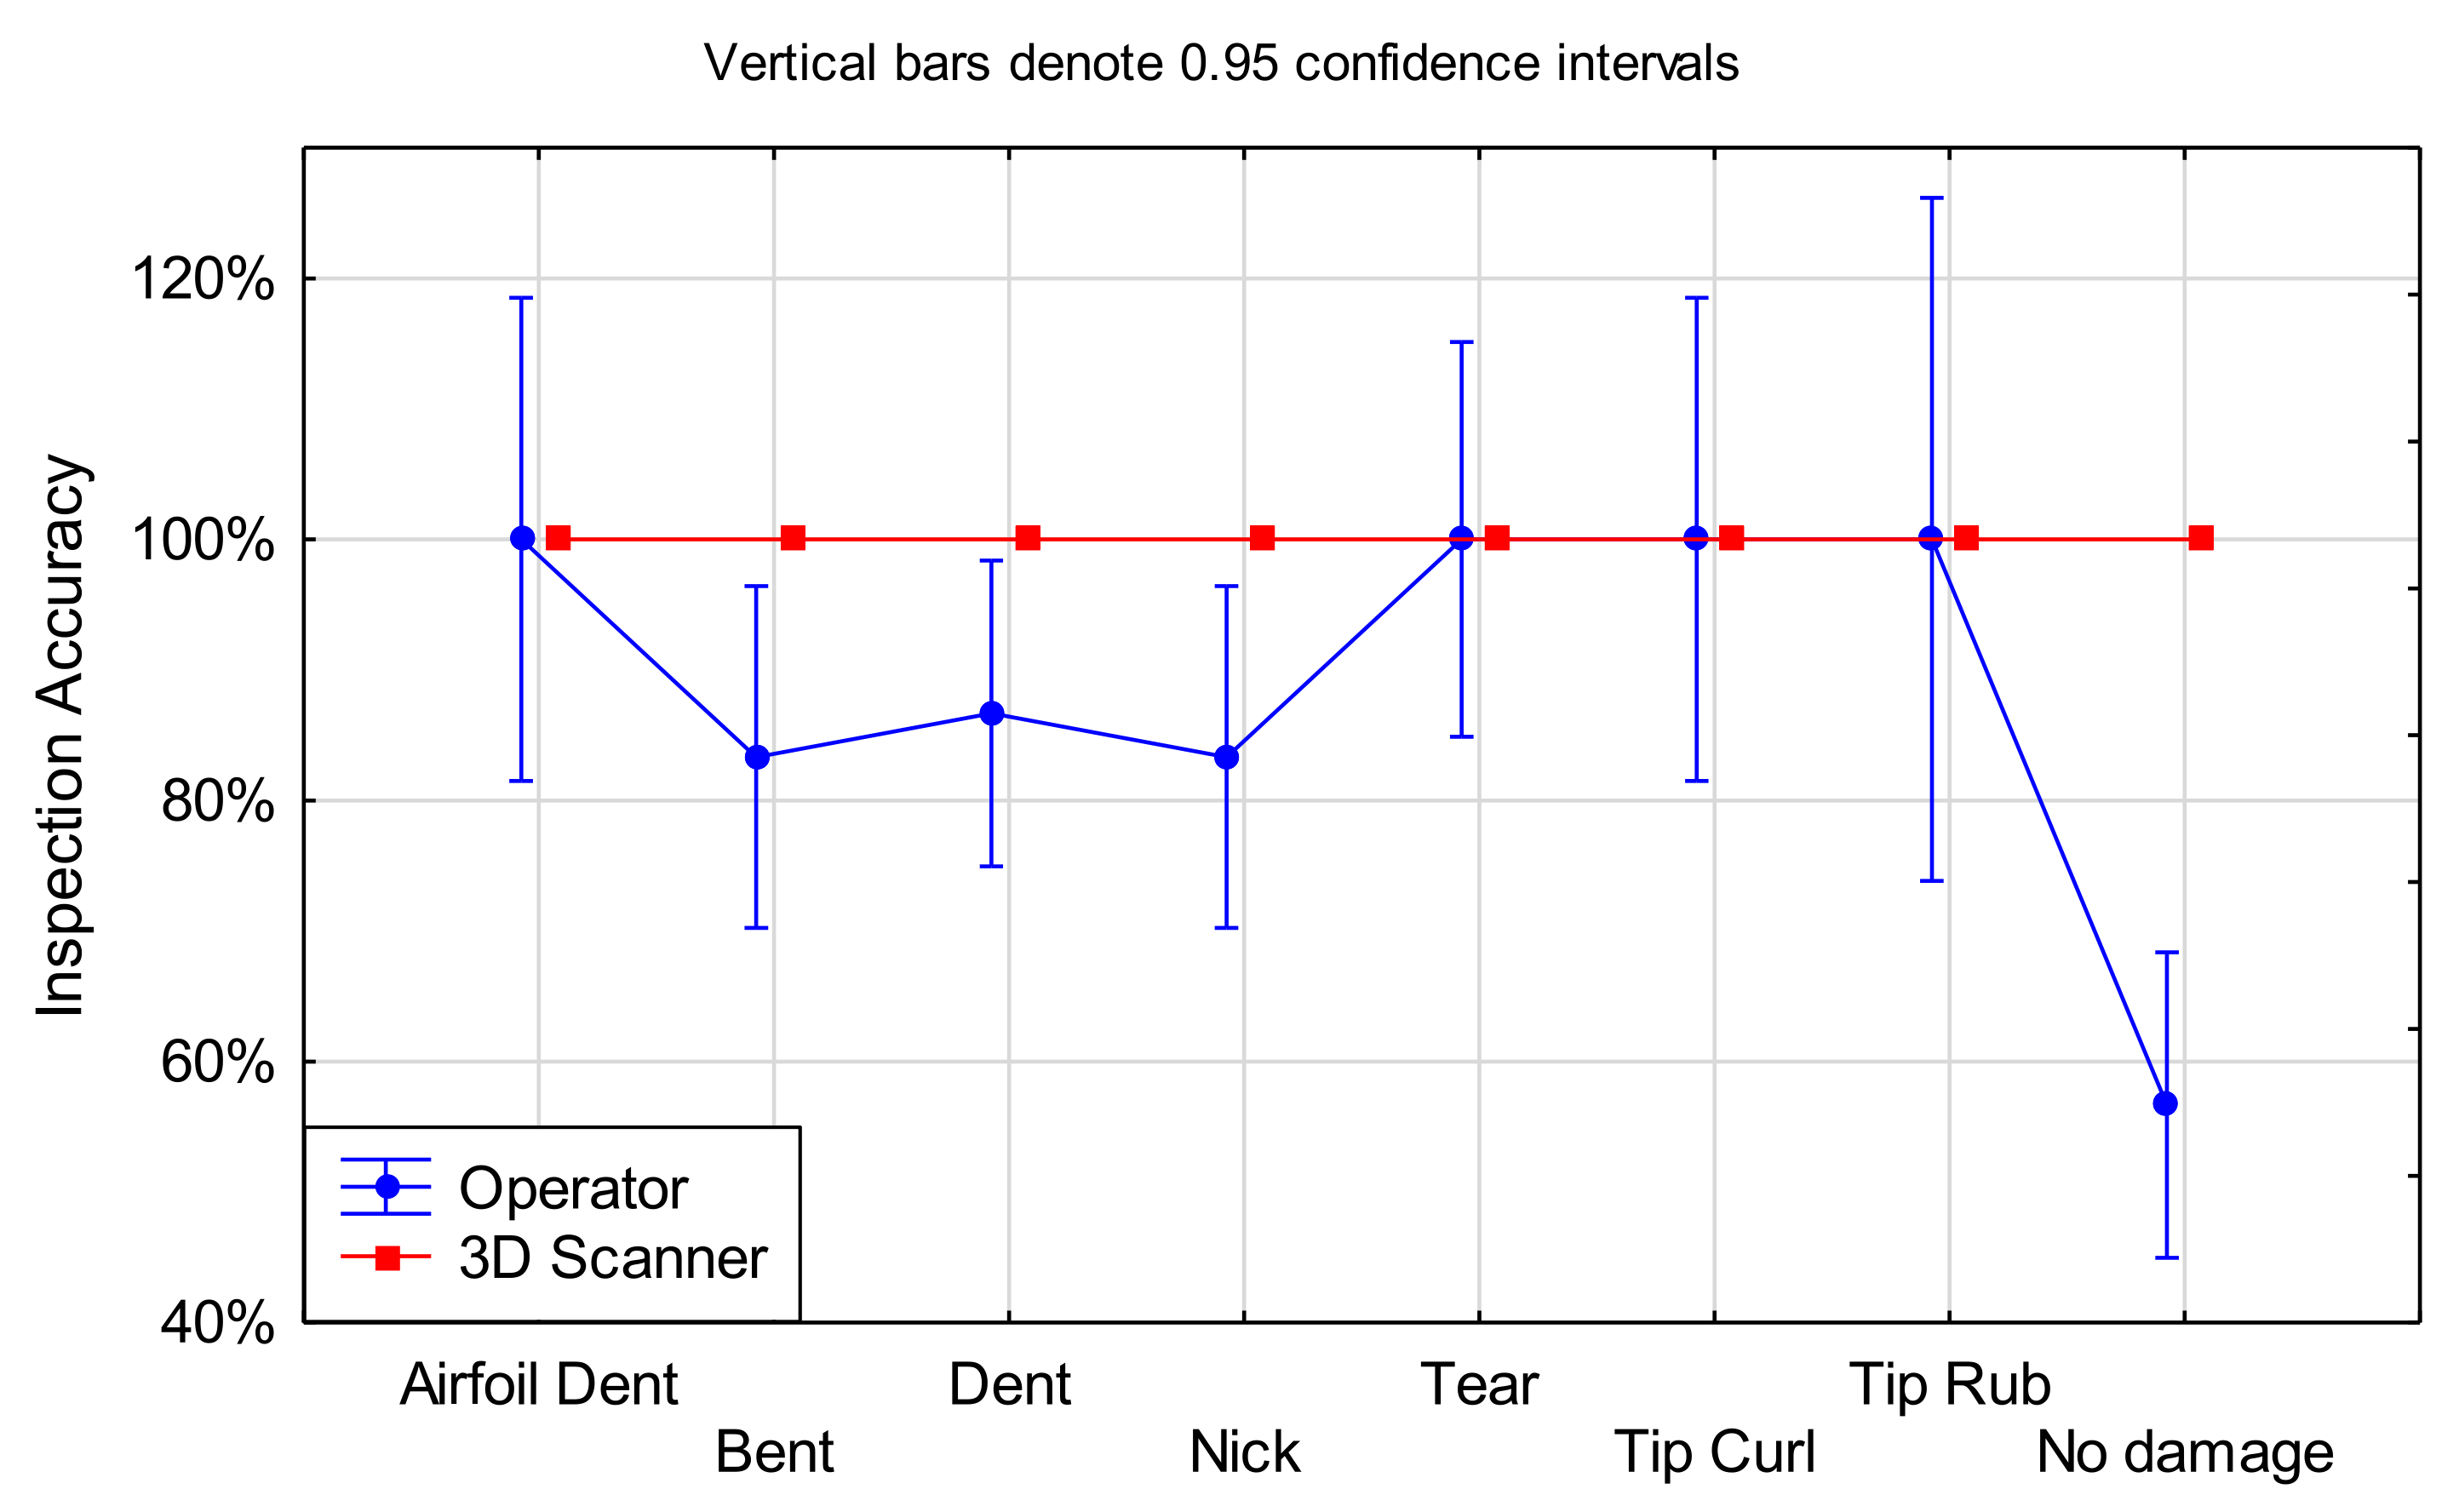
Hypothesis H1. The inspection performance measured in (a) inspection accuracy, (b) inspection time and (c) inspection consistency of advanced technologies differs to the human operator.
Table 4. SWOT Analysis of human operator and advanced technologies in visual inspection.
Human OperatorIP SoftwareAI Software3D Scanning
Strengths
  • Strong cognitive ability and flexibility
  • Sophisticated decision-making capability
  • Ability to deal with high variation of parts and different defect types
  • Qualified and certified to perform inspection
  • Use of common sense
  • Good performance on small datasets (rare defects)
  • Ability to detect a big variety of defect manifestations (edge defects)
  • Not prone to human factors
  • High repeatability
  • Fast processing times
  • Ability to assist the human inspector in the most challenging and tedious types of inspection, i.e., borescope
  • Continuous learning and improvement of algorithm with each new dataset
  • Not affected by human factors
  • High repeatability
  • Fast processing times
  • High detection rate of any type of irregularity from the ideal shape
  • Defect quantifiable and thus categorisable (accept/reject)
  • High reliability and repeatability
  • Versatile—can scan any part (size constrained)
  • Functional from part quantities of one (CAD model required)
Weaknesses
  • Prone to err
  • Inspection around 68–83% accurate in borescope and piece-part inspection, respectively
  • Performance variances across the system (low repeatability within and between operators)
  • Performance affected by human factors, e.g., complacency, distraction, lack of awareness, lack of knowledge and fatigue
  • Performance static, i.e., does not improve automatically (manual algorithm tuning required)
  • Currently low accuracy (significantly lower than human operator)
  • Does not currently detect surface defects and edge defect with no 3D deformation
  • Slow and manual process (image acquisition not automated)
  • Human error and bias can be programmed into algorithm
  • Requires other assisting technologies (automated, standardised image acquisition), causing additional costs
  • Problems with explainability
  • Currently low accuracy (significantly lower than human operator)
  • Requires large datasets to train algorithm
  • Additional work for operator to label data
  • Only possible for defects with high occurrence, difficult to detect rare defect types (lack of data)
  • Long setup time to train algorithm—additional time for operator to ‘teach’ software and validate results
  • Extensive development process until performance is comparable to human operator
  • Learns from human and may learn errors too
  • Problems with explainability
  • High investment cost
  • Slow scanning and labour intensive, unless fully automated, requiring even higher investment
  • Only suitable for piece-part inspection
  • Difficult to scan reflective parts, thus requires part preparation
  • Sensitive to ambient light and cannot be used outdoors or in bright inspection environments
  • Sensitive to motion of the part or scanner
  • Might require 3D scanning specialist to setup and operate
  • Large footprint not only for scanner but also for parts feed and storage
Opportunities
  • Trusted by regulators and customers
  • Ability to make decisions and sign off tasks
  • Versatile—can perform different tasks in different processes
  • Applicable to other similarly shaped parts (e.g., vanes) without training (only optimisation of the parameters)
  • Enabling smart factories and Industry 4.0
  • Productivity improvement and shorter turnaround times, thus competitive advantage
  • Enabling smart factories and Industry 4.0
  • High technology awareness (trend)
  • Record of operational wear over part life; could be used for reverse engineering
  • Enabling smart factories and Industry 4.0
  • Easy to integrate into inspection operations
  • Opportunity to develop 3D scanning for borescope inspection
Threats
  • Intentional or unintentional disregarding of SW, regulations and procedures (norms)
  • Organisational pressure
  • Seen as untrustworthy, unreliable and unethical
  • Requires regulatory approval (legislation)
  • Risk and responsibility of incorrect decision
  • Discordance between software and inspection expert
  • Seen as untrustworthy, unreliable and unethical
  • Risk and responsibility of incorrect decision
  • Primarily supplied by one vendor
  • Discordance between AI and inspection expert
  • Might become bottleneck of operations
  • Risk and responsibility of incorrect decision
Table 5. Description of criteria for weighted factor analysis.
CriteriaDescription
AccuracyInspection accuracy is the proportion of correct serviceability decisions and number of blades inspected.
ConsistencyRepeated inspection outcome when presented with the same blade twice (assessor agreement with themselves).
Inspection timeTime required to inspect each part.
Investment costInitial procurement and setup cost.
Operating costCost for operating the system including license cost, maintenance cost and supervision cost (as applicable).
H/TRLHow much time and effort for training and development is required to bring the inspection agent up to the required performance level?
AgilityHow easily can the inspection agent be transferred to the inspection of a new (different) part?
FlexibilityHow resistant is the inspection agent to changing inspection environments (e.g., different perspective or part condition)?
InteroperabilityHow well can the system be integrated into the operational environment and interact with other processes (in light of smart factories, interconnectivity and Industry 4.0)?
AutomationCan the system be fully automated?
StandardisationDoes the inspection agent support standardisation?
DocumentationHow accurate are the recordings of the inspection results?
ComplianceIs the inspection system approved by aviation authorities and does it comply with regulatory requirements?
Table 6. Summary of inspection performance by inspection method and inspection agent.
Piece-Part Inspection
(Image-Based)
Borescope Inspection
(Image-Based)
Visual–Tactile Inspection
(Part-Based)
HumanIP SoftwareHumanAI SoftwareHuman3D Scanner
Inspection Accuracy76.2%48.8%63.8%47.4%84.0%100.0%
Inspection Time14.972 s0.203 s20.671 s0.025 s22.140 s55.000 s
Table 7. Benefits and limitations of humans versus advanced technologies.
Human OperatorAdvanced Technology
Benefits
  • Applies common sense
  • Sophisticated decision- making capabilities
  • Strong cognitive ability
  • Versatility
  • General intelligence
  • Ability to ask questions and overcome uncertainties
  • Improves with experience
  • 24/7 availability
  • Faster processing, thus higher efficiency
  • Higher system repeatability
  • Rational and unbiased decision making
  • Excels at dealing with large amounts and high-dimensional data
Limitations
  • Affected by human factors
  • Prone to err
  • High inconsistency
  • Lacks contextual knowledge
  • Difficulties with decisions that require general understanding
  • High implementation cost
  • Often requires other assisting technologies (more cost)
  • Technological dependency
  • May cause laziness and complacency of human operator
  • Lack of understanding the effect the decision has (look-ahead [100])
Publisher’s Note: MDPI stays neutral with regard to jurisdictional claims in published maps and institutional affiliations.

