1. Introduction
The main component of the loss resistance of vehicles and mobile work machines with wheeled chassis in forestry is rolling resistance. A significant part of their movement is often carried out on public roads or on paved surfaces of forest roads. The flexibility of these surfaces is very small and therefore the deformation of the tires is mainly applied at these places. This significantly affects their final value of rolling resistance and the overall driving energy efficiency on a paved rigid surface. It is well-known that lower tire inflation pressures can be used on forest soil in the stand to improve throughput and reduce compaction of the stand soil. This is partially an advantage over crawler vehicles, where the resulting contact pressure on the soil depends on the used construction of the vehicle mechanism [
1]. The correct choice and use of suitable tire inflation pressures is important not only from an environmental point of view, but also from an economic one. The correct choice of tire inflation pressure significantly affects the passability of the terrain and affects the overall life of the tire. This work is focused on measuring rolling resistance on a solid surface, which is not possible to demonstrate in forest conditions; however, in this paper, it is indicated that the right choice of tire inflation pressure on the surfaces forming a part of the road surface in forestry is essential and it cannot be underestimated. At present, there are technical means by which it is possible to achieve a change in the inflation pressures of the wheels relatively quickly and without a great physical load on the mobile mechanization means. These systems are called Central Tire Inflation System CTIS. The significant issue in this direction is also the choice of the right fitting of mechanization means, especially a suitable choice and selection of the type, construction, size and load capacity of tires for individual wheels. According to Adams [
2], with this choice and application of the CTIS system, it is possible to pass up to 10% of terrains that were previously unavailable for mechanized vehicles with wheeled chassis.
Rolling resistance can be defined as the energy loss caused by the rolling of a tire and its imperfectly elastic deformation, as well as the springing of the tire [
3]. As reported by Andersen et al. [
4], of the total CO
2 emissions produced annually in the USA, up to 29% is accounted for by the transport and relocation sector of mobile work machines, which takes place on solid surfaces. This percentage is not negligible, so reducing the rolling resistance of the tires used in these vehicles is an important task.
The tire deforms by the action of vertical (radial), circumferential and lateral forces during driving [
5]. When the tire is loaded with a vertical force (the weight of the vehicle), the part of the curve of the running surface of the tire (tread) which meets the road surface must be compressed to a certain length. After turning the tire, a part of the running surface is lightened, so that the part of the rubber which was previously compressed expands. In a similar way, the running surface deforms in the transverse direction. After unloading, the rubber particles expand. In this way, the tire particles are alternately compressed and expanded in a circumferential and transverse direction by a certain frequency depending on the speed of the wheel, and thus also on the speed of the vehicle or machine [
6]. The deformation work caused by the action of the mentioned vertical, circumferential and lateral forces does not return completely after the tire is relieved. Part of the work is focused on overcoming the hysteresis losses of the tire. According to Luchini and Popio [
7], the cause is the imperfect flexibility of the tire, which does not completely return to its initial state due to its own damping after unloading. The rolling friction resistance is related to the work for overcoming tire losses. Part of the rolling friction is also the partial slip of the tread figures in the contact surface and the losses associated with the adhesion and tearing of the tread figures from the road surface [
8]. At very high speed, the rolling friction resistance is supplemented by the resistance associated with the formation of waves in the tire tread behind the contact surface [
9]. The less resistant the tire is, the less rubber participates in the deformation of the tire.
The roughness, respectively micro and macro-relief of the road surface on which the tire rolls often complicates the correct determination of the final value of the rolling resistance of the monitored tire [
10,
11].
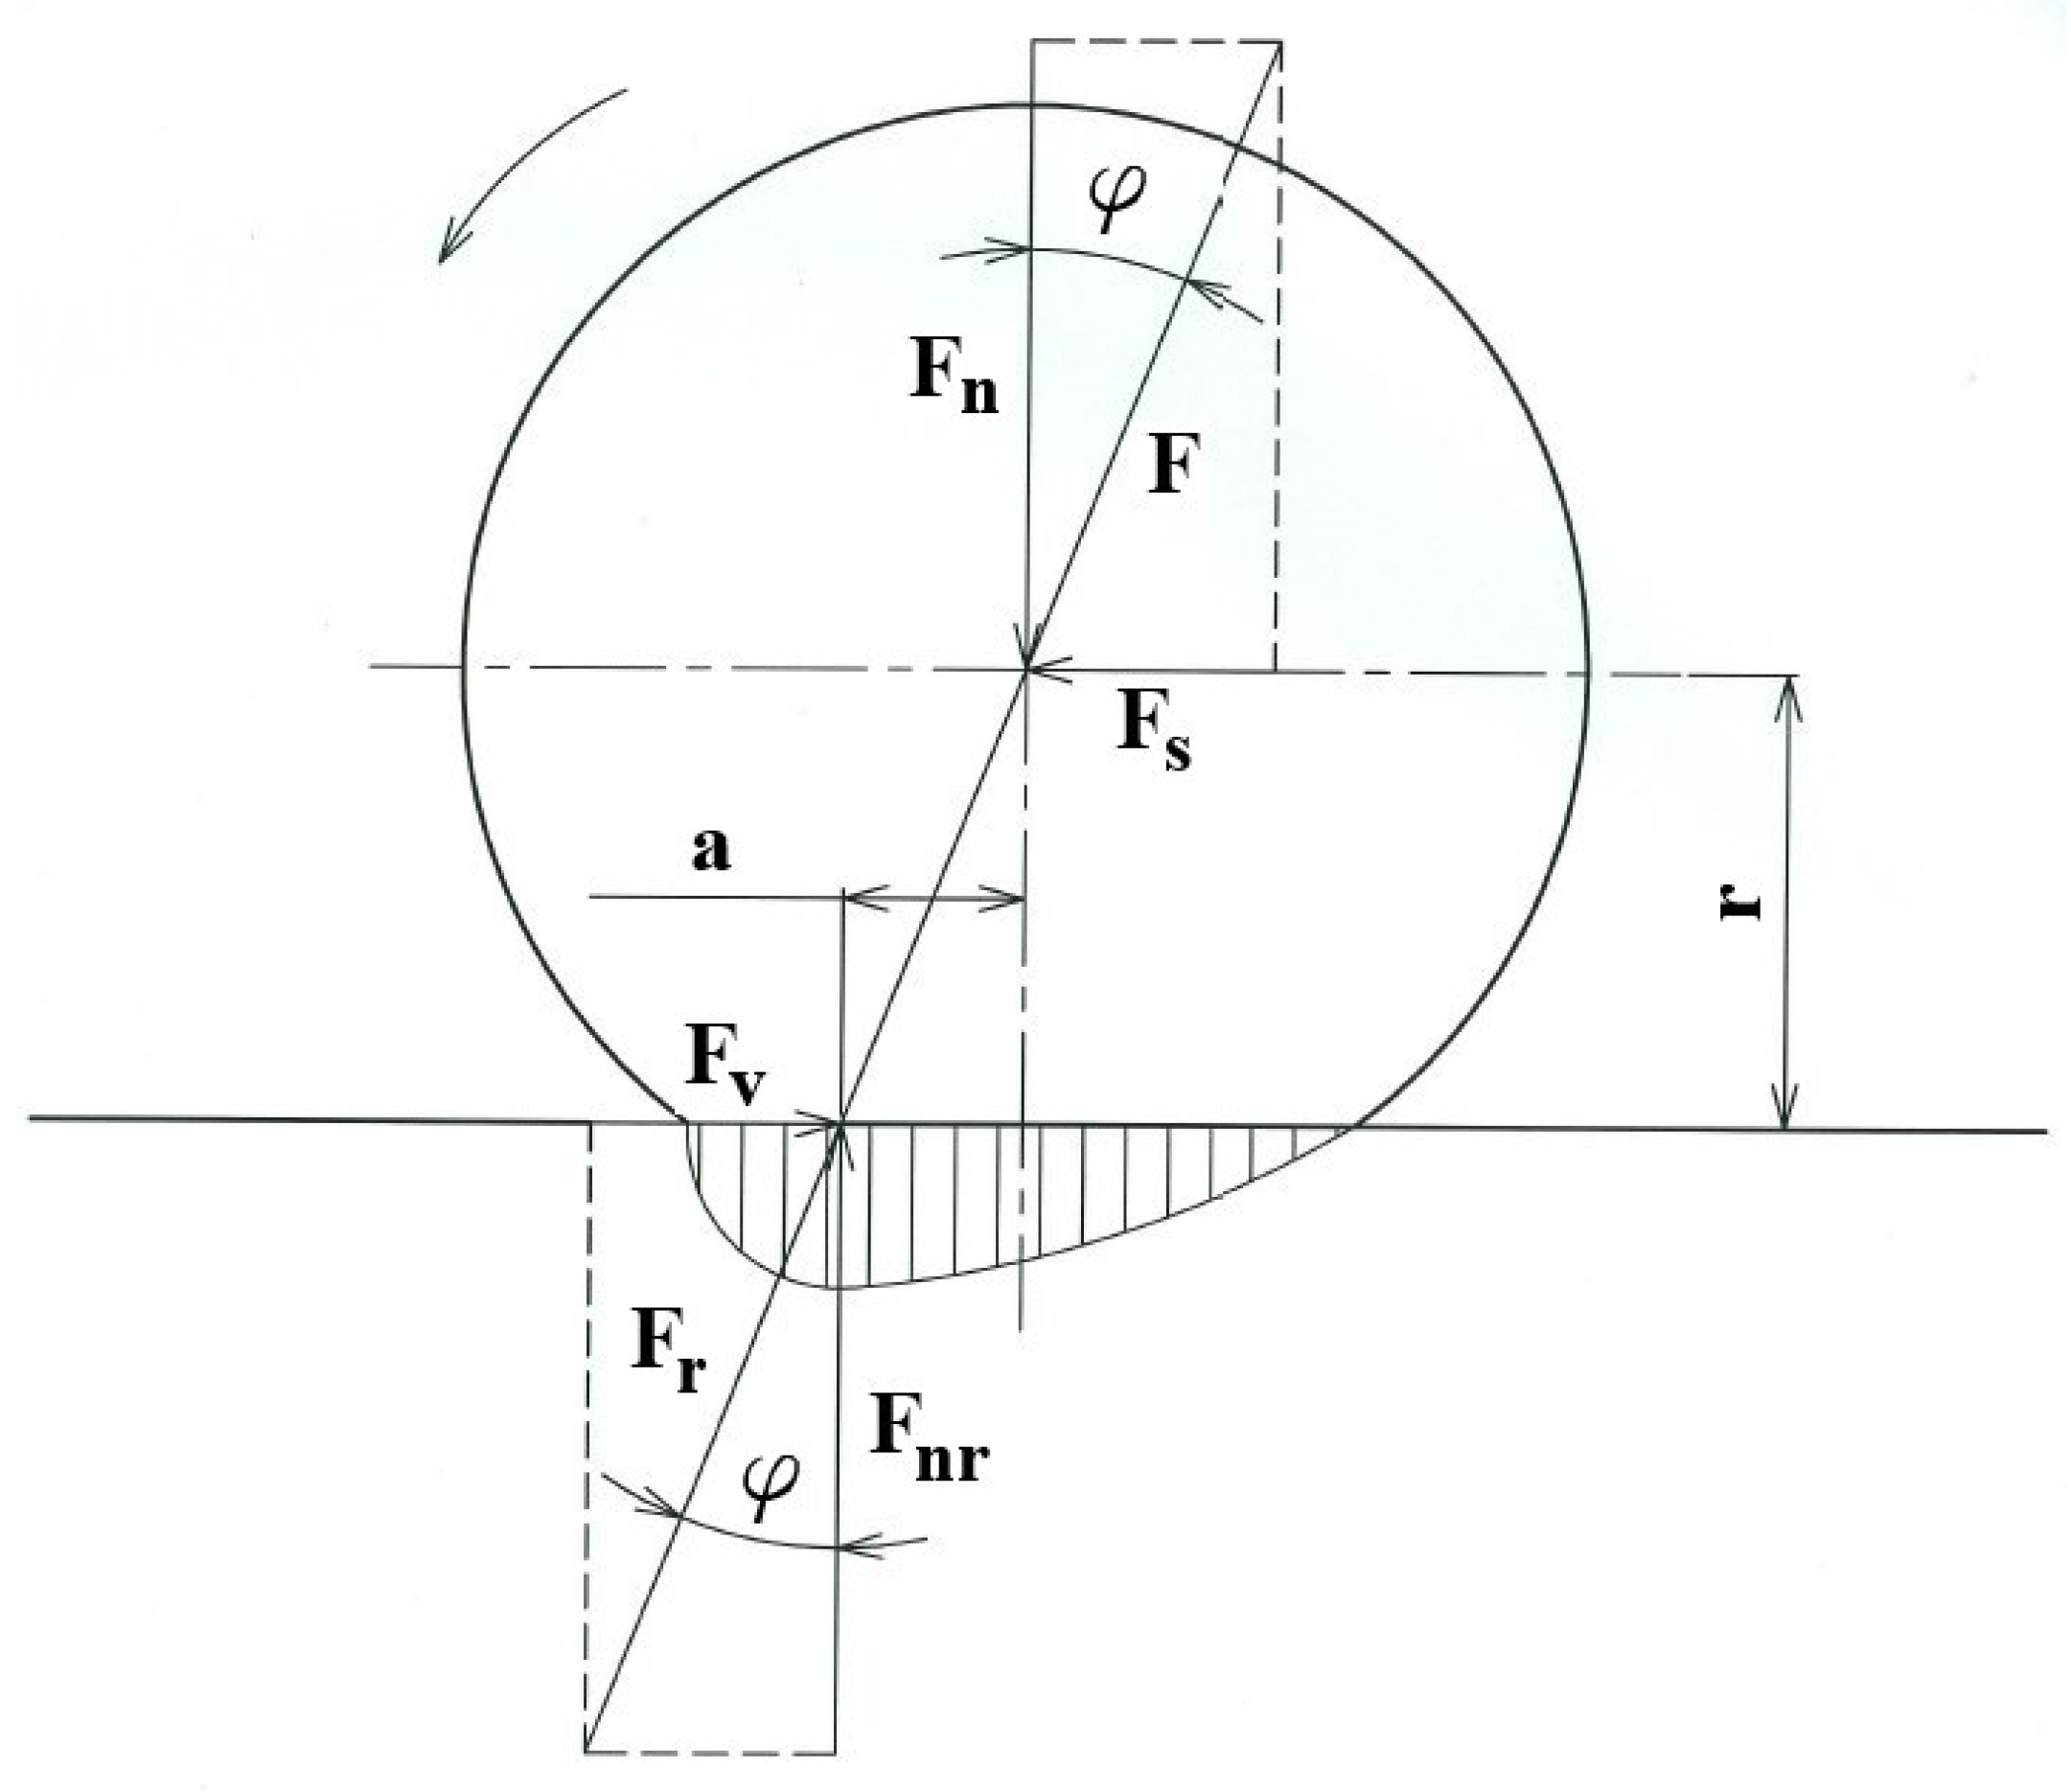
Due to the focus of the paper and the performed experiment, the following text is focused on the movement of a non-driven wheel rolling on a rigid (inelastic) pad. This means that during its rolling there is considered only the deformation of the tire. The force caused by the weight of the vehicle
Fn and the pushing (sliding) force of the axle
Fs act on the wheel axis (
Figure 1). Adding both forces, there is an obtained result
F. The reaction of the substrate
Fnr acts against this force. The reaction of the pad can be decomposed in a horizontal and vertical direction. This gives a horizontal reaction
Fv rolling friction resistance and a vertical reaction
Fnr. The vertical reaction
Fnr is shifted forward by a value with respect to the wheel axis. The causes of this phenomenon can be explained as follows [
12]. When the tire is rolled, the tire is compressed in the front part of the contact surface and released in the rear part of the contact surface. At this place, the deformation work spent on deforming the tire in the front part of the contact surface is greater than the part of the work recovered in the rear part of the contact surface and behind it when the running surface springs into its original circular shape. The missing part of the work is used to overcome the internal friction of the tire and it is converted into heat manifested by the heating of the tire. It follows that greater vertical forces are required to deform the tire in front of the running surface, so that the running surface of the tire exerts a higher pressure on the pad. In contrast, in the rear part of the running surface, the tire exerts less pressure on the pad due to its imperfect flexibility (due to internal losses). Therefore, even elementary vertical reactions are larger in the front part of the contact surface than in its rear part. The resulting vertical reaction
Fnr acting at the center of gravity of the elemental reaction pattern is therefore shifted by the value “a” in front of the wheel axis.
The vertical reaction
Fnr, together with the wheel load
Fn, represent a pair of forces creating a moment of rolling friction resistance acting against the rotation of the wheel.
In order for the tire wheel to continue to move in a uniform motion, a pushing (sliding) force
Fs must act on its axis. The compressive force of the axle
Fs, together with the horizontal reaction of the pad
Fv, gives a pair of forces acting against the moment of resistance of the rolling friction to the moment:
The magnitude of the rolling resistance
Fv is determined from the equilibrium condition of the above moments:
The ratio
is the rolling resistance factor. Its geometric meaning is the tangent of the angle
φ.
Experimental device.
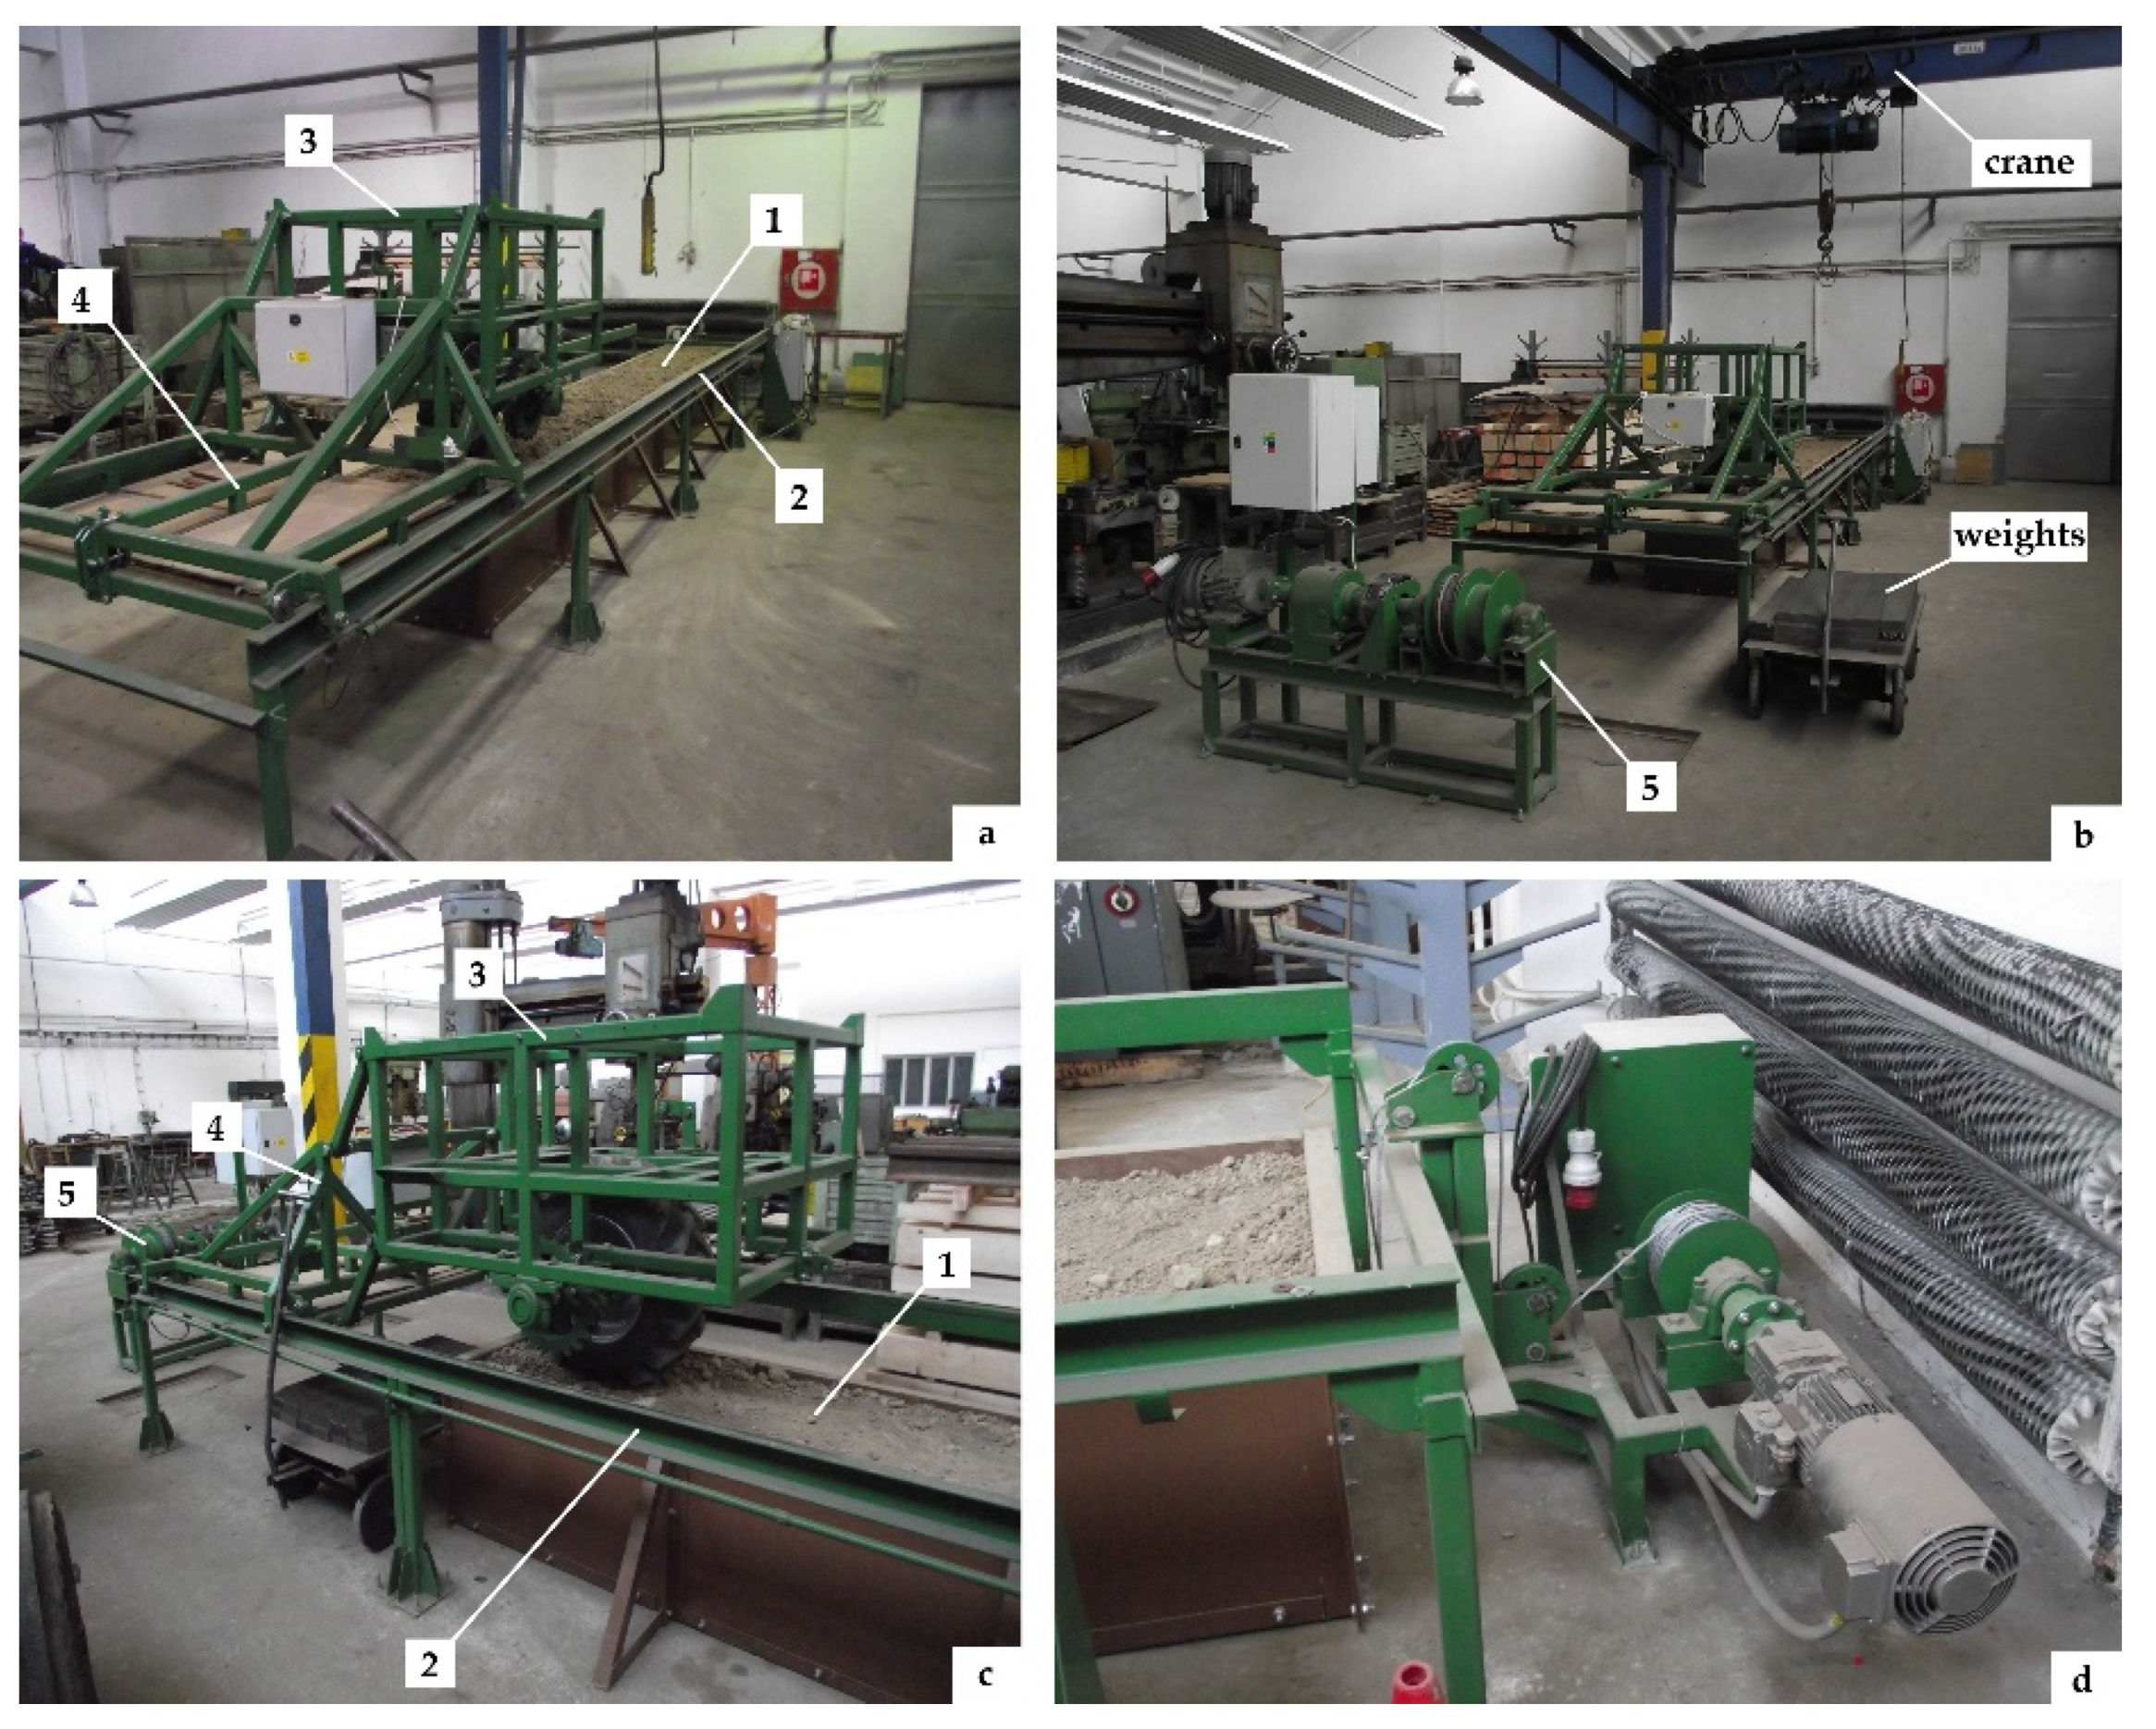
The basis of our proposed test equipment is the soil channel of the cabinet construction (
Figure 2, pos. 1). Its length is 6550 mm, width is 690 mm, and depth is 500 mm. Its working volume is 2.26 m
3. The construction is modular and it can be extended to the required length. In order to ensure the working position, the supporting pillars of the channel are anchored to the concrete floor of the laboratory.
Next to the soil channels there is a side guide (
Figure 2, pos. 2) of the guide frame (
Figure 2, pos. 4). Its length is 9000 mm, and as in the case of the soil channel, it can be extended to the desired value by connecting additional welded steel beams. The beams of the side guide 2 of the guide frame 4 are also fixed to the concrete floor of the laboratory. This ensures its stable position and absorbs the lateral and vertical forces acting on the guide frame 4. The side guide 2 serves to longitudinally guide the guide frame 4, and its main task is to guide the main frame of the tested wheel (tire) in a straight direction (
Figure 2, pos. 3). The guide frame 4 and the main frame with the wheel 3 are connected to each other by means of four guide bars of square cross-section. The main wheel frame 3 comprises a wheel drive mechanism and at the same time carries additional weights by means of which it is possible to change the vertical load of the wheel. The main frame of the wheel 3 has a weight of 450 kg including a drive mechanism, while this weight can be increased up to 1500 kg by means of additional weights. The drive of the tested wheel is provided by a Siemens 1LA7 133-4AA electric motor with an output of 7.5 kW and a nominal torque of 49.2 N.m. The torque multiplication is ensured by means of a STM ARP 100/3 gearbox with a total gear ratio of 40.6 and a chain gear with a total gear ratio of 2. The total gear ratio of the wheel drive mechanism is thus 81.2.
The traction resistance when the wheel travels in the channels is derived by means of a braking device located at the end of the soil channel (
Figure 2, pos. 5). It consists of a winch and a winding electric motor Siemens 1LA7 113-4AA, power 4 kW. The braking effect is derived mechanically by means of brake shoes pressed against the circumference of the brake drums by means of a lever mechanism with weights (currently not installed). The resulting braking force can reach up to 10 kN. The winding electric motor is used to move the whole mechanism backwards. At the same time, it allows measurements to be performed on the tires of trailing wheels, when the motor drive of the wheel is deactivated and the whole mechanism can move only by winding the electric motor of the brake. The function of the brake during traction tests and winding to the initial position by means of the electric motor of the winch is ensured by two electromagnetically controlled clutches engaging the brake or the electric motor of winding as required. The whole device is supplemented by an auxiliary (return) winch (
Figure 2d) serving to move the main frame 3 with the wheel to the initial position for measurements on trailed wheels.
The device can also be operated without a soil channel. The construction allows the drive wheel frame to lower to the concrete floor and perform the required measurements on it. This is especially important in cases where it is needed to determine the effective rolling resistance component (external component of the total rolling resistance) after previous soil tests in the test channels.
Derivation of the vertical load of the tested wheel is ensured by means of mechanical weights weighing 32 kg. These are placed on the upper grate of the main frame of the tested wheel.
The maximum possible diameter of the tested tire is 850 mm, the minimum diameter of the tire is 450 mm. This dimension is influenced by the dimensions of the main wheel frame. As for the width of the tires used, the situation is more variable here; it also depends on the construction of the rim and the mounting connecting flange. In principle, the width of the tire should not exceed 450 to 500 mm. The construction of the soil channel was inspired by the authors Tiwari et al. [
13].
2. Materials and Methods
Rolling resistance is the starting point for further testing of tires in the field of traction properties and significantly affects its energy efficiency. As an example of the obtained results, there are measured values for diagonal tires Mitas TS05 10.0/75-15.3 10PR and Mitas TS04 6.00-16 6PR. Their basic technical parameters according to the manufacturer’s data are given in
Table 1.
The rolling resistance measurements are performed on a concrete surface to determine the rolling resistance of the monitored tires. The measurement methodology for the tire rolling resistance was simple and based on pulling the main frame with the tire using a braking and winding device (
Figure 2a, pos. 5). A force sensor from HBM S9M/10 kN with a nominal size of 10 kN was used to sense the magnitude of the tensile force. The signal from the sensor was then recorded by the HBM Quantum X MX 840A measuring control panel controlled by a computer with HBM Catman Easy software. This enables the subsequent conversion of the recorded files into MS Excel by which the measurement results were also evaluated. The pulling speed of the tire due to the cramped conditions and the dimensions of the side guide of the guide frame was at the level of 0.1 m·s
−1. A certain disadvantage of the device proposed by us is that due to the above-mentioned proportions of the device, it is not possible to monitor the influence of the rolling speed of the wheel, e.g., to change the size of the monitored rolling resistance. The measurement was performed at tire inflation pressures of 100 kPa, 150 kPa, 200 kPa, 250 kPa and 300 kPa. The vertical load of the tire was chosen in five levels, namely 222 kg (weight of the main frame without the wheel drive mechanism and without weights), 350 kg, 478 kg, 606 kg and 734 kg. For the Mitas TS04 6.0-16 6PR tire, a load level of 734 kg was omitted, as this would exceed the permissible tire load specified by the manufacturer for the given inflation pressure levels. Mechanical weights made of 32 kg steel plates were used to load the tire. As the experimental equipment is relatively new, there was a decision taken that when performing the first measurements, maximum values that the monitored tire allows were not used as the loads; however, the behaviour of the whole equipment under gradual loading both in terms of strength and dimensioning of individual aggregates drives was monitored. The second reason is also the maximum possible load of the Mitas TS04 6.00-16 6PR tire for the given inflation pressure levels, as well as the need to compare the achieved results.
Because the wheel drive system was removed from the device due to the maximum lightness of the tested tire, the main wheel support frame was returned to the initial position by means of an auxiliary winch with 1.5 kW located at the other end of the soil channel (
Figure 2b). The tire inflation pressures and their vertical loads have been chosen to meet the technical requirements set by the tire manufacturer and to avoid unnecessary overloading, reducing their service life.
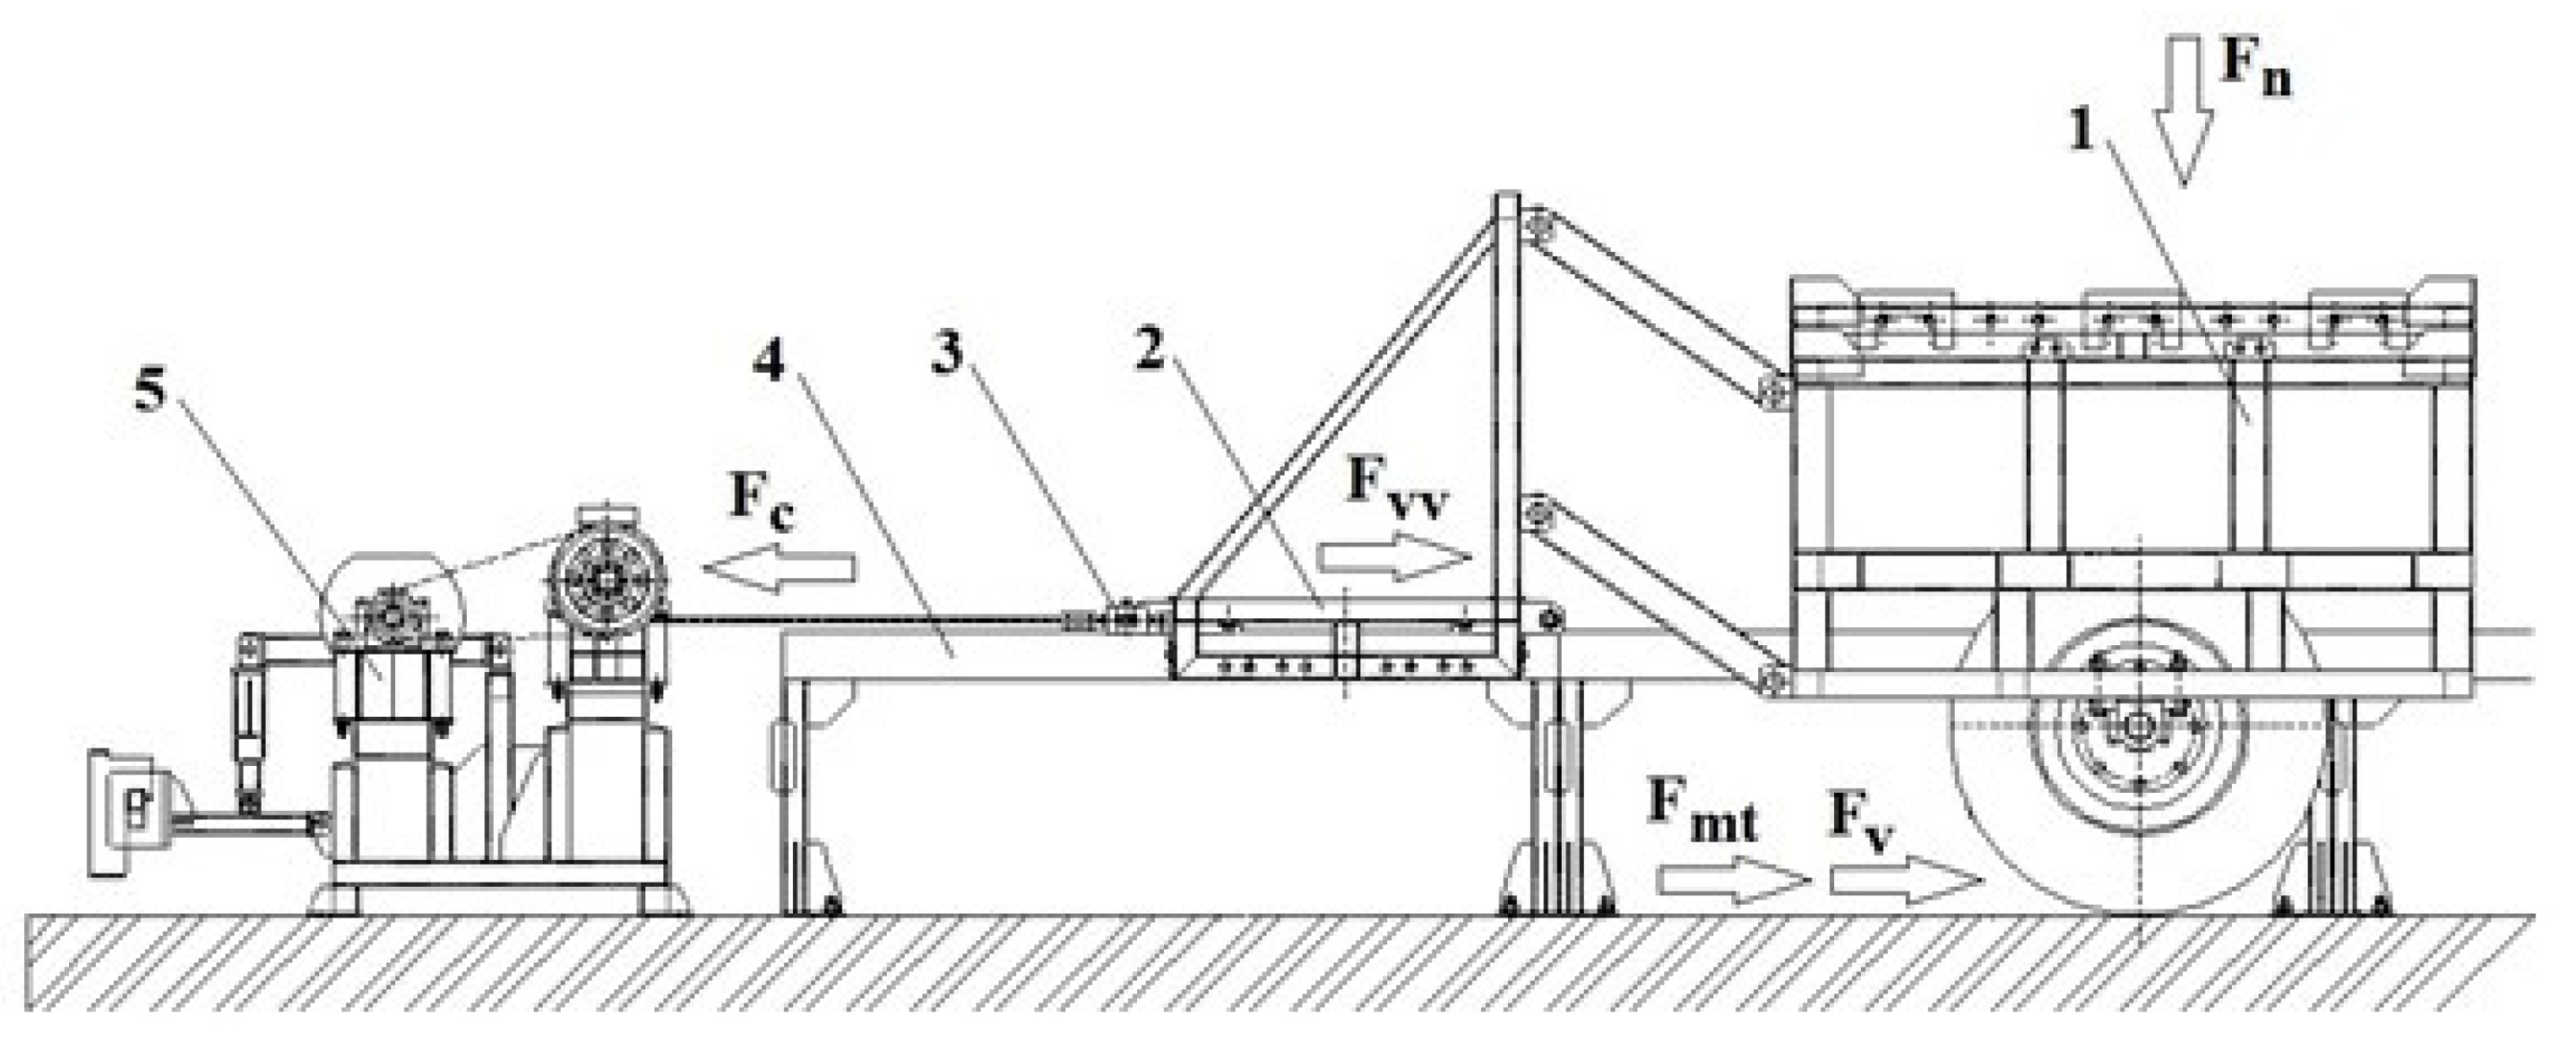
In the method of measuring the rolling resistances of tires conceived in this way, the total measured tensile force consists not only of the rolling resistance components, but also of other resistance forces, which must be considered in the calculation (
Figure 3).
The following applies to the total measured resistive force according to
Figure 3.
Fv—rolling resistance of the trailing tire, [N]
Fvv—resistance in the guide frame, [N]
Fmt—frictional resistance force in bearings, [N].
From Equation (5), the value of rolling resistance can be expressed in the form as follows:
The friction resistance in the guide of the guide frame Fvv based on the free pulling of the guide frame without the connected main frame with the wheel was determined. This measurement was performed before the actual measurement of tire rolling resistances using the measuring set described above. Its value was around 79.82 N.
The relation for the resistive friction torque in the wheel shaft bearings is as follows:
μ—coefficient of friction in bearings, [−]
P—equivalent dynamic bearing load, [N]
d—the diameter of the shaft at the bearing location, [m]
The disadvantage of this relation is that it applies exactly to a bearing load of size
, where
C is the basic dynamic bearing capacity [
14]. In many cases, this strength was overcome. Regarding the choice of the coefficient of friction in the bearings, the value
μ = 0.001 was used for the given type of bearings and the given method of lubrication with that’s all right.The force of frictional resistance in the bearings is then calculated according to the following formula:
R—tire wheel rolling radius, [m]
The radial reactions of the wheel shaft bearings were not measured. The measurement was based on the force diagram and the dimensions of the shaft mounting in the bearings. This means that from the known value of the vertical load of the wheel, the reactions of the bearings were calculated, which determined the equivalent dynamic load of the bearings. According to the performed calculations, the force of friction resistance in the bearings Fmt is very small and ranges at the level of max. 1.5 N. In order to reduce this resistance, the wheel bearing housings are not equipped with a contact seal. Thus, only friction in the bearings was applied. The rolling radius of the monitored tires at each tire inflation pressure level and the given vertical load were measured using a mechanical altimeter.
The appropriate value of the rolling resistance coefficient was calculated according to the following formula:
Fn—normal (vertical) tire load, [N].
The rolling resistance measurement was repeated three times for each load level and tire inflation pressure, which determined the resulting value as the arithmetic mean of these measured values. When measuring the rolling resistances of the monitored tires, the dependence of the tire slip on the load and inflation pressure was not determined.
3. Results
As mentioned above, the methodology of measuring the rolling resistance of the tire was simple and based on pulling the main frame with the tire using a braking and winding device (
Figure 2a, pos. 5). Thus, the values of the internal component of rolling resistance were obtained.
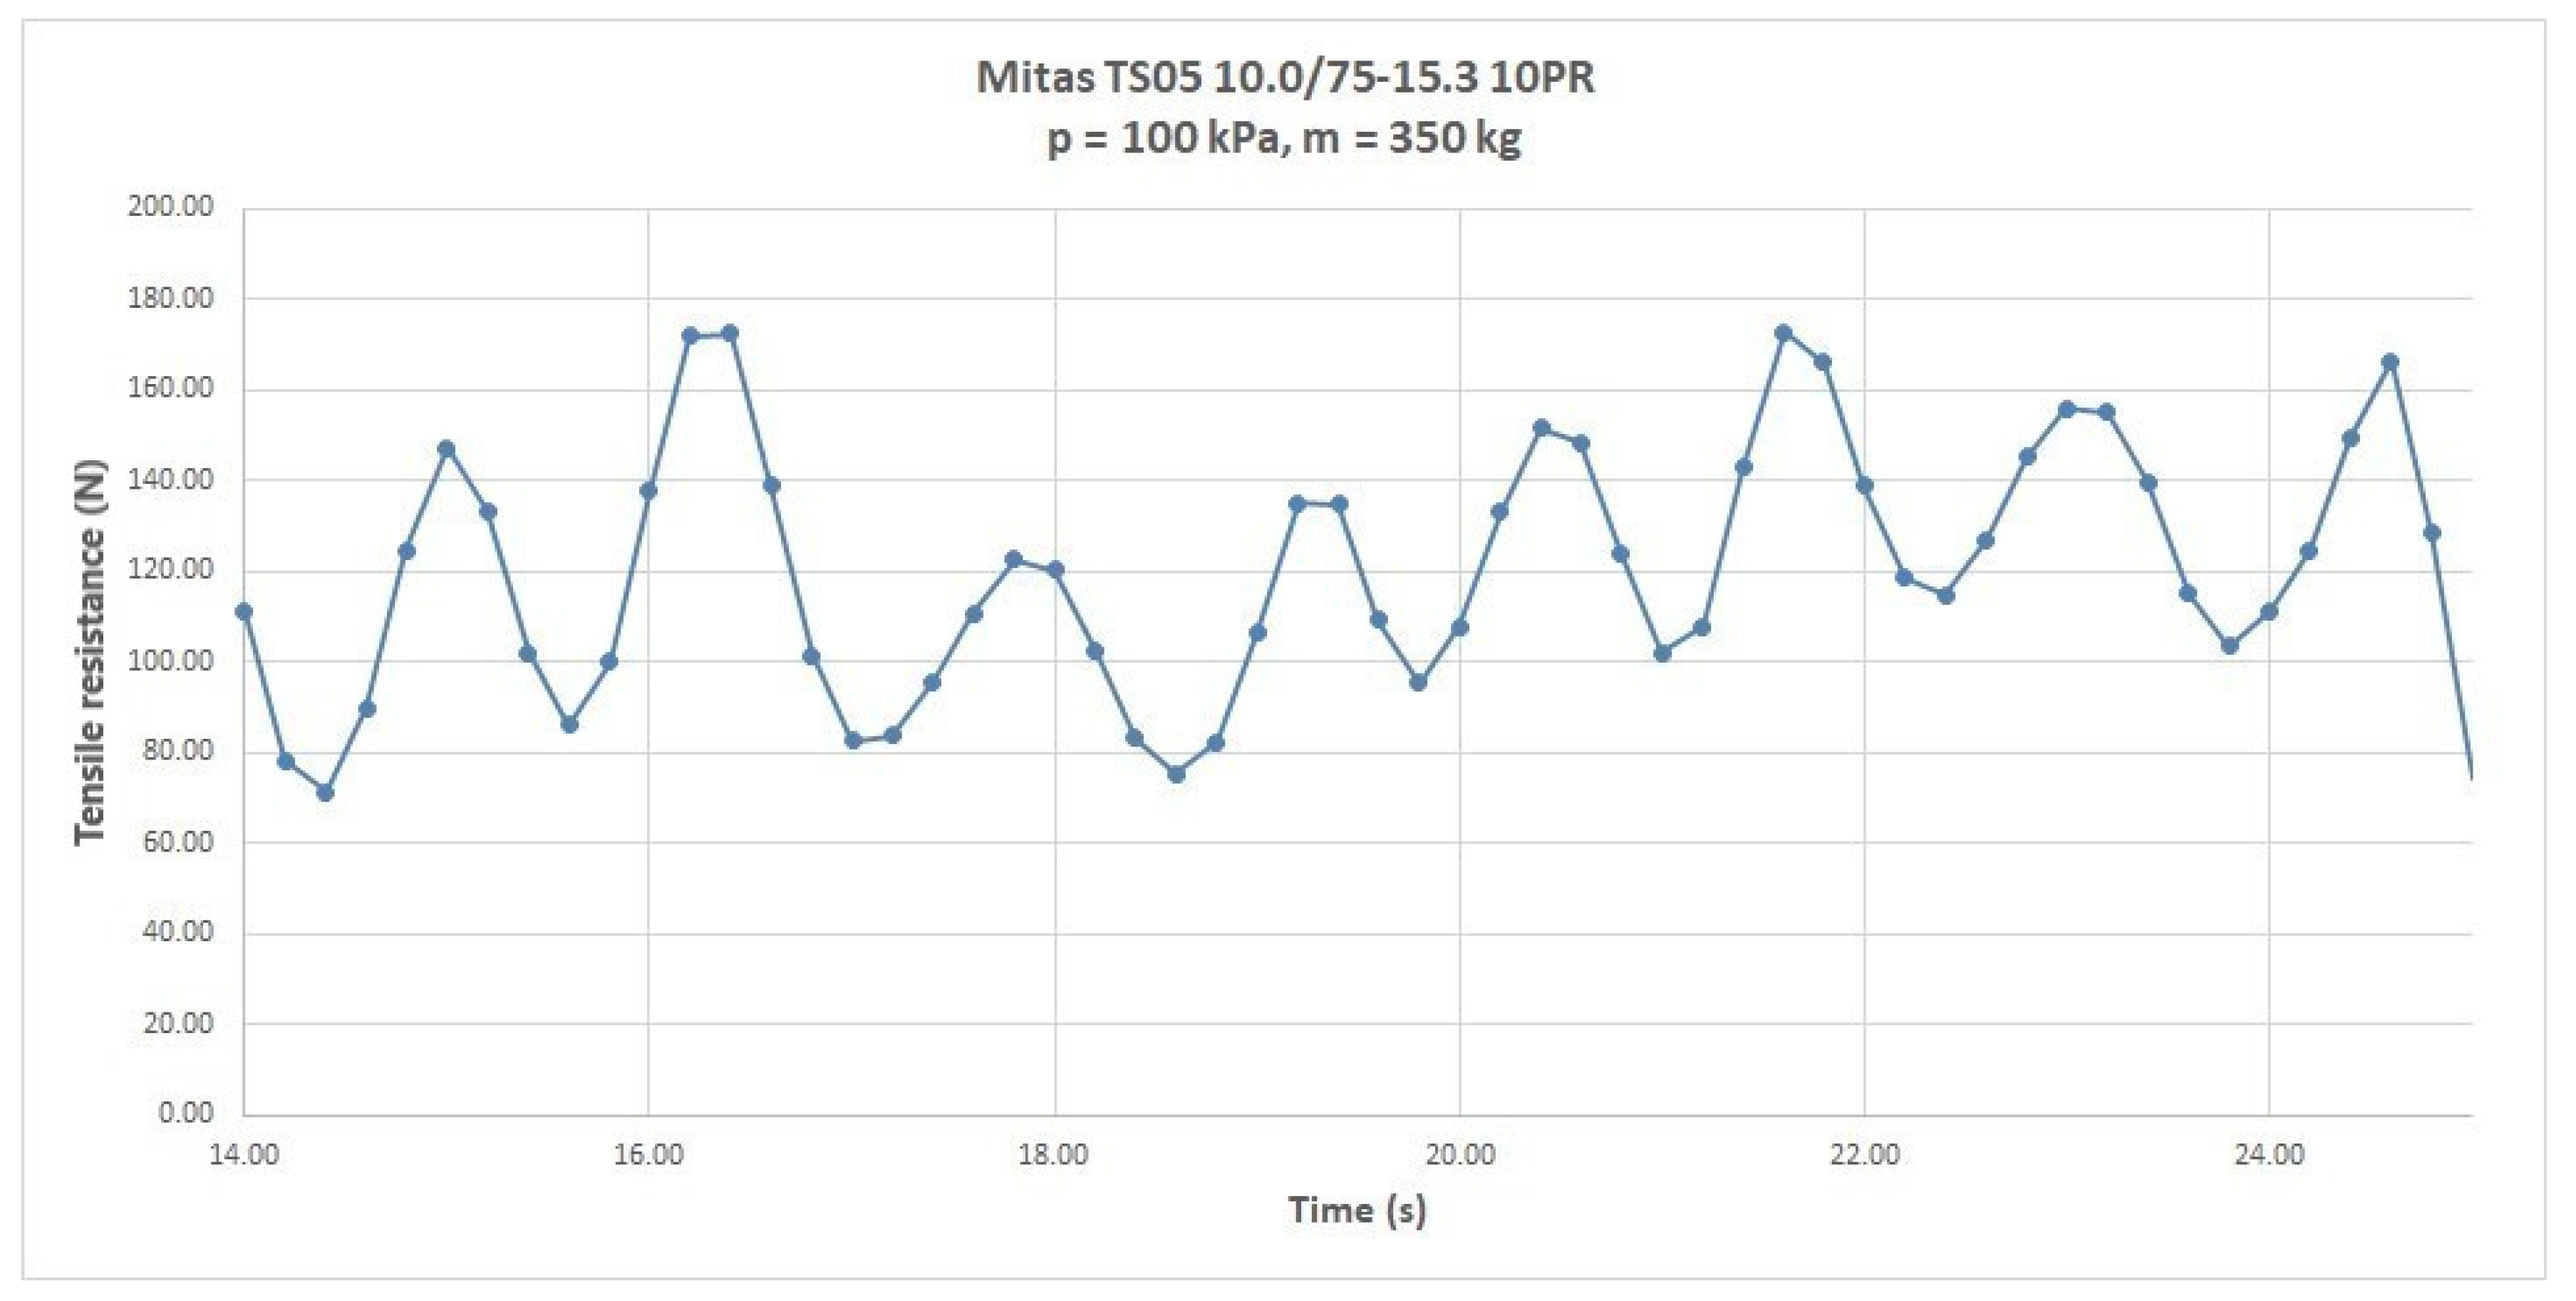
During the measurement, the tensile resistance of the trailing wheel was recorded using a force sensor HBM S9M/10kN with a sampling frequency of 5 Hz. The given value of the sampling frequency was chosen based on the work of the authors Bauer and Sedlák [
15], who used the given value of the sampling frequency in the measurements of the traction indicators of tractors. The measured data were transferred to a personal computer via the HBM Quantum X MX 840A measuring recorder, and transferred to MS Excel files via the HBM Catman Easy measuring software where they were also subsequently processed. The speed of movement of the trailing wheel was 0.1 m·s
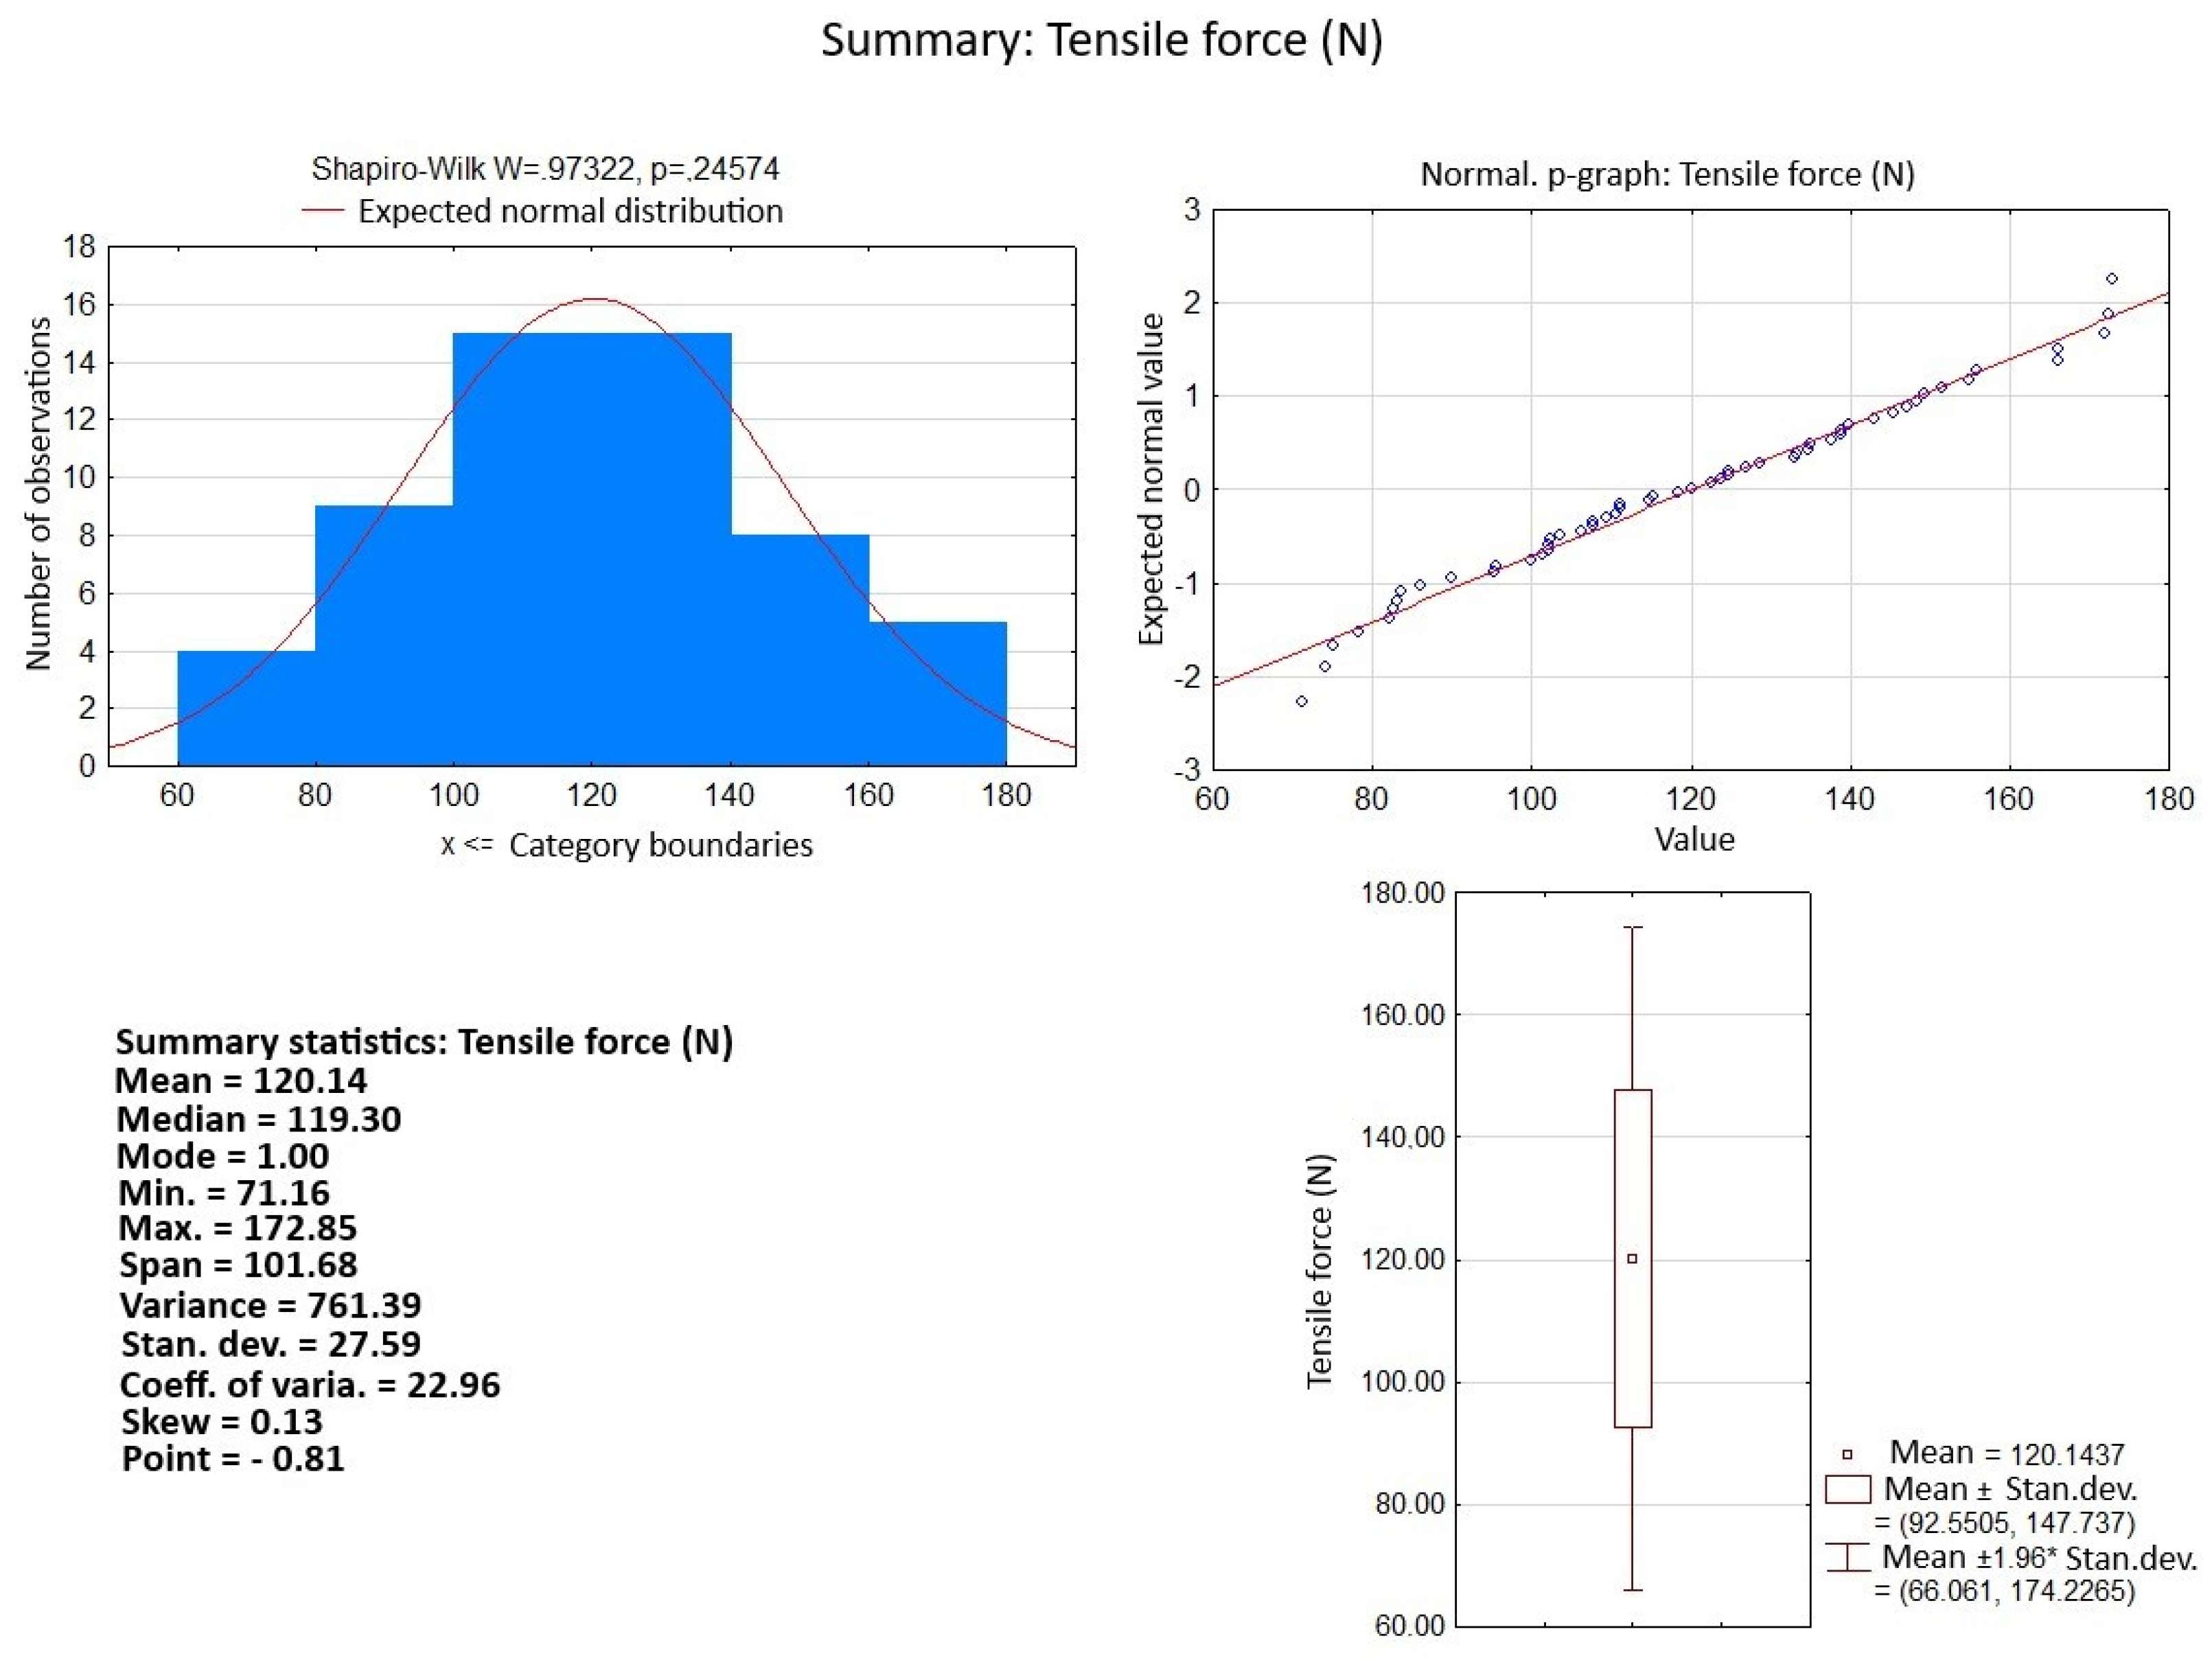
−1. The sets of measured tensile resistances at individual values of vertical load and corresponding values of inflation pressures of the monitored tires were statistically processed in the program Statistica 12 CZ. An example of the course of the measured tensile strength for a Mitas TS05 10.0/75-15.3 10PR tire at an inflation pressure of 100 kPa and a vertical load of 350 kg is shown in
Figure 4. An example of statistical processing of tensile force data is shown in
Figure 5 for a Mitas TS05 10.0/75-15.3 10PR tire with an inflation pressure of 100 kPa and a vertical load of 350 kg.
The hypothesis of distribution normality of measured data at the significance level of 0.05 is not rejected by the Shapiro–Wilk test as the calculated p = 0.24574 is a value greater than the considered significance level of the test (0.05). Similar results were obtained when processing other measured values of tensile force.
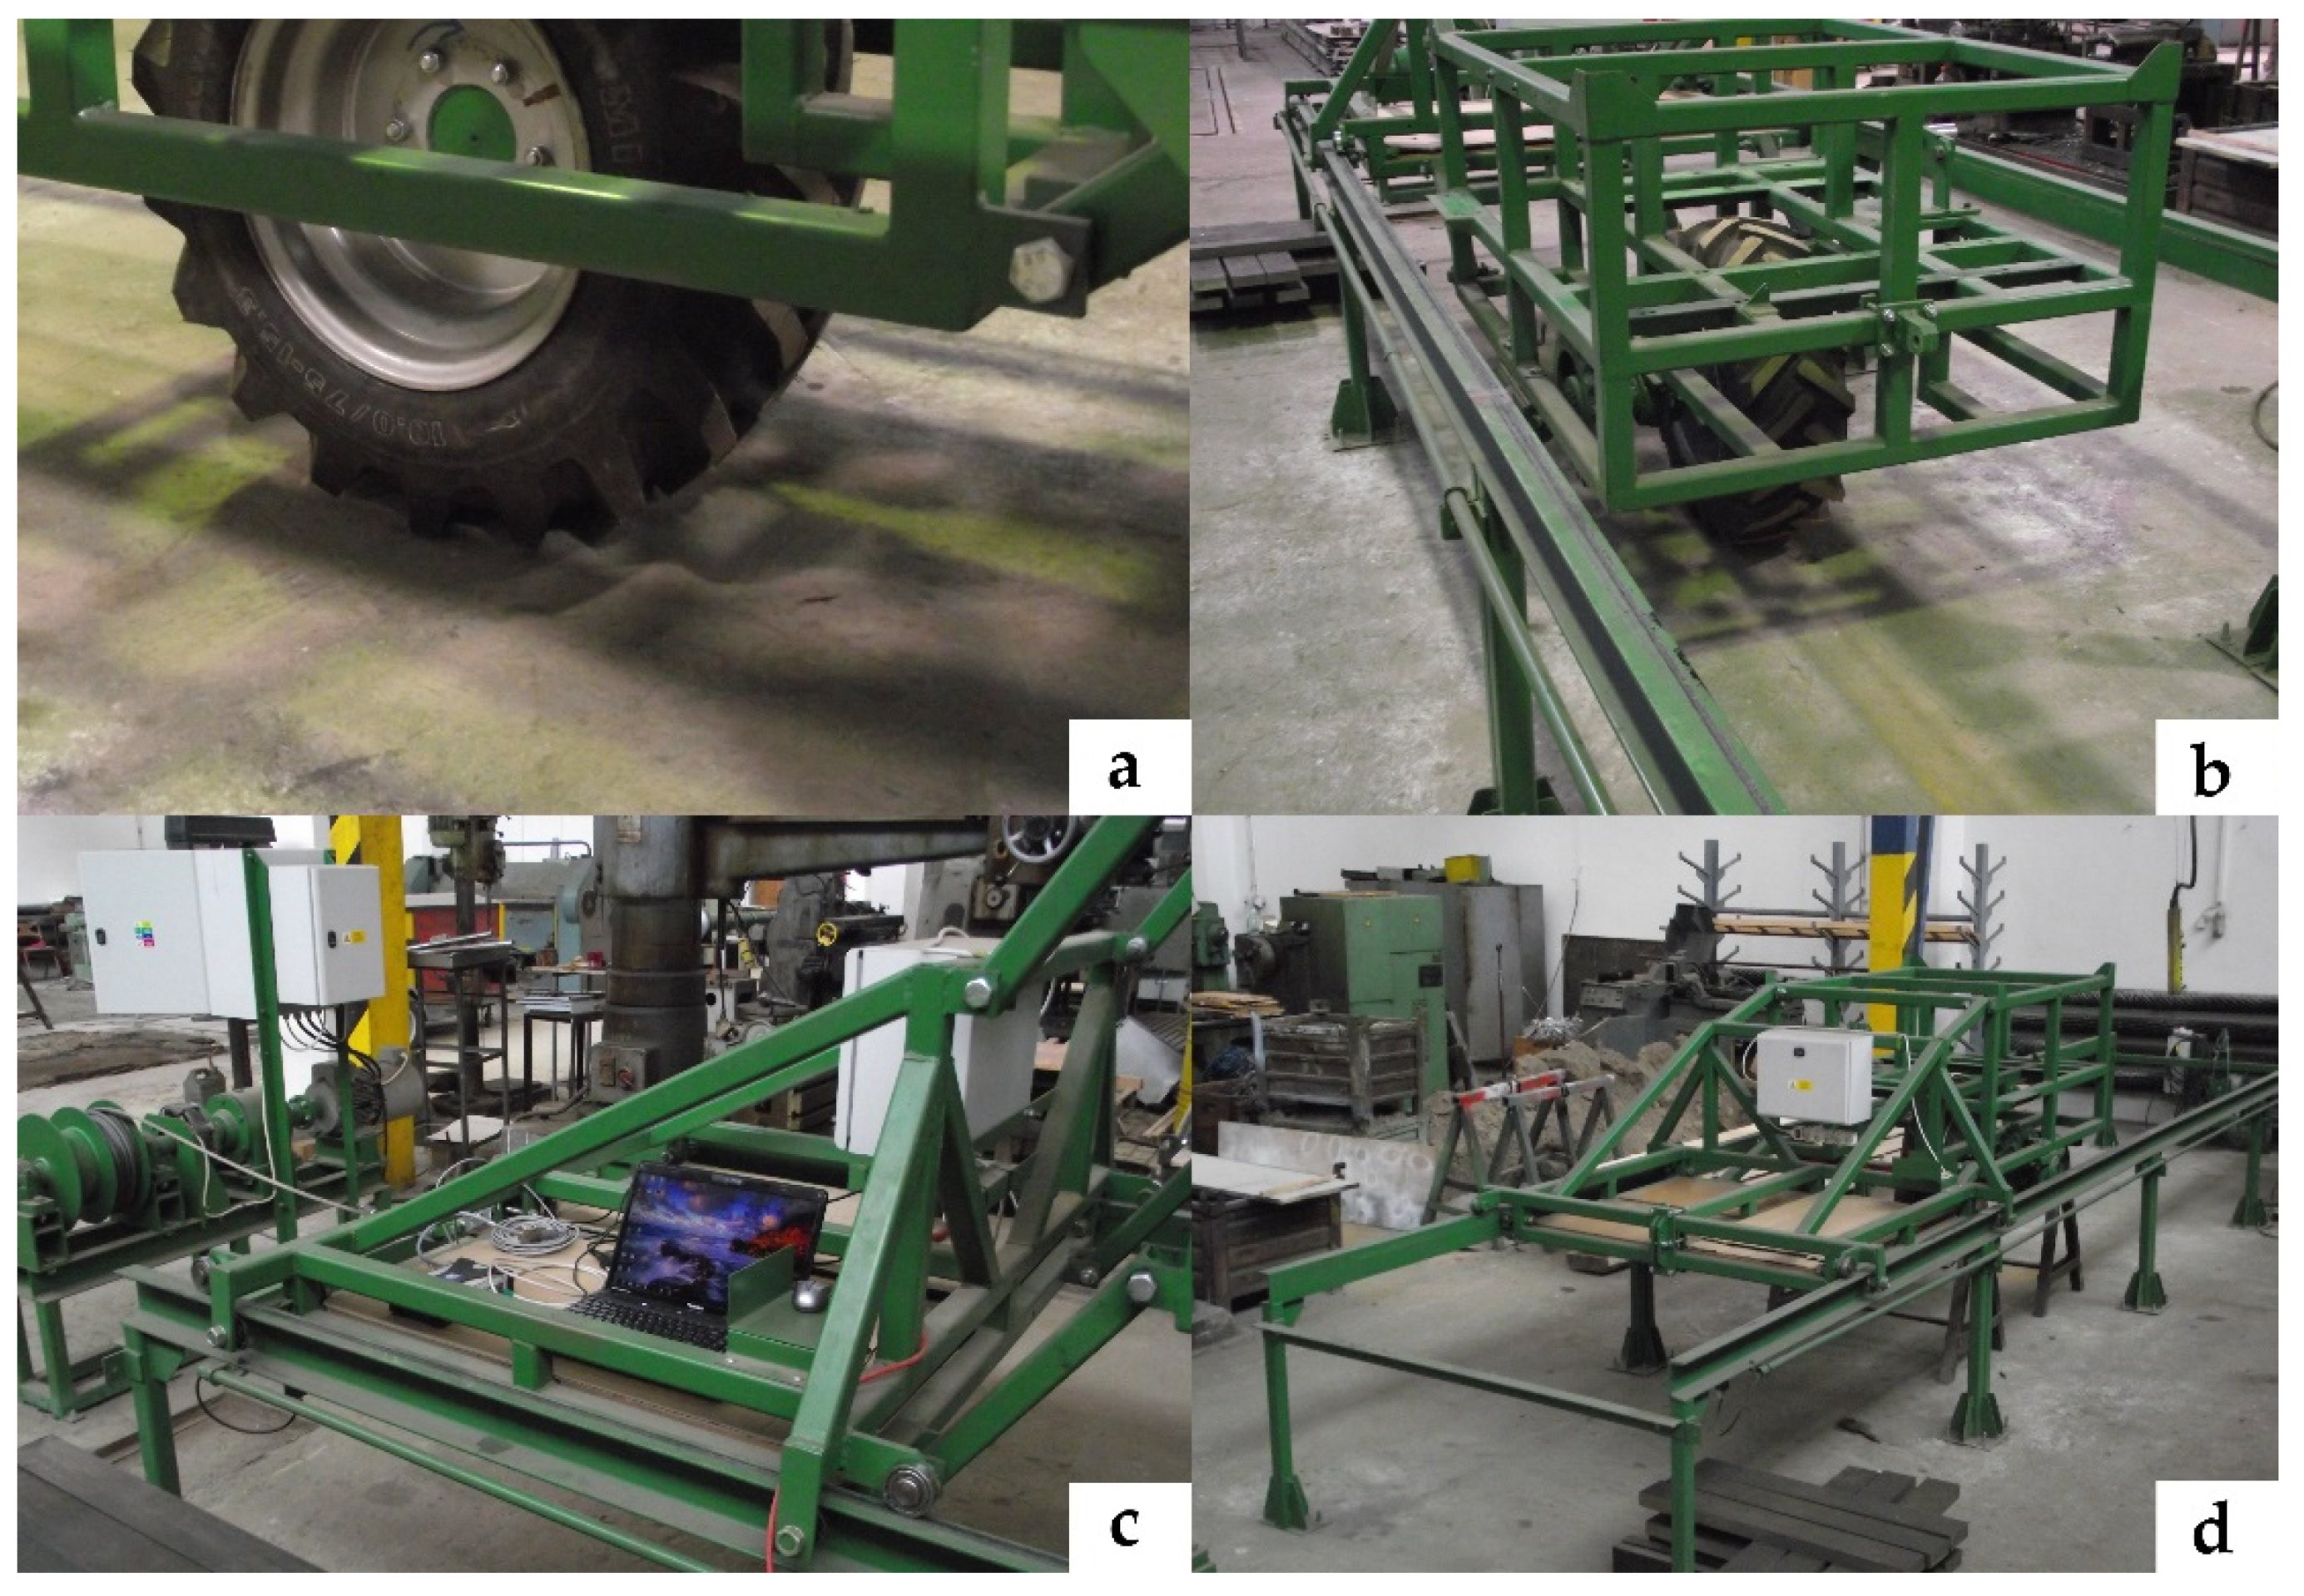
The measuring process of the rolling resistance of selected tires on a concrete surface is documented in
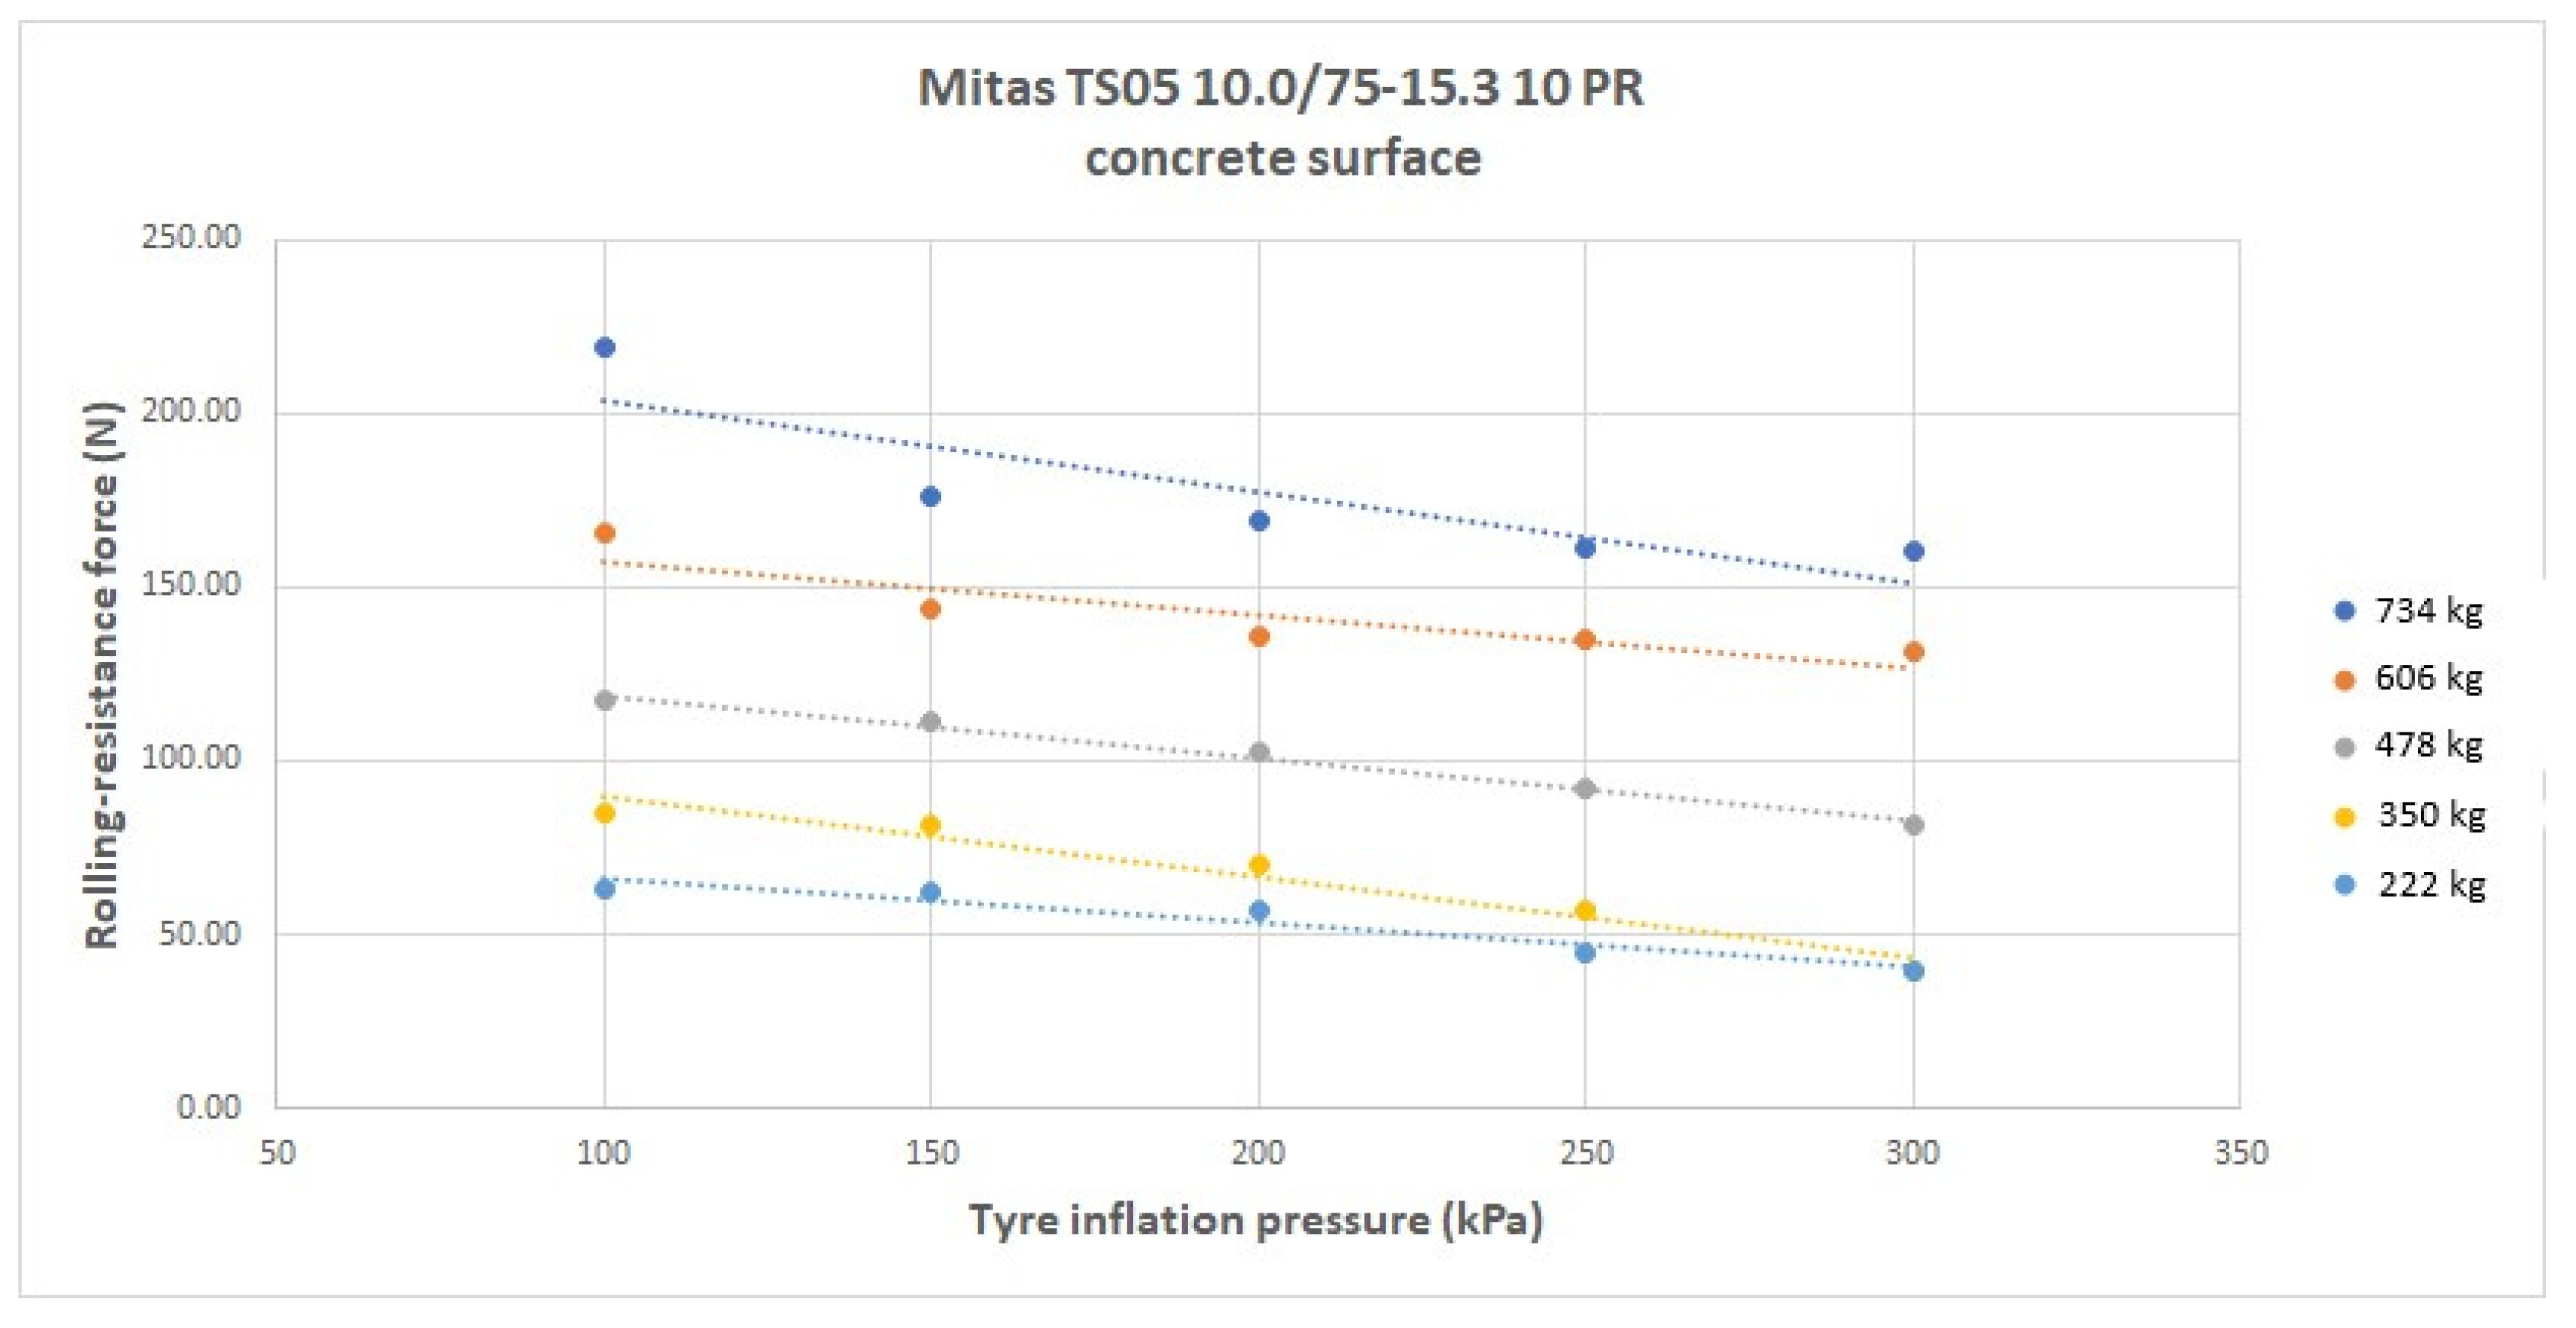
Figure 6. From the obtained results of measuring the rolling resistance of monitored tires, the dependence of rolling resistance of Mitas TS05 10.0/75-15.3 10PR on inflation pressure for a concrete surface was shown (
Figure 7).
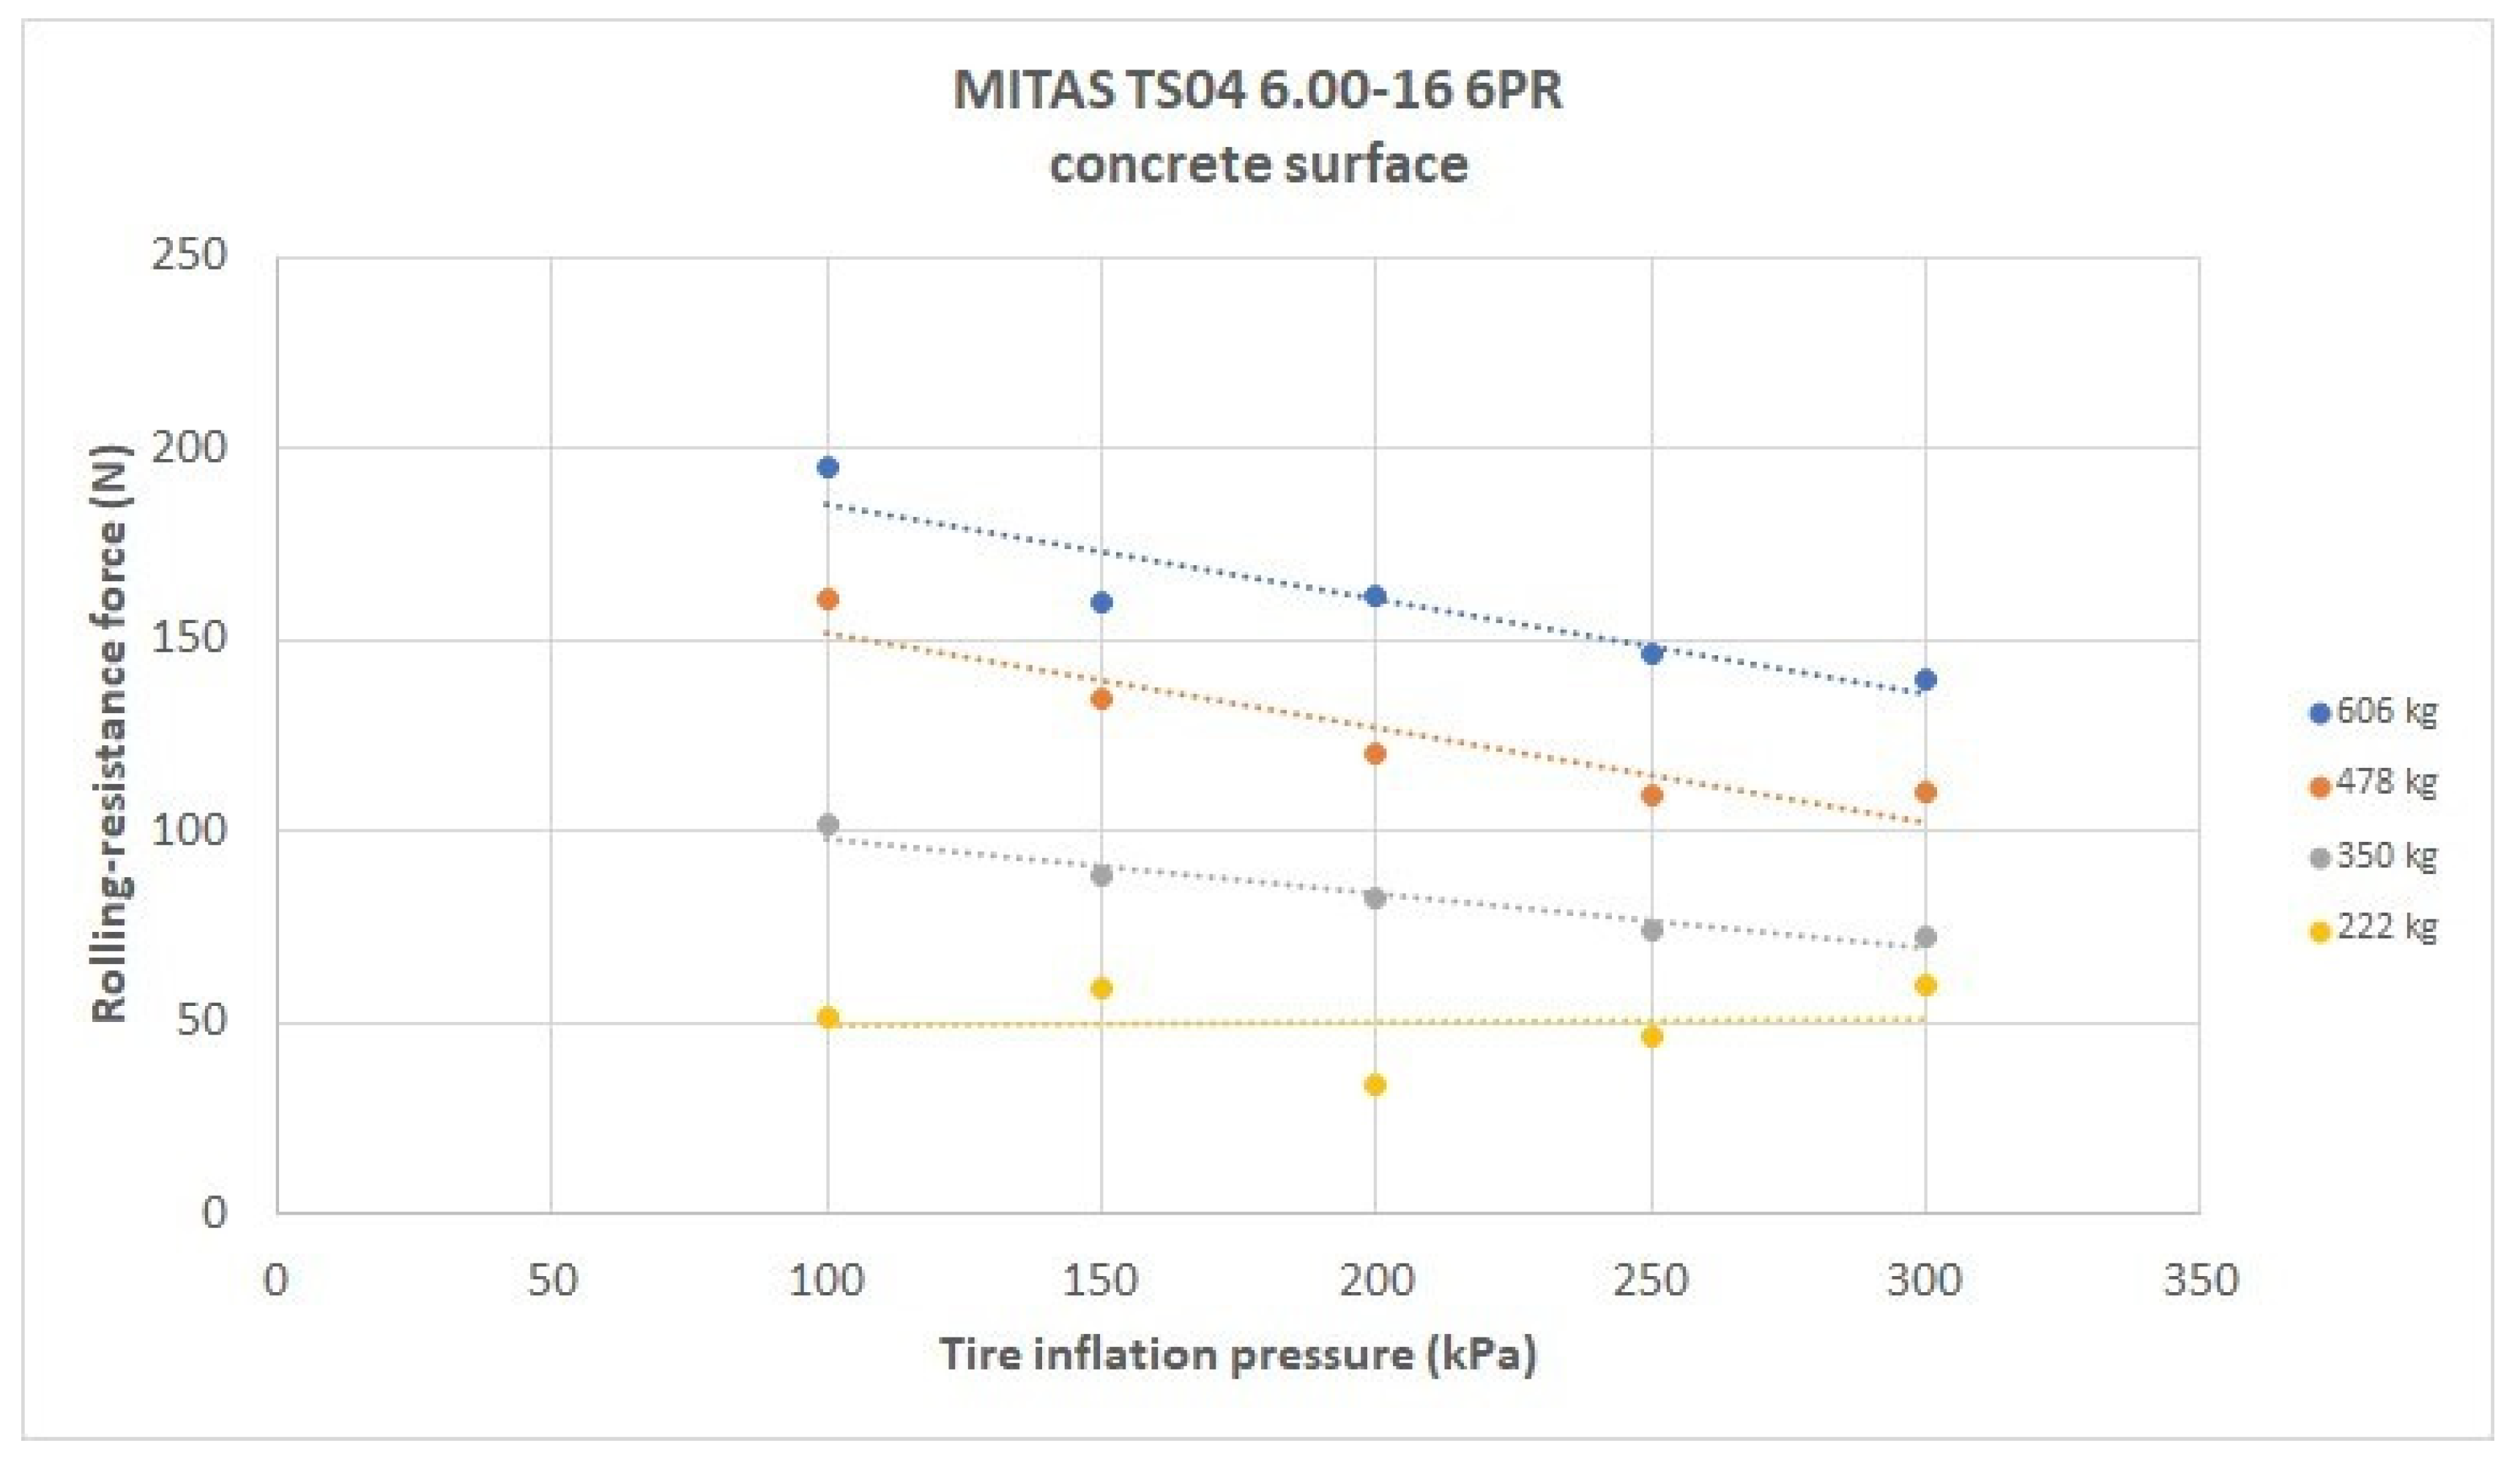
Figure 8 shows the same dependence for the Mitas TS04 6.00-16 6PR tire and the concrete pad.
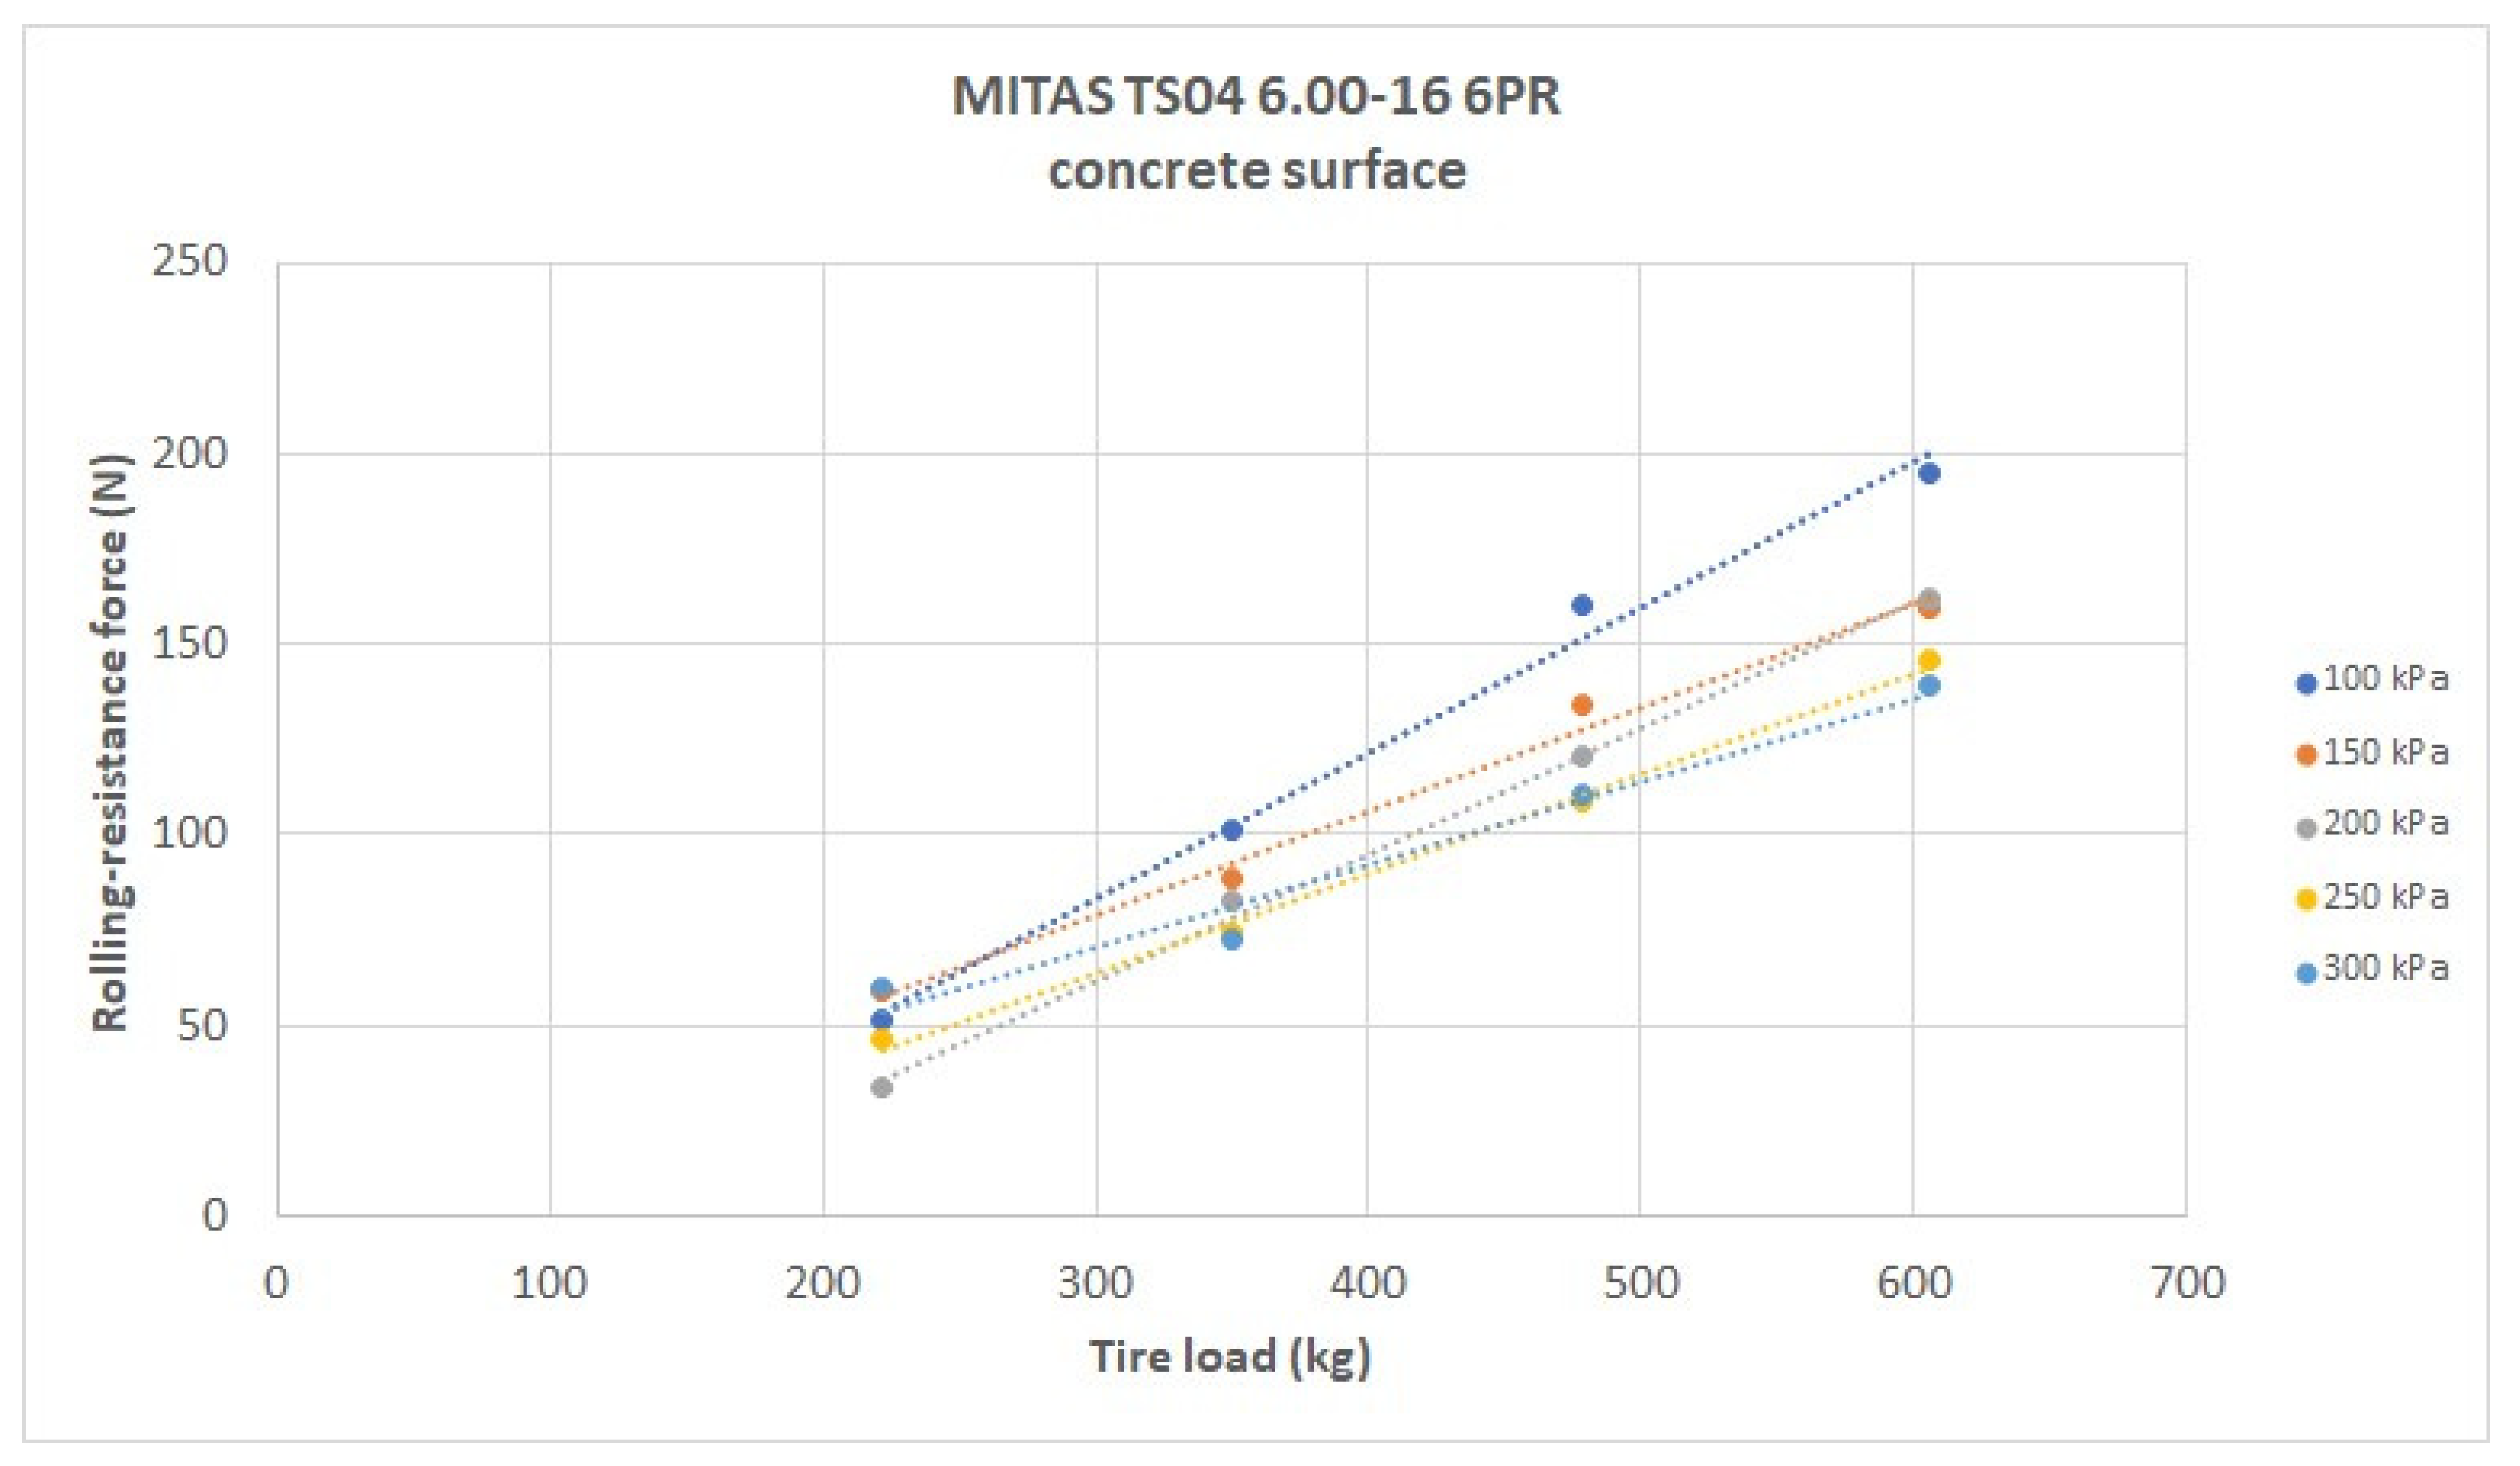
Figure 9 shows the dependence of the rolling resistance on the tire load at individual inflation pressure levels for the Mitas TS04 6.00-16 6PR tire and the concrete pad.
4. Discussion
Figure 7 and
Figure 8 show the relationship between the tire inflation pressure and the rolling resistance achieved on a concrete surface. It can be seen from the dependence that with increasing inflation pressure, the value of rolling resistance gradually decreases at all load levels. The reason for this condition is the fact that, with increasing internal pressure in the tire, there is less deformation of the tire casing and thus a reduction in internal-friction losses [
16]. The higher level of vertical load of the monitored tires causes a slight increase in rolling resistance due to greater deformations of the tire, but it can be said that increasing tire pressure on a solid concrete surface leads to a decrease in rolling resistance of monitored tires. A more significant decrease is observed at higher load levels: with the Mitas TS04 6.00-16 6PR tire and a load level of 222 kg, the rolling resistance fluctuates around 50 N across the range of tire inflation levels used.
Similar conclusions are reached in
Figure 9. This represents the dependence of the rolling resistance of the Mitas TS04 6.00-16 6PR tire on the vertical load. It is also observed that increasing wheel load clearly increases the value of rolling resistance [
17]. On the other hand, depending on it, a gradual decrease is observed with increasing tire inflation pressure [
18]. The largest differences in the values of the achieved rolling resistances can be noticed at a load of 606 kg and the individual inflation pressure levels used.
There is an almost linear relationship between the rolling resistance of tires and their load [
19]. The linear course of the equilibrium rolling resistance as a function of the tire load is probably random. However, it is very well-known and has led to the introduction of the concept of the rolling resistance coefficient. The rolling resistance coefficient is a useful parameter because it allows different tires to be compared with each other. Based on the calculations of the rolling resistance coefficients, the monitored tires were also compared.
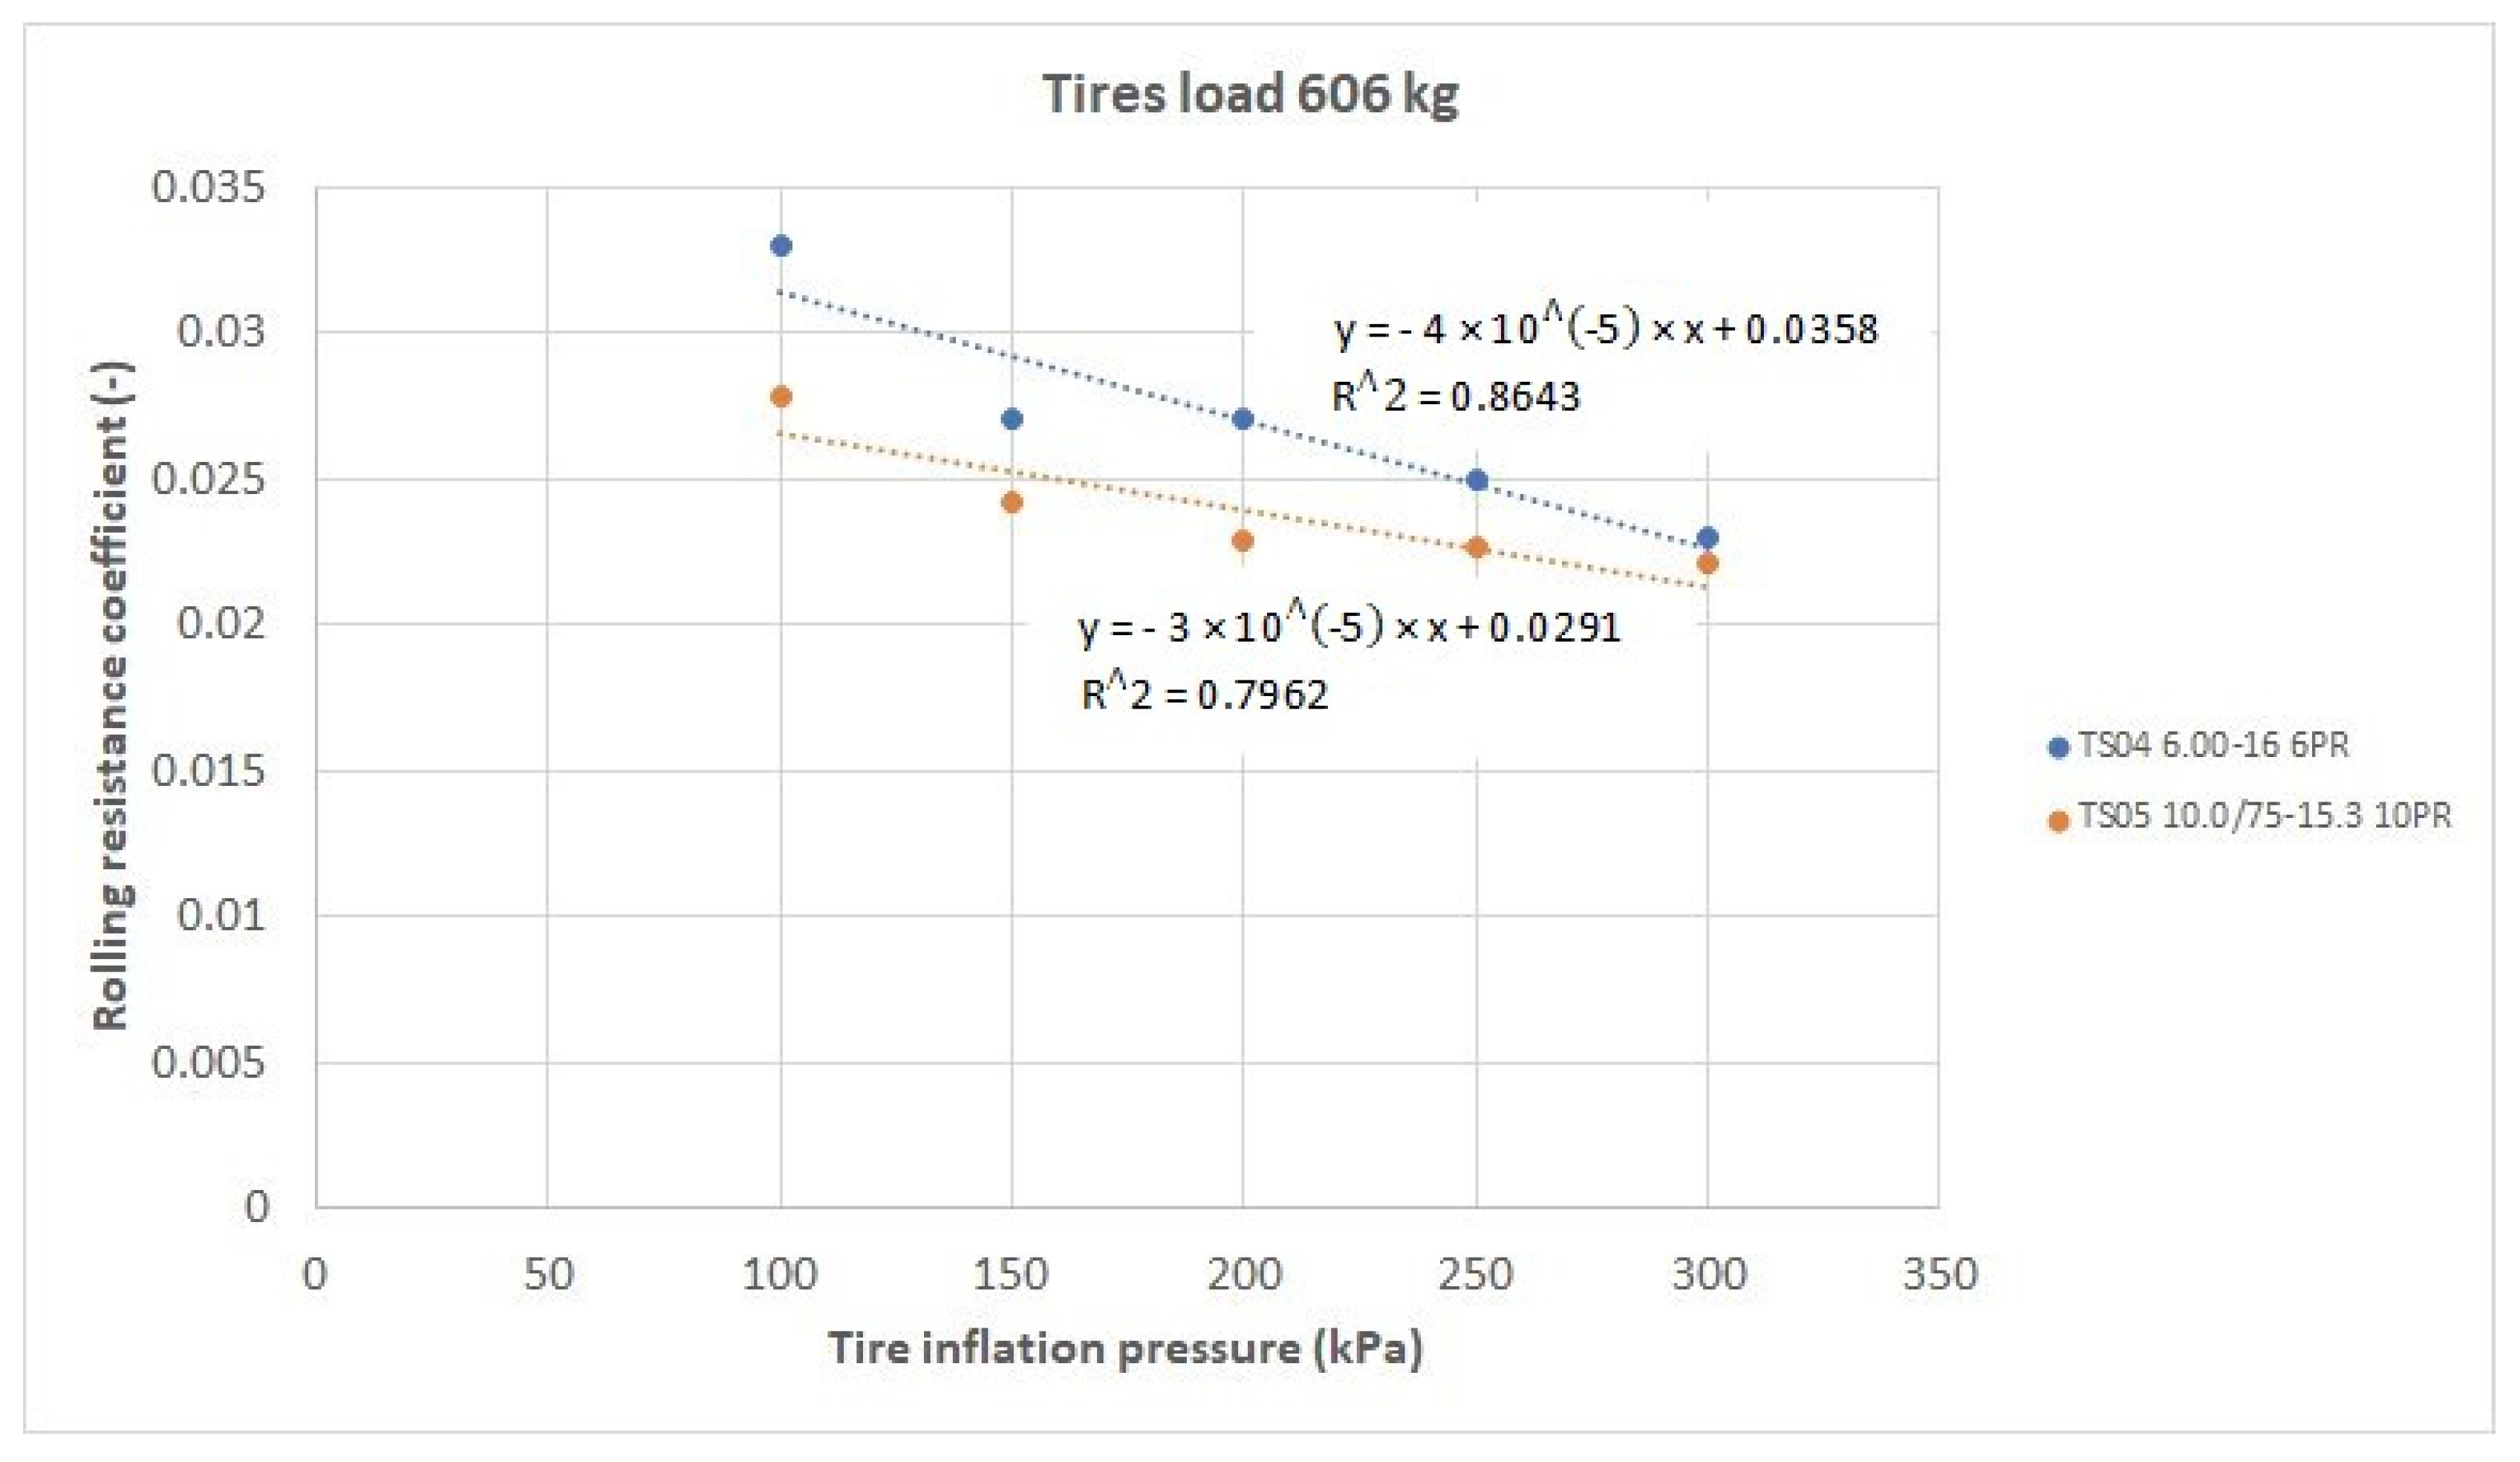
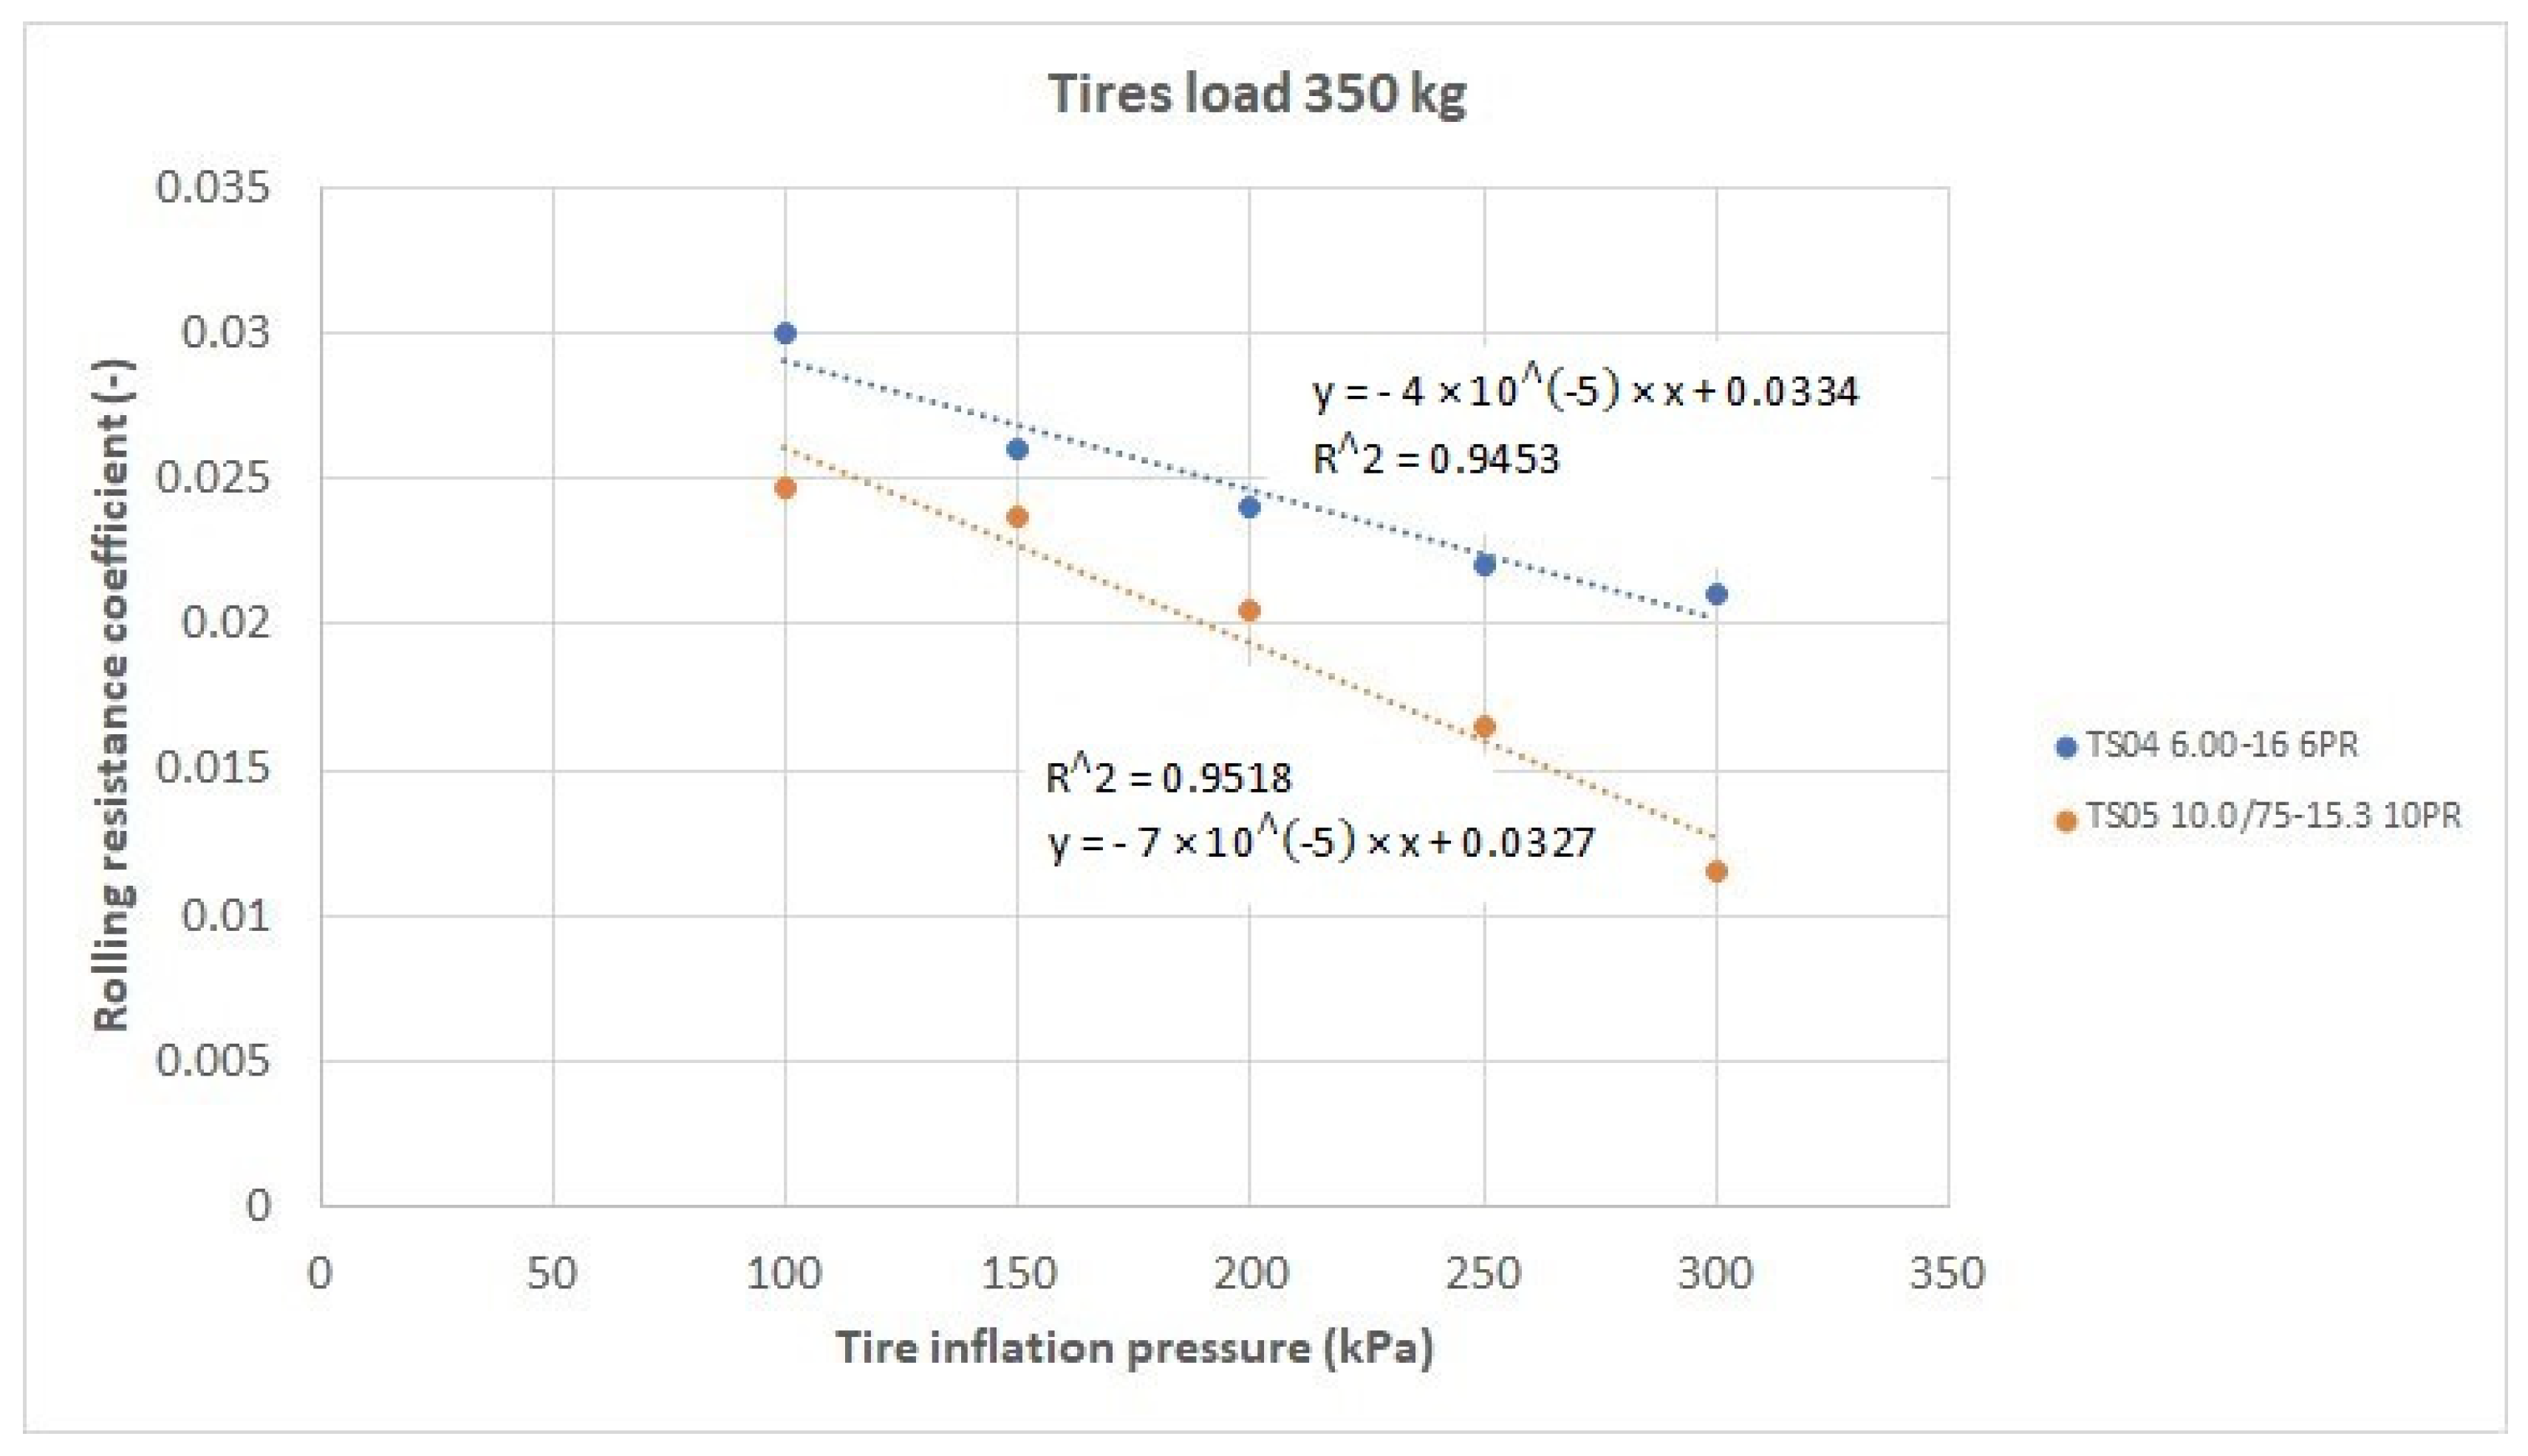
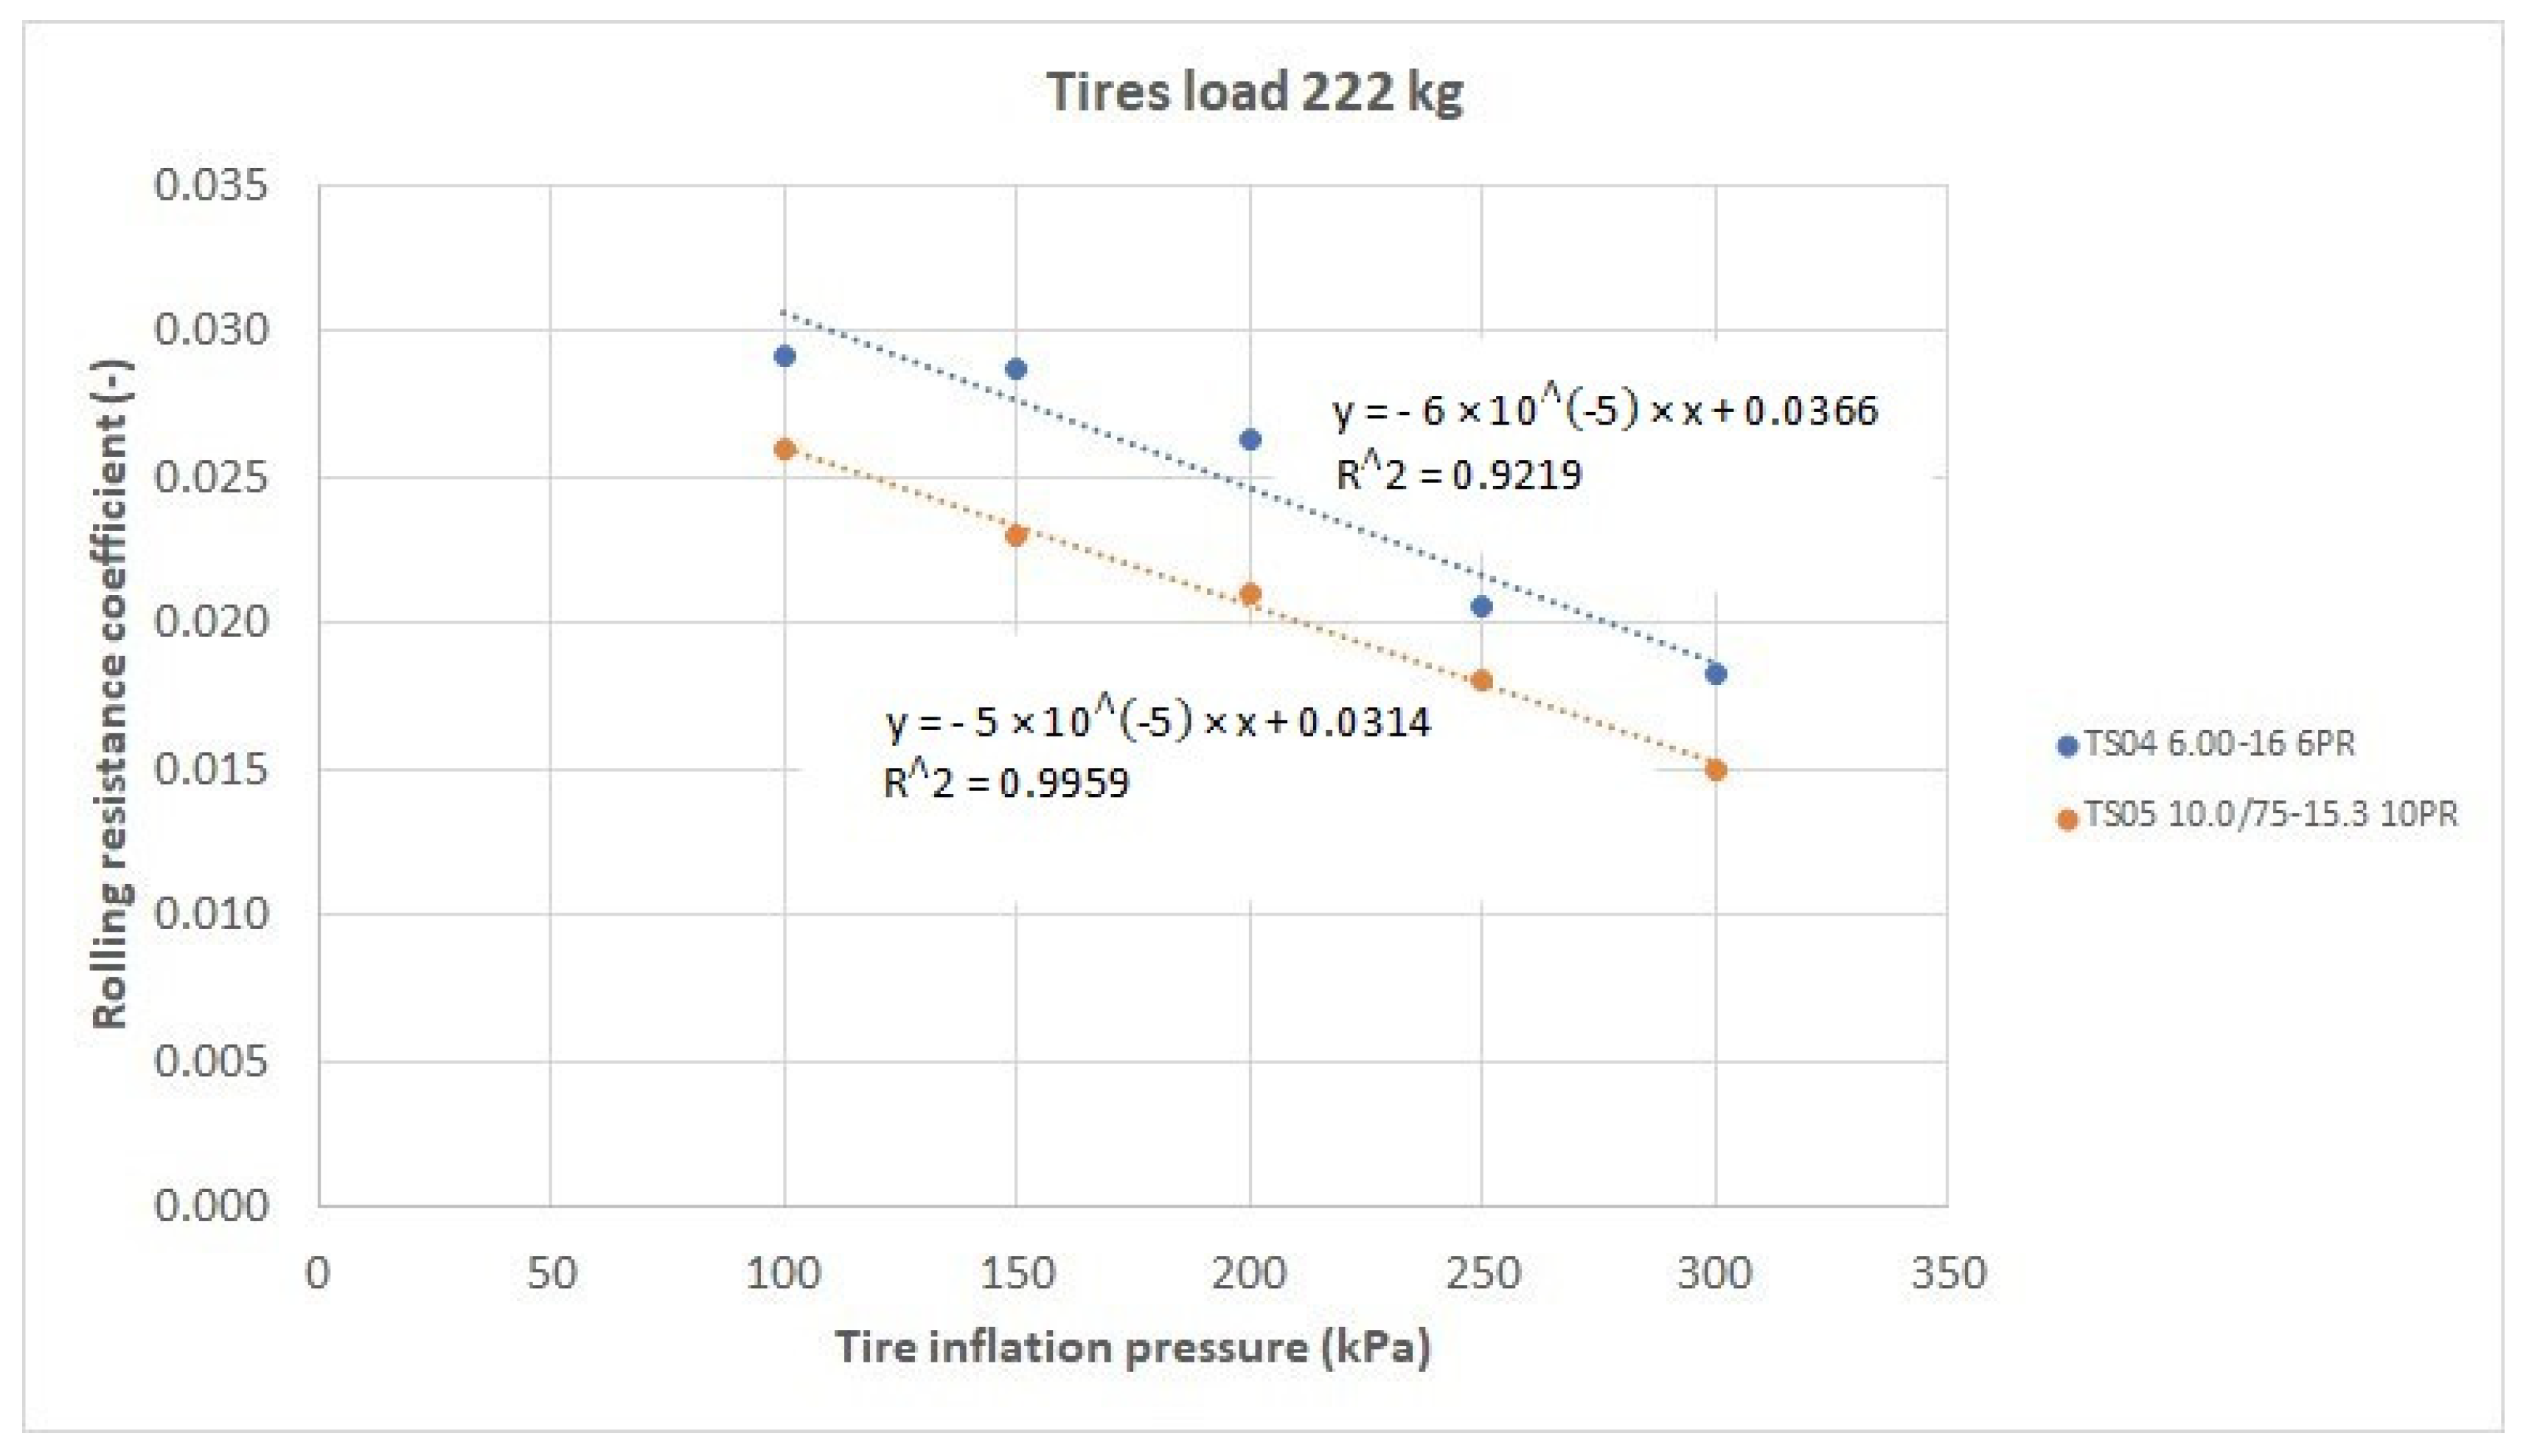
Figure 10,
Figure 11,
Figure 12 and
Figure 13 show the dependences of the rolling resistance coefficients on the tire inflation pressure for the individual load levels of 606 kg, 478 kg, 350 kg, and 222 kg.
In the given graphical dependences, a decrease of the values of the rolling resistance coefficients of the monitored tires with an increasing inflation pressure can be observed at all monitored load levels. It might seem that the Mitas TS05 10.0/75-15.3 10PR tire is slightly better than the Mitas TS04 6.00-16 6PR tire in terms of the values of the rolling resistance coefficients achieved. To confirm or to refute this hypothesis, the test of agreement of regression coefficients of linear functions was used, by which the measured points for individual tires were translated in the above-mentioned graphical dependences of the rolling resistance coefficients on their inflation pressure. The results of used test methods are given in
Table 2.
The given graphical dependences were translated with linear functions, expressing the degree of tightness in the form of the coefficient of determination R2 and the value of the correlation coefficient R. Based on the results of correlation coefficients, it can be said that individual measured (calculated) points are distributed. Given the validity of the null hypothesis, the given test characteristic has a Student’s probability distribution with six degrees of freedom. If the test characteristic is from the critical area |t| > t0.95, the null hypothesis about the agreement of regression coefficients can be rejected. In this case, the directives of the regression lines must be considered as different, and cannot be assumed that a unit change in the explanatory variable will cause the same change in the explanatory variable in the first and second base sets.
When we look at the results of the statistical analysis (
Table 2), we see that the values of the test characteristic
|t| are smaller than the values of the quantiles of the Student’s distribution
t0.95 up to the value of the load of the tested tires 350 kg, where the test characteristic exceeded the critical value of the test criterion
t0.95. Exceeding this value is due to a significant decrease in the rolling resistance coefficient at inflation pressures of 250 kPa and 300 kPa for the Mitas TS05 10.0/75-5.3 10PR tire, and a more significant decrease in the translated function by plotted points compared to the data plotted for Mitas TS04 6.00-16 6PR. Based on the above, we can conclude that there is no statistically significant difference in the achieved values of the rolling resistance coefficients at individual inflation pressures of the tested tires at individual levels of vertical load up to a load value of 350 kg. We can say that the given tested tires are essentially equivalent in terms of the achieved values of rolling resistance and there is no statistically significant difference between them. Nevertheless, in individual courses, it was observed that the course of the rolling resistance coefficients of the Mitas TS04 6.00-16 6PR tire at individual inflation pressures and at individual applied load values is slightly higher than with the Mitas TS05 10.0/75-15.3 10PR tire. However, based on the results of the statistical analysis, we can say that this difference is not statistically significant.
Based on research conducted by Clark [
20], we can conclude that at a given load, rolling resistance decreases with increasing tire diameter and decreasing profile number (ratio of profile height to tire profile width). The author found that significant energy savings (fuels) on solid surfaces can be achieved, e.g., by replacing the double mounting of tires with one wide-profile tire. In our case, the Mitas TS05 10.0/75-15.3 10PR tire is only 100 mm wider and only has a 50 mm larger diameter than the Mitas TS04 6.00-16 6PR tire. The achieved values and courses of rolling resistance coefficients of individual tires could support the given statement, but given results of statistical analysis, we can consider them as equivalent and neglect the differences between them.
As it can be seen from the results obtained during rolling, increasing the inflation pressure at a given load over a rigid surface has a favorable effect on reducing the values of the rolling resistances achieved. When we look at the results of the achieved values of the rolling resistance coefficients at individual load levels, we can see that by the right choice of the tire inflation pressure, we can reduce these values by almost half.
The rolling resistance of tires is also affected by the properties of the cord material, both by losses inside the cord due to hysteresis and by the modulus of elasticity on the deformation of the rubber. The rolling resistance of tires is also related to the viscoelastic properties of its rubber components. The tread of tires is mostly influenced by the tread [
21]. Its duty cycle appears to be a combination of radial compression, bending and friction. There appears to be a strong interaction between these components, which can cause actual energy losses to be greater than expected if different polymers are used in different parts of the tire.
The rolling resistance of a tire is also influenced by the operating time (driving) of the vehicle on which it is operated [
22]. As the operating time increases, the tire gradually heats up and the rolling resistance decreases slightly.


