Article

Classification of Potato Varieties Drought Stress Tolerance Using Supervised Learning

by
Dominika Boguszewska-Mańkowska
1,
Bogdan Ruszczak
2,3,* and
Krystyna Zarzyńska
1
1
Plant Breeding and Acclimatization Institute-National Research Institute, 05-140 Serock, Poland
2
Department of Computer Science, Opole University of Technology, 45-310 Opole, Poland
3
QZ Solutions Sp. z o.o., Ozimska 72A Street, 45-310 Opole, Poland
*
Author to whom correspondence should be addressed.
Appl. Sci. 2022, 12(4), 1939; https://doi.org/10.3390/app12041939
Submission received: 31 December 2021 / Revised: 31 January 2022 / Accepted: 8 February 2022 / Published: 12 February 2022
(This article belongs to the Special Issue Machine Learning in Agricultural Informatization)

Abstract

:

Featured Application

For breeders of new potato cultivars to assess their drought stress tolerance.

Abstract

The presented study was aimed at investigating the variability for drought tolerance among potato cultivars. To achieve this, the stability of drought tolerance of potato cultivars under different water regime conditions was inspected during 11 years of consecutive experiments. The data on 50 potato cultivars’ responses to drought stress, based on the morphological features of plants, i.e., leaf and stem mass and size of the assimilation area, have been collected. The tuber yield, as well as calculated plant tolerance indexes and Climatic Water Balance for each growing season, were analyzed. The studied cultivars were later assigned into one of three tolerance groups for soil drought. The highest linear relationship was found between the mass of leaves and stems and the tuber yield but was found too weak to raise any conclusions. Thus, the ensemble learning models have been evaluated and returned better performance results, and the final classifier is the implementation of extreme gradient boosting. The final classifier of the 96.7% accuracy, which used several measured potato parameters (Relative yield decrease, Stem mass, Maturity, Assimilation area, Leaves mass, Yield per plant, calculated Climatic water balance, and indices: MSTI and DSI) that could distinguish the different tolerance groups were evaluated in the study.

1. Introduction

Global climate change in the form of extreme heat and drought poses a major challenge to sustainable crop production by negatively affecting plant performance and crop yield [1,2].
Potatoes are cultivated in over 100 countries feeding over a billion people worldwide. They are a rich source of carbohydrates and provide other essential nutrients, such as dietary fiber, vitamins, minerals, protein, and antioxidants [3].
Early stress is most detrimental to tuberization, bulking, and tuber yield as a result of reduced rates of carbon assimilation and decreased partitioning of assimilates to tubers [4]. It has been predicted that the potato yield will decline substantially by 2055 due to global warming and drought [5].
In another study, Hijmans [6] anticipates that the world potato production will decline by 18–32% in the projected period of 2040–2069 as a consequence of biotic and abiotic stresses associated with climate change. Thus, to improve the potato yield, we need to identify the best production practices and develop new potato cultivars that best fit the predicted climate change.
Potatoes require a cool growing season with an average daily temperature of 15–18 °C (288.15–291.15 °K); temperatures above 21 °C (294.15 °K) have adverse effects on growth [7]. The optimal tuber yield for most commercial potato varieties is produced when potato plants are grown at average day temperatures between 14 and 22 °C (287.15 and 295.15 °K) [8]. The susceptibility of potato crops to high temperatures largely depends on the genotype [9], development stage, and stress duration [10]; tuber initiation and bulking are the most critical stages [11,12]. In potato plants, the minimum night temperature plays a crucial role during tuberization, which is reduced at the night temperatures above 20 °C (293.15 °K) with complete inhibition above 25 °C (298.15 °K).
Potatoes are also sensitive to drought, mainly due to the crop’s shallow root system and the low capacity of recuperation after a period of water stress [13]. Potatoes have a sparse and shallow root system [14] with a depth ranging from 0.5 to 1.0 m [15]. About 85% of the total root length is concentrated in the upper 0.3 m of soil [16]. Due to this, potatoes extract less of the available water from the soil compared to other crops [17].
Information about phenotyping under replete conditions can provide data that can be used to identify characteristics associated with improved performance under specific stress. The most frequently used morphological and physiological indicators of plants in response to drought stress are leaves mass, leaves assimilation area, the relative water content in leaves, and the SPAD index. Concerning yield, these are the yield mass in stress conditions; yield mass in control conditions; yield decrease; and drought indexes like the Drought Susceptible Index (DSI), Drought Tolerance Index (DTI), and MSTI Moderate Drought Tolerance Index (MSTI) [18].
The observation of different plants parameters measured and denoted in different ways (as continuous or categorical variables) and the attempt to merge this information requires the application of the methodology that allows one to model and evaluate the studied phenomena. Nowadays, the widespread use of the machine learning algorithms could be remarked on also in the field of agronomy [19]. The ensemble learning methods are worth notice especially, which allow one to get satisfying results even for sometimes noisy agronomic measurements, as they bring a way of combining weak classifiers into groups of better performances [20], even for datasets of limited sizes [21].
The detailed objectives of this study are to understand (1) the variability for drought tolerance among potato cultivars, (2) the stability of drought tolerance of potato cultivars under different water regime conditions, and (3) the relation between physiological traits and tuber production under drought stress and the machine learning approach to both prepare and evaluate the model able to describe the tolerance of potato cultivars to drought stress using several agronomic and morphological features of plants.

2. Materials and Methods

2.1. The Pot Experiment

The pot experiment was carried out in a vegetation hall in the Plant Breeding and Acclimatization Institute, Jadwisin, Poland. Tubers of 3–4.5 (cm = m−1) in diameter were selected for planting. Two weeks before planting, high-quality seed potatoes were subjected to pre-sprouting and then plowed into pot soil at a depth of 5 to 6 (cm). Each vegetation season plant was grown in pots filled with a thin layer of gravel in the bottom and 12 L of universal vegetable soil substrate Hollas (manufactured by Agaris Poland, Pasłęk, Poland) produced from peat with the addition of chalk at a pH range of 5.5–6.5 enriched with multicomponent fertilizer with formulation NPK 14-16-18 (N = 98, p = 49, K = 105 (kg/ha)), which means N = 2.45; p = 1.22; K = 2.61 (g) per plant. For improved soil aeration, a gum pipe (irrigation pipe with a diameter of 20 (cm)) was installed in each pot. Pots were placed on outdoor mobile platforms. On a single platform (4 plants per (m2)), six pots were placed, and they were daily rearranged to avoid any border effects. Pest and disease control was carried out as in the tube experiment. Plants were watered daily using a drip irrigation system with an optimal tap water supply that was 80% of the water field capacity. The water field capacity was monitored by the soil moisture tester (5TE Sensors Decagon Devices, 2365 NE Hopkins Ct/Pullman, WA, 99163, USA). Two weeks after the initiation of the tuberization phase, half of the plants were subjected to soil drought by 14 days of cessation of watering (drought treatment). The remaining plants continued to be watered (control plants) until the end of the experiment (control treatment). After the dry period, the plants were rewatered, and the optimal water supply was maintained until the end of the experiment (the full maturity of the plants).
Air temperature, rainfall, wind speed, total radiation, air humidity, and photosynthetically active radiation during the experiment were monitored by a Campbell meteorological station (Campbell Scientific Inc., Logan, UT, USA, www.campbellsci.com/automated-weather-stations, accessed on 28 December 2021) placed 50 m from the vegetation hall. The monitored weather parameters were later used to calculate the climatic water balance. The station was located next to the observed experiment location in the Plant Breeding and Acclimatization Institute-National Research Institute (Division, Jadwisin, 05–140 Serock, Poland).
During the experiment at the end of the drought period, the aboveground parameters of the potato plants were examined: leaves assimilation area (cm2), leaves mass (g), stem mass (g), and aboveground mass (g). After the end of the growing season, the tuber yield (g) was measured from each treatment, and the drought stress indexes were calculated. Based on the relative yield decrease (%) between the control and drought treatment, a division into cultivar tolerance groups was made: Group I: resistant varieties, Group II: cultivars with a medium tolerance to soil drought, and Group III: susceptible cultivars.
The drought tolerance index was assessed as the Modified Stress Tolerance Index (MSTI) according to the formula [22]:
M S T I = K · P c · P d P c i 2 ,
and Drought Susceptibility Index (DSI) [23]:
D S I = 1 P c / P d D I ,
K = P d 2 P d i 2 ,
where P c is the yield of the cultivar in optimal conditions, P d is the yield of the cultivar under drought conditions, P c i is the average cultivar yield in optimal conditions, P d i is the average cultivar yield under drought, and
D I = 1 P d i P c i ,
For each of the studied years, the Climatic Water Balance (CWB, denoted in some publications also as P-Eo) was calculated for each observation [24]. The CWB was calculated for the 16-year study period (2005–2015) based on meteorological data on the decade sum of precipitation (P) increased by 10% [24] and the decade indicator evaporation (Eo), according to empirical Baca Equation (1) [25]:
E 0 = d · v · T ,
where Eo—decade evaporation indicator (mm), d—mean decade moisture insufficiency (hPa = 100 Pa = 100 N·m−2) calculated using Equations (2) and (3), v—mean decade wind speed (m·s−1), and T—total decade sum of radiation (kcal·cm−2 = 1000 cal·cm−2 = 1000 × 4.1868 J·cm−2 = 4 × 186.8 J·cm−2).
d = E e ,
where E—maximum water vapor pressure (hPa) and e—current water vapor pressure (hPa) calculated according to Equation (3).
e = f · E · 10 2 ,
where f—relative air humidity (%).

2.2. Plant Material

Fifty potato cultivars of all maturities (earliness) were used in experiment (most of the varieties included in the Polish variety register in the recent years): Andromeda, Aruba, Asterix, Bartek, Bogatka, Boryna, Bursztyn, Cekin, Cyprian, Danusia, Desiere, Etiuda, Finezja, Flaming, Gawin, Gustaw, Gwiazda, Ignacy, Igor, Inwestor, Irga, Jubilat, Jurek, Jutrzenka, Kaszub, Katahdine, Korona, Laskara, Legenda, Lord, Magnolia, Malaga, Mazur, Medea, Michalina, Miłek, Niagara, Oberon, Owacja, Rosalind, Satina, Saturna, Stasia, Syrena, Tajfun, Tetyda, Violet F, Wiking, Zebra, and Zeus. The selection of varieties was random. The varieties were repeated over the following years of research. Table 1 shows the names of the varieties tested in the individual years. Groups of earliness: very early (60–90 days of vegetation), early (91–110 days), medium-early (111–125 days), medium-late (126–140 days), and late (over 140 days). The division into groups is based on the length of the growing season.

2.3. Modeling Methodology

To better understand the character of the studied phenomena, several approaches to its modeling have been tested, starting from simple linear models for measured parameters and the linear correlation investigation to check if there is a straight relation between them and the groups of tolerance to soil drought. Such linear relationship modeling could, for some cases, provide sufficient estimations and lead to the final classification of the modeled agronomic groups [26]. Unfortunately, this would require significant correlations between the modeled parameters [27] among all the groups, but it is not usually possible and frequently leads to weak, linear models.
Thus, for phenomena that require several parameters modeling, that solely have weaker estimation power, the application of the machine learning approach is worth consideration. Among others, for agronomic modeling, researchers suggest implementing models like the Quadratic Discriminant Analysis and its conditional classifier, applying Bayes rules [28,29], Random Forest, Extra Trees Classifier, Ada Boost Classifier, and extreme gradient boosting [30,31].
For the analysis, we first used the exploratory data analysis and linear correlation analysis, and we visualized the main parameter distributions among all the studied groups using box plots and the scatter plots to depict the relations between the observed measurements and to show the fitted linear models.
Furthermore, to prepare the study, several Python open-source packages were used together: the general machine learning library called Scikit Learn [32] and, for most model architecture implementation, necessary training, and the results evaluation, an optimized distributed extreme gradient boosting library XGBoost [33] for the final model implementation and explanation supporting package SHAP (SHapley Additive exPlanations [34]). The adoption of machine learning models to tackle agronomic processes is growing, and among others, could be applied to the measurements and sensor data to help prepare predictions for multidimensional problems [19].

3. Results

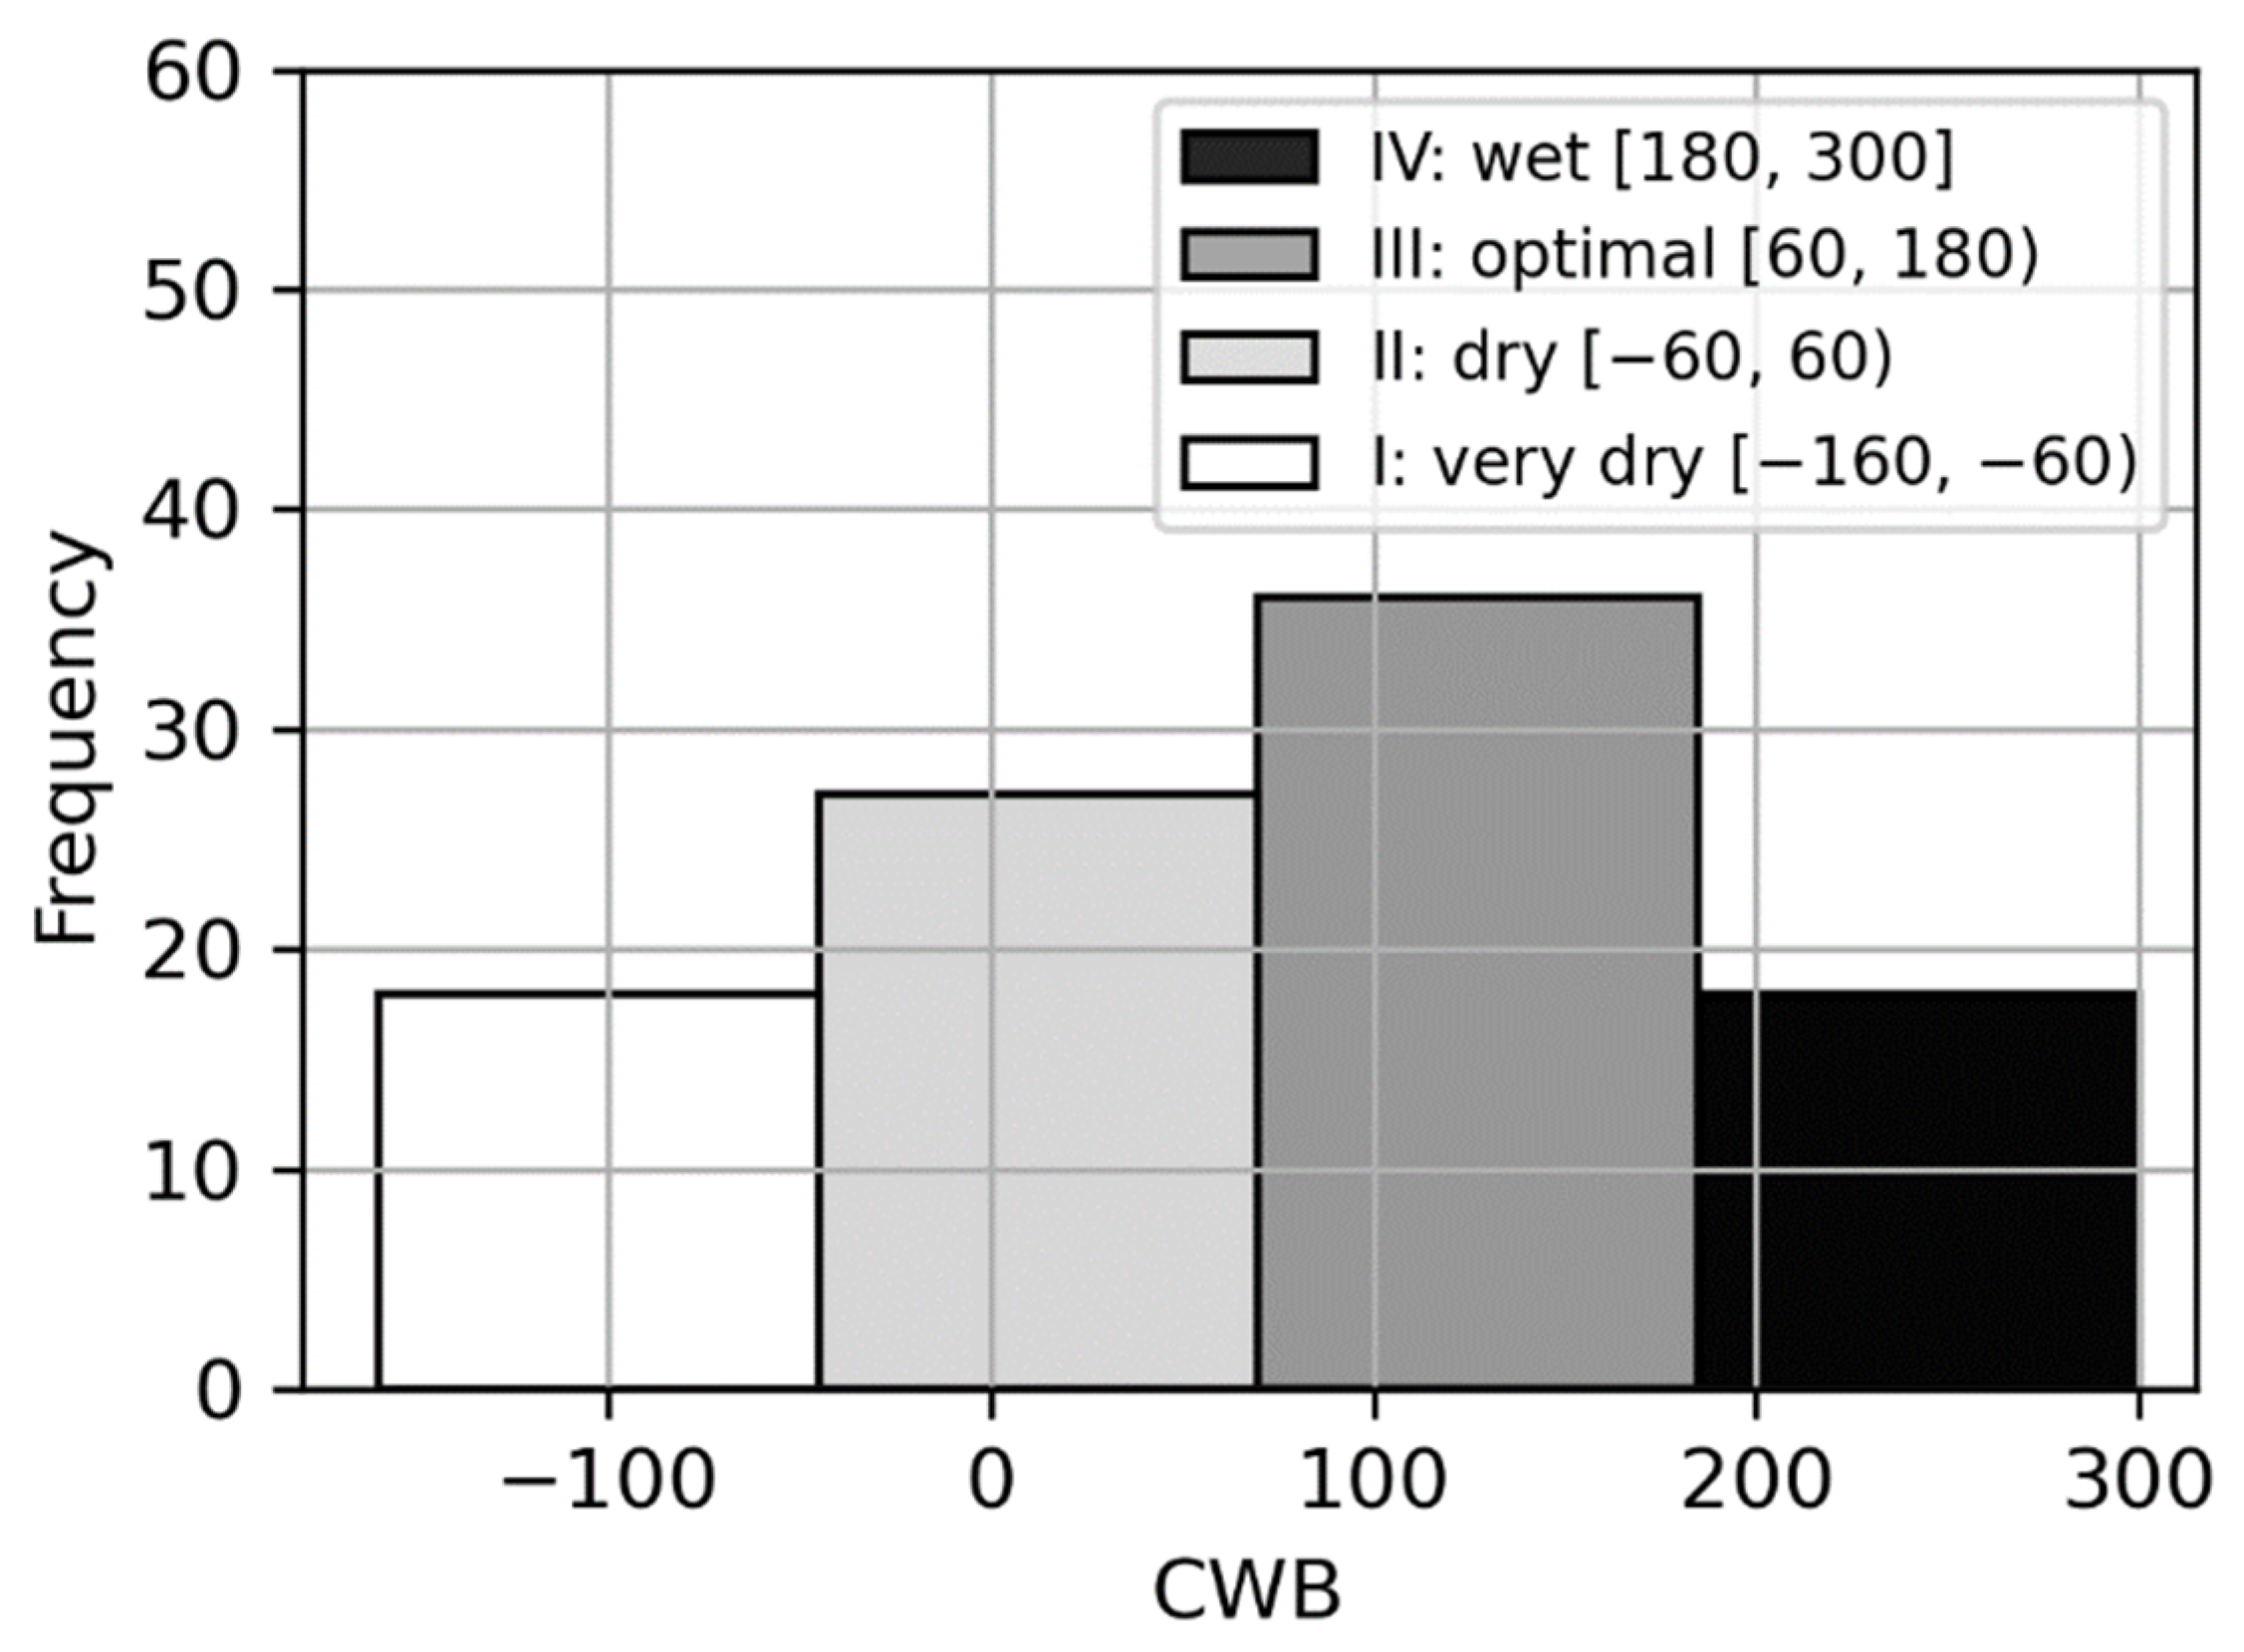
3.1. The Climatic Water Balance Determination

The results were statistically processed using the ANOVA software. The analysis of variance for the value of the CWB was carried out using Tukey’s test at the confidence level of α = 0.05 for the period 2005–2015. Over the 11 years, the analysis showed a significant influence of years and months and interactions between years and months. For the growing season May-August in the studied years, an analysis of the distribution of the CWB in the form of a histogram and distribution series was performed, and then, the water conditions in the studied periods were classified.
Based on those calculated for each year, the Climatic Water Balance (CWB) results distribution histogram was evaluated (presented in Figure 1). The histogram was split into four categories of CWB: very dry [−160 to −60), dry [−60 to 60), optimal [60–180), and wet [180–300). Each CWB range corresponds to the descriptions of the given growing season, and the resulting split is presented in Table 2.
Based on the climatic conditions during the growing season in 2005–2015, the climatic water balance for the individual years was determined. Very dry, dry, optimal, and wet years are distinguished. In the group of very dry years, there were 2 years; these are 2005 and 2015. In the group of dry years, there were 3 years; these are the years 2006, 2008, and 2014. In the group of optimal years, there are 4 years; these are the years 2007, 2009, 2012, and 2013. Two years were included in the group of wet years; these are the years 2010 and 2011.
As it could also be observed in Figure 2, the measured values of the relative yield decrease are not so easy to distinguish when one uses only climatic water balance values (b), and even data split using the resistance classes overlap to some extent (c). The bright difference between the relative yield decreasing measurements that can be spotted in Figure 2a also does not let one split that data precisely. For instance, the average relative yield decrease in the wet years was 20.78 (Table 3) and so were the 25% measurements of the very dry years and a significant part of the measurements of the other years.

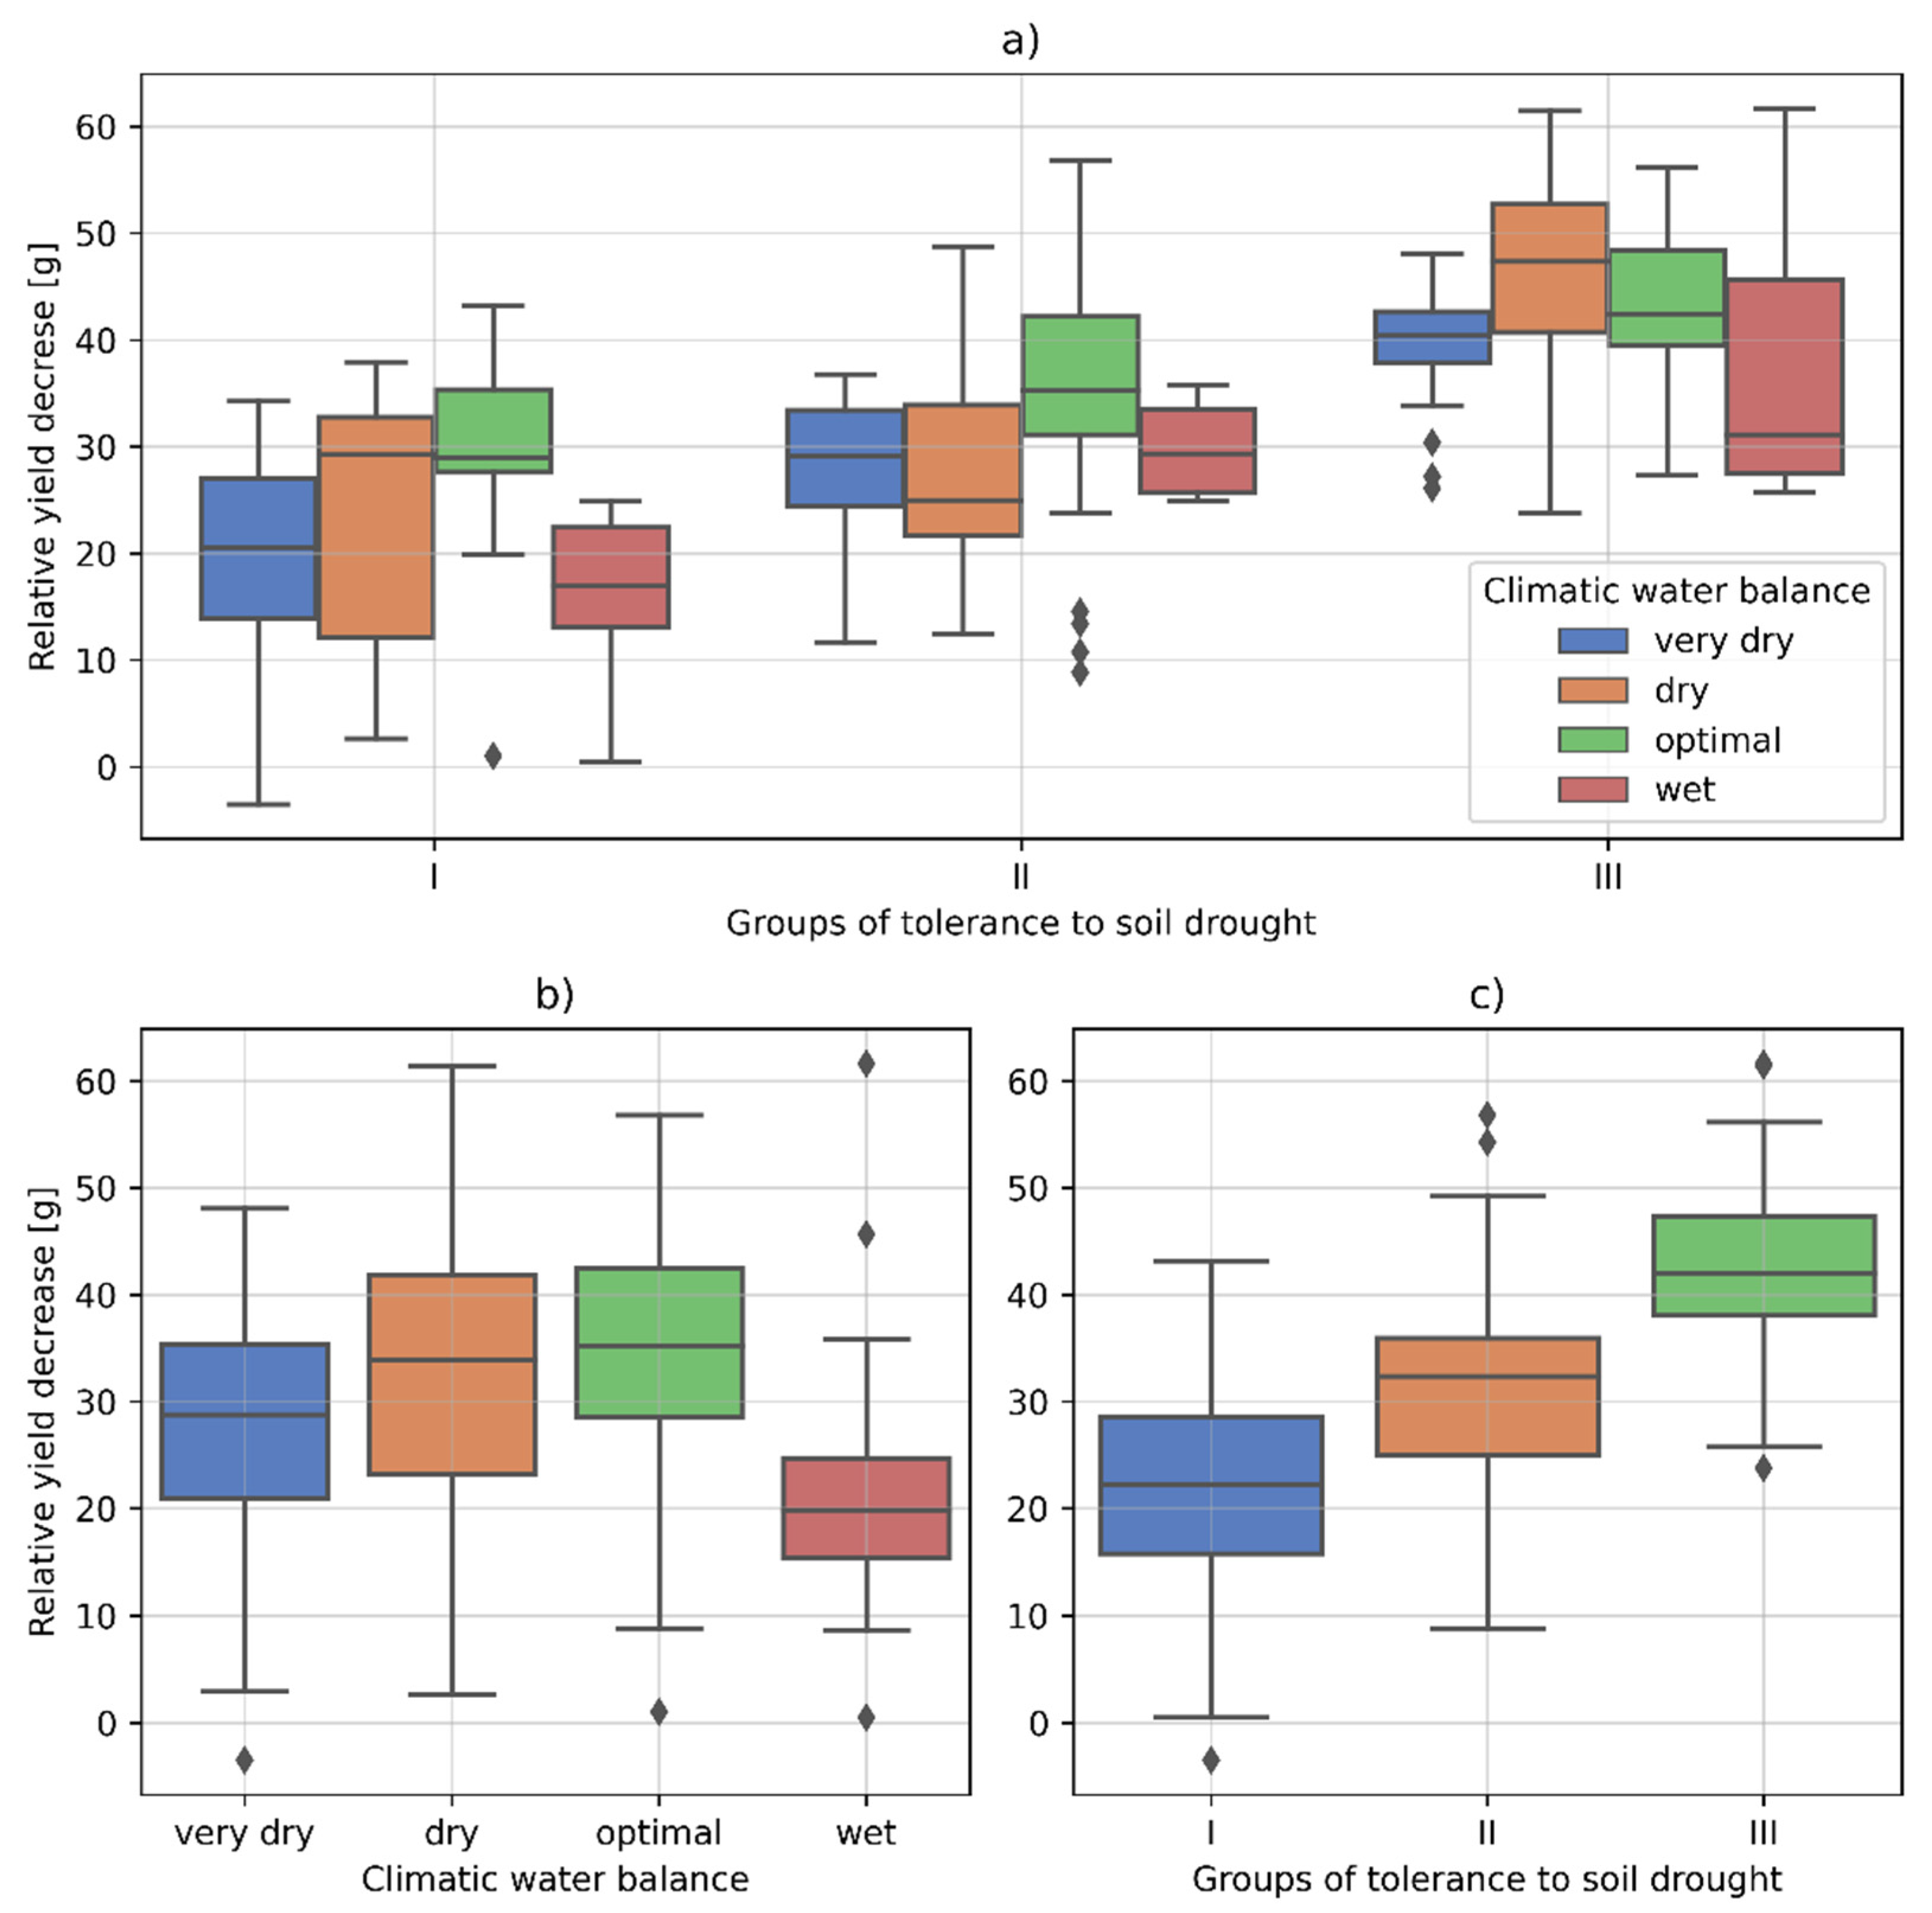
3.2. The Cultivars Differentiation into Groups with Different Tolerance to Soil Drought Based on the Yield Decrease

Based on the statistical analysis, three new groups of varieties with different tolerance to soil drought were distinguished:
  • Group I: resistant varieties with the lowest yield decrease, i.e., up to 30%;
  • Group II: cultivars with medium tolerance to soil drought, where the yield decrease was in the range of 30–40%;
  • Group III: susceptible cultivars where the yield drop exceeded 40%.
In the first group, there were 19 varieties; in the second group, there was also 19 varieties, and in the third group: 12 varieties. In all three groups, there were varieties from different groups of earliness, i.e., from very early to late.
The greatest range of variability was recorded in the group of resistant cultivars. This range was from 3% for the Laskara variety to 30% for the Tajfun variety. In the group of cultivars with medium resistance, the differentiation was much smaller. In the group of cultivars with the lowest resistance, the range of variability ranged from 43% in cv. Danusia to 55% in cv. Owacja.

3.3. Yield Decrease Prediction Using the Varieties Tolerance to Soil Drought and the CWB

Based on the differentiation of varieties into groups with different tolerances to soil drought and the CWB, it is possible to predict the level of yield decline in years with different moisture contents. The conducted research shows that the average yield decreases due to drought for the group of resistant varieties that ranges from 17 to 29% (average 21.8%), for the group of varieties with an average resistance from 25% to 37% (average 31%), and for the group of sensitive varieties from 39 to 48% (41.6% on average).
Taking into account the CWB, the average yield decrease for very dry years is from 21% to 37%, for dry years, from 24% to 41%, for normal years, from 28% to 42%, and for wet years, from 18% to 25%.
When analyzing both parameters at the same time, it can be expected that the yield of the resistant cultivars will decrease on average: in a very dry year, 19.6%, in a dry year, 22.8%, in a normal year, 30.4%, and in a wet year, 17.0%. In the case of cultivars with medium resistance, these will be the following decreases: in a very dry year, 28.3%, in a dry year, 27.9%, in a normal year, 34.7%, and in the wet year, 29.8%. In the case of low-resistance varieties, the decreases will be as follows: in b-year dry 39%, in the dry year, 45.6%, in a normal year, 42.6%, and in the wet year, 38.3%.

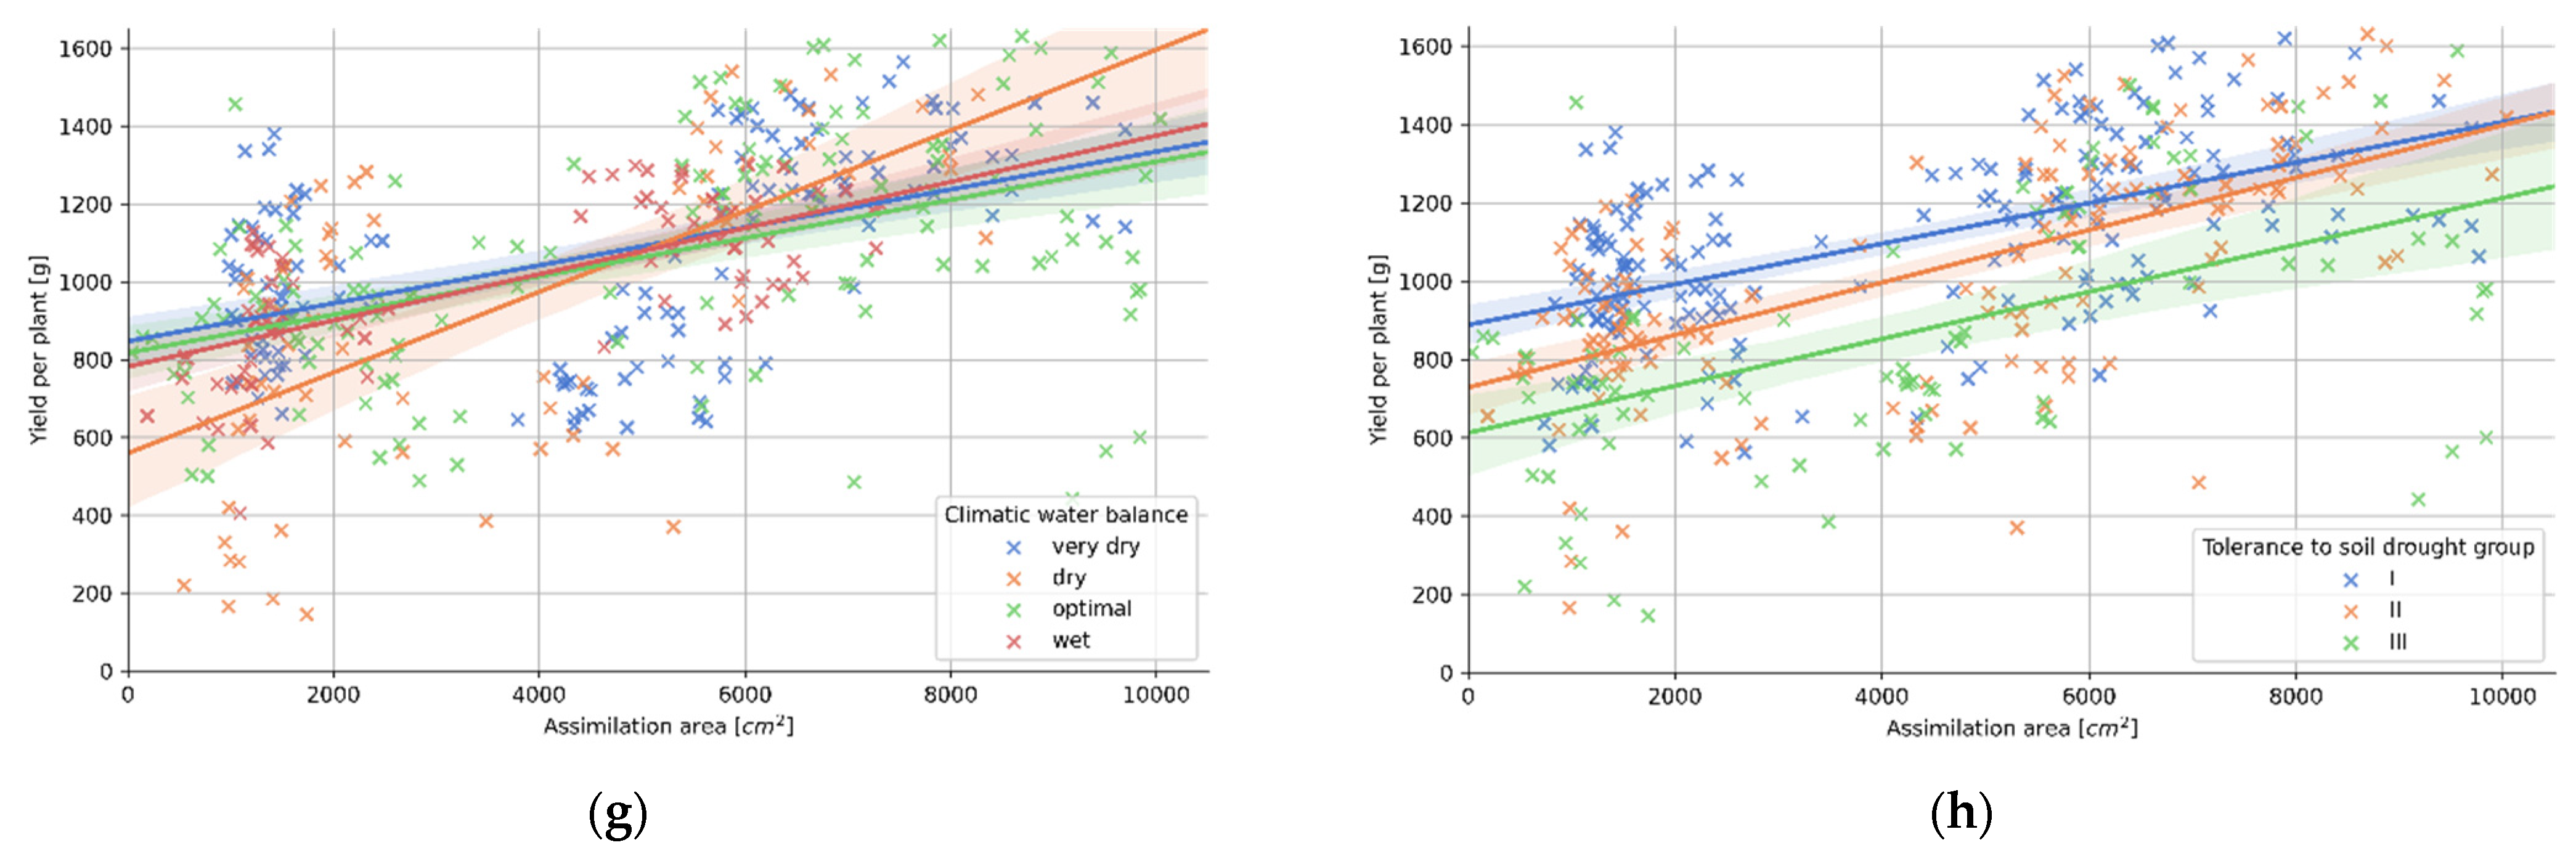
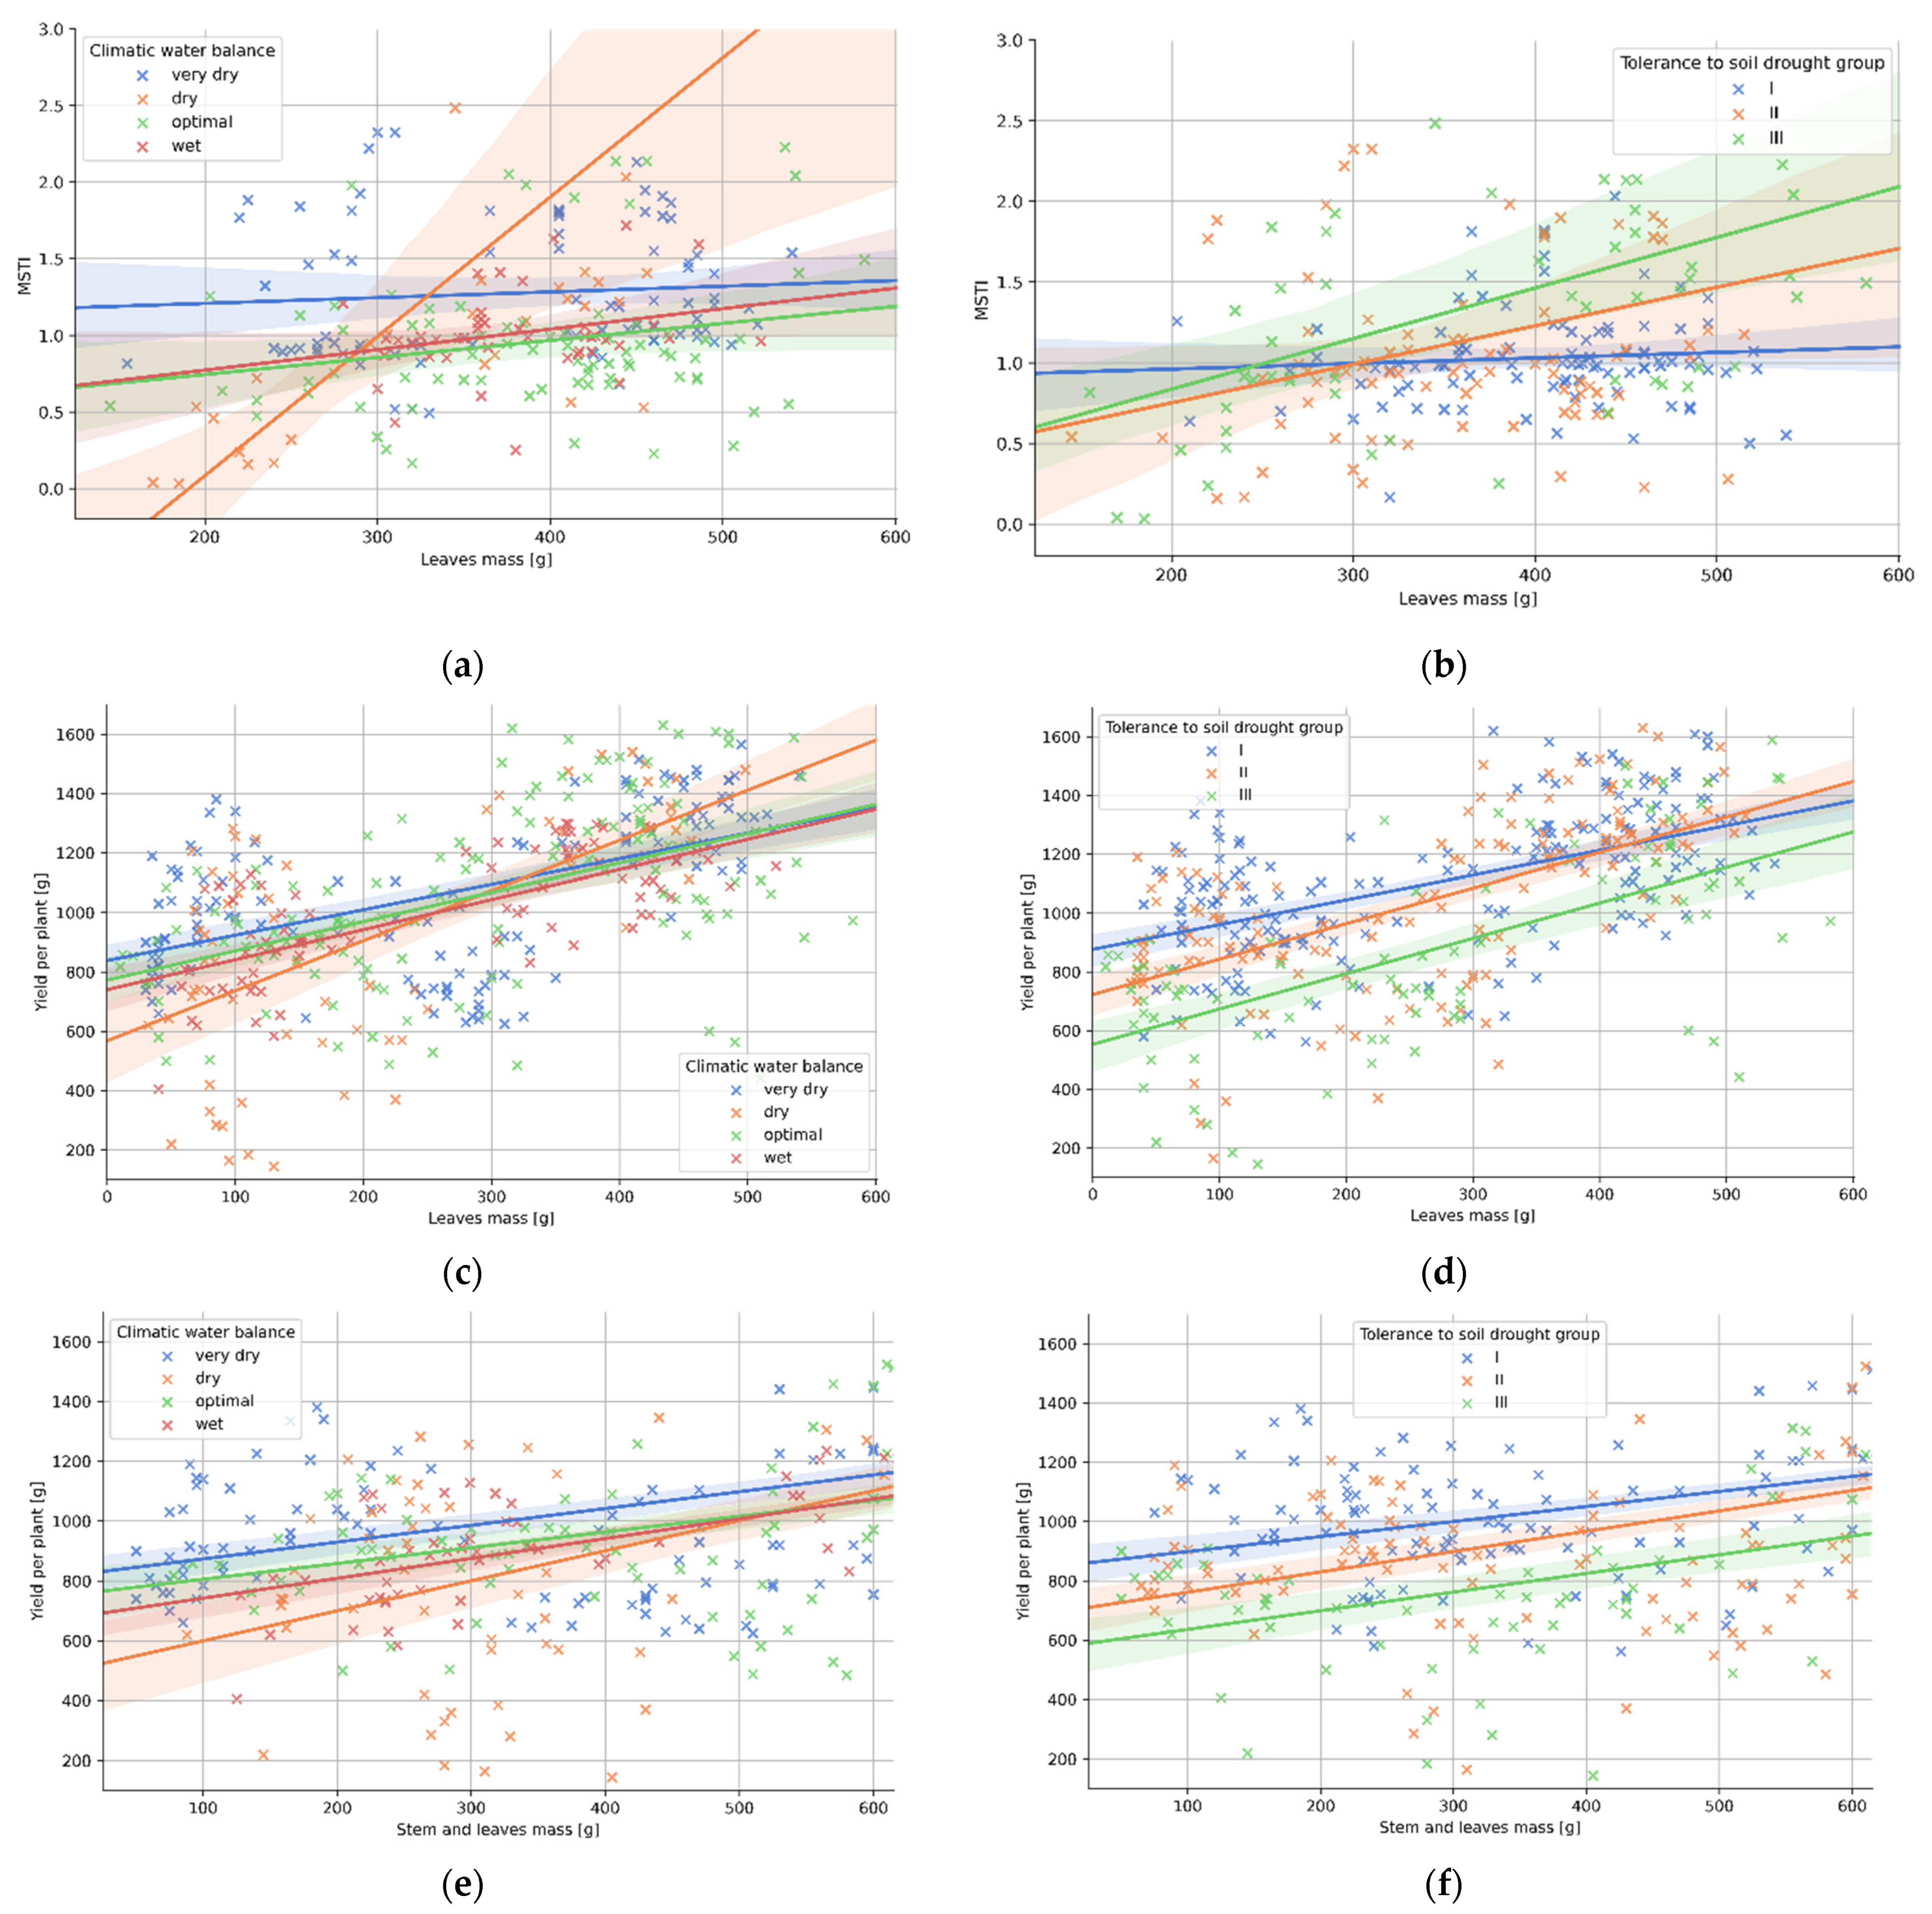
3.4. Relation between Plant Morphology and the Tolerance to Soil Drought

The highest positive correlations between plant morphology (Table 3), resistance to drought, and yield were related to the leaves’ mass and leaf assimilation. A significant relationship was proven between the leaf mass and MSTI for the groups of varieties with medium and low resistance. In the case of varieties with high resistance, such a relationship did not take place.
A significant relationship between the leaves mass and the yield concerned cultivars from all resistance groups and all years, regardless of the CWB. The highest correlation was found for wet and normal years, but even in that case, this relation was not very strong, and the linear correlation coefficient was lower than 0.5 (see Table 3).
For the studied parameters, the relations between the leaves’ mass and calculated MSTI were investigated. As it is depicted in Figure 3, the models for tolerance to soil drought groups differ significantly. For other studied relations, the slope of the models is similar (see Table 3)
However, the variance of the measurement is high; again, the measurement values overlapped between the groups, though it was not easy to distinguish them. Additionally, the correlation coefficient for those groups was quite low (Table 4).

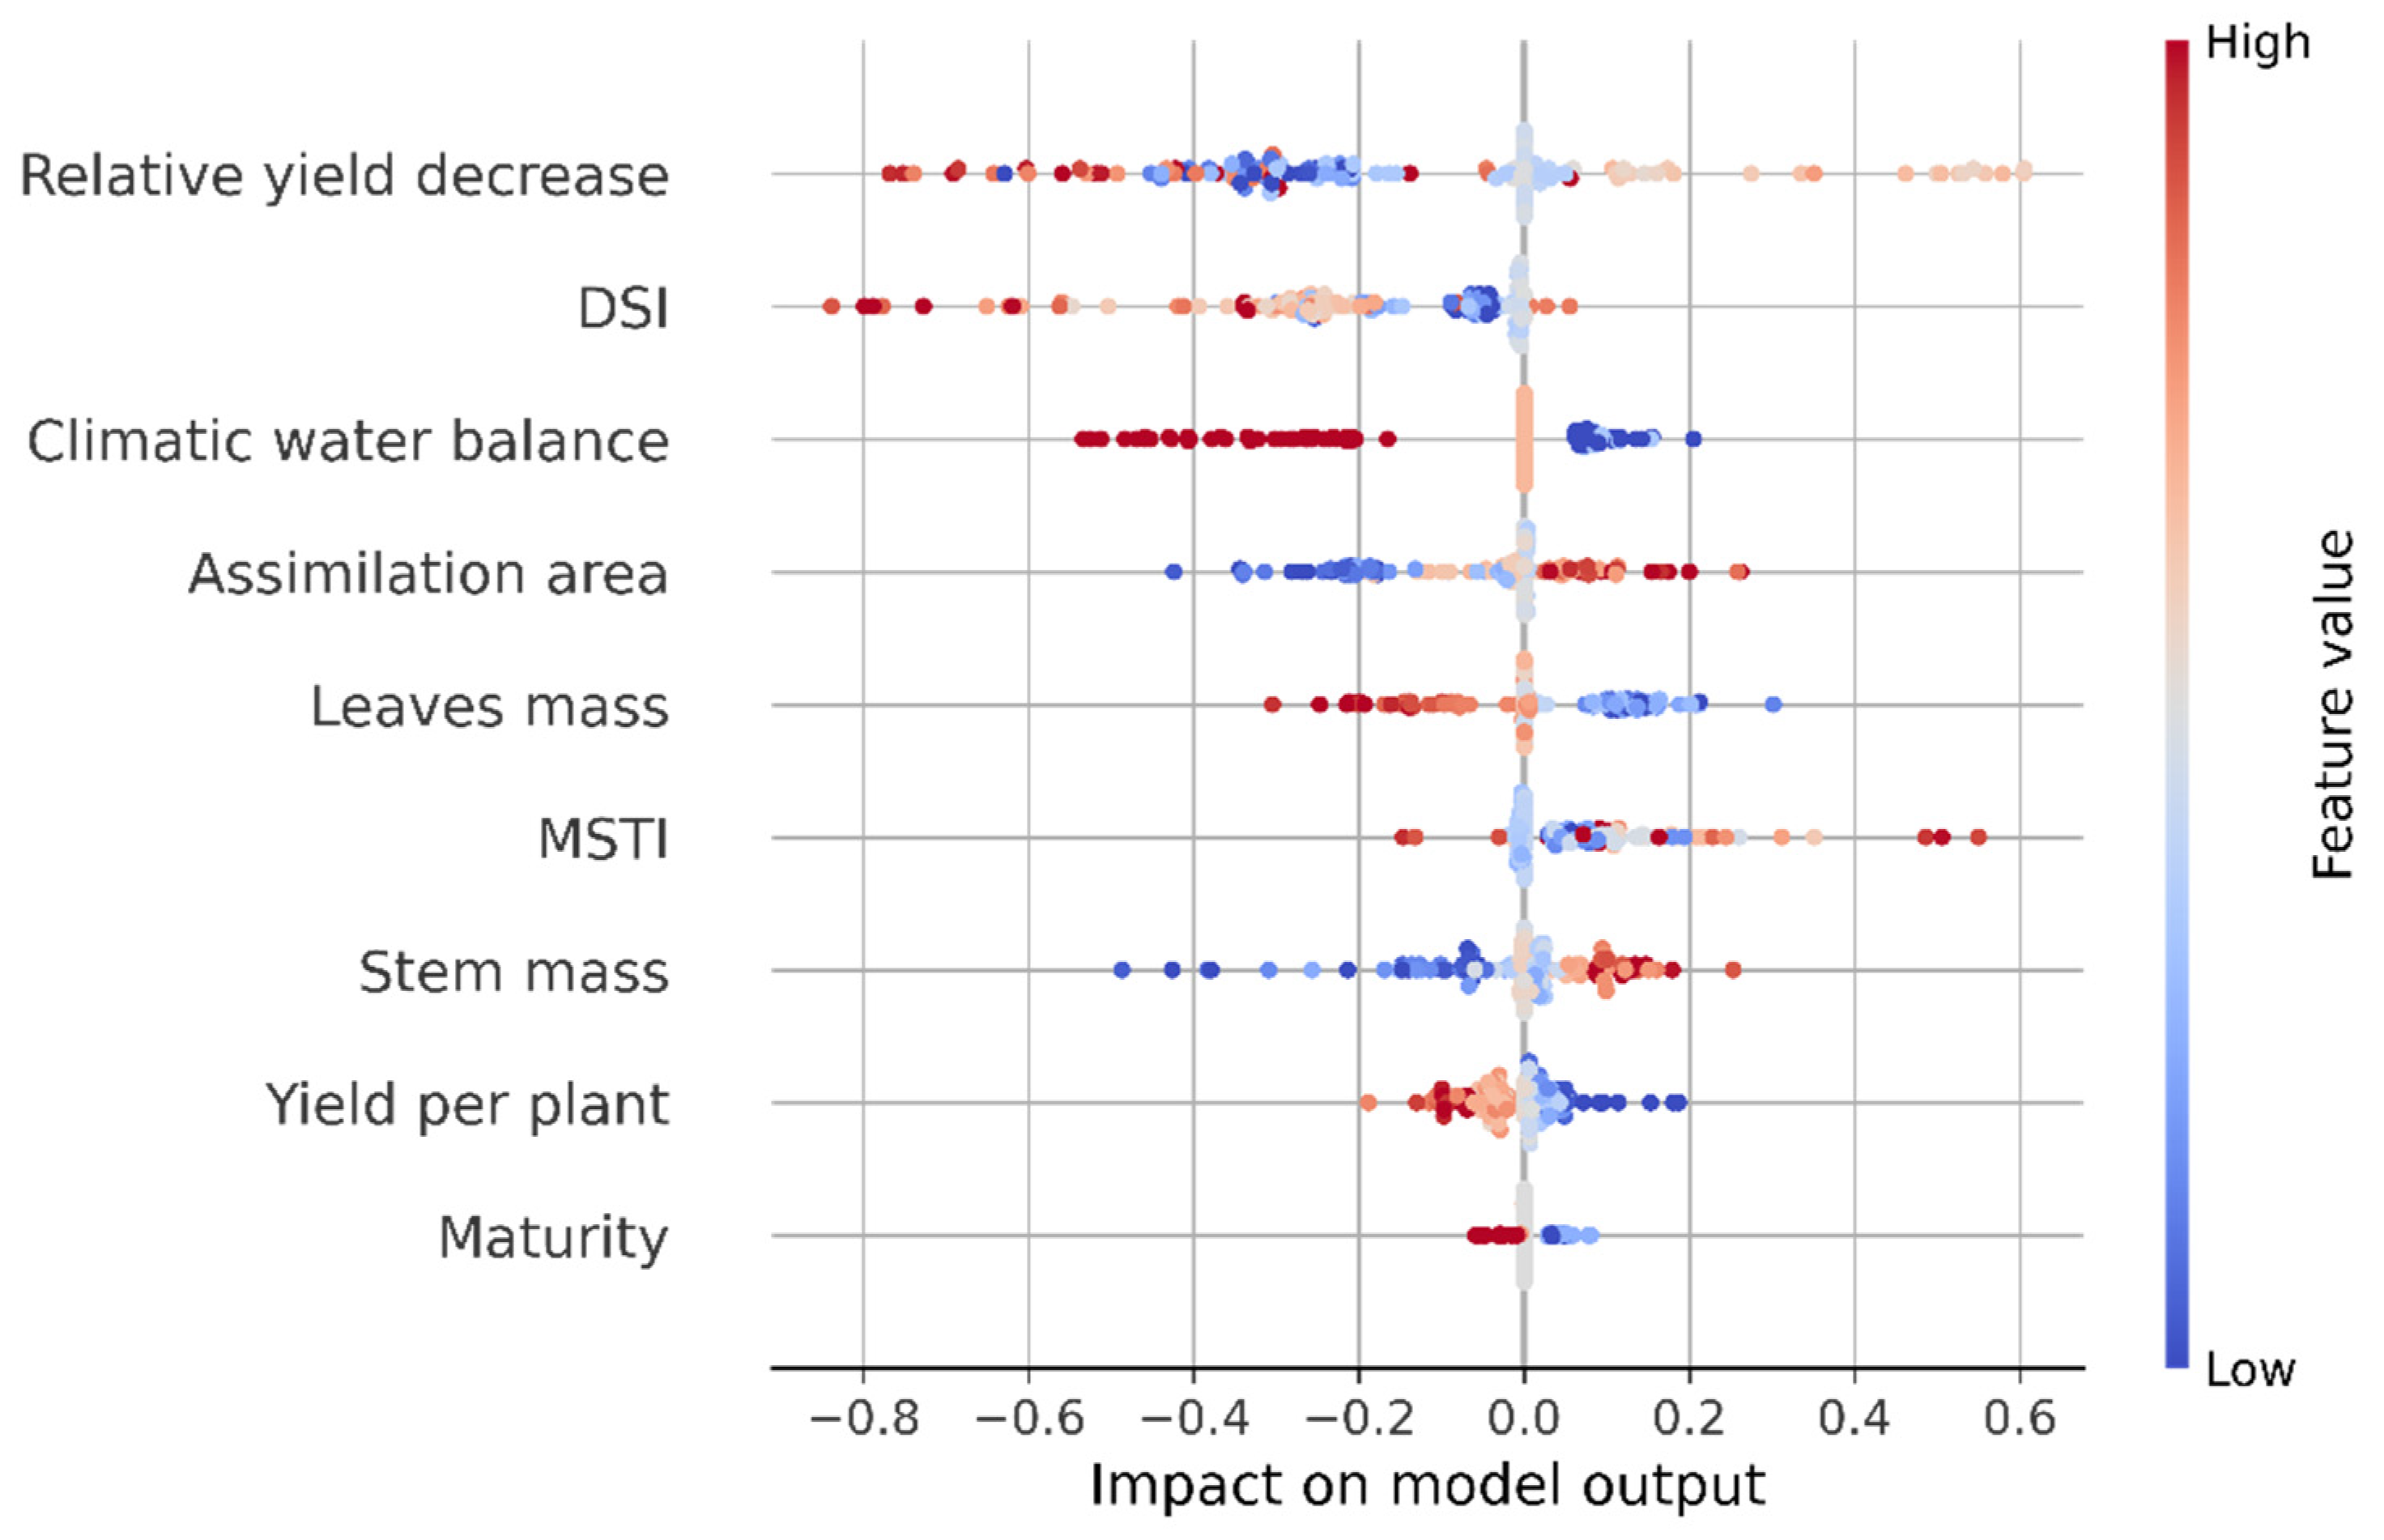
3.5. Machine Learning Models for Potato Variety Tolerance to Soil Drought Groups Classification

Additionally, as it could be spotted in Figure 3, despite some promising correlation coefficients for several analyzed relations, a description of the studied phenomena using linear univariate models is not possible. To get statistically significant models, one has to propose a method that could include many measured parameters altogether.
At the beginning of the study, using only the part of the measurements, the potato varieties were assigned into one of three groups of tolerance to soil drought. The other part of the measurements (n = 479) was used to verify that the implementation of an automatic method of classification of the potato variety using the proper configuration of the measured parameters is possible and, finally, could let one assess the cultivar tolerance to soil drought group for new, upcoming varieties.
The proposed model, using selected features from the analyzed measurements (X), should allow classifying the potato varieties to assign them to groups of their tolerance to soil drought (y). To achieve this goal, several machine learning algorithms were tested, including the Quadratic Discriminant Analysis, Random Forest, Extra Trees, Ada Boost, and extreme gradient boosting. The other tested model architectures with lower performance were dropped from the analysis. The measurement dataset was split into two parts: the training set (n = 383), which was used to prepare the models, and the test set (n = 96), which was used to evaluate the resulting models’ performance only. The dataset split was done using stratification according to the groups of tolerance to soil drought. As to the limitations of some of the used models that work only on data without missing values for some models, additional filtering was applied.
In the following steps, several model configurations (denoted as config in Table 5) were investigated to find out the optimal features setup. At first, the performance of the models trained on features not related to yielding was checked. Among a few tested configurations, the best results were noted for the model using Leaves mass, Climatic water balance, Maturity, Assimilation area, and Stem mass (config 1), for which the resulting accuracy, calculated on the test set, was 72.3%. This result was obtained for the implementation of the Extra Trees Classifier, and the other architectures paid off with significantly lower accuracy. All those results are presented in Table 5. An additional check was performed to find out which of the features had the greatest impact on classification (Table 6), and it was clarified that, with the importance over 40%, this parameter was the climatic water balance.
The model group that included the parameter yield-related measurements (like the Relative yield decrease or Yield per plant) returned significantly higher accuracies. The model that was trained on features config 2, with the following measured parameters: Relative yield decrease, Leaves mass, Climatic water balance, Yield per plant, and Maturity, the calculated classification accuracy was 87.1%, with a precision over 90% at the same time.
However, the highest classification performance was obtained for the models that took into account the designated indicators DSI and MSTI during the training process. Each of such configurations (config 3, config 4, and config 5) that were incrementally expanded with new features is described with a detailed configuration of the features and the resulting performance in Table 5. The final implementation of the extreme boosting classifier reached the accuracy of 96.7% while maintaining high precision and recall metrics. This result was achieved by processing the measurements of the following parameters: DSI, MSTI, Relative yield decrease, Leaves mass, Climatic water balance, Yield per plant, Maturity, Assimilation area, and Stem mass. The significantly higher score, in contrast to other model architectures, was achieved due to the ability of training on samples with partially missing data (thus, an unreduced training set).
The final classifier for the groups of potato varieties’ tolerance to soil drought, which uses extreme boosting, is a form of the extended decision trees method, and its eventual answer is based on an analysis of several features. Figure 4 allows one to investigate how this classifying decision is taken. The presented graph, generated using the method presented in Reference [35], allows one to follow what is the individual input feature’s impact on the model output regarding those feature values. In addition to the feature importance values for the final model, which are listed in Table 6, this method lets one deeper interpret the model features.

4. Discussion

To maintain sustainable potato production, we must adapt our cultivation practices and develop stress-tolerant potato cultivars that are appropriately engineered for the changing environment. Yet, the lack of data on the underlying mechanisms of potato plant resistance to abiotic and biotic stress and the ability to predict future outcomes constitutes a major knowledge gap. It is a challenge for plant scientists to pinpoint the means of improving tuber yields under increasing CO2, high temperatures, and drought stress including the changing patterns of pest and pathogen infestations [36]. Understanding stress-related physiological, biochemical, and molecular processes is crucial to developing screening procedures for selecting crop cultivars that can better adapted to changing growth conditions.
As has been emphasized many times, the potato is a species sensitive to soil drought. For many years, simple indicators have been searched to determine the tolerance of individual genotypes to drought stress [14,37,38]. Unfortunately, no such unambiguous measures have been found so far. The plant’s response to drought stress is multifaceted and has many elements. In our work, we attempted to assess the tolerance of as many as 50 potato genotypes tested over 15 years to drought stress based on their response to the environmental conditions described by the climatic water balance, and we assessed the relationship between the yield decline under drought stress and some morphological features of plants. Using these relationships, an attempt was made to create a mathematical model describing these relationships.
Based on the investigated data, it is quite difficult to predict the yield decrease of individual varieties based only on the Climatic Water Balance, even taking into account their drought stress tolerance group. It would seem that the cultivars with the highest tolerance should be characterized by the lowest yield decrease regardless of the applied stress level, which was not confirmed in all cases. It should be noted, however, that, in different years, the set of varieties was different, which, to some extent, could have influenced the interpretation of the results and the development of the model.
As already mentioned, many researchers are looking for simple indicators characterizing a cultivar’s tolerance to drought and, consequently, to the yield. As far as the morphological features of the plant are concerned, for sure is the mass and size of the leaves, which shape the size of the plant’s assimilation area and the tuber yield. Our research also confirmed these dependencies. The greatest positive correlation regarding the morphological features, resistance to drought, and yield size were obtained for the mass of leaves and the assimilation area, similar to Reference [39]. A positive correlation also took place in the case of the mass of stems. Although, in our research, these correlations were not as high as could be expected. Interestingly, the highest significance concerned the cultivars from the group with medium and low resistance to the tested stress. The relationships between the leaf assimilation area of potato cultivars and drought tolerance are less well-understood [40]. Most research on potato canopy traits is more concerned with the effects of drought on the canopy rather than the effects of canopy traits on drought tolerance [26]. This is understandable, as drought stress affects all plants by limiting the stable photosynthetic productivity at the chloroplast, leaf, and canopy levels [41]. However, potato canopies have an important role in regulating evapotranspiration [42], dry matter partitioning [43], and tuber yields [40] under drought conditions.
The linear modeling with one feature only seems to provide too weak predictors of the potato cultivars’ drought stress tolerance. Eventually, the combined analysis of several parameters allowed us to get a satisfactory classifier that passed the test and has the ability to distinguish potato cultivars of different groups.
Our linear models show a similar relationship to those obtained earlier [26,44]. Models that take into account genetic markers are being developed more and more often. The obtained relationships were of higher confidence for the tolerance of plants to abiotic stresses [45,46]. The performance of the final model that we found satisfactory had even better performance. It combined several parameters and reached an accuracy level of 0.967.
As there are many more potato cultivars, and even more are being introduced every year, it seems worth checking the proposed methodology with some additional measurements of those cultivars.
From the agronomic point of view, it seems important to know that a particular variety belongs to a specific drought tolerance group and to indicate what level of yield decline can be expected when the cultivation is under stressful conditions. The more and more frequent dry and very dry years will somehow force the selection of varieties with the highest tolerance. Our results will support policy-makers in prioritizing the dissemination of specific varieties in different regions of our country, depending on the climatic conditions. This study provided trait-level insights and adoption estimates that may be useful in shaping future breeding agendas.
A conventional potato breeding strategy typically creates a large breeding population, then employs phenotypic recurrent selection over several generations. As running trials over many years can be an expensive process, breeders are constantly searching for ways to make breeding programs more cost-effective. One of the ways to reduce the time consumption and costs of breeding may be to develop and use practice models that take into account the dependencies between the plant’s morphological and physiological characteristics and the yields of the tubers under stress conditions.
As a continuation of that study, it would be worth repeating the whole process for other cultivars and check if it brings similar results. A collection of measurements from a larger set of potato varieties could help to provide a more robust method that would be able to generalize better for new cultivars. The other direction the research could check is if some of the measurements in the process could be replaced with estimations based on imagery or remote sensing techniques. Such a method could accelerate the assessment process for new cultivars.

Author Contributions

Conceptualization, D.B.-M. and K.Z.; methodology, D.B.-M., K.Z. and B.R.; software, B.R.; validation, D.B.-M., K.Z. and B.R.; formal analysis, D.B.-M. and K.Z.; investigation, D.B.-M. and B.R.; resources, D.B.-M. and B.R.; data curation, B.R.; writing—original draft preparation, D.B.-M.; writing—review and editing, D.B.-M. and B.R.; visualization, B.R.; supervision, K.Z.; project administration, D.B.-M.; and funding acquisition, D.B.-M. and B.R. All authors have read and agreed to the published version of the manuscript.

Funding

This research was partially supported by The National Centre for Research and Development of Poland, grant number: POIR.04.01.04-00-0009/19, by the Ministry of Agriculture, Poland (MRiRW), grant number: 59:4-3-00-3-02, and the Statutory Research Fund of the Potato Agronomy Department, Plant Breeding and Acclimatization Institute-NRI, Division Jadwisin, Poland.

Institutional Review Board Statement

Not applicable.

Informed Consent Statement

Not applicable.

Data Availability Statement

Not applicable.

Acknowledgments

Thanks to Anna Wierzbicka for her help in the CWB calculations.

Conflicts of Interest

The authors declare no conflict of interest.

References

  1. Hatfield, J.L.; Boote, K.J.; Kimball, B.A.; Ziska, L.H.; Izaurralde, D.R.; Ort, D.; Thomson, A.M.; Wolfe, D. Climate impacts on agriculture: Implications for crop production. J. Agron. 2011, 103, 351–370. [Google Scholar] [CrossRef] [Green Version]
  2. Vandegeer, R.; Miller, R.E.; Bain, M.; Gleadow, R.M.; Cavagnaro, T.R. Drought adversely affects tuber development and nutritional quality of the staple crop cassava (Manihot esculenta Crantz). Funct. Plant Biol. 2012, 40, 195–200. [Google Scholar] [CrossRef] [PubMed] [Green Version]
  3. Bach, S.; Yada, R.Y.; Bizimungu, B.; Sullivan, J.A. Genotype by environment interaction effects on fibre components in potato (Solanum tuberosum L.). Euphytica 2012, 187, 77–86. [Google Scholar] [CrossRef] [Green Version]
  4. Obidiegwu, J.; Bryan, G.; Jones, G.; Prashar, A. Coping with drought: Stress and adaptive responses in potato and perspectives for improvement. Front. Plant Sci. 2015, 6, 542. [Google Scholar] [CrossRef] [PubMed] [Green Version]
  5. Holden, N.; Brereton, A.; Fealy, R.; Sweeney, J. Possible CHANGE in Irish climate and its impact on barley and potato yields. Agric. For. Meteorol. 2003, 116, 181–196. [Google Scholar] [CrossRef] [Green Version]
  6. Hijmans, R.J. The effect of climate change on global potato production. Am. J. Potato Res. 2003, 80, 271–280. [Google Scholar] [CrossRef]
  7. Kabira, J.N.; Macharia, M.; Karanja, M.W.; Muriithi, L.M. Potato Seed: How to Grow and Market Healthy Planting Material; Technical Note; Agricultural Research Institute: Nairobi, Kenya, 2006; Volume 20. [Google Scholar]
  8. Van Dam, J.; Levin, I.; Struik, P.C.; Levy, D. Genetic characterisation of tetraploid potato (Solanum tuberosum L.) emphasizing genetic control of total glycoalkaloid content in the tubers. Euphytica 1999, 110, 67–76. [Google Scholar] [CrossRef]
  9. Tang, R.; Niu, S.; Zhang, G.; Chen, G.; Haroon, M.; Yang, Q.; Rajora, O.P.; Li, X.Q. Physiological and growth responses of potato cultivars to heat stress. Botany 2018, 96, 897–912. [Google Scholar] [CrossRef]
  10. Ahn, Y.-J.; Claussen, K.; Zimmerman, J.L. Genotypic differences in the heat-shock response and thermotolerance in four potato cultivars. Plant Sci. 2004, 166, 901–911. [Google Scholar] [CrossRef]
  11. Struik, P.C. Responses of the potato plant to temperature. In Potato Biology and Biotechnology: Advances and Perspectives; Vreugdenhil, D., Bradshaw, J., Gebhardt, C., Govers, F., MacKerron, D.K.L., Taylor, M.A., Ross, H.A., Eds.; Elsevier Science: Amsterdam, The Netherlands, 2007; pp. 366–396. [Google Scholar] [CrossRef]
  12. Ghosh, S.C.; Asanuma, K.; Kusutani, A.; Toyota, M. Effects of temperature at different growth stages on nonstructural carbohydrate, nitrate reductase activity and yield of potato. Environ. Control Biol. 2000, 38, 197–206. [Google Scholar] [CrossRef]
  13. Iwama, K.; Yamaguchi, J. Abiotic stress. In Handbook of Potato Production, Improvement and Post-Harvest Management; Gopal, J., Khurana, S.M.P., Eds.; Food Product Press: New York, NY, USA, 2006. [Google Scholar]
  14. Zarzyńska, K.; Boguszewska-Mańkowska, D.; Nosalewicz, A. Differences in size and architecture of the potato cultivars root system and their tolerance to drought stress. Plant Soil Environ. 2017, 63, 159–164. [Google Scholar] [CrossRef] [Green Version]
  15. Vos, J.; Groenwold, J. Characteristics of photosynthesis and conductance of potato canopies and the effect of cultivar and transient drought. Field Crops Res. 1989, 20, 237–250. [Google Scholar] [CrossRef]
  16. Opena, G.B.; Porter, G.A. Soil management and supplemental irrigation effects on potato: II. root growth. Agron J. 1999, 91, 426–431. [Google Scholar] [CrossRef]
  17. Weisz, R.; Kaminski, J.; Smilowitz, Z. Water deficit effects on potato leaf growth and transpiration: Utilizing fraction extractable soil water for comparison with other crops. Am. Potato J. 1994, 71, 829–840. [Google Scholar] [CrossRef]
  18. Martinez, I.; Munoz, M.; Acuna, I.; Uribe, M. Evaluating the Drought Tolerance of Seven Potato Varieties on Volcanic Ash Soils in a Medium-Term Trial. Front. Plant Sci. 2021, 12, 1238. [Google Scholar] [CrossRef]
  19. Benos, L.; Tagarakis, A.C.; Dolias, G.; Berruto, R.; Kateris, D.; Bochtis, D. Machine Learning in Agriculture: A Comprehensive Updated Review. Sensors 2021, 21, 3758. [Google Scholar] [CrossRef]
  20. Ruszczak, B.; Smykała, K.; Dziubański, K. The Detection of Alternaria Solani Infection on Tomatoes Using Ensemble Learning. J. Ambient. Intell. Smart Environ. 2020, 12, 407–418. [Google Scholar] [CrossRef]
  21. Tomaszewski, M.; Michalski, P.; Osuchowski, J. Evaluation of Power Insulator Detection Efficiency with the Use of Limited Training Dataset. Appl. Sci. 2020, 10, 2104. [Google Scholar] [CrossRef] [Green Version]
  22. Hassanpanah, D. Evaluation of potato advanced cultivars against water deficit stress under in vitro and in vivo condition. Biotechnology 2010, 9, 164–169. [Google Scholar] [CrossRef] [Green Version]
  23. Fischer, R.A.; Maurer, R. Drought resistance in spring wheat cultivars. I. grain yield responses. Aust. J. Agric. Res. 1978, 29, 897–912. [Google Scholar] [CrossRef]
  24. Koźmiński, C.; Michalska, B. Ćwiczenia z Agrometeorologii; PWN: Warszawa, Poland, 1999; p. 179. [Google Scholar]
  25. Radomski, C. Pomiary i Obliczanie Parowania. In Agrometeorologia; PWN: Warszawa, Poland, 1987; pp. 173–186. [Google Scholar]
  26. Sprenger, H.; Rudack, K.; Schudoma, C.; Neumann, A.; Seddig, S.; Peters, R.; Zuther, E.; Kopka, J.; Hincha, D.K.; Walther, D.; et al. Assessment of drought tolerance and its potential yield penalty in potato. Funct Plant Biol. 2015, 42, 655–667. [Google Scholar] [CrossRef] [PubMed]
  27. Aliche, E.; Oortwijn, M.; Theeuwen, T.; Bachem, C.; Visser, R.; van der Linden, G. Drought response in field grown potatoes and the interactions between canopy growth and yield. Agric. Water Manag. 2018, 206, 20–30. [Google Scholar] [CrossRef]
  28. Mayvan, A.D.; Beheshti, S.A.; Masoom, M.H. Classification of vehicles based on audio signals using quadratic discriminant analysis and high energy feature vectors. Intern. J. Soft Comput. 2015, 6, 53–64. [Google Scholar] [CrossRef]
  29. Srivastava, S.; Gupta, M.R.; Frigyik, B.A.; Rosset, S. Bayesian quadratic discriminant analysis. J. Mach. Learn. Res. 2007, 8, 1287–1314. [Google Scholar]
  30. Geurts, P.; Ernst, D.; Wehenkel, L. Extremely randomized trees. Mach. Learn. 2006, 63, 3–42. [Google Scholar] [CrossRef] [Green Version]
  31. Chen, T.; Guestrin, C. XGBoost: A scalable tree boosting system. In Proceedings of the 22nd ACM SIGKDD International Conference on Knowledge Discovery and Data Mining, San Francisco, CA, USA, 13–17 August 2016; pp. 785–794. [Google Scholar] [CrossRef] [Green Version]
  32. Scikit Learn Documentation. Available online: https://scikit-learn.org (accessed on 25 June 2021).
  33. XGBoost Documentation. Available online: https://xgboost.readthedocs.io (accessed on 17 July 2021).
  34. SHAP (SHapley Additive exPlanations) Documentation. Available online: https://shap.readthedocs.io (accessed on 29 December 2021).
  35. Lundberg, S.M.; Erion, G.; Chen, H.; DeGrave, A.; Prutkin, J.M.; Nair, B.; Katz, R.; Himmelfarb, J.; Bansal, N.; Lee, S.I. From local explanations to global understanding with explainable AI for trees. Nat. Mach. Intell. 2020, 2, 56–67. [Google Scholar] [CrossRef]
  36. Dahal, K.; Li, X.-Q.; Tai, H.; Creelman, A.; Bizimungu, B. Improving Potato Stress Tolerance and Tuber Yield Under a Climate Change Scenario—A Current Overview. Front. Plant Sci. 2019, 10, 563. [Google Scholar] [CrossRef]
  37. Głuska, A. Differentiation of root system size in potato cultivars. Biul. IHAR 2004, 232, 37–46. [Google Scholar]
  38. Boguszewska-Mańkowska, D.; Pieczyński, M.; Wyrzykowska, A.; Kalaji, H.M.; Sieczko, L.; Szweykowska-Kulińska, Z.; Zagdańska, B. Divergent strategies displayed by potato (Solanum tuberosum L.) cultivars to cope with soil drought. J. Agron. Crop Sci. 2018, 204, 13–30. [Google Scholar] [CrossRef] [Green Version]
  39. Zaki, H.E.M.; Radwan, K.S.A. Response of potato (Solanum tuberosum L.) cultivars to drought stress under in vitro and field conditions. Chem. Biol. Technol. Agric. 2022, 9, 1. [Google Scholar] [CrossRef]
  40. Schittenhelm, S.; Sourell, H.; Löpmeier, F.J. Drought resistance of potato cultivars with contrasting canopy architecture. Eur. J. Agron. 2006, 24, 193–202. [Google Scholar] [CrossRef]
  41. Jones, H.G.; Corlett, J.E. Current topics in drought physiology. J. Agric. Sci. 1992, 119, 291–296. [Google Scholar] [CrossRef]
  42. Vos, J.; Groenwold, J. Genetic Differences in water-use efficiency, stomatal conductance and carbon isotope fractionation in potato. Potato Res. 1989, 32, 113–121. [Google Scholar] [CrossRef]
  43. Jefferies, R.A.; MacKerron, D.K.L. Responses of potato genotypes to drought. II. leaf area index, growth and yield. Ann. Appl. Biol. 1993, 122, 105–112. [Google Scholar] [CrossRef]
  44. Wishart, J.; George, T.S.; Brown, L.K.; White, P.J.; Ramsay, G.; Jones, H.; Gregory, P.J. Filed Phenotyping of potato to assess root and shoot characteristics associated with drought tolerance. Plant Soil. 2014, 378, 351–363. [Google Scholar] [CrossRef] [Green Version]
  45. Sprenger, H.; Erban, A.; Seddig, S.; Rudack, K.; Thalhammer, A.; Le, M.Q.; Walther, D.; Zuther, E.; Köhl, K.I.; Kopka, J.; et al. Metabolite and transcript markers for the prediction of potato drought tolerance. Plant Biotechnol. J. 2018, 16, 939–950. [Google Scholar] [CrossRef] [PubMed] [Green Version]
  46. Haas, M.; Sprenger, H.; Zuther, E.; Peters, R.; Seddig, S.; Walther, D.; Kopka, J.; Hincha, D.K.; Köhl, K.I. Can Metabolite- and Transcript-Based Selection for Drought Tolerance in Solanum Tuberosum Replace Selection on Yield in Arid Environments? Front Plant Sci. 2020, 11, 1071. [Google Scholar] [CrossRef]
Figure 1. Histogram and frequency tabulation of the total Climatic Water Balance (CWB) (mm) for the potato growing season (May–August) in the years 2005–2015 and the split into four categories: very dry, dry, optimal, and wet.
Applsci 12 01939 g001
Figure 2. Relative yield decrease in years (a) according to the climatic water balance: very dry, dry, normal, and wet; (b) for different cultivar groups with a tolerance to soil drought; and (c) both splits simultaneously.
Applsci 12 01939 g002
Figure 3. Relation between the agronomic parameters against categories climatic water balance (left side) or against the tolerance to soil drought group (right side) presented for the parameter sets (a,b) leaves mass and MSTI, (c,d) leaves mass and yield per plant, (e,f) stem and leaves mass and yield per plant, and (g,h) assimilation area and yield per plant.
Applsci 12 01939 g003aApplsci 12 01939 g003b
Figure 4. Local explanation summary with SHAP values for the final model (config 5) output.
Applsci 12 01939 g004
Table 1. Cultivars tested in a particular year.
YearTested Cultivar
2005Andromeda, Asterix, Danusia, Korona, Rosalind, Satina, Saturna, Syrena, Wiking, Zebra, Zeus
2006Andromeda, Asterix, Bartek, Cekin, Satina, Saturna, Syrena, Tajfun, Violet F, Zebra
2007Medea, Miłek, Niagara, Satina, Tajfun, Violet F
2008Aruba, Cyprian, Inwestor, Irga, Owacja, Tetyda
2009Aruba, Cyprian, Flaming, Inwestor, Jutrzenka, Katahdine, Miłek, Niagara, Owacja, Tetyda
2010Aruba, Cyprian, Flaming, Irga, Jutrzenka, Katahdine, Korona, Owacja, Tetyda
2011Bursztyn, Cekin, Desiere, Gawin, Gustaw, Katahdine, Legenda, Lord, Michalina, Stasia, Tajfun
2012Boryna, Gwiazda, Ignacy, Igor, Jurek, Kaszub, Lord, Michalina, Oberon,
2013Bartek, Bogatka, Gwiazda, Igor, Jubilat, Jurek, Legenda, Malaga, Oberon, Owacja, Tajfun, Tetyda
2014Tetyda, Cekin, Bogatka, Tajfun, Satina, Gawin, Owacja, Bartek, Gwiazda, Oberon
2015Bogatka, Cekin, Etiuda, Finezja, Gawin, Gwiazda, Laskara, Magnolia, Malaga, Mazur, Oberon, Owacja, Satina, Tajfun
Table 2. Classification of the precipitation condition with the climatic water balance (mm) of the potato growing season in Jadwisin for months (columns: V, VI, VII, and VIII and summary: V–VIII) in particular years of 2005–2015.
Climatic Water BalanceYearVVIVIIVIIIV–VIII
very dry2015−13−60−8−85−166
200526−32−22−71−99
dry2006−22−24−109123−32
2014−1214−4929−18
20082−45028−15
optimal20136941−722765
2012−1138183075
20091320272484
20072750−52496
wet2010147−102763227
2011−33−3625521207
Table 3. Descriptive statistics for the measured relative yield decrease concerning: (a) climatic water balance classes, (b) decrease for cultivar groups of tolerance to soil drought, and (c) for cultivar groups of tolerance to soil drought and climatic water balance classes.
(a) Climatic Water BalanceMinMaxMeanStdQ.25Q.5Q.75
very dry−3.4948.0627.8510.8620.9128.7735.34
dry2.6461.4333.0914.5123.2333.9041.86
optimal1.0256.8335.1210.7128.5435.2442.45
wet0.5061.6420.7810.3715.4519.8424.64
(b) Tolerance to soil droughtMinMaxMeanStdQ.25Q.5Q.75
Group I−3.4943.1621.8110.2315.8322.2528.59
Group II43.1656.8331.029.6824.9632.3635.92
Group III21.8161.6441.628.8238.0542.0247.33
(c) Tolerance to soil droughtClimatic water balanceMinMaxMeanStdQ.25Q.5Q.75
Group Ivery dry−3.4934.2519.649.9513.9120.5427.03
dry2.6437.9222.7914.1812.1429.2232.75
optimal1.0243.1630.438.9727.6128.9735.34
wet0.5024.8717.035.7713.1016.9222.42
Group IIvery dry11.7036.7928.366.7724.4029.1133.42
dry12.4848.7627.9710.1121.6624.9633.90
optimal8.8556.8334.7811.1731.1535.2442.17
wet24.9035.8229.855.2825.6829.3333.50
Group IIIvery dry26.0848.0639.295.9837.8240.4142.62
dry23.7661.4345.7010.2740.7047.3352.71
optimal27.3156.1642.697.9839.4642.4548.37
wet25.7461.6438.3215.2127.4731.1245.62
Table 4. Linear modeling results for relation between agronomic parameters against categories: climatic water balance or against tolerance to soil drought group, presented for parameters sets: (a) & (b) leaves mass and MSTI, (c) & (d) leaves mass and yield per plant, (e) & (f) stem and leaves mass and yield per plant, (g) & (h) assimilation area and yield per plant.
(a) Climatic Water Balancep-Val. 1rR2Std. Err.ab
very dry0.0630.210.050.0000.0010.521
dry0.4690.080.000.0010.0001.134
optimal0.0040.500.250.0020.009−1.736
wet0.0860.270.070.0000.0010.504
(b) Tolerance to Soil Droughtp-Val.rR2Std. Err.ab
group I0.4500.080.010.0000.0000.892
group II0.0290.240.060.0010.0020.272
group III0.0210.320.100.0010.0030.208
(c) Climatic Water Balancep-Val.rR2Std. Err.ab
very dry0.0000.560.320.1090.856838.341
dry0.0000.620.390.2621.686568.129
optimal0.0000.510.260.1450.984772.845
wet0.0000.710.500.1131.010740.277
(d) Tolerance to Soil Droughtp-Val.rR2Std. Err.ab
group I0.0000.550.300.100.840876.896
group II0.0000.620.390.131.207722.849
group III0.0000.640.400.161.203553.225
(e) Climatic Water Balancep-Val.rR2Std. Err.ab
very dry0.0000.560.320.070.561817.262
dry0.0000.600.360.171.004498.879
optimal0.0000.440.200.090.527752.745
wet0.0000.740.550.070.66675.698
(f) Tolerance to Soil Droughtp-Val.rR2Std. Err.ab
group I0.0000.520.270.060.507847.884
group II0.0000.580.340.080.686692.679
group III0.0000.540.290.110.629573.185
(g) Climatic Water Balancep-Val.rR2Std. Err.ab
very dry0.0000.500.250.010.049846.578
dry0.0000.630.390.020.104558.749
optimal0.0000.500.250.010.049816.544
wet0.0000.690.480.010.059781.220
(h) Tolerance to Soil Droughtp-Val.rR2Std. Err.ab
group I0.0000.570.320.010.052887.597
group II0.0000.640.410.010.067727.828
group III0.0000.530.280.010.060611.761
1 where p-val.—a probability value result for the Wald test with t-distribution, r—linear correlation coefficient, R2—model coefficient of determination, Std. Err.—standard error of the estimated gradient, a—the slope of the regression line, and b—the intercept of the regression line.
Table 5. Classifier performance diagnostics for models trained using different parameter configurations (Config column). All metrics were calculated using the measurements test set.
ModelConfig 1AccuracyPrecisionRecallF1-Score
Extra Trees Classifier10.7240.7830.7670.758
Quadratic Discriminant An.10.6350.6870.6740.651
Random Forest10.6920.7340.7210.721
AdaBoost 10.6030.6420.6280.632
Extreme boosting10.6090.6390.6280.631
Extra Trees Classifier20.8710.9040.8930.890
Quadratic Discriminant An.20.7900.8560.8210.815
Random Forest20.8410.8700.8570.856
AdaBoost 20.6450.8190.7860.783
Extreme boosting20.7460.8200.7860.770
Extra Trees Classifier30.8590.8750.8650.866
Quadratic Discriminant An.30.7910.8450.8020.803
Random Forest30.8200.8320.8230.824
AdaBoost 30.6940.8220.8020.805
Extreme boosting30.8490.8640.8540.856
Extra Trees Classifier40.8450.8470.8300.820
Quadratic Discriminant An.40.8580.8660.8510.854
Random Forest40.8690.8510.8510.849
AdaBoost 40.7610.8370.8300.832
Extreme boosting40.8280.8120.8090.799
Extra Trees Classifier50.8790.9320.9290.928
Quadratic Discriminant An.50.9000.9160.8930.890
Random Forest50.9050.9400.9290.926
AdaBoost 50.8080.8250.8210.822
Extreme boosting50.9670.9670.9640.964
1 Where the parameters configurations are: config 1: leaves mass, climatic water balance, maturity, assimilation area, and stem mass; config 2: relative yield decrease, leaves mass, climatic water balance, yield per plant, and maturity; config 3: DSI, MSTI, and relative yield decrease; config 4: DSI, MSTI, relative yield decrease, leaves mass, and climatic water balance; and config 5: DSI, MSTI, relative yield decrease, leaves mass, climatic water balance, yield per plant, maturity, assimilation area, and stem mass.
Table 6. The importance of the model features for two selected resistance models, the initial extra trees classifier and the finally selected extreme boosting classifier.
ModelFeatureWeight
Extra Trees Classifier
(initial features set of config 1)
Climatic water balance0.42
Maturity0.21
Stem mass0.14
Assimilation area0.12
Leaves mass0.11
Extreme boosting
(final selection of features config 5)
Climatic water balance0.20
Relative yield decrease0.16
MSTI0.14
DSI0.13
Stem mass0.09
Maturity0.08
Assimilation area0.07
Leaves mass0.06
Yield per plant0.06
Publisher’s Note: MDPI stays neutral with regard to jurisdictional claims in published maps and institutional affiliations.

