1. Introduction
Honey is a natural food with great importance for many countries due to its nutritional and medicinal properties [
1]. It is highly appreciated by consumers and the demand for honey of certified origin is currently a necessity. Pollen analysis, also known as melissopalynology, is a method to determine the origin of honey, based on the determination of the pollen grains presented in it [
2]. Honey contains pollen as a result of the manipulation of the flower when honeybees collect nectar. The procedure largely followed today is based on the method described in [
3]. Although widely accepted, this method has significant disadvantages, namely the high manual effort and the specialized expertise required, both leading to high costs and high demands on time and, thus, to restrictions in sample throughput [
4]. Because of the high financial importance of honey, it is necessary to provide effective tools that can help ensure its origin.
The automation of this process could work directly, reducing the analysis time, whilst increasing the accuracy of the results. Procedures related to image analysis and the use of neural networks have yielded significant results. Recent years have seen advances in the fields of machine learning and artificial intelligence related to pollen analysis [
5], with quite impressive results with up to 98% correct pollen classification [
6].
Geographical indications (GIs) identify a good honey as one that originates from a particular place, has a particular quality, characteristic, or reputation [
7]. In most cases, these indications have a determinative role in both domestic and international markets [
8]. One such product is “Pefkothymaromelo Kritis PDO”, a honey specific to Crete, which is characterized by specific organoleptic, physicochemical, and microscopic characteristics. To certify this product, pollen analysis is crucial. The main and defining type of pollen in that particular honey is thyme (formerly called
Coridothymus capitatus, currently referred to as
Thymbra capitata) which is present in all honey samples in a percentage greater than or equal to 10%. In addition, another 15 to 20 types of pollen grains from different plants are indicative of Cretan nature, mainly chestnut (
Castanea sativa), heather (
Erica arborea,
Erica manipuliflora), eucalyptus (
Eucalyptus camaldulensis), myrtle (
Myrtus communis), different species of
Sinapis sp. (Brassicaceae), carob (
Ceratonia siliqua), giant fennel (
Ferula communis) sage (
Salvia officinalis), marjoram (
Origanum microphyllum), and savory (
Satureja thymbra) [
9]. Therefore, an automated process of microscopic identification could aid the fast and accurate quality control of this product.
For this reason, a collection of pollen grains from plants usually present in “Pefkothymaromelo Kritis, PDO” was developed to create a microscopic imaging dataset. In particular, the scope of this work was to gather, prepare, and capture such images, as well as to develop an image processing method to segment each unique pollen grain. Doing so, the analysis of each pollen grain becomes easier, also enabling machine learning classification methods to be developed. The dataset is also publicly available at
10.5281/zenodo.4756360 (accessed on 13 May 2021) under a CC BY 4.0 licence for other researchers to use [
10].
The rest of the article is structured as follows.
Section 2 presents a short overview of pollen grain segmentation methods.
Section 3 presents the data acquisition, quality control and annotation protocol. The segmentation pipeline, as well as the performance results of the method are presented in
Section 4 and
Section 5, respectively. Finally, the findings of the study are discussed in
Section 6 and the article is concluded in
Section 7.
2. Related Works
Damian et al. [
11] proposed a 2-stage segmentation pipeline. In the first stage, they utilized Hough transform in order to detect the initial contours based on a circle-like pattern. After the initial contour estimation, three different methods were compared for the fine detection of the pollens’ contours. In particular, they utilized a basic edge-contour approach which was based on the gradient image, the snake-contour algorithm and the convex-hull algorithm. However, not all pollen grains have a circle-like shape as the ones examined in this study, originating from the Urticaceae family, and, thus, their approach may perform poorly on other types of pollen grains.
Battiato et al. [
12,
13] presented the Pollek13K dataset, which consists of a bit more than 13.000 segmented grains of 5 pollen types, which included a separate class for possible debris. In order to segment each one of the 13k grains, they developed a 3-stage processing pipeline, which consists of a pre-processing stage, the segmentation stage and a post-processing stage. During the preprocessing stage, several noise reduction filters are applied (i.e., mean shift filtering, Gaussian blurring), as well as the Otsu’s thresholding method to highlight the foreground and the pollen grains’ contours. In order to identify each pollen grain, several morphological operations are used. In addition, having the objects of interest filled with black color while the background filled with white color, any detected object that was smaller or larger than a predefined minimum or maximum size was discarded from the final dataset, based on analyzing the connected components in the image. Finally, in order to highlight only the foreground (i.e., the object of interest) in each of the segmented images and discard any of the background information, a post-processing approach based on several noise reduction filters and morphological operations was used. When we applied this processing pipeline on our data, we found that, although it performs well on large or well separated pollen grains, it really struggles to identify overlapping ones.
Olsson et al. [
14] developed a pollen grain segmentation pipeline which is based on watershed algorithm. Prior to the application of the watershed algorithm, the image applied a threshold, as well as several morphological operations [
15], similarly to the previously mentioned approaches.
Finally, Gallardo et al. [
16] developed a pollen grain detection method based on a convolutional neural network (CNN). Their CNN was trained based on a multifocal analysis approach, in which several focus points were used on the camera in order to capture all pollen grains under the optimal focus setting. The camera captured a video across all the focus points, which was used to train the network, after annotating a bounding box around each of the pollen grains. Their approach was trained and tested on 11 different pollen types and outperformed other methods that were based on non-machine learning image processing techniques, achieving recall and precision scores of 99% and intersection over union (IoU) score of 0.9. However, two main drawbacks of this approach is the laborious and time-consuming process of capturing the video, as well as annotating each grain at the various focus points.
In this study, we present a novel pipeline for segmenting pollen grains from fuchsin-stained microscope images of 20 types of plants gathered in Crete, Greece. The novelty of this study is twofold. First, the proposed method is robust and accurate since it is able to correctly detect and segment pollen grains of various shapes and sizes. Secondly, the proposed dataset is a unique and novel collection of pollen grains from plants across Crete, Greece, which we hope that this will accelerate the development of automated machine learning and deep learning systems for pollen classification, which is an essential step for melissopalynology and honey certification.
4. Segmentation Pipeline
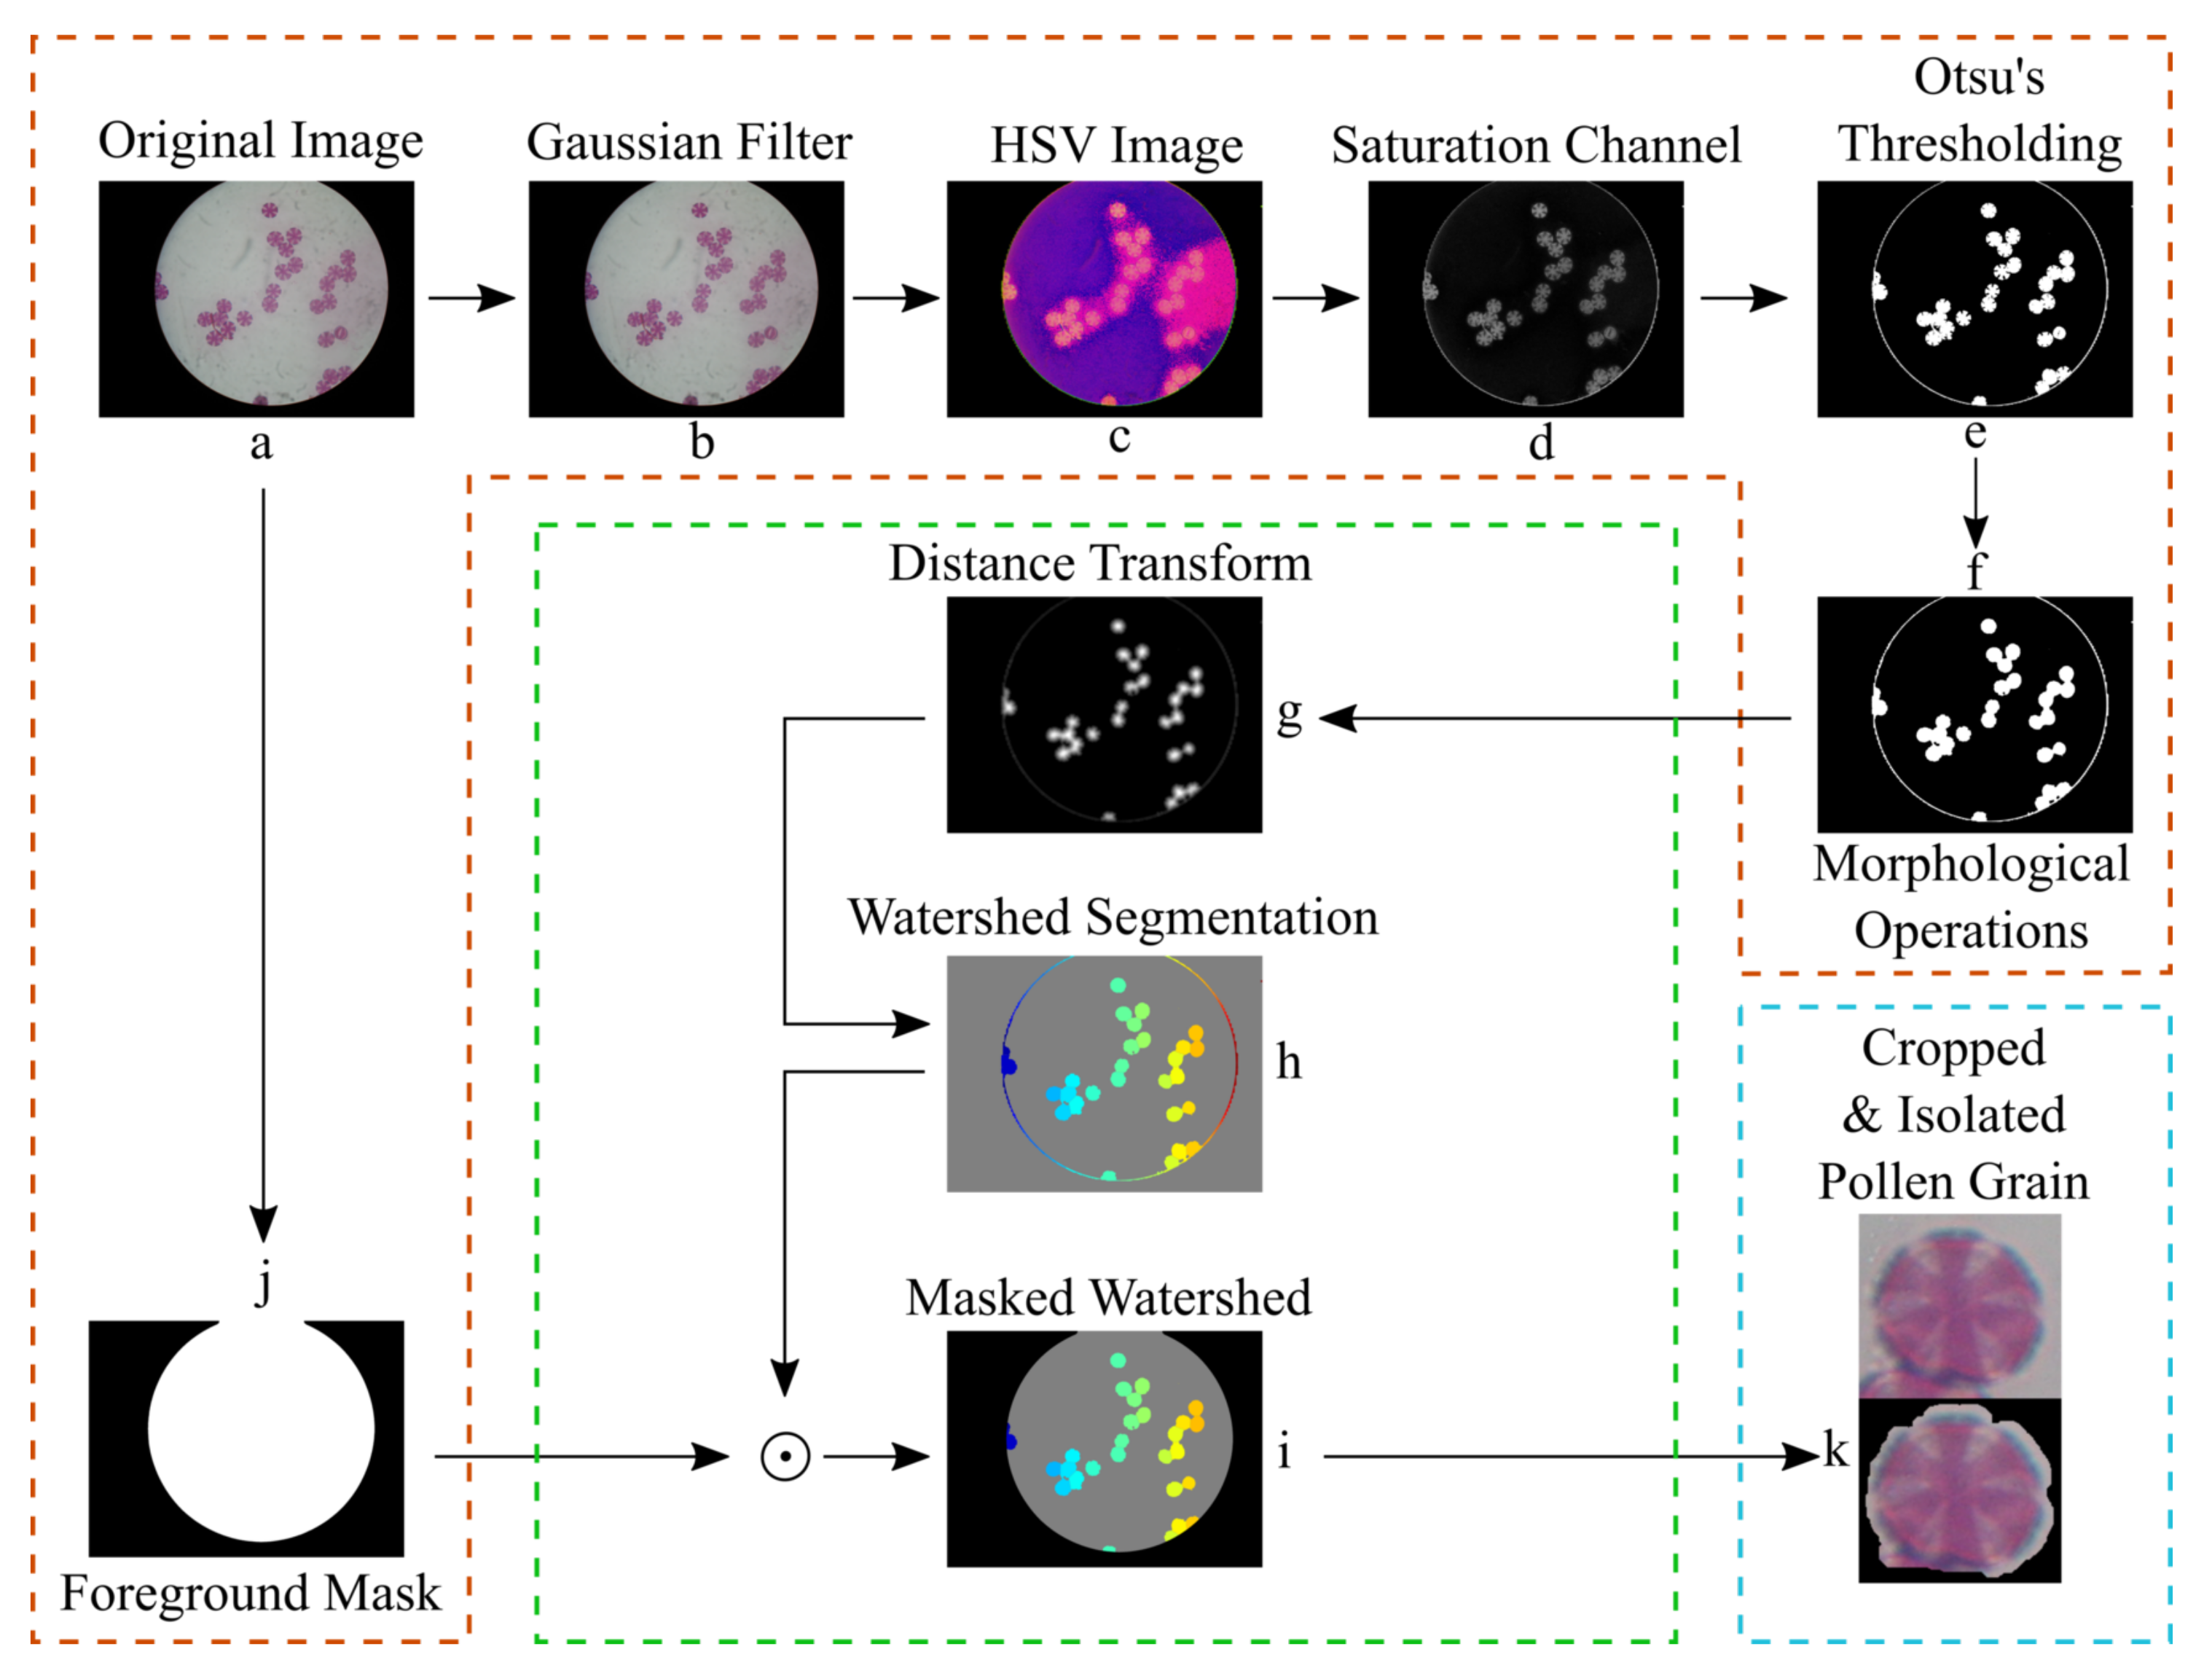
In this section, we present and describe in detail the pollen grain segmentation pipeline. The term "segmentation" in image processing and computer vision refers to the process of identifying, locating, and partitioning segments of the image that are of particular interest (i.e., the pollen grains in this case). In this study, the segmentation pipeline consists of 3 main components, which are also presented in
Figure 3:
The method was implemented in Matlab using the Image Processing Toolbox on a Ryzen 7 3700× CPU with 32 GB 3200 MHz RAM. The processing time for a single image was 1–2 seconds, depending on the number of unique pollen grains in the image. It should be noted that the preprocessing and segmentation stages of the pipeline are based on a semi-automatic approach, in the sense that several hyper-parameters can be tuned by the user during the execution of the methods, such as the morphological operations’ parameters.
4.1. Pre-Processing Stage
The aim of the preprocessing stage of the pipeline is to decrease any noise that may be present in the raw images and highlight the pollen grains’ contours that will be used for segmenting them. Firstly, we apply a Gaussian blurring filter (Equation (
1)) in order to eliminate any high-frequency noise and smooth the image.
where
is the standard deviation of the Gaussian distribution, which was set to
, and
are the pixel’s coordinates in the 2D plane. Then we convert the image from the red-green-blue (RGB) color model to the hue-saturation-value (HSV) model, Equations (
2)–(
5), and extract the saturation channel.
Because of the staining protocol, the pollen grains have a higher saturation value than the background does. Thus, by extracting the saturation channel from the HSV image, the pollen grains are better illuminated than they are on the RGB image, as seen in
Figure 3d. After the extraction of the saturation channel, the Otsu’s thresholding filter is applied [
17]. Finally, an opening or closing morphological operations or a combination of them is used in order to (
a) reduce any salt and pepper noise (i.e., white and black spots) that may be present after the thresholding or (
b) to fill any gaps within the pollen grains (
Figure 3e). In addition, we produce a foreground mask, as seen in
Figure 3j, by converting the RGB image to its grayscale equivalent (Equations (
6)) and thresholding it at the value of 20.
Similarly to the previous thresholding operation, in order to reduce any salt and pepper noise and fill any gaps, we apply several morphological operations (i.e., opening and closing, respectively). Finally, we shrink the generated mask, in order to make the binary circle mask a bit smaller, by applying an eroding morphological operation. This mask will be used to discard the outer part of the visible section of the image, which is shadowed and does not hold any meaningful information for the segmentation stage, as seen in
Figure 3i.
4.2. Segmentation Stage
The segmentation is based on the watershed algorithm, which is able to highlight even overlapping pollen grains fairly accurately. As seen in
Figure 3, the input to the segmentation stage is the thresholded image from the previous stage and the foreground mask. The first step is to calculate the distance transform of the complement of the thresholded image. The value of each pixel of the distance transform is calculated as the distance between that pixel and the nearest non-zero pixel of the complement of the thresholded image. Then the watershed algorithm is applied on the complement image of the distance transform. The resulting image from the watershed algorithm is multiplied pixel-wise by the foreground mask, in order to reduce any artifacts around the edge, that may be identified as pollen grains by the algorithm, as seen in
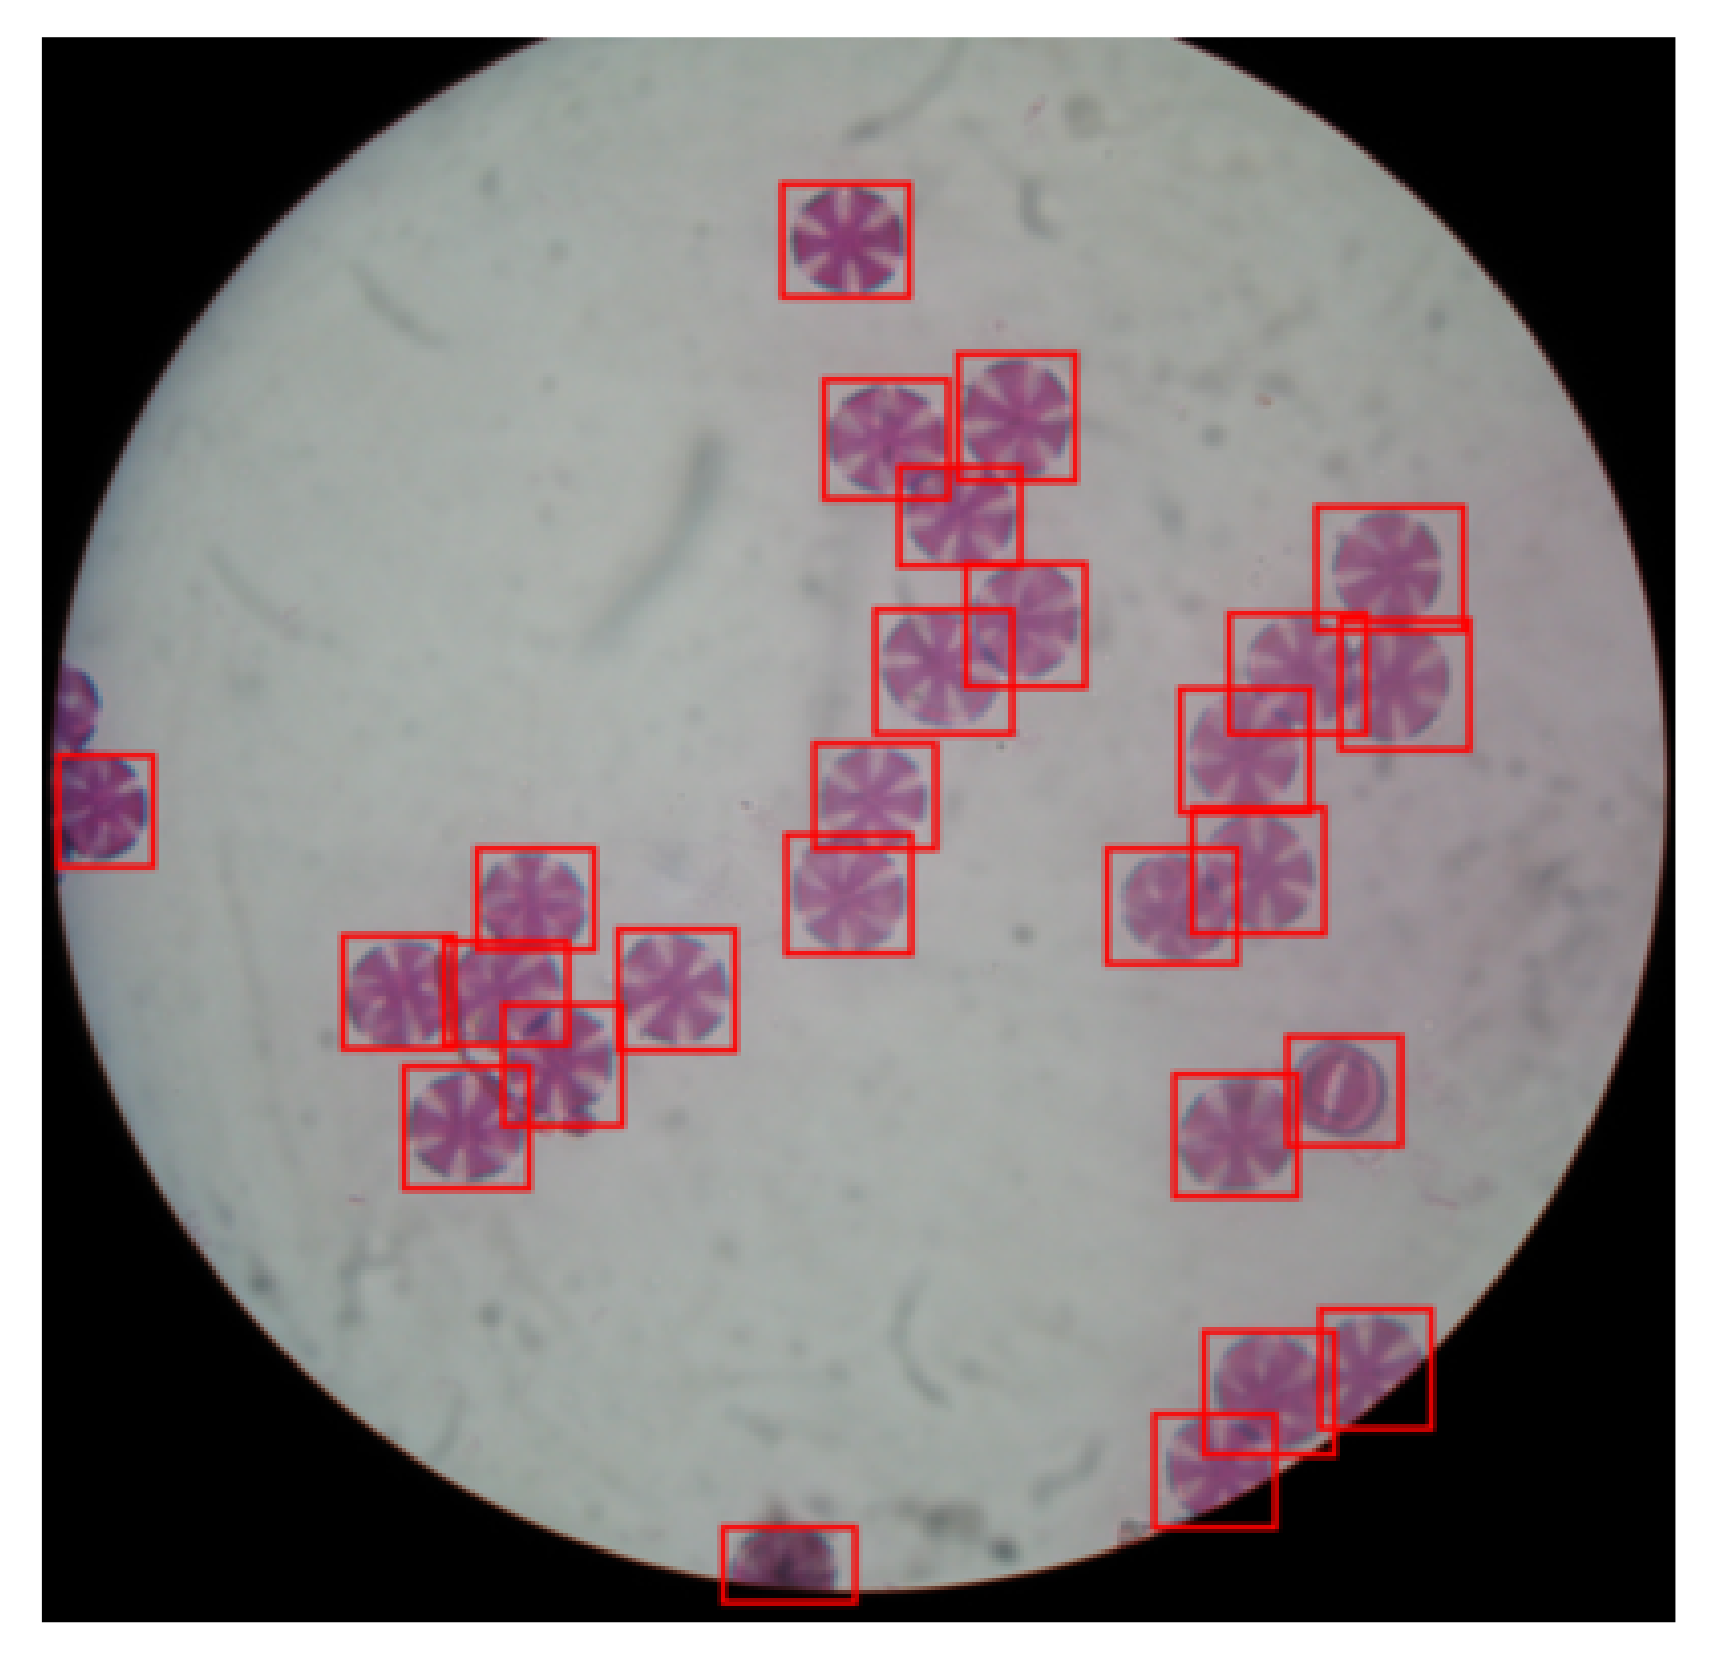
Figure 3h,i. Having the result of the watershed algorithm, we extract the contours of each identified pollen grain and analyze their morphology. Doing so, we calculate the area of each pollen grain in pixels, its centroid, as well as the bounding box surrounding its contour.
4.3. Post-Processing Stage
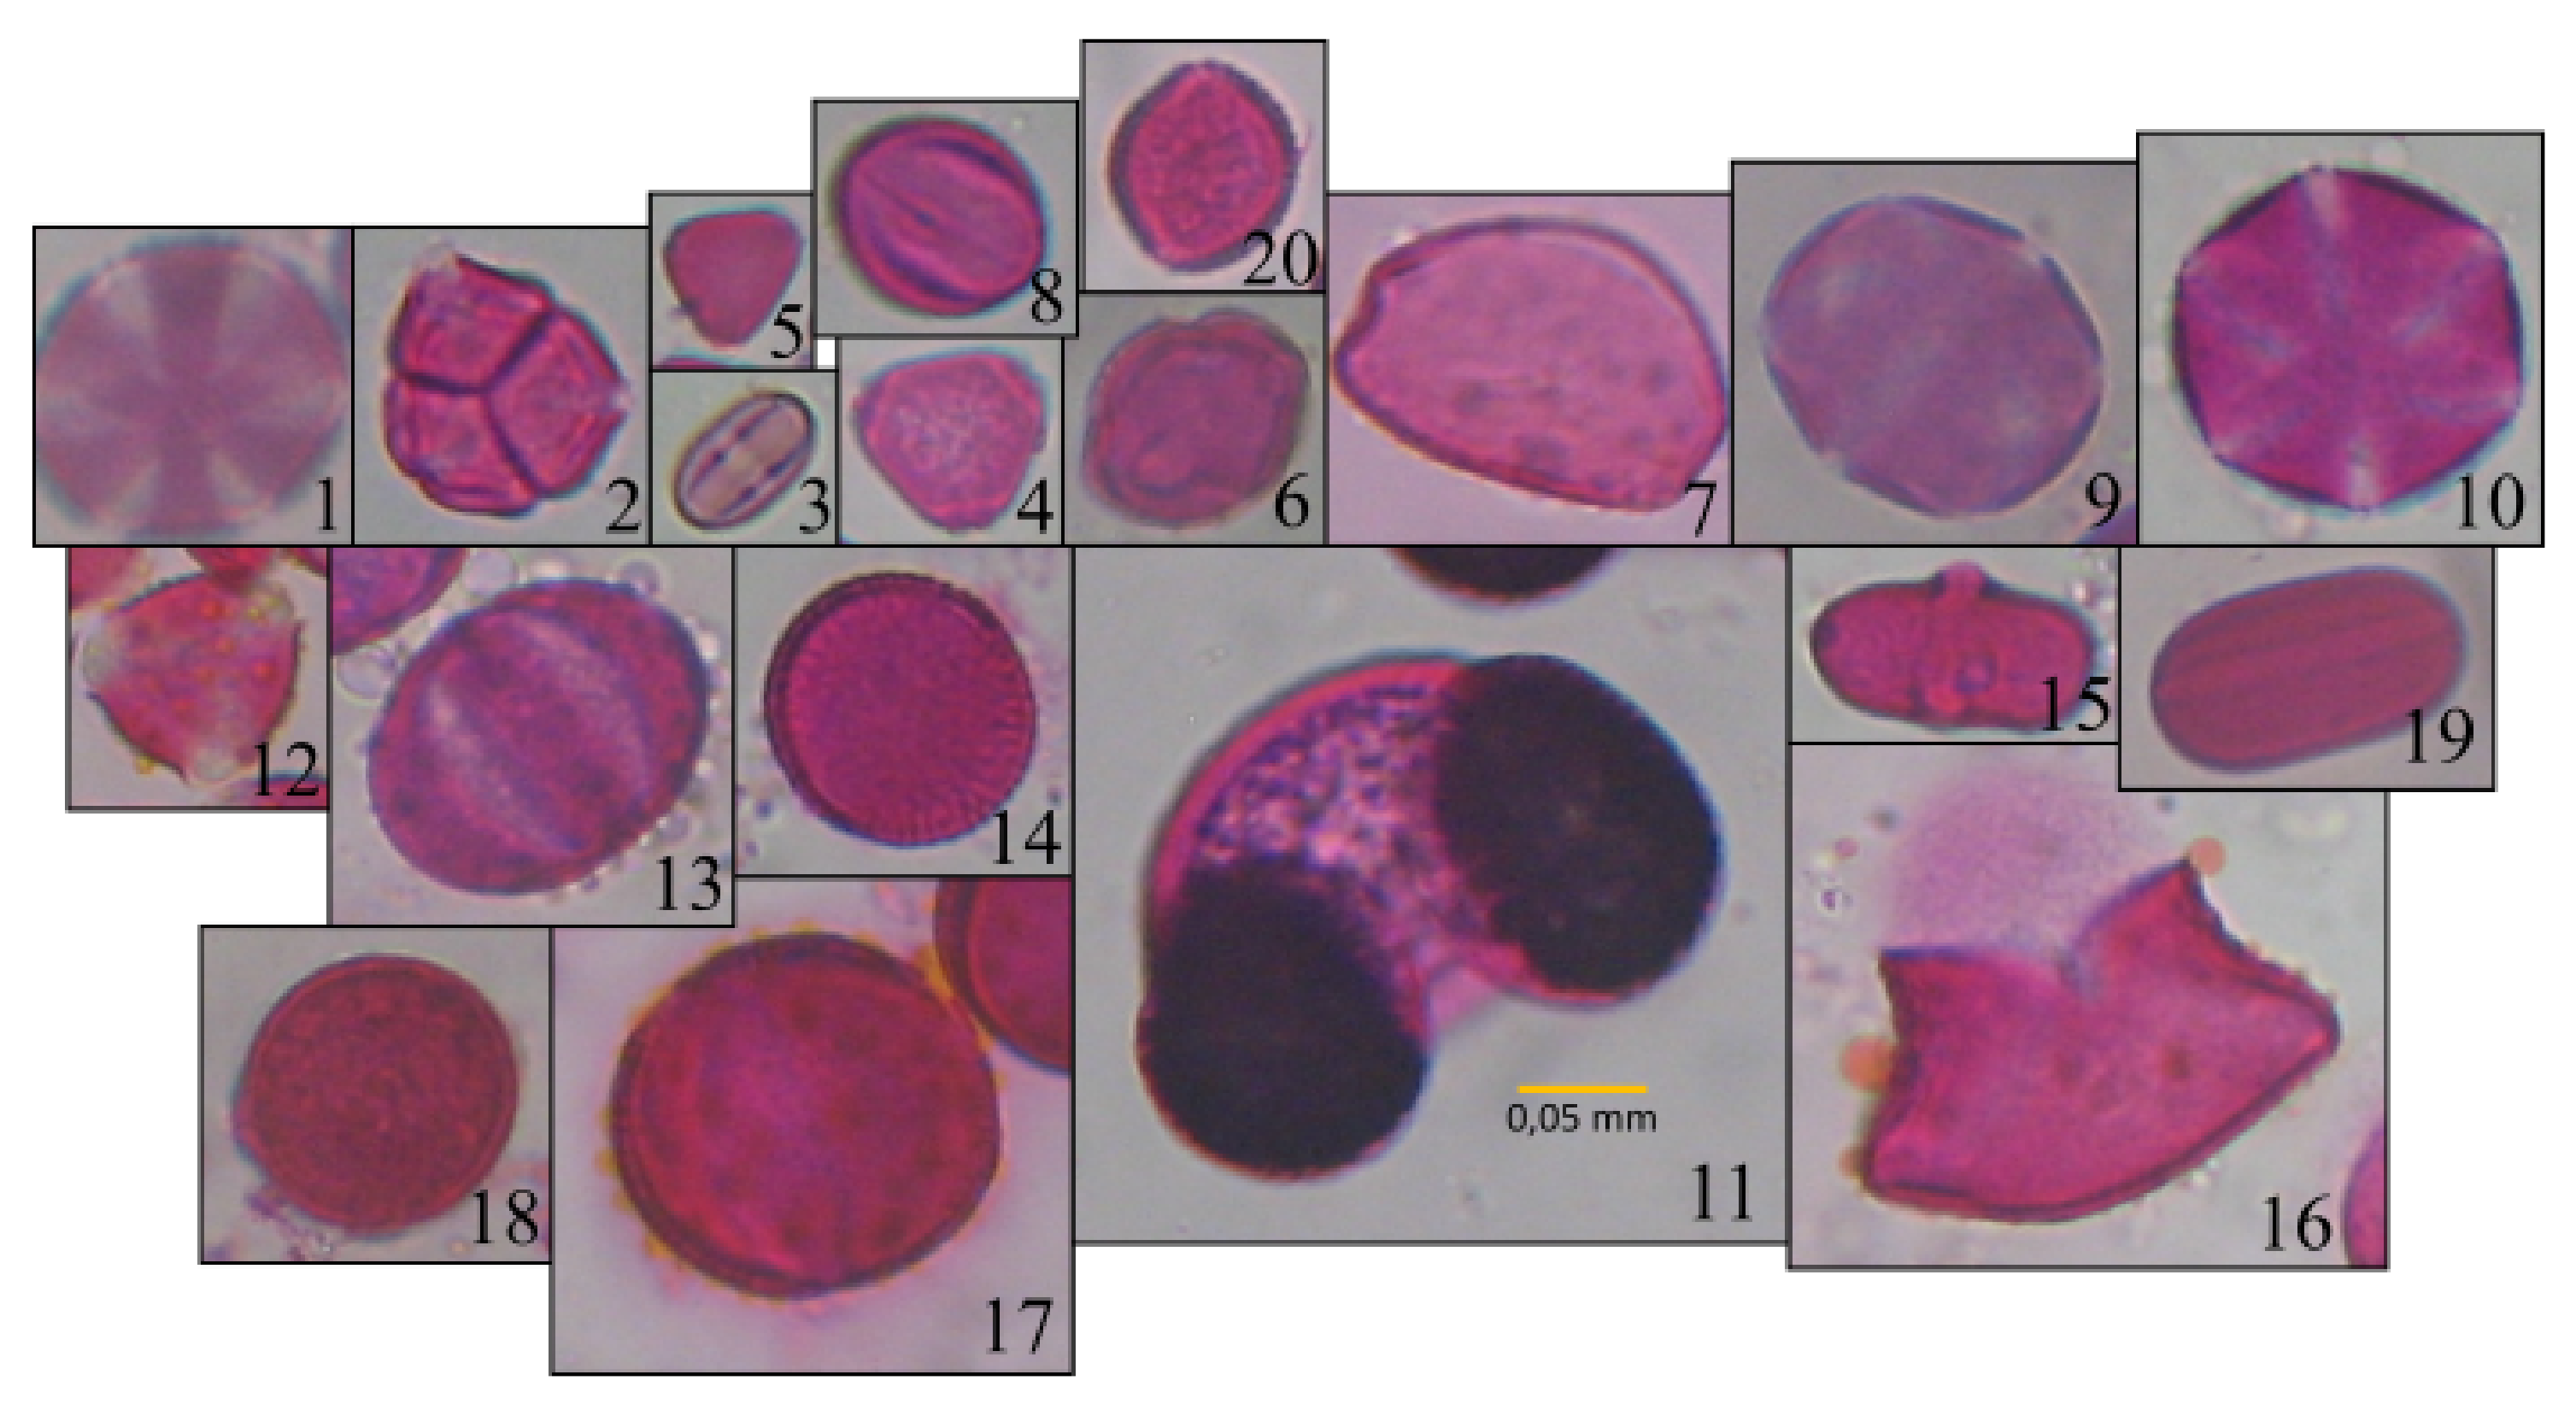
Having extracted the contour and the binary mask of each pollen grain, as well as having calculated their morphological characteristics, we can analyze them in order to discard any duplicate or false-positive pollen grains. Firstly, we identify possible duplicates by comparing the coordinates and possible overlaps between the computed bounding boxes for each of the pollen grains. If two bounding boxes with similar centroids’ coordinates overlap by at least 80%, then one of them is discarded as a duplicate of the other. Then we discard any detected pollen grain, whose contour area is bigger or smaller than two pre-specified values. The pollen grain size varies across the different types of pollens, as can be seen in
Figure 4. As an optional step, each segmented pollen grain is multiplied pixel-wise by its binary mask, in order to discard the background and keep only the foreground of each individual pollen grain, as seen in the last stage of the pipeline in
Figure 3k. In order to distinguish between the two, the segmented pollen grains whose background has been discarded will be referred as “isolated pollen grains” from now on, while those with the background present will be referred as “cropped pollen grains”.
5. Results
The performance of the segmentation pipeline is reported in
Table 1. In particular, there are two metrics that are presented, i.e., the number of the detected pollen grains and the method’s accuracy for detecting pollen grains for each one of the pollen types. The performance results in
Table 1 shows that the proposed method can detect each individual pollen grain with a high accuracy across all types of pollen. In addition, the proposed dataset consists of more than 4000 unique pollen grains from 20 types of plants, making it the second largest publicly available pollen dataset and the largest one regarding pollen that has been collected directly from plants, as seen in
Table 2.
Table 1.
Method performance results.
Table 1.
Method performance results.
| ID | Plant Name | Detected | Accuracy | ID | Plant Name | Detected | Accuracy |
|---|
| 1 | Thymbra | 146 | 98.7% | 11 | Pinus | 29 | 100% |
| 2 | Erica | 181 | 97.3% | 12 | Calicotome | 298 | 94.0% |
| 3 | Castanea | 218 | 81.0% | 13 | Salvia | 178 | 96.7% |
| 4 | Eucalyptus | 170 | 97.1% | 14 | Sinapis | 197 | 97.5% |
| 5 | Myrtus | 786 | 79.4% | 15 | Ferula | 83 | 90.2% |
| 6 | Ceratonia | 100 | 96.1% | 16 | Asphodelus | 34 | 100% |
| 7 | Urginea | 109 | 99.1% | 17 | Oxalis | 139 | 96.5% |
| 8 | Vitis | 269 | 95.4% | 18 | Pistacia | 34 | 100% |
| 9 | Origanum | 171 | 99.4% | 19 | Ebenus | 22 | 100% |
| 10 | Satureja | 71 | 100% | 20 | Olea | 790 | 92.9% |
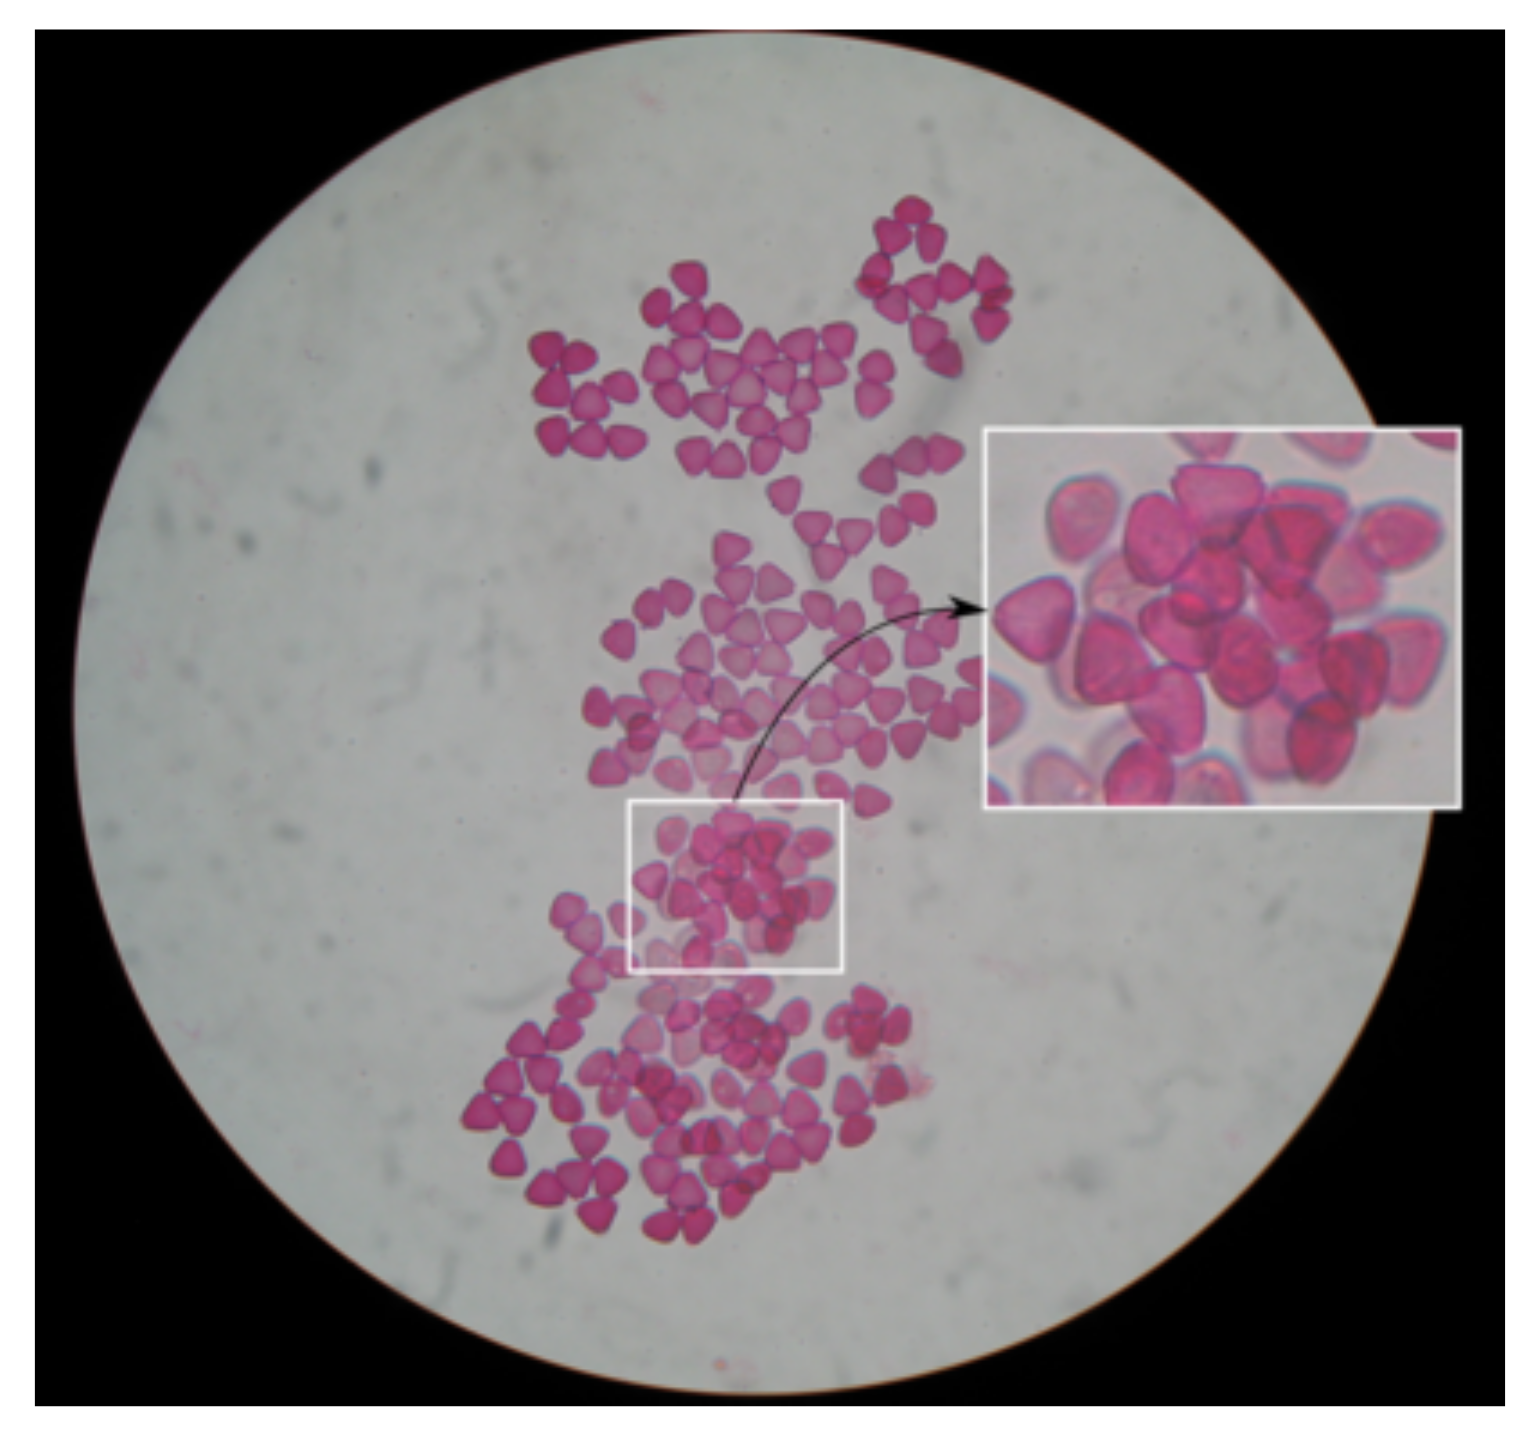
Regarding the
Myrtus pollen grains, which were detected with a low accuracy of 79.4%, there was a dense concentration of pollen grains in the images, with many overlaps and occlusions, as seen in
Figure 5. Such overlaps and occlusions make it difficult for the method to properly distinguish each unique pollen grain. A similar problem is observed on the
Castanea pollen grains, as seen in
Figure 6, on which the detection accuracy was 81%. These particular pollen grains have a very small size as can be seen in
Figure 4-3 and
Figure 6, compared to the rest pollen types. Thus, their small size combined with possible overlaps, make their detection trickier. However, there are more than 1000 and 200 pollen grains detected for each pollen type, respectively, which can be enough for a classification analysis when their unique shape and characteristics, as well as the number of the detected pollen grains of the rest species are also considered.
Although there is an imbalance for some pollen types, such as
Pinus (
Figure 4-11) and
Asphodelus (
Figure 4-16) their shape and characteristics are unique when compared to the rest of the pollen types. Thus, we do not expect a great performance loss in a machine learning classification task regarding these pollen classes. Similarly, we do not expect much performance issues when the
Ebenus (
Figure 4-19) pollen is considered, due to its similar size and shape to the
Ferula (
Figure 4-15) pollen. The former is rather smooth both on its outline and within it, in contrast to the latter, which has a rather harsher outline and texture. On the other hand, the same does not apply for the
Pistacia pollen (
Figure 4-18), which has a very similar shape and texture with other pollen types, such as
Sinapis (
Figure 4-14). As a result, we expect that these pollen types will be harder to distinguish from one another. In order to deal with such imbalancing, and increase the data, image augmentation techniques can be used.
6. Discussion
Although for most cases the segmentation masks enclose the whole pollen grain, there are some cases where part of the pollen grain has been removed. In order for the reader to fully understand this issue,
Figure 7 presents an example of a correctly segmented pollen grain (
Figure 7a) and a poorly segmented one (
Figure 7b). Such poorly segmented pollen grains encountered in images with dense concentration of pollen grains, i.e.,
Thymbra,
Eucalyptus,
Myrtus, etc. In addition, there are very few cases in densely concentrated microscopic images, where an isolated pollen grain image contains part of a separate pollen grain (
Figure 7c).
Table 3 presents the proportion of poorly segmented pollen grains for each class, respectively. It can be observed that
Thymbra, which is the most characteristic pollen type of the honey product of interest, has a proportion of 6.5% of poorly segmented pollen grains. However, we estimate that this issue will not have a serious impact on the performance of any machine learning based classification method, since they are only a small percentage of the dataset size when considering the size of each class individually. In addition, modern image augmentation techniques can be used to generate more samples and increase the size of the dataset.
In a future study, a more advanced image capturing device will be used (i.e., Kern microscope with built-in camera ODC-82/ODC-83, Kern, Germany) which will produce images of higher quality with less illumination artifacts than the ones used in this study. In addition, a deep learning based detection method will be explored, in order to increase both the detection accuracy, as well as the segmentation quality of the method.


 ,
, 


