Article

Multi-Attribute Decision Making Method for Node Importance Metric in Complex Network

Electronic Engineering Institute, National University of Defense Technology, Hefei 230037, China
*
Author to whom correspondence should be addressed.
Appl. Sci. 2022, 12(4), 1944; https://doi.org/10.3390/app12041944
Submission received: 22 December 2021 / Revised: 6 February 2022 / Accepted: 8 February 2022 / Published: 12 February 2022
(This article belongs to the Topic Multi-Criteria Decision Making)

Abstract

:
Correctly measuring the importance of nodes in a complex network is critical for studying the robustness of the network, and designing a network security policy based on these highly important nodes can effectively improve security aspects of the network, such as the security of important data nodes on the Internet or the hardening of critical traffic hubs. Currently included are degree centrality, closeness centrality, clustering coefficient, and H-index. Although these indicators can identify important nodes to some extent, they are influenced by a single evaluation perspective and have limitations, so most of the existing evaluation methods cannot fully reflect the node importance information. In this paper, we propose a multi-attribute critic network decision indicator (MCNDI) based on the CRITIC method, considering the H-index, closeness centrality, k-shell indicator, and network constraint coefficient. This method integrates the information of network attributes from multiple perspectives and provides a more comprehensive measure of node importance. An experimental analysis of the Chesapeake Bay network and the contiguous USA network shows that MCNDI has better ranking monotonicity, more stable metric results, and is highly adaptable to network topology. Additionally, deliberate attack simulations on real networks showed that the method exhibits high convergence speed in attacks on USAir97 networks and technology routes networks.

1. Introduction

Complex network systems are widely distributed in the real world. With the discovery of scale-free distributions [1], small worlds [2], and community-based properties possessed by complex networks, complex network science has gained wide attention in computer science, biological science, transportation planning, social science [3,4,5,6], and other fields. The node importance metric is one of the key research directions. The most important nodes can help us effectively defend against malicious network attacks [7], identify key genetic information [8], protect important transportation hubs [9], and strengthen the control of social opinion dissemination [10].
The importance of nodes in complex networks varies significantly depending on network topology and size. Current methods of node importance ranking include two main types: social network analysis methods and system science analysis methods [11]. In the social network analysis method, the main idea is that the importance of nodes is equal to the salience; the method does not destroy the connectivity of the network in the analysis process in order to ensure the topological integrity of the network. This is generally achieved through the use of a centrality indicator to measure the importance of nodes; the indicators that have been proposed include degree centrality, closeness centrality, betweenness centrality, clustering coefficient, Hirsch’s index, and k-shell indicator [12,13,14,15,16,17]. The main idea of the system science analysis method is that damage equals importance. Hence, after removing nodes from the network, the change of network properties is analyzed to determine the importance of the removed nodes; common indicators include the shortest path, network efficiency and maximum connectivity subgraph [18,19,20].
Since the system science analysis method would destroy the topology of the network, causing changes in the connectivity state between nodes and the loss of information about the nodes themselves, we adopt the social network analysis method to study the node importance metric problem. Usually, most of these indicators measure the importance of nodes from a certain perspective, but since networks have multiple morphological characteristics, using a single indicator to assess the importance of nodes is often incomplete: local indicators such as degree centrality and clustering coefficient can be calculated only based on the local structure near the nodes, but they cannot evaluate the importance of nodes globally. The k-shell indicator considers the global hierarchical structure of the network, but a large number of nodes are distributed in the same layer, so they cannot effectively measure the importance of nodes in the same layer. At the same time, because of different evaluation perspectives, different centralities may produce different metric results or even conflict, causing difficulties in node ranking decisions.
In order to assess the importance of nodes more rationally, two main research ideas are currently being investigated [21]. One is to combine the structural characteristics of the network and propose more reasonable evaluation indicators. Zhang [22] proposed an integral formula based on closeness centrality and betweenness centrality; Jang [23] used a linear weighting approach to combine degree centers and proximity centers; Hui [24] improved upon the structural hole method by considering the next nearest neighbor nodes. The above methods usually result in an optimized indicator that evaluates better, but the methods are hardly universal in terms of how to integrate the relevant indicators. In the second approach, multiple indicators are used to evaluate the same object, and the individual evaluation results of each indicator are combined with the information inherent in the data. This class of ideas introduces the multi-attribute decision-making (MADM) method to identify the importance of nodes. The main idea of MADM is to rank the options to be selected based on subjective or objective preferences. In [25], Hui used the TOPSIS method to combine multiple metrics to evaluate the importance of nodes comprehensively. Wang proposed improvements in [26] to optimize the assignment matrix. Chen [21] proposed a comprehensive evaluation system based on node entropy.
In this paper, we introduce the CRITIC method proposed by Diakoulak [27] into the node importance ranking, which can integrate the attribute information of multiple evaluation criteria scores without subjective involvement and comprehensively assess the importance of the solution to be selected based on the intrinsic nature of the scoring data to obtain the base ranking of the solution to be selected. We combine the CRITIC method with the current representative complex network indicators to obtain the multi-attribute CRITIC network decision indicator (MCNDI), which comprehensively evaluates the node importance.
The remainder of this paper is structured as follows.
Section 2 briefly reviews four typical centrality indicators for subsequent comparative analysis. In Section 3, the specific implementation of the CRITIC method will be described. In Section 4, we use two real network datasets to measure the integrated importance of each node and compare it with a single metric; we then perform a deliberate attack on the USAir97 and technology routes networks and discuss the simulation results.

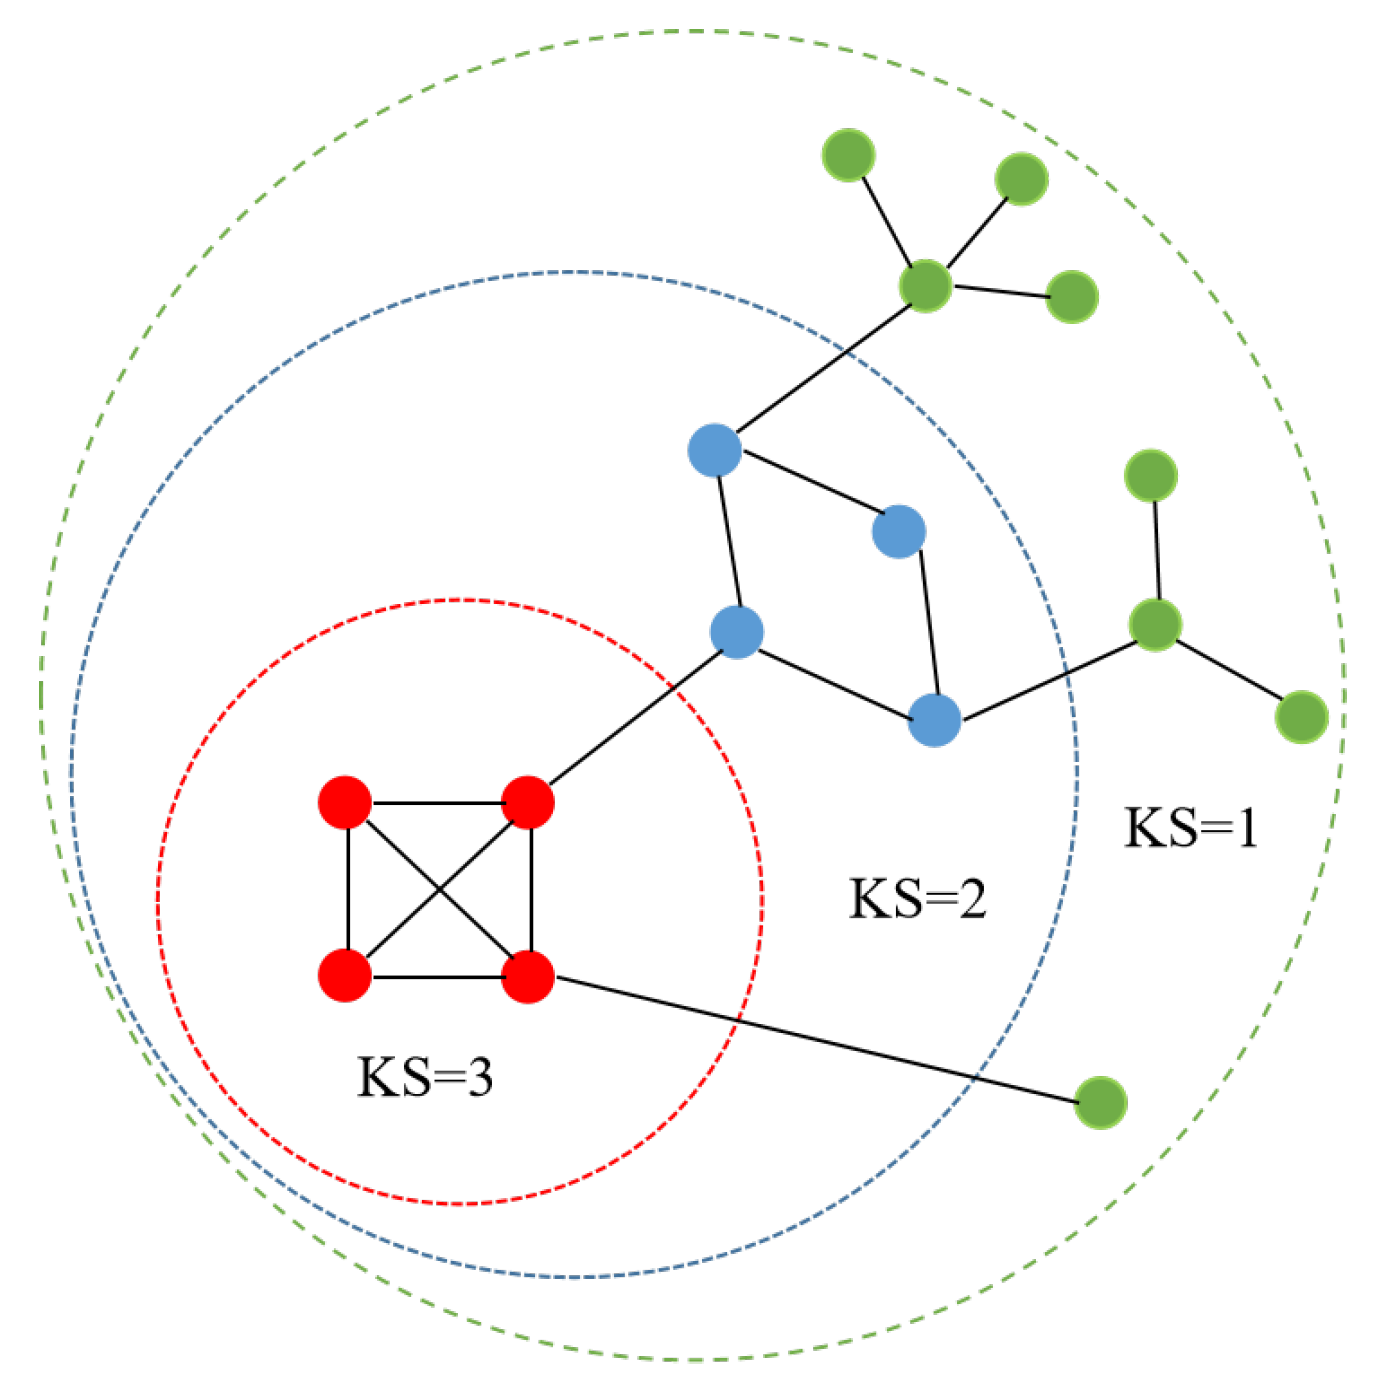
2. Related Theoretical Foundations

Considering a graph G = ( V , E ) to represent complex networks, G is an undirected connected graph, where V is the set of nodes and V = { 1 , 2 , 3 , , n } . E is the set of edges and E = { 1 , 2 , 3 , , m } . Because the multi-attribute decision-making method can take advantage of all single indicators, in the process of selecting sub-indicators for multi-attribute decision making, it is important to first provide more comprehensive information about the importance of nodes, while homogeneity of selected indicators should be avoided as much as possible. The local information of nodes is the most basic importance measure of nodes, which characterizes the structural correlation between nodes and neighboring nodes and portrays the local importance of nodes; as the hub of information flow in the network, the shortest path of node association reflects the contribution of the node in the global information flow process, and the global location information of nodes reflects the distance of nodes from the center of the network and characterizes the core degree of nodes in the network. Meanwhile, focusing on the set of indirectly associated nodes, the nodes in the intermediary role tend to have more information. Therefore, in this paper, we select multi-attribute decision sub-metrics from four aspects: node local information, path centrality, node global location information, and node information quantity. Next, we present each single centrality indicator.
Definition 1.
H-index (abbreviated as H).
Originally used extensively to assess scholarly communication among academics, the H-index has gradually been extended to apply to the study of a variety of complex networks. The definition for the H-index is as follows [16]: the degree of any node i is denoted by k i , and the degrees of its neighbors are k j 1 , k j 2 , …, k j k i . For a finite number of real numbers ( x 1 , x 2 , , x n ) , we propose the operator H, which will return an integer z = H ( x 1 , x 2 , , x n ) > 0 , where z represents the largest possible integer value that matches the set of real numbers ( x 1 , x 2 , , x n ) in which there exist at least z elements with values not lower than z. Then, the H-index of node i is defined as:
H i = H ( k j 1 , k j 2 , , k j k i )
The H-index measures the importance of nodes from the overall quality of the neighbor node set. Compared with node degree, the H-index reinforces the importance of nodes with a large number of high neighbors and reduces the importance of other nodes, a feature that helps us better identify key nodes in real networks.
Definition 2.
Closeness centrality (abbreviated as COC).
Assuming that d i j denotes the number of edges contained in the shortest path from node i to node j, the closeness centrality of node i denotes the reciprocal of the sum of its distances from all other nodes in the network. The expression of closeness centrality is defined as:
COC i = N j = 1 N d i j
Closeness centrality expresses the distance between the node and the network center based on the standard of path centrality.The value of node closeness centrality represents the distance of the node from other nodes in the network. The closer the node is to the center of the network topology, the greater the importance.
Definition 3.
K-shell (abbreviated as KS).
The k-shell decomposition method divides the network into substructures directly related to degree centrality [28]. In this approach, the network is described as a hierarchical structure, revealing the complete hierarchy of its nodes. In Figure 1, the innermost nodes belong to a structure called the core, while the rest of the nodes are placed in more external layers (called k-shells).
The hierarchical steps of the network structure layer are as follows: first, all nodes with node degree k = 1 are recursively removed from the network and assigned an integer value of K S = 1 . This process is then repeated until only nodes with node degree k > 1 are left on the network. Subsequently, we remove all nodes with node degree k = 2 and assign them integer values K S = 2 . This process is repeated until only nodes with node degree k 3 are left on the network, and so on until the network is deleted, at which point all nodes of the network are assigned one of the k shells.
The k-shell decomposition method layers the network structure from the perspective of topology location and describes the core degree of different nodes in the network. The greater the value of KS in the node belt, the closer it is to the core level of the network, and vice versa.
Definition 4.
Network constraint coefficient (abbreviated as NCC).
The network constraint coefficient is derived from the structural hole theory proposed by Burt [29], which is described as the tightness distance of a node connected directly or indirectly to other nodes. The value of the network constraint coefficient is negatively related to the extent of the structural hole. However, this concept only considers the nearest neighbors of a given node; therefore, it cannot find some important bridging nodes in complex networks.
N C C i = j N C C i j = j p i j + q p i q p q j 2 , i q j
p i j = Z i j q z i q
where p i j is the proportion of i’s resources devoted to j, and the variable z i q represents the strength of the contact between i and j, with p i j being the direct contact and q p i q p q j being the indirect contact. Thus, the constraint N C C i j for a linked node varies in the interval [0, 1] to the extent to which resources of i are used directly or indirectly for j.
The network constraint coefficient represents the information advantage and control advantage of nodes in the network structure. The lower the network constraint coefficient, the more structural holes are occupied by nodes, so it plays a more important role in the network structure.

3. Multi-Attribute Composite Measure of Node Importance

The node importance indicator based on multi-attribute decision making is fitted from four single indicators: H-index, closeness centrality, k-shell indicator, and network constraint coefficient. The combined node score can be expressed as:
Score i = m w i · Indicator i
We can find that the weight of a single indicator affects the degree of its influence on the composite score, and whether the indicator weights can be reasonably determined will directly affect the performance of the node composite score. To solve the multi-criteria decision problem, Diakoulaki [27] developed the CRITIC method, which derives objective weights for relevant indicators by quantifying the amount of information inherent in each evaluation criterion in order to rank targets without bias. The CRITIC method operates in the following process.
For a set A of n chosen targets to be evaluated and a given system S j of m evaluation criteria, the general form of the multi-criteria problem can be defined as follows:
Max S 1 ( a ) , S 2 ( a ) , S 3 ( a ) , , S m ( a ) a A
Define the membership function x i by mapping the values of criterion S j to the interval [ 0 , 1 ] . This transformation comes from the concept of an ideal point. We define x a j as the degree to which alternative a is close to the ideal value S j i d e a l . S j i d e a l represents the best performance of criterion S j . x a j also represents the extent to which the alternative a is far from the negative ideal S j a n t i i d e a l . S j a n t i i d e a l represents the worst performance of the criterion S j .
x a j = S j ( a ) S j a n t i i d e a l S j i d e a l S j a n t i i d e a l
We can observe that when the evaluation system is a negative indicator, i.e., the indicator score is negatively correlated with the target performance, x a j can still have practical significance. Using this method, the initial evaluation matrix can be transformed into a relative score matrix with generic elements x i j . Each assessment criterion corresponds to a score vector x j , which represents the scores of all elements to be assessed.
x j = x j ( 1 ) , x j ( 2 ) , , x j ( n )
σ j = i = 1 n x j ( i ) x ¯ j 2 n
Here, the standard deviation σ j quantifies the contrast intensity of the vector x j , reflecting the variation of scores within the evaluation indicator.
Next, combining the vector x i j , we can construct the dimension m m score matrix. Define per as the Pearson coefficient of x j and x k . The value of per is lower if the scores of criterion j and criterion k are more inconsistent. Conflict j represents a measure of the conflicting differences between criterion j and other criteria.
Conflict j = k = 1 m 1 per j k
Considering the two decision criteria of information contrast and inter-indicator conflict contained in the set of indicators, the amount of information C j emitted by the jth criterion can be obtained by multiplicative aggregation:
C j = σ j · Conflict j
The higher the C j value, the greater the amount of information of the corresponding evaluation criteria, the greater the relative importance in the decision-making process, and the weight of the corresponding index can be obtained by standardizing the C j value.
w j = C j k = 1 m C k
Combining the indicator weights, we can define the multi-attribute CRITIC network decision indicator (MCNDI) as follows:
M C N D I i = w 1 · H i + w 2 · C O C i + w 3 · K S i + w 4 · N C C i

4. Experimental Results and Analysis

The topological forms in real networks mostly conform to the characteristic distribution of scale-free networks. In this paper, the research process will select the real network data set without weight and direction for verification, and the importance measurement of relevant nodes will also be carried out in this kind of network. In this study, to measure the combined importance of each node, experiments were conducted using data from the Chesapeake Bay network [30] and the contiguous USA network [31], and the results were compared with those measured by the single indicator. Then, we conducted simulated attacks on the USAir97 and technology routers networks to study the change of network connectivity and analyze the simulation results [32].

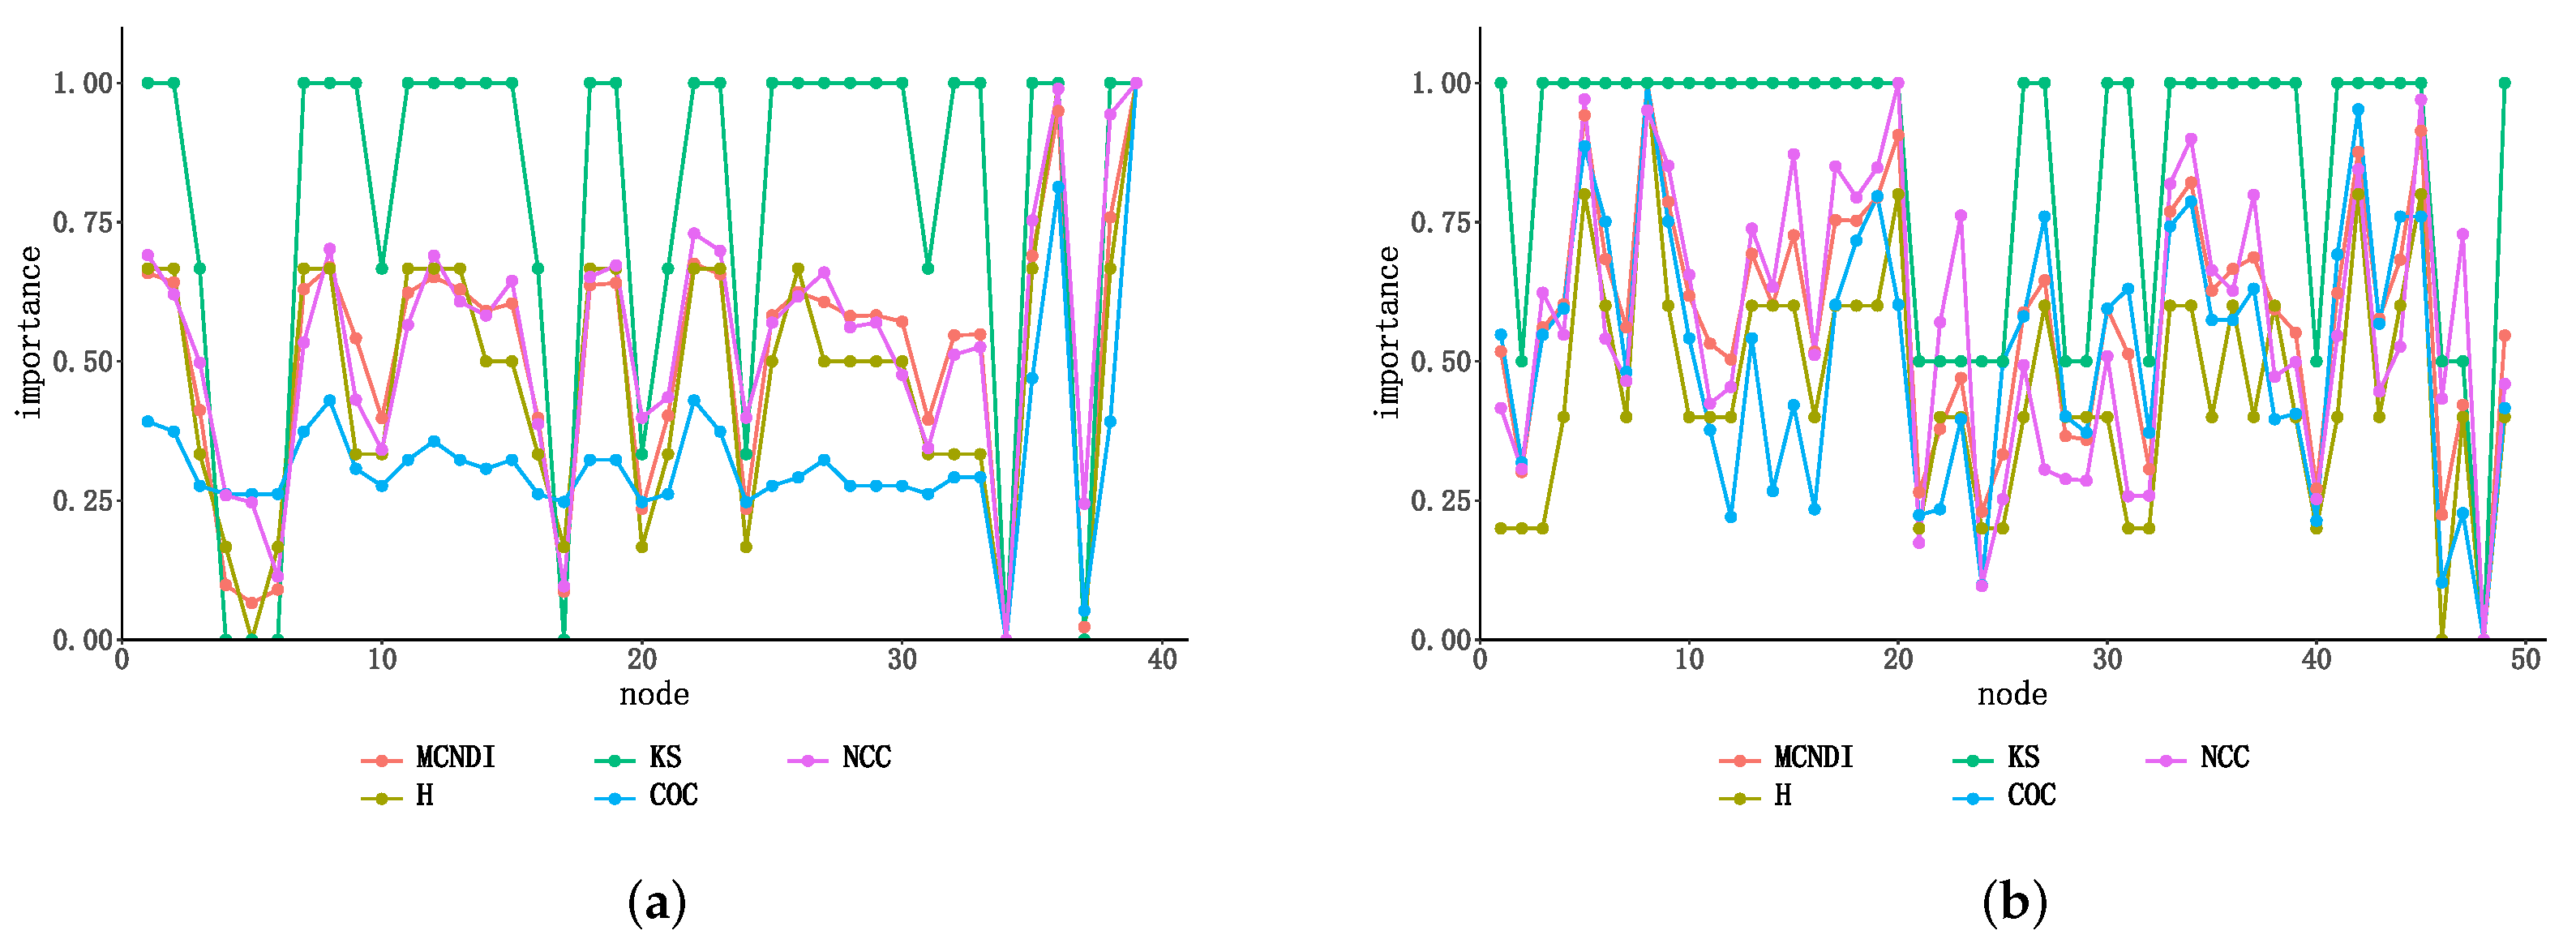
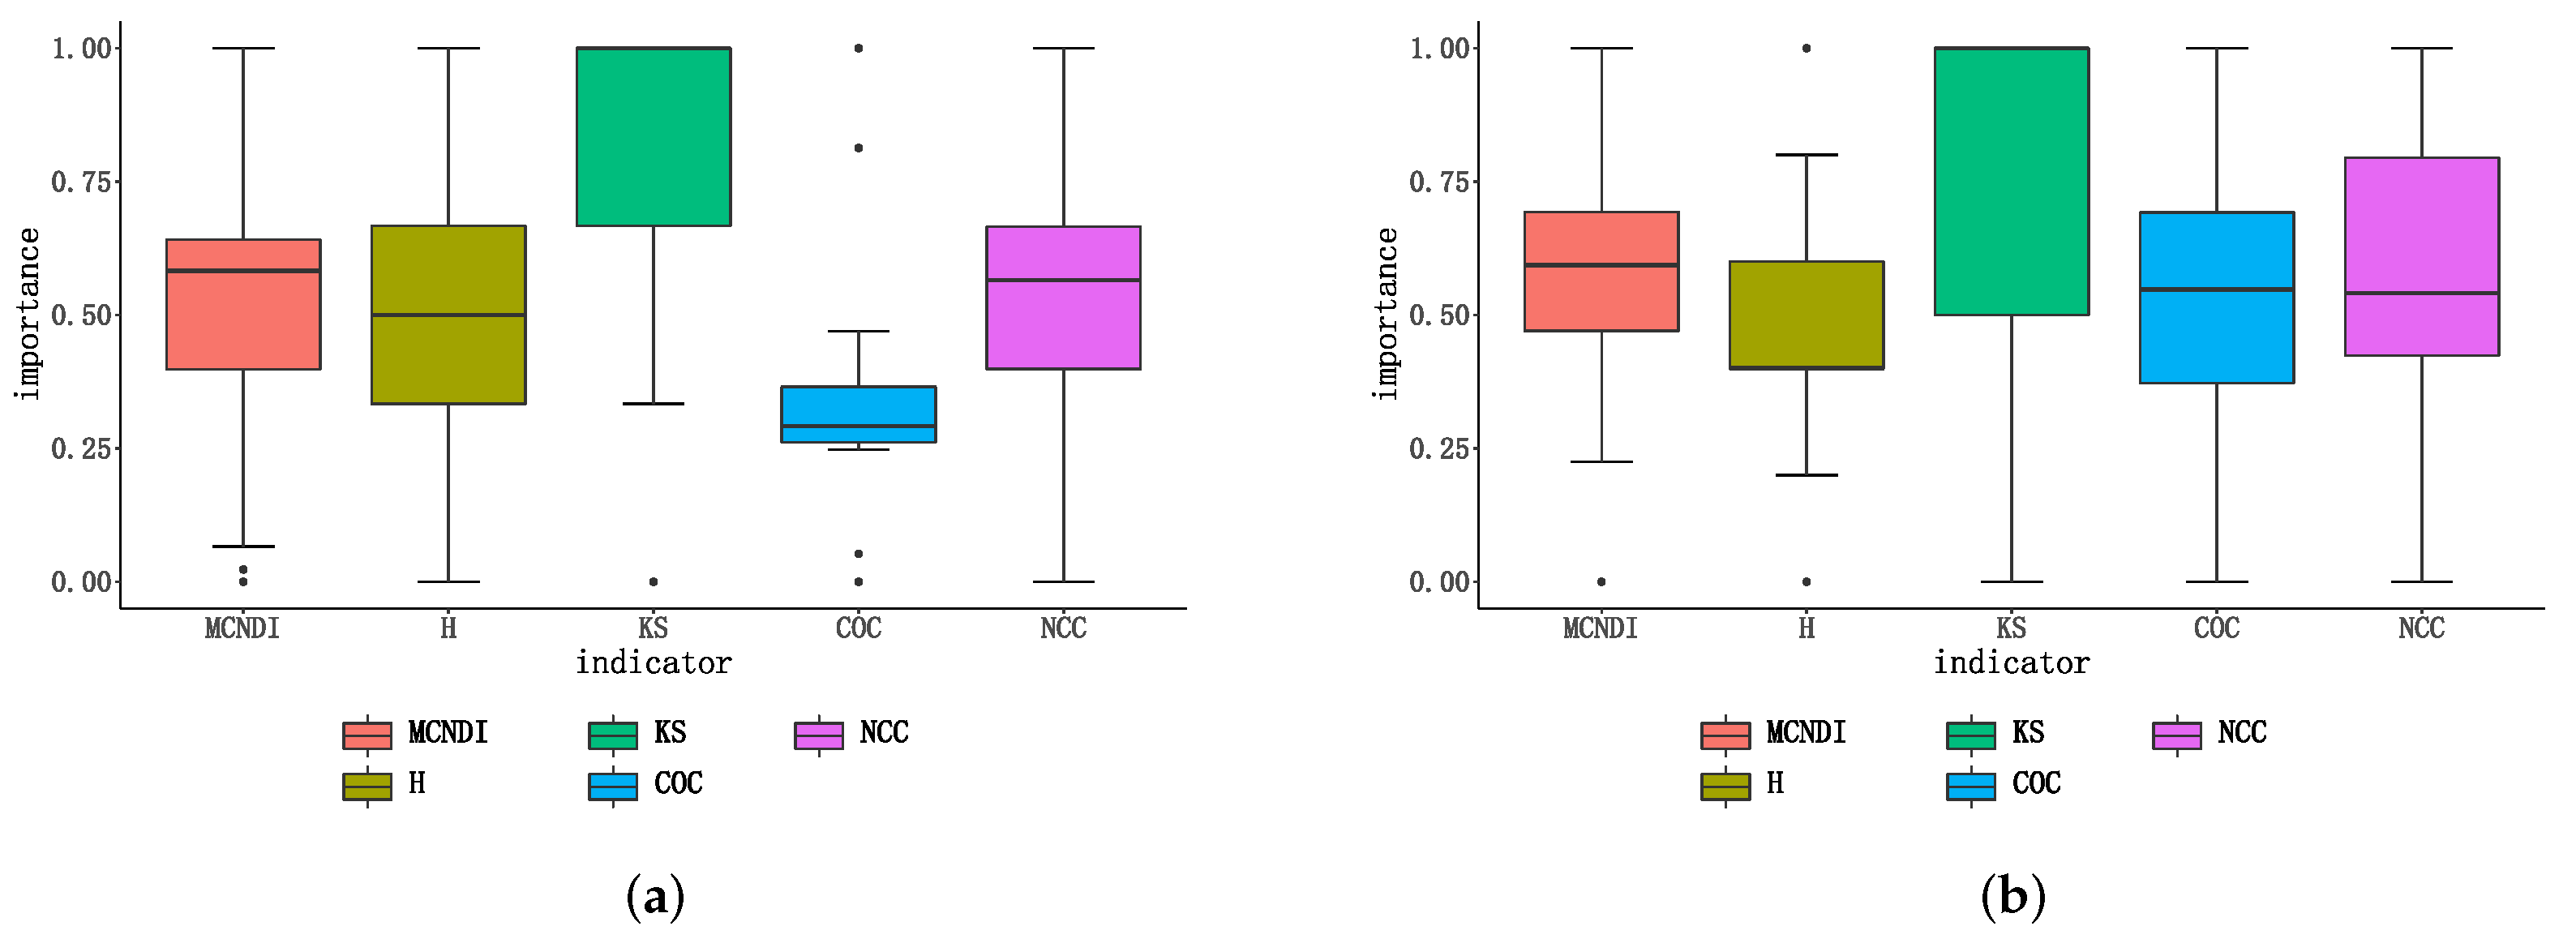
4.1. Network Metrics Experiment

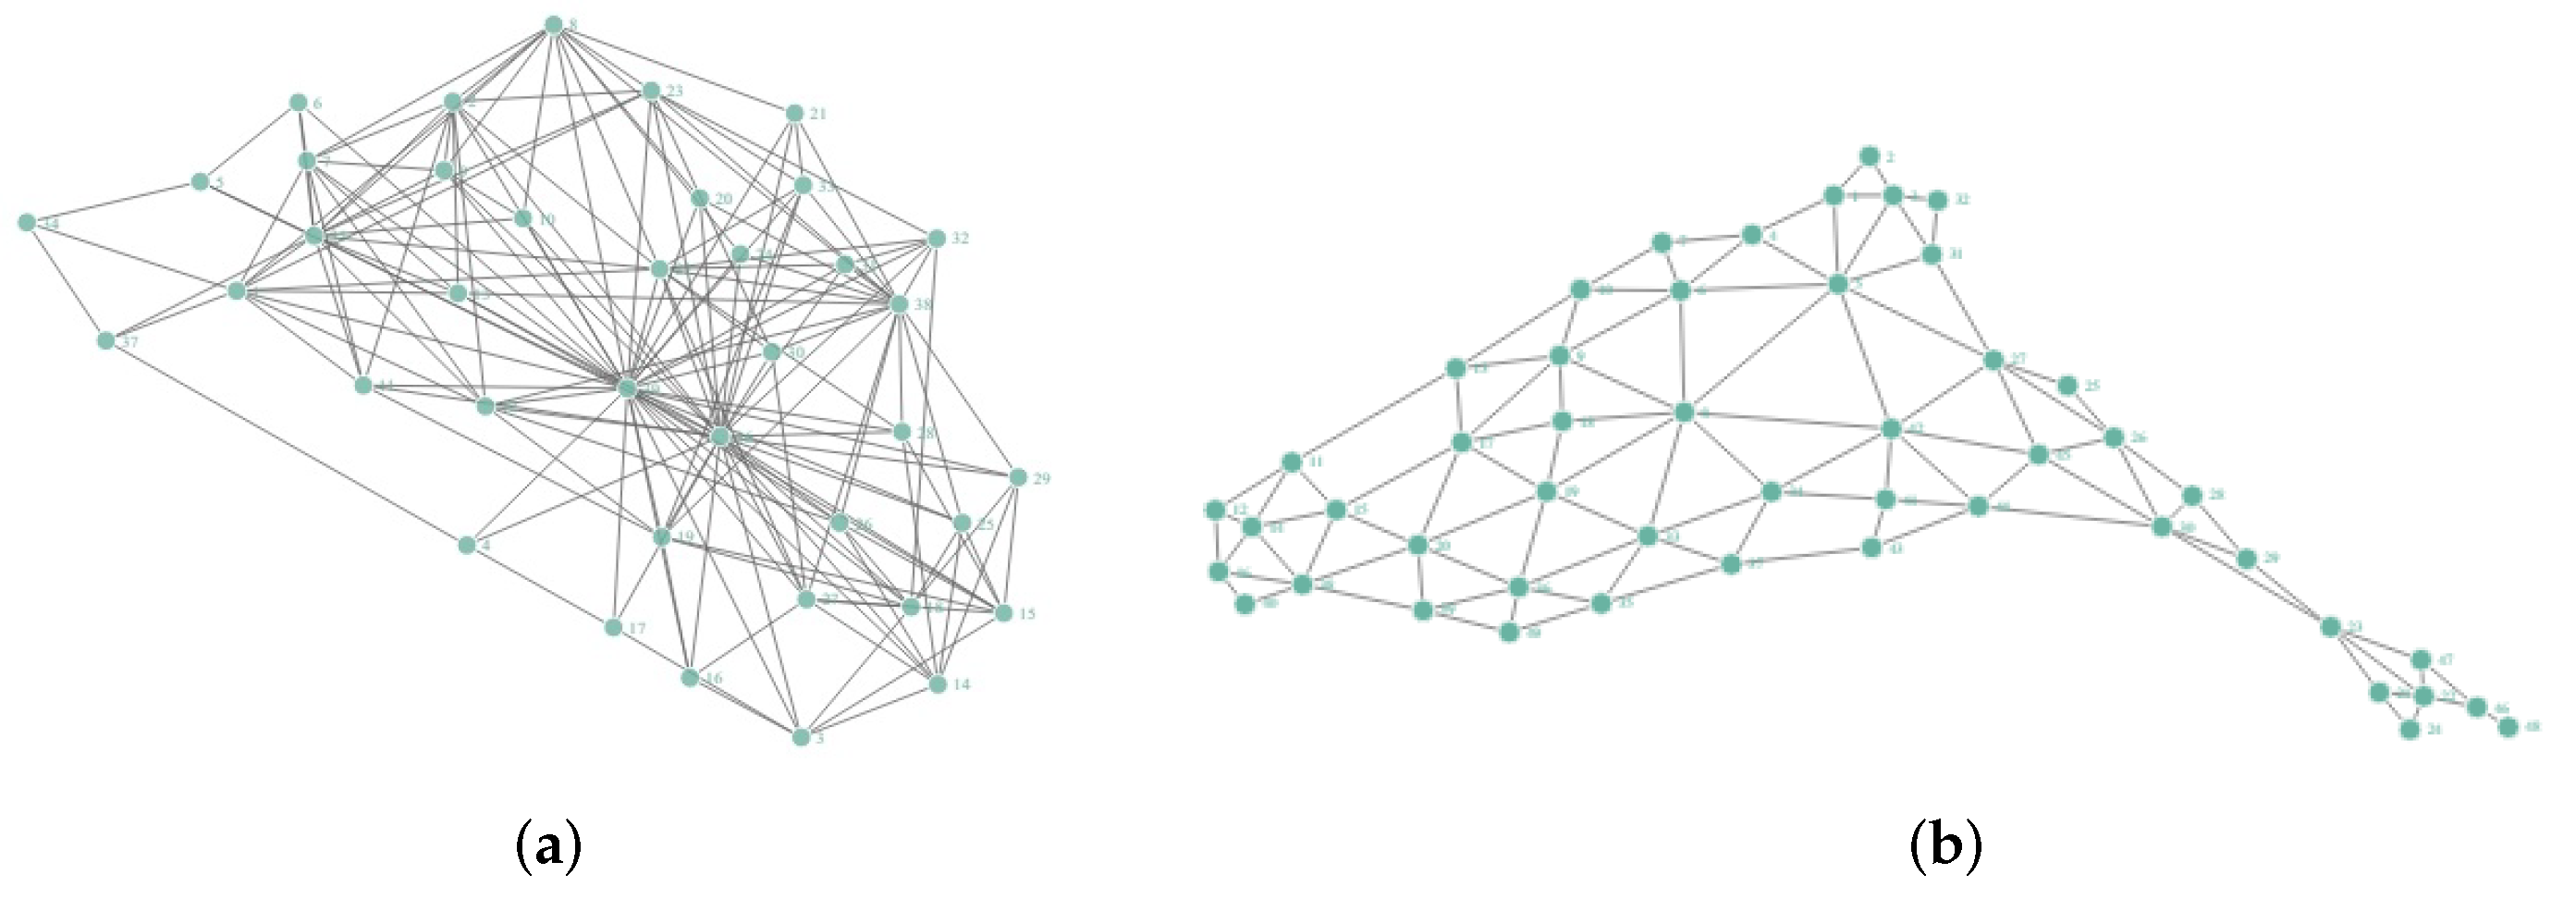
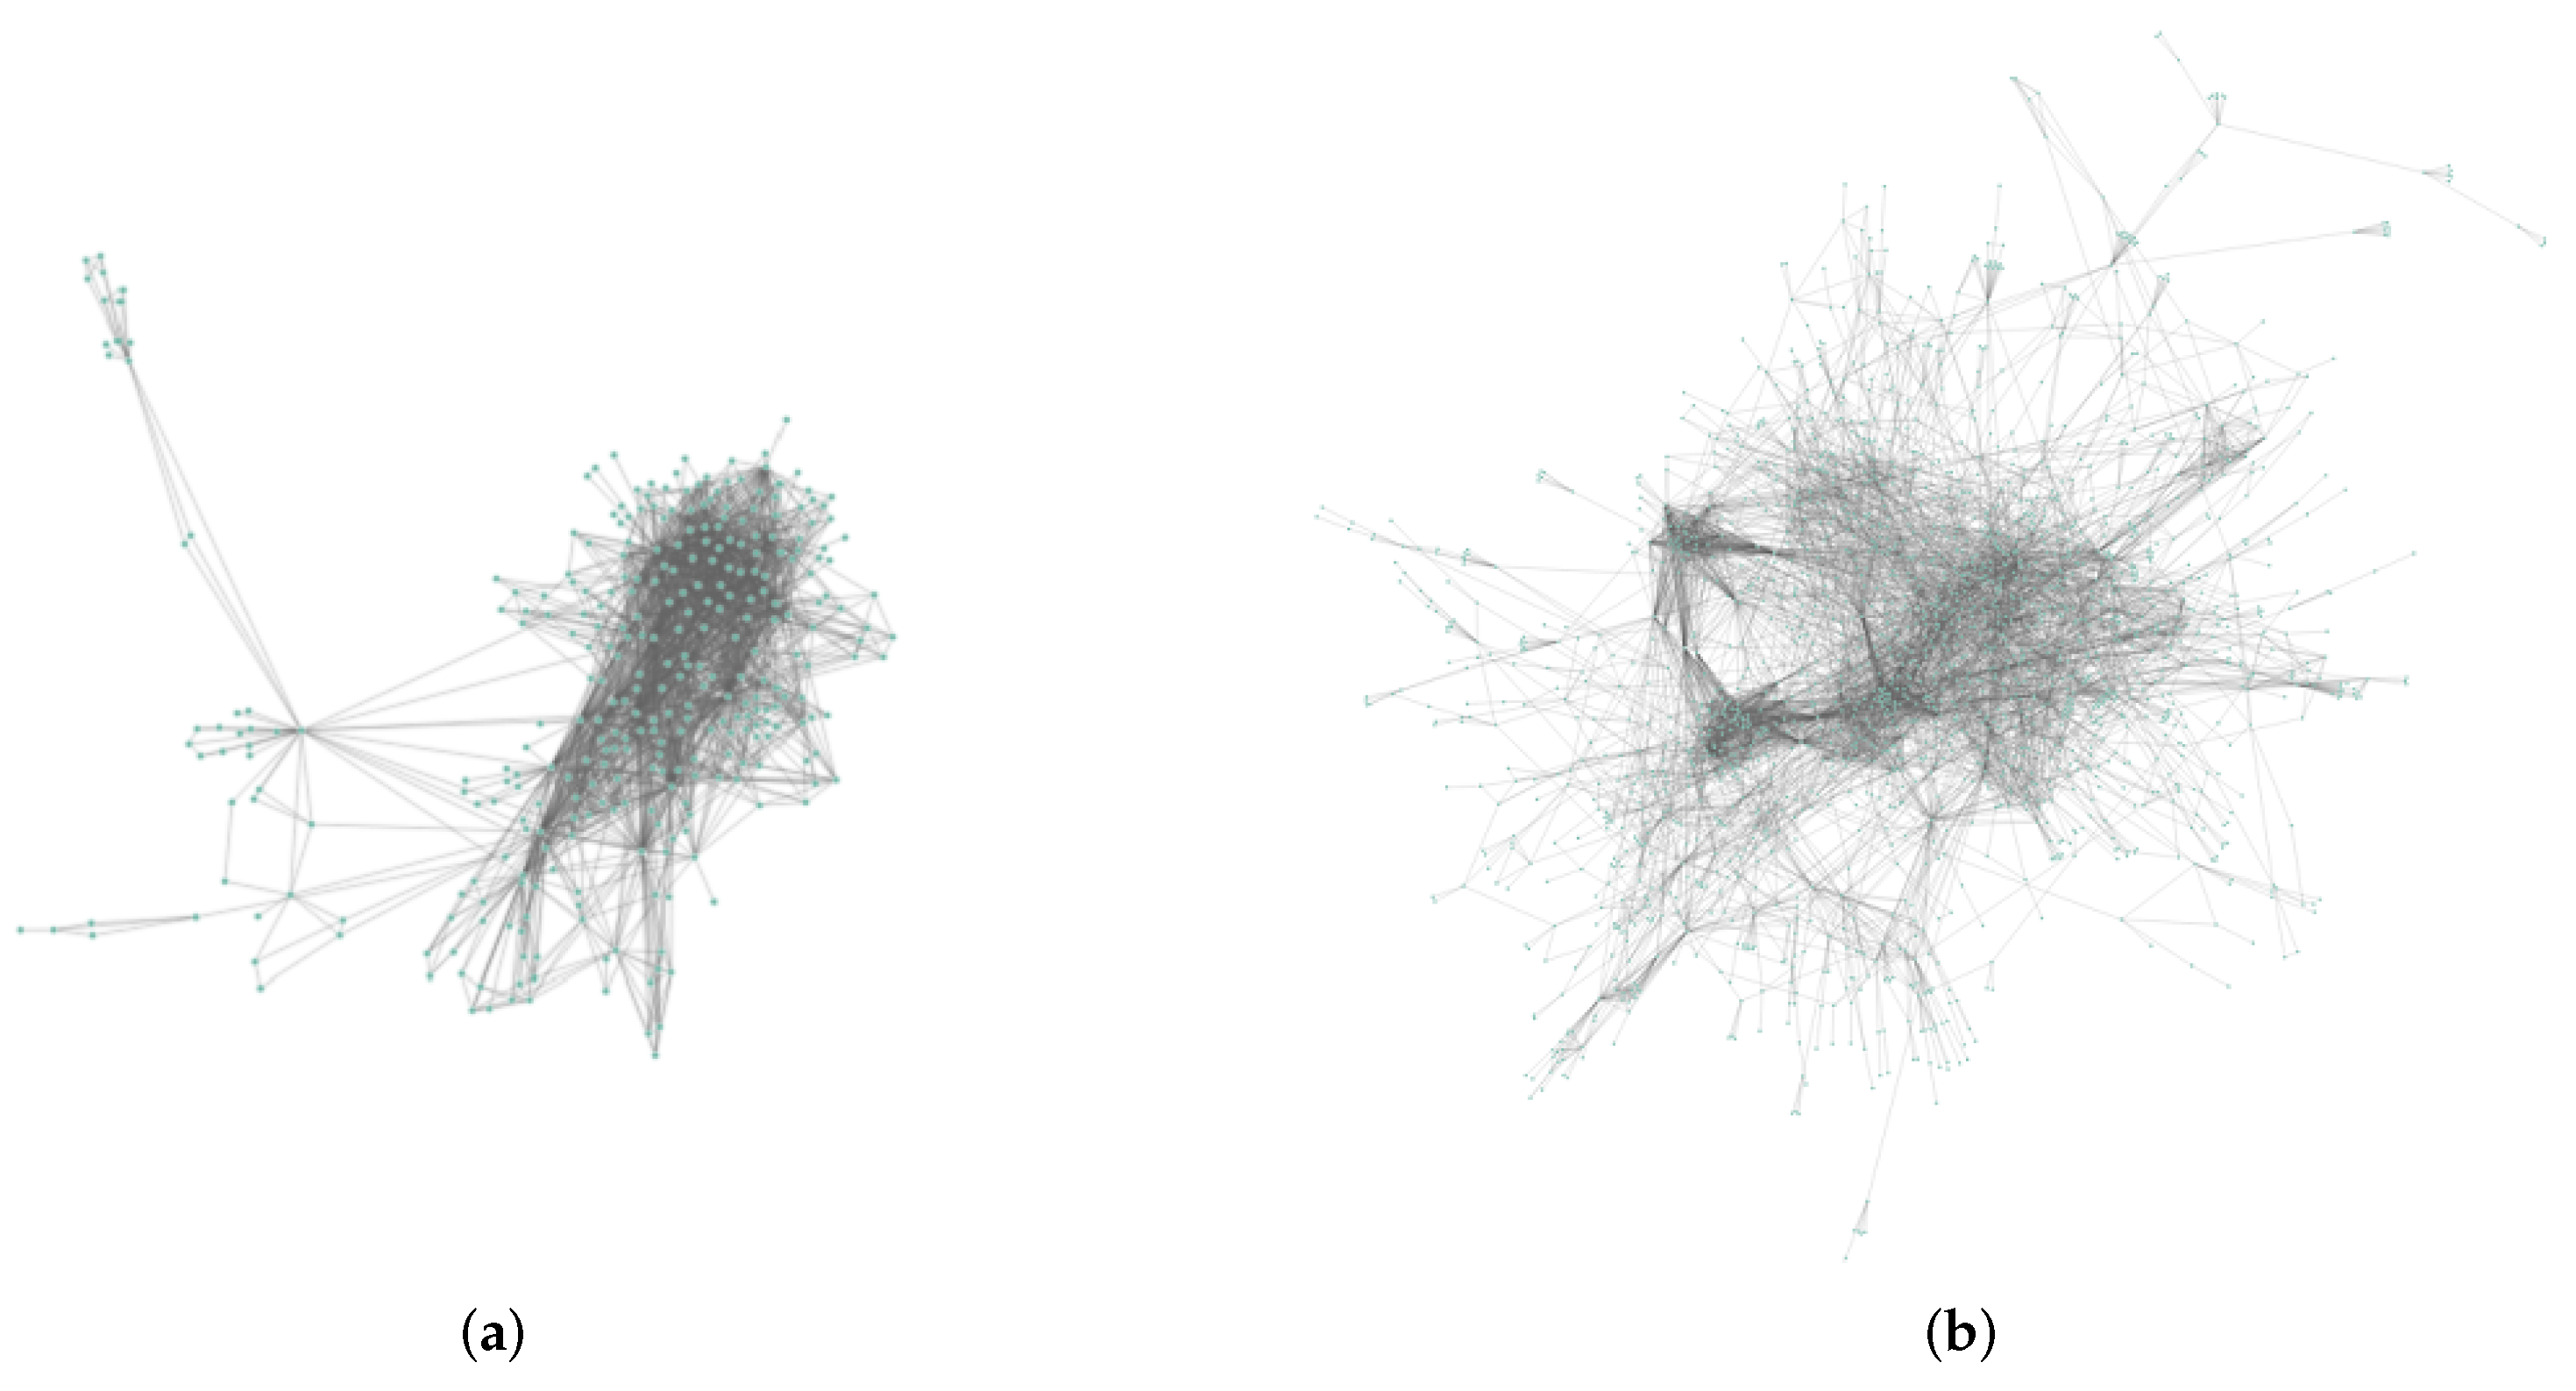
4.1.1. Chesapeake Bay Network Experiment

The Chesapeake Bay network is a mesohaline trophic network that can be used for the simulation and analysis of complex network experiments. The network topology is shown in Figure 2a, and it consists of 39 nodes and 170 edges. Nodes are groups of organisms such as phytoplankton or ciliates; the edges between the nodes denote carbon exchange relationships. Here, we use four single indicators and MCNDI to calculate each node in this network to obtain the node importance. According to the above equations, the weight distribution of the H-index, closeness centrality, k-shell indicator, and network constraint coefficient under the CRITIC method is obtained as:
[ H , C O C , K S , N C C ] = [ 0.16775 , 0.21757 , 0.45850 , 0.15618 ]
According to Equation (13), we can obtain the 39 nodes’ importance composite scores’ MCNDI.

4.1.2. Contiguous USA Network Experiment

The contiguous USA network is a geographic boundary network that characterizes the 48 contiguous states of the United States of America (USA) and the District of Columbia, which includes all states except Alaska and Hawaii. The network topology is shown in Figure 2b. The network consists of 49 nodes and 107 edges; each node represents a state-level district; links indicate shared borders between states. Similarly, by the above equations, we also used four single indicators and MCNDI to calculate each node in this network to obtain the node importance. The weight distribution of the H-index, closeness centrality, k-shell indicator, and network constraint coefficient under the improved CRITIC method was obtained as:
[ H , C O C , K S , N C C ] = [ 0.19720 , 0.23651 , 0.30260 , 0.26369 ]
According to Equation (13), we can obtain the 49 nodes’ importance composite scores’ MCNDI. We simulated the node importance of the Chesapeake Bay network and the contiguous USA network using the integrated indicator and compared the results with those obtained using a single indicator to measure node importance, the results of which are shown in Figure 3. In Figure 3, the abscissa represents the sequence number distribution of nodes, and the ordinate represents the normalized value of the importance score of nodes under the current evaluation indicator. We show the distribution of node importance ranking normalized by box plots in Figure 4.
The experimental results show that the distribution curves obtained from the integrated indicator are less volatile and smoother due to the topological characteristics of the nodes; from the distribution of node importance, the importance distribution of the composite index has a more concentrated range and a more uniform distribution, and has a more stable metric performance, reflecting the consideration of multiple attributes.

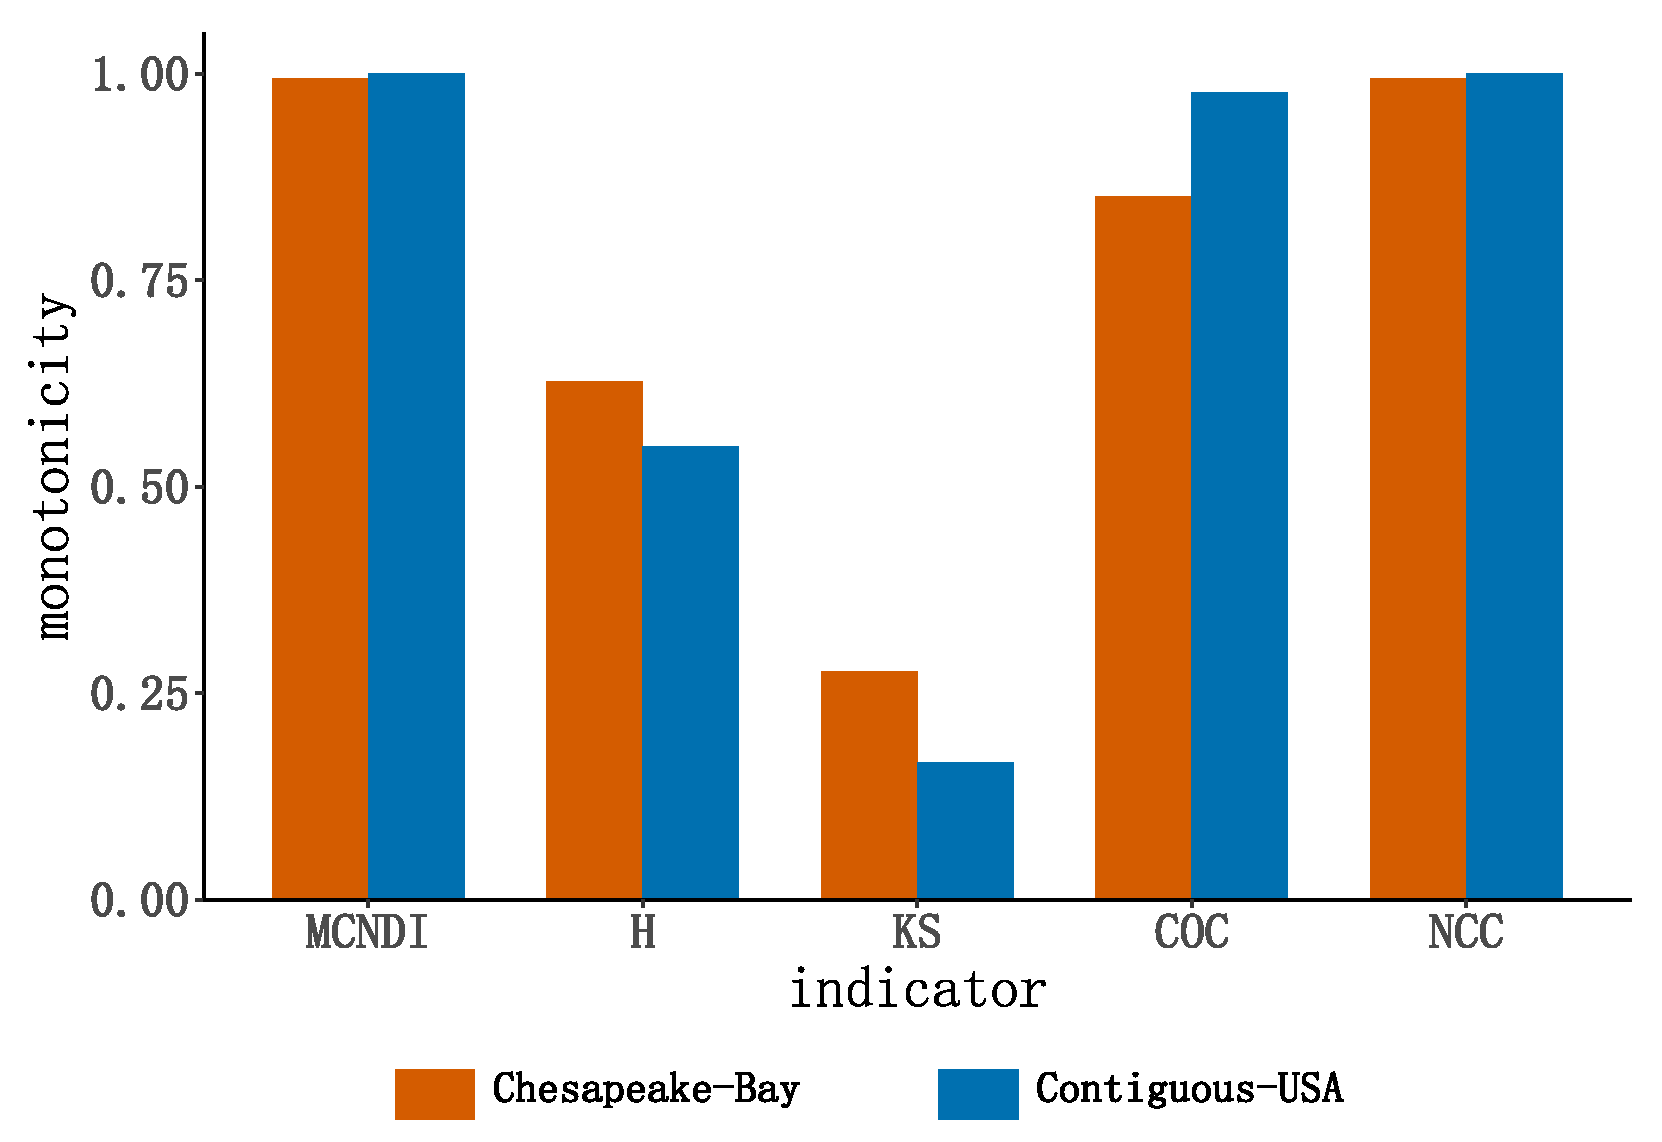
4.1.3. Node Ranking Monotonicity Analysis

For the importance ranking indicator of nodes, the finer the granularity of the indicator, the easier it is to distinguish the variability among nodes. Bae [33] defined the ranking monotonicity indicator Monotonicity ( i ) as follows:
Monotonicity p ( i ) = 1 i ϵ I N i N i 1 N p N p 1 2
In Equation (16), N i represents the number of nodes with the same indicator evaluation score; N p represents the number of candidate nodes selected from the network with a ratio of p for ranking; and Monotonicity ( i ) fluctuates in the range [ 0 , 1 ] , which represents the proportion of nodes with the same index value to the set of candidate points. The higher the monotonicity of the node importance index in the network, the more accurate the identification of the importance of different nodes; conversely, the lower the monotonicity of the node ranking, the poorer the granularity of the metric for identifying different nodes. We chose p = 1, i.e., the monotonicity was calculated separately for the whole network of the Chesapeake Bay network and the contiguous USA network. The results of the monotonicity calculation are shown in Figure 5. According to the simulation results, it can be found that the monotonicity of the node importance ranking of MCNDI is closer to 1 in both networks, so in comparison with the single indicator, the integrated indicator MCNDI has better monotonicity, which tends to improve the accuracy of the node importance ranking. It should be noted here that the monotonicity may not necessarily remain 1 for the multi-attribute composite indicator because there may be structurally symmetric nodes in the real network.

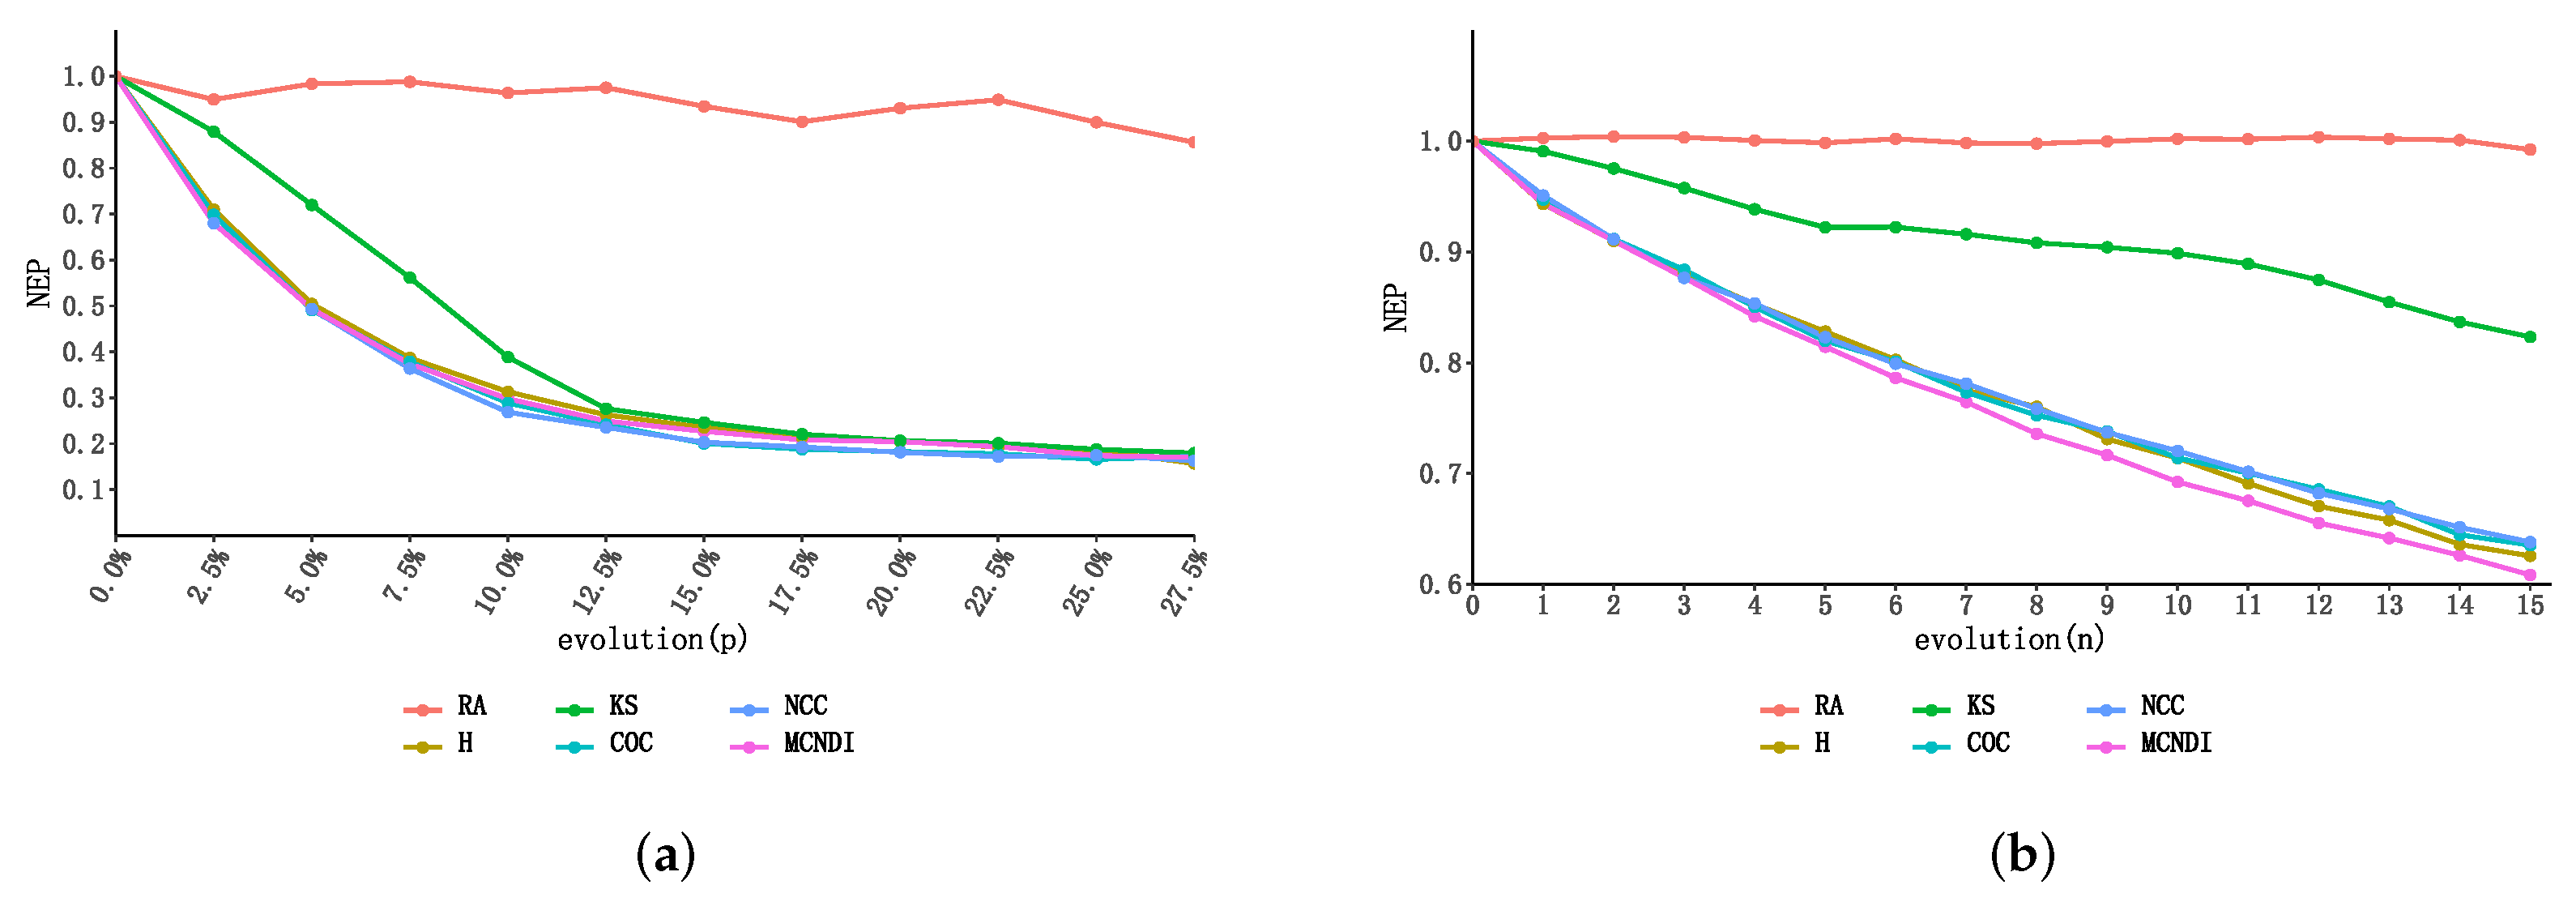
4.2. Network Attack Simulation Experiment

4.2.1. Attack Simulation to the USAir97 Network

The USAir97 network is an infrastructure network; as a representative case of a real complex network, the network contains 332 nodes with 2126 edges, the number of k-shell indicators between nodes is 27 layers, and the relationship between nodes is very complex; its network topology is shown in Figure 6a. According to the above equations, we can obtain the weight distribution of the H-index, closeness centrality, k-shell indicator, and network constraint coefficients as:
[ H , C O C , K S , N C C ] = [ 0.27924 , 0.14960 , 0.27592 , 0.29524 ]
Then, we will obtain the importance composite score MCNDI for 332 nodes.
Usually, when a network is attacked, the change in network efficiency can be used to measure the degree of damage to the network.
N E = 1 N ( N 1 ) i j G 1 d i j
In Equation (18), G represents the set of nodes in the network, N represents the number of nodes in the network, and d i j represents the length of the shortest path between the node i and the node j. Here, we evaluate the accuracy of the node importance ranking algorithm by means of the network efficiency ratio.
N E P = n e N E
In Equation (19), n e represents the network efficiency of G after deleting the set of nodes to be determined and N E is the initial network efficiency of the network. A smaller value of N E P means that the more important the deleted nodes are, the less secure the network is.
On the one hand, we performed random attacks on the network, and on the other hand, based on different indicators that measure the importance of nodes, we performed deliberate attacks on the network by node ranking, and the network efficiency ratio was quantified as shown in Figure 7. To weaken the impact of network size, the deliberate attacks were scaled by network nodes. In Figure 7a, the horizontal axis represents the ratio of failed nodes to the total number of nodes, and the vertical axis represents the network efficiency ratio.
Simulation results show that random attacks are less effective for real complex networks due to the scale-free nature of the real network, such that the network structure is strongly robust in the face of random attacks. In terms of deliberate attacks, the simulation results show that when simulating attacks on the USAir97 network according to the comprehensive index ranking proposed in this paper, the rate of decline in network efficiency showed the highest level of decline at the initial stage, and with the destruction of the network structure, although the rate fluctuated slightly, it eventually maintained the decline advantage in the rapid decline phase. The simulation results show that MCNDI is a metric that integrates many structural attributes of nodes and can more accurately reflect the real situation of nodes in the network.

4.2.2. Attack Simulation to the Technology Routes Network

To verify the generality of MCNDI, we performed a similar simulation for the technology routing network. The technology routing network is shown as an example of a large and complex network, showing the actual distribution architecture of a routing level network. The network contains 2113 nodes and 6632 links, and its topology is shown in Figure 6b. According to the above equation, we can obtain the weight distribution of the H-index, closeness centrality, k-shell indicator, and network constraint coefficients under the CRITIC method as:
[ H , C O C , K S , N C C ] = [ 0.15093 , 0.18123 , 0.19675 , 0.47109 ]
Then, we can obtain the 2113 nodes’ importance composite scores’ MCNDI.
The cost of simulating the attack in a large network by proportion is huge, while deleting a large number of nodes in a single stage will cause the set of network nodes to change drastically, which is not conducive to identifying the most critical set of nodes. Therefore, we calculated every five nodes after deleting them as the evolutionary phase, which again does not change the trend of the network. In Figure 7b, the horizontal axis represents the evolutionary stage (every five nodes are a basic part) and the vertical axis is the network efficiency ratio. The simulation showed that after the start of evolution, when about 2.5 percent of nodes were removed, it already caused the N E P to drop to 60%, reflecting the vulnerability of real networks with scale-free characteristics to deliberate attacks, and the network efficiency of MCNDI converged faster than other methods during this process, demonstrating the better efficacy of the method in targeting critical node rankings in large real networks.

4.2.3. Discussion

In the network experiment, the ranking of node importance in the experimental network is obtained according to the relevant node importance measurement indicators. The descending order of node importance is used for attack simulation, and the experimental results will be used as the basis to evaluate the quality of node importance metric indicator. The networks used in our experiments all have large-scale and scale-free structural properties. First, we obtained a single network property ( H , C O C , K S , and N C C ) based on the network data separately, and after that, we combined it with the CRITIC method to obtain the composite indicator MCNDI. Next, simulated attacks were performed on these networks based on the node importance (measured by five methods) from highest to lowest. Top 10 network node ranking is shown in Table 1 and Table 2. M ( i ) represents the monotonicity of the set of nodes.
In the USAir97 network, the numbers of node members with the same ranking of our method (MCNDI) and single indicators ( H , C O C , K S , N C C ) are ( 7 , 8 , 4 , 9 ) . Node 118 has the highest importance among all indicators, which means that node 118 is the most influential in the USAir97 network. Similarly, in the technology routing network, the numbers of node members with the same ranking of our method and single indicators ( H , C O C , K S , N C C ) are ( 6 , 6 , 2 , 8 ) . Combined with the monotonicity, we found that the k-shell indicator is the most different from the composite indicator, and has the worst monotonicity, which can cause difficulties in node importance decisions. I.e., the top 35 nodes in the USAir97 network have the same KS value. We also found that some of the top ten nodes of MCNDI in Table 2 do not exist in the top 10 ranking of the single indicators, which proves that their overall score is high, and such nodes with high overall importance are difficult to be measured by a single indicator. By contrast, MCNDI integrates the internal and external attributes of nodes, and the indications are accurate in decision making.
Comparing Figure 7a with Figure 7b, we found similar network changes. According to the changes of the node network efficiency ratio, the network efficiency ratios of different networks all decrease rapidly under the MCNDI indicator attack, reflecting the stability of MCNDI’s assessment of the importance of nodes in different networks, while the other indicators are affected by the network topology, and there are large fluctuations in the ability to influence the network efficiency ratio. The reason for the difference between the two figures is the different topology of the network, so the importance of the distribution of the nodes is also different, and the attack using MCNDI can cause good effects on them all, indicating that the composite indicator is a more accurate and generalized measure of network importance.

5. Conclusions

In this paper, we applied the CRITIC method to the process of node importance ranking, based on the H-index, closeness centrality, k-shell indicator, and network constraint coefficient, and a multi-attribute critic network decision indicator (MCNDI) was proposed to measure the node importance. The method takes into account not only the local neighborhood importance of the nodes but also combines the network location of the nodes with the amount of intermediate information, which makes the metric more generalizable. In the metric process, the CRITIC method is used to objectively determine the indicator weights based on the intrinsic nature of the data. Through metric measurement, we found that in the Chesapeake Bay network and contiguous USA network, the MCNDI evaluation results were less volatile and reflected the node importance more comprehensively compared to a single indicator. Then, we obtained the variation of network efficiency by simulating deliberate attack behavior in a real network based on different indicators. The simulation results show that the attack according to MCNDI was less dependent on the network topology and could maintain a stable evaluation performance, and the convergence rate of network efficiency was better than in other methods.
The work in this paper is a further refinement of the node importance metric method and helps to expand the research ideas in the field of complex networks. At the same time, we also note that in networks with multi-layer structures covering more attributes such as weight, direction, time, and traffic, the method we provide is limited by the application conditions of the method, and the sub-indicators for multi-attribute decision making need to be improved to accommodate multi-dimensional network attributes. In recent years, exploring the importance ranking metrics of network nodes with more complex attribute conditions has also become an important research direction, which provides more ideas for our multi-attribute decision making. In this paper, we studied single-layer undirected unweighted networks, and the related methods can be extended to entitled networks [34], multiplexed networks [35], and other models that fit more closely to real networks. Additionally, the heterogeneity of nodes [36] puts new demands on importance ranking. In future work, we will continue to investigate node importance, in conjunction with the multilayer distribution structure of the network and the heterogeneity of the nodes.

Author Contributions

Conceptualization, Y.Z.; methodology, Y.L.; software, Y.Z.; validation, Y.Z.; writing—original draft preparation, Y.Z.; writing—review and editing, Y.Z., G.Y. and Z.H. All authors have read and agreed to the published version of the manuscript.

Funding

This research received no external funding.

Institutional Review Board Statement

Not applicable.

Informed Consent Statement

Not applicable.

Data Availability Statement

Data available in a publicly accessible repository that does not issue DOIs Publicly available datasets were analyzed in this study. This data can be found here: http://konect.cc/networks/dimacs10-chesapeake/, accessed on 21 December 2021; http://konect.cc/networks/contiguous-usa/, accessed on 21 December 2021; https://networkrepository.com/inf-USAir97.php, accessed on 21 December 2021; https://networkrepository.com/tech-routers-rf.php, accessed on 21 December 2021.

Conflicts of Interest

The authors declare no conflict of interest.

References

  1. Newman, M.E. The structure and function of complex networks. SIAM Rev. 2003, 45, 167–256. [Google Scholar] [CrossRef] [Green Version]
  2. Barabási, A.L.; Albert, R. Emergence of Scaling in Random Networks. Science 1999, 286, 509–512. [Google Scholar] [CrossRef] [PubMed] [Green Version]
  3. Li, A.; Hu, Q.; Liu, J.; Pan, Y. Resistance and Security Index of Networks: Structural Information Perspective of Network Security. Sci. Rep. 2016, 6, 26810. [Google Scholar] [CrossRef] [Green Version]
  4. Garcia, J.O.; Ashourvan, A.; Muldoon, S.; Vettel, J.M.; Bassett, D.S. Applications of community detection techniques to brain graphs: Algorithmic considerations and implications for neural function. Proc. IEEE 2018, 106, 846–867. [Google Scholar] [CrossRef]
  5. Khosrosereshki, F.; Moaveni, B. Traffic modeling and validation for intersecting metro lines by considering the effect of transfer stations. IEEE Access 2022, 10, 1946–1955. [Google Scholar] [CrossRef]
  6. Kiedanski, D.; Rodríguez-Bocca, P. Instability of clustering metrics in overlapping community detection algorithms. In Proceedings of the 2021 XLVII Latin American Computing Conference (CLEI), Cartago, Costa Rica, 25–29 October 2021; pp. 1–11. [Google Scholar]
  7. Yin, T.; Zha, L.; Liu, J.; Wang, Y.; Yang, M.; Suo, W. Adaptive event-triggered controller design for cyber-physical systems with complex cyber-attacks. In Proceedings of the 2019 Chinese Automation Congress (CAC), Hangzhou, China, 22–24 November 2019; pp. 4202–4207. [Google Scholar]
  8. Tu, J.J.; Ou-Yang, L.; Hu, X.; Zhang, X.F. Inferring gene network rewiring by combining gene expression and gene mutation data. IEEE/ACM Trans. Comput. Biol. Bioinform. 2019, 16, 1042–1048. [Google Scholar] [CrossRef]
  9. Shao, J.; Yang, W.; Jiang, H. Evaluation of airline alliance route network efficiency based on complex network. In Proceedings of the2019 4th International Conference on Electromechanical Control Technology and Transportation (ICECTT), Guilin, China, 26–28 April 2019; pp. 307–311. [Google Scholar]
  10. Xie, T.; Wu, C.; Zheng, K. A forwarding prediction model of social network based on heterogeneous network. In Proceedings of the 2021 IEEE 5th Advanced Information Technology, Electronic and Automation Control Conference (IAEAC), Chongqing, China, 12–14 March 2021; Volume 5, pp. 960–964. [Google Scholar]
  11. Jia, H.; Han, Y.; Wu, X.; Zhu, S. Node importance evaluation algorithm for complex network based on time series and topsis. In Proceedings of the 2020 39th Chinese Control Conference (CCC), Shenyang, China, 27–29 July 2020; pp. 786–790. [Google Scholar]
  12. Tan, Y.J.; Jun, W.U.; Deng, H.Z. Evaluation method for node importance based on node contraction in complex networks. Syst. Eng.-Theory Pract. 2006, 11, 79–83. [Google Scholar]
  13. Peng, W.; Wang, H.; Yu, L. Determination of the hub nodes in the emergencies’ information dissemination supernetwork. Manag. Rev. 2013, 25, 104–111. [Google Scholar] [CrossRef]
  14. Goh, K.-I.; Oh, E.; Kahng, B.; Kim, D. Betweenness centrality correlation in social networks. Phys. Rev. E Stat. Nonlinear Soft Matter Phys. 2003, 67, 017101. [Google Scholar] [CrossRef] [Green Version]
  15. Chalancon, G.; Kai, K.; Babu, M.M. Clustering Coefficient; Springer: New York, NY, USA, 2013. [Google Scholar]
  16. Lü, L.; Zhou, T.; Zhang, Q.M.; Stanley, H.E. The H-index of a network node and its relation to degree and coreness. Nat. Commun. 2016, 7, 10168. [Google Scholar] [CrossRef] [Green Version]
  17. Kitsak, M.; Gallos, L.K.; Havlin, S.; Liljeros, F.; Muchnik, L.; Stanley, H.E.; Makse, H.A. Identification of influential spreaders in complex networks. Nat. Phys. 2010, 6, 888–893. [Google Scholar] [CrossRef] [Green Version]
  18. Li, Y.; Bandar, Z.A.; Mclean, D. An approach for measuring semantic similarity between words using multiple information sources. IEEE Trans. Knowl. Data Eng. 2003, 15, 871–882. [Google Scholar]
  19. Motter, A.E.; Lai, Y.C. Cascade-based attacks on complex networks. Phys. Rev. E 2002, 66, 065102. [Google Scholar] [CrossRef] [PubMed] [Green Version]
  20. Wang, Y.; Cai, W.; Duan, Q.; Li, H. On survivable network topology optimization under the restraint of tenacity. J. Northwest. Polytech. Univ. 2009, 27, 443–448. [Google Scholar]
  21. Chen, B.; Wang, Z.; Luo, C. Integrated evaluation approach for node importance of complex networks based on relative entropy. J. Syst. Eng. Electron. 2016, 27, 1219–1226. [Google Scholar] [CrossRef]
  22. Zhang, X.J.; Wang, X.F. Evaluation Formula for Communication Network Node Impor tance. J. Northeast. Univ. 2014, 35, 663–666. [Google Scholar]
  23. Jiang, Z.P.; Zhang, D.L.; Jing, M.A.; Xu-Guang, W.U. Research on Evaluation Method for Node Importance Based on Weight-evolving Network Model. J. Air Force Eng. Univ. 2015, 16, 19–23. [Google Scholar]
  24. Hui, Y.; Liu, Z.; Li, Y. Using Local Improved Structural Holes Method to Identify Key Nodes in Complex Networks. In Proceedings of the 2013 Fifth International Conference on Measuring Technology and Mechatronics Automation, Hong Kong, China, 16–17 January 2013. [Google Scholar]
  25. Yu, H.; Liu, Z.; Li, Y.J. Key nodes in complex networks identified by multi-attribute decision-making method. Wuli Xuebao/Acta Phys. Sin. 2013, 62, 1–9. [Google Scholar] [CrossRef]
  26. Wang, S.; Zhao, J. Multi-attribute integrated measurement of node importance in complex networks. Chaos 2015, 25, 113105. [Google Scholar] [CrossRef]
  27. Diakoulaki, D.; Mavrotas, G.; Papayannakis, L. Determining objective weights in multiple criteria problems: The critic method. Comput. Oper. Res. 1995, 22, 763–770. [Google Scholar] [CrossRef]
  28. Batagelj, V.; Zaveršnik, M. Fast algorithms for determining (generalized) core groups in social networks. Adv. Data Anal. Classif. 2011, 5, 129–145. [Google Scholar] [CrossRef]
  29. Burt, R.S. Structural holes and good ideas. Am. J. Sociol. 2004, 110, 349–399. [Google Scholar] [CrossRef]
  30. Baird, D.; Ulanowicz, R.E. The Seasonal Dynamics of the Chesapeake Bay Ecosystem. Ecol. Monogr. 1989, 59, 329–364. [Google Scholar] [CrossRef]
  31. Knuth, D.E. The Art of Computer Programming, Volume 4, Fascicle 0: Introduction to Combinatorial and Boolean Functions; Addison-Wesley: Boston, MA, USA, 2008. [Google Scholar]
  32. Rossi, R.A.; Ahmed, N.K. The Network Data Repository with Interactive Graph Analytics and Visualization. In Proceedings of the Twenty-Ninth AAAI Conference on Artificial Intelligence, Austin, TX, USA, 25–30 January 2015. [Google Scholar]
  33. Bae, J.; Kim, S. Identifying and ranking influential spreaders in complex networks by neighborhood coreness. Phys. A Stat. Mech. Appl. 2014, 395, 549–559. [Google Scholar] [CrossRef]
  34. Jiang, W.; Wang, Y. Node similarity measure in directed weighted complex network based on node nearest neighbor local network relative weighted entropy. IEEE Access 2020, 8, 32432–32441. [Google Scholar] [CrossRef]
  35. Aleta, A.; Moreno, Y. Multilayer Networks in a Nutshell. Annu. Rev. Condens. Matter Phys. 2019, 10, 45–62. [Google Scholar] [CrossRef] [Green Version]
  36. Lee, C.H.; Eun, D.Y. Exploiting Heterogeneity for Improving Forwarding Performance in Mobile Opportunistic Networks: An Analytic Approach. IEEE Trans. Mob. Comput. 2016, 15, 150–162. [Google Scholar] [CrossRef]
Figure 1. Diagram of k-shell decomposition process.
Applsci 12 01944 g001
Figure 2. This figure shows the topological distribution of the real network in our network experiment. (a) Network topology of the Chesapeake Bay network. (b) Network topology of the contiguous USA network.
Applsci 12 01944 g002
Figure 3. Simulation comparison chart of the importance of different indicators on network nodes. (a) Ranking of the importance of network nodes in the simulated Chesapeake Bay network. (b) Ranking of the importance of network nodes in the simulated contiguous USA network.
Applsci 12 01944 g003
Figure 4. Simulated distribution of different metrics on the importance ranking of network nodes. (a) Importance distribution of network nodes in the simulation of the Chesapeake Bay network. (b) Importance distribution of network nodes in the simulation of the contiguous USA network.
Applsci 12 01944 g004
Figure 5. Monotonicity performance of different metrics on simulated networks.
Applsci 12 01944 g005
Figure 6. This figure shows the topological distribution of the real network in our network experiment. (a) Network topology of USAir97 network. (b) Network topology of technology routes network.
Applsci 12 01944 g006
Figure 7. This figure shows the topological distribution of the real network in our network experiment. (a) Simulation comparison chart of the USAir97 network subjected to deliberate attacks with different indicators, where the horizontal axis represents the ratio of failed nodes to the total number of nodes, and the vertical axis is the network efficiency ratio. (b) Simulation comparison chart of the technology routes networks subjected to deliberate attacks with different indicators, where the horizontal axis represents the evolutionary stage (every five nodes are a basic evolution stage) and the vertical axis is the network efficiency ratio.
Applsci 12 01944 g007
Table 1. USAir97 network.
RankHCOCKSNCCMCNDI
1118118118118118
2112261112261261
32556767182255
4261255179255182
56720125515267
6109182232201152
71474724867166
8152166258166201
9166248261230230
1017611217247112
M ( i ) 0.530.980.001.001.00
Table 2. Technology routes network.
RankHCOCKSNCCMCNDI
1343698224619619
2180861910741551808
36193433431808464
45018085061450
546446413761404155
6277189016054641404
769813012026605605
8119613788651850698
91301614103480614
10708306113650343
M ( i ) 0.841.000.001.001.00
Publisher’s Note: MDPI stays neutral with regard to jurisdictional claims in published maps and institutional affiliations.

