
Profilometer Comparison of the Surface Roughness of Four Denture Base Resins: An In Vitro Study

 ,
,  ,
,  ,
, 
Abstract
1. Introduction
2. Materials and Methods
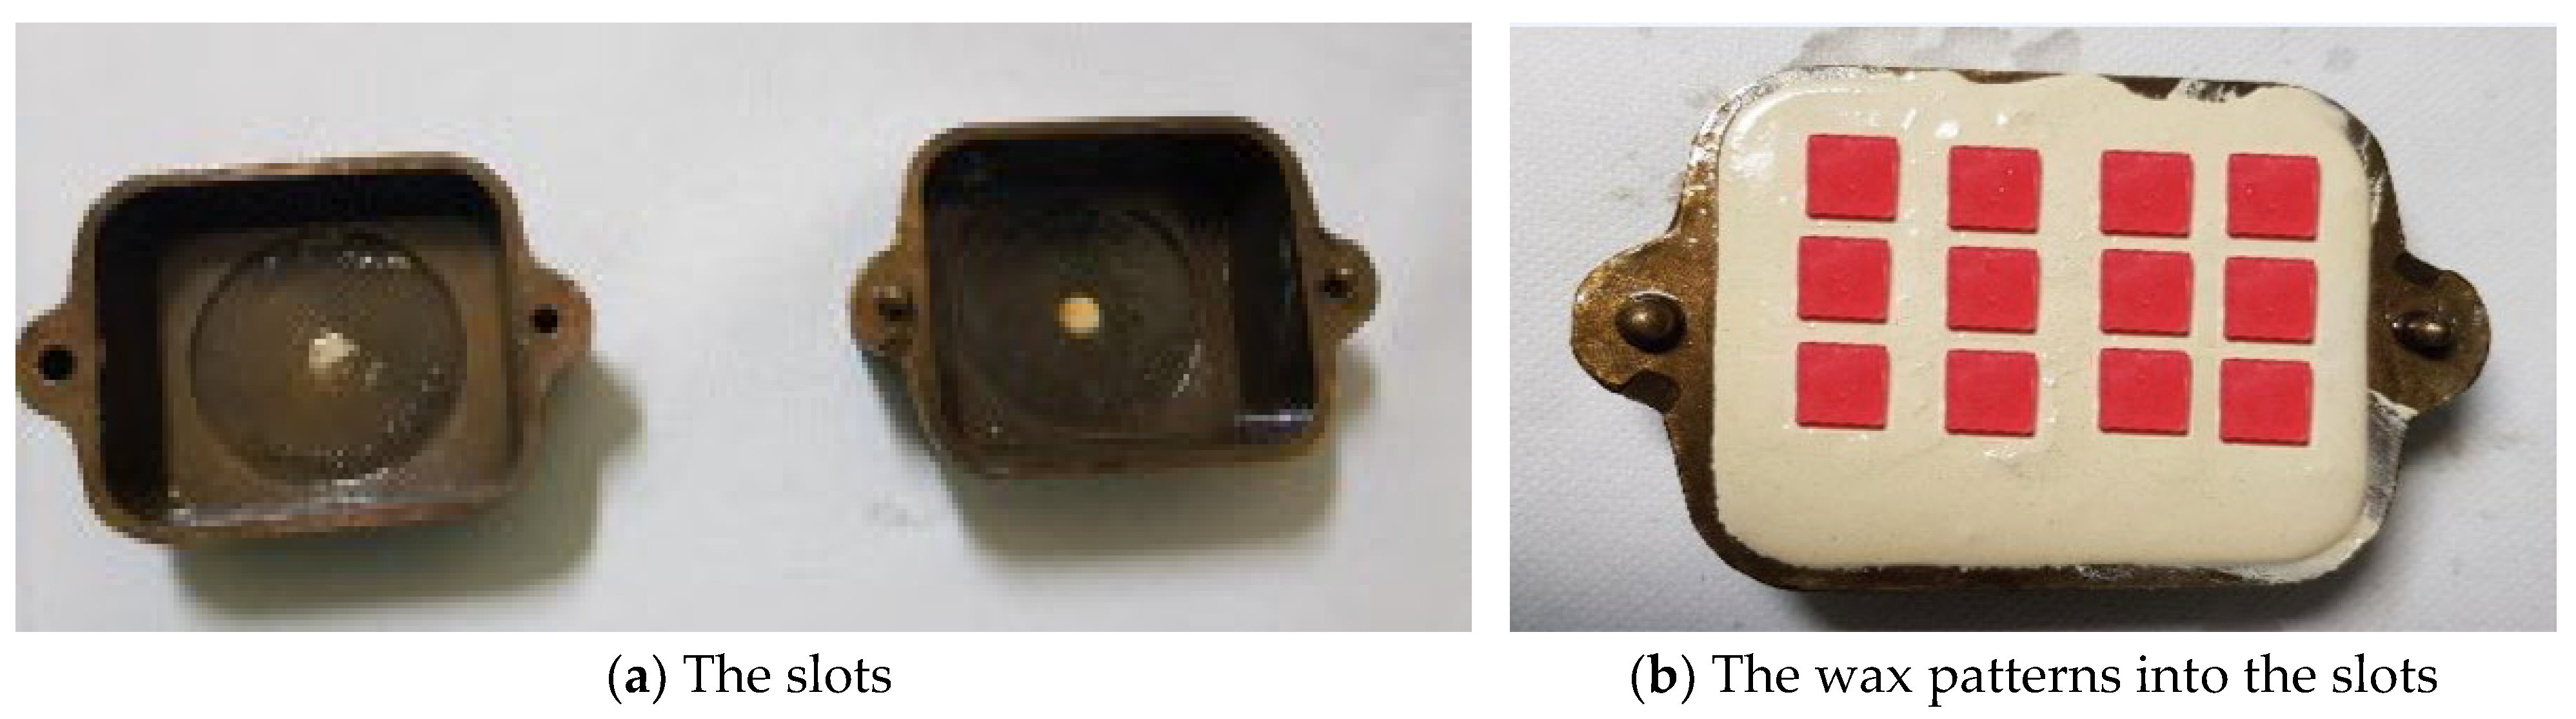
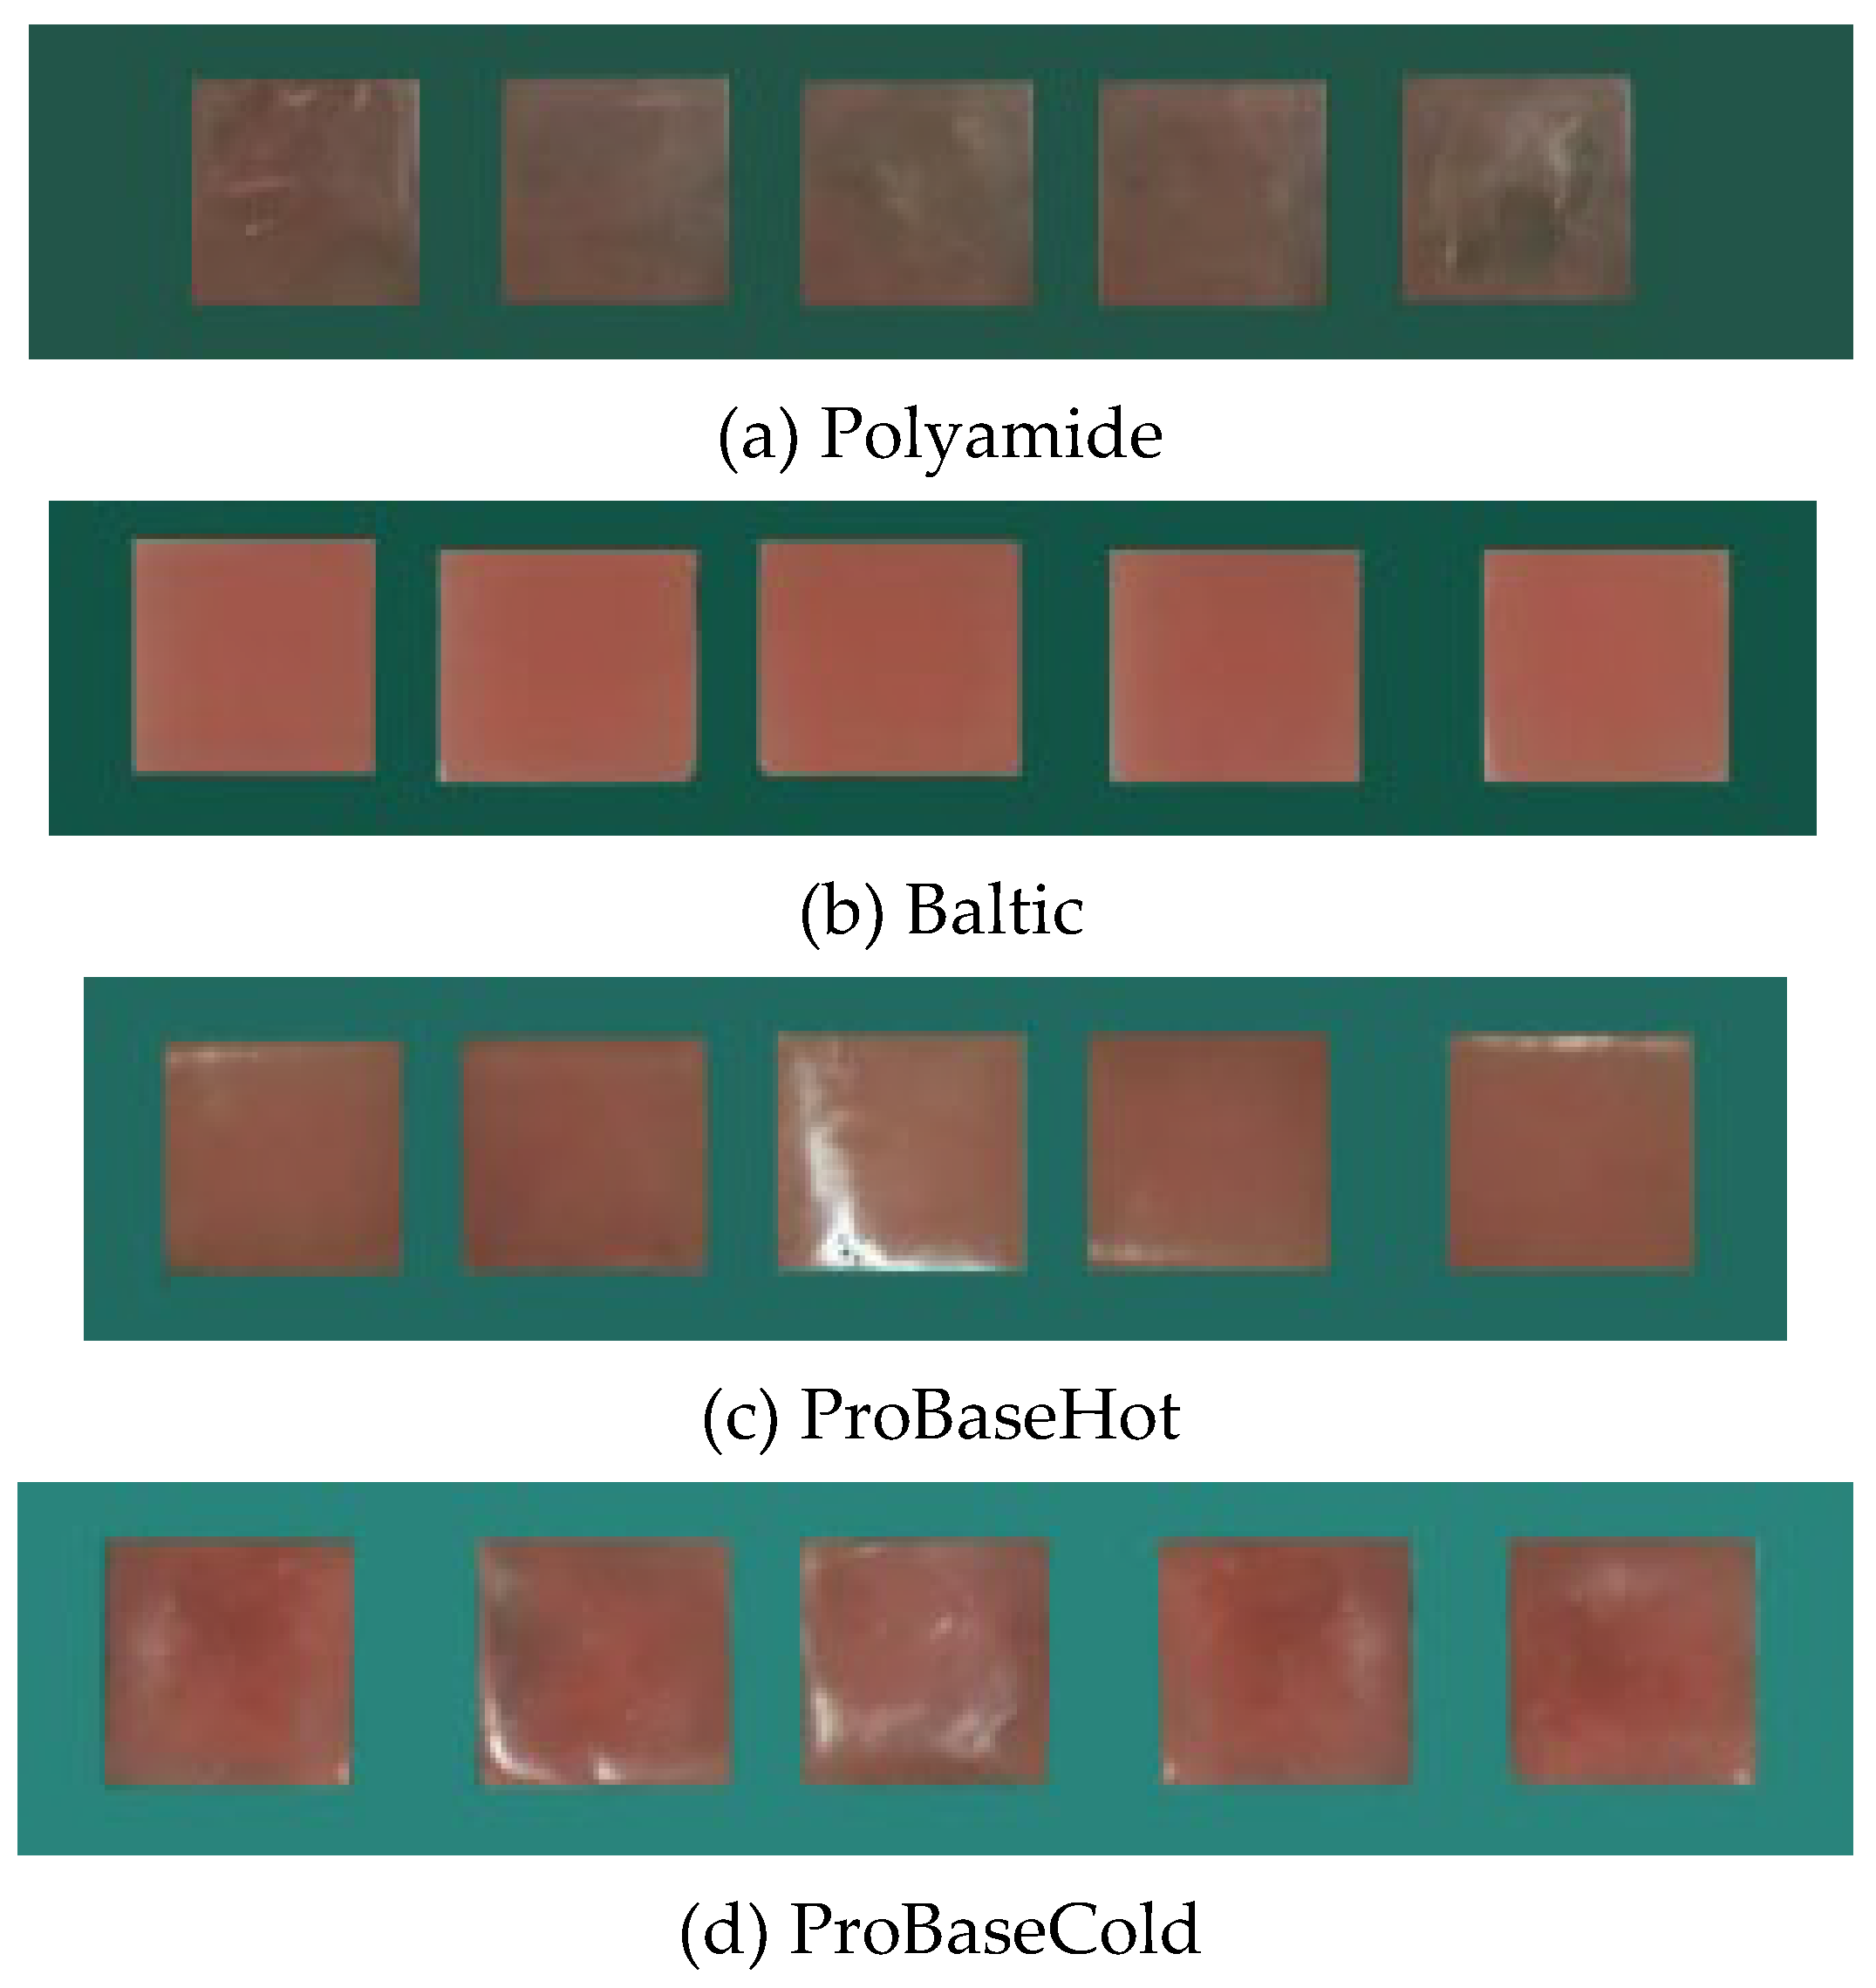
2.1. Surface Preparation
2.2. Statistical Analysis
3. Results
3.1. Summary Statistics
3.2. Kruskal–Wallis Rank Sum Test
4. Discussion
5. Conclusions
Author Contributions
Funding
Institutional Review Board Statement
Informed Consent Statement
Conflicts of Interest
References
- Mayahara, M.; Kataoka, R.; Arimoto, T.; Tamaki, Y.; Yamaguchi, N.; Watanabe, Y.; Yamasaki, Y.; Miyazaki, T. Effects of surface roughness and dimorphism on the adhesion of Candida albicans to the surface of resins: Scanning electron microscope analyses of mode and number of adhesions. J. Investig. Clin. Dent. 2014, 5, 307–312. [Google Scholar] [CrossRef] [PubMed]
- Quaglia, E.; Moscufo, L.; Corsalini, M.; Coscia, D.; Sportelli, P.; Cantatore, F.; De Rinaldis, C.; Rapone, B.; Carossa, M.; Carossa, S. Polyamide vs silk sutures in the healing of postextraction sockets: A split mouth study. Oral Implantol. 2018, 11, 115–120. [Google Scholar]
- Zissis, A.J.; Polyzois, G.L.; Yannikakis, S.A.; Harrison, A. Roughness of denture materials: A comparative study. Int. J. Prosthodont. 2000, 13, 136–140. [Google Scholar]
- Taylor, R.L.; Bulad, K.; Verran, J.; McCord, J.F. Colonization and deterioration of soft denture lining materials in vivo. Eur. J. Prosthodont. Restor. Dent. 2008, 16, 50–55. [Google Scholar] [CrossRef] [PubMed]
- Corsalini, M.; Di Venere, D.; Carossa, M.; Ripa, M.; Sportelli, P.; Cantatore, F.; De Rinaldis, C.; Di Santantonio, G.; Lenoci, G.; Barile, G.; et al. Comparative clinical study between zirconium-ceramic and metal-ceramic fixed rehabilitations. Oral Implantol. 2018, 11, 150–160. [Google Scholar]
- Mutluay, M.M.; Oğuz, S.; Ørstavik, D.; Fløystrand, F.; Doğan, A.; Söderling, E.; Närhi, T.; Olsen, I. Experiments on in vivo biofilm formation and in vitro adhesion of Candida species on polysiloxane liners. Gerodontology 2010, 27, 283–291. [Google Scholar] [CrossRef]
- Corsalini, M.; Di Venere, D.; Sportelli, P.; Magazzino, D.; Ripa, M.; Cantatore, F.; Cagnetta, C.; De Rinaldis, C.; Montemurro, N.; De Giacomo, A.; et al. Evaluation of prosthetic quality and masticatory efficiency in patients with total removable prosthesis: Study of 12 cases. Oral Implantol. 2018, 11, 230–240. [Google Scholar]
- Sarıkaya, I.; Yerliyurt, K.; Hayran, Y. Effect of surface finishing on the colour stability and translucency of dental ceramics. BMC Oral Health 2018, 18, 40. [Google Scholar] [CrossRef] [PubMed]
- Young, H.M.; Smith, C.T.; Morton, D. Comparative in vitro evaluation of two provisional restorative materials. J. Prosthet. Dent. 2001, 85, 129–132. [Google Scholar] [CrossRef]
- Rutkunas, V.; Sabaliauskas, V. Effects of different repolishing techniques on colour change of provisional prosthetic materials. Stomatologija 2009, 11, 102–112. [Google Scholar]
- Haselton, D.R.; Diaz Arnold, A.M.; Dawson, D.V. Color stability of provisional crown and fixed partial denture resins. J. Prosthet. Dent. 2005, 93, 70–75. [Google Scholar] [CrossRef]
- Grassi, F.R.; Grassi, R.; Rapone, B.; Gianfranco, A.; Balena, A.; Kalemaj, Z. Dimensional changes of buccal bone plate in immediate implants inserted through open flap, open flap and bone grafting, and flapless technique. A CBCT randomized controlled clinical trial. Clin. Oral Implants Res. 2019, 30, 1155–1164. [Google Scholar] [CrossRef] [PubMed]
- Arciola, C.R.; Campoccia, D.; Speziale, P.; Montanaro, L.; Costerton, J.W. Biofilm formation in Staphylococcus implant infections. A review of molecular mechanisms and implications for biofilm-resistant materials. Biomaterials 2012, 33, 5967–5982. [Google Scholar] [CrossRef] [PubMed]
- Veyries, M.L.; Faurisson, F.; Joly-Guillou, M.L.; Rouveix, B. Control of staphylococcal adhesion to polymethylmethacrylate and enhancement of susceptibility to antibiotics by poloxamer 407. Antimicrob. Agents Chemother. 2000, 44, 1093–1096. [Google Scholar] [CrossRef]
- Rapone, B.; Palmisano, C.; Ferrara, E.; Di Venere, D.; Albanese, G.; Corsalini, M. The Accuracy of Three Intraoral Scanners in the Oral Environment with and without Saliva: A Comparative Study. Appl. Sci. 2020, 10, 7762. [Google Scholar] [CrossRef]
- Vacheethasanee, K.; Marchant, R.E. Surfactant polymers designed to suppress bacterial (Staphylococcus epidermidis) adhesion on biomaterials. J. Biomed. Mater. Res. 2000, 50, 302–312. [Google Scholar] [CrossRef]
- Singh, D.; Kaur, H.; Gardner, W.G.; Treen, L.B. Bacterial contamination of hospital pagers. Infect. Control Hosp. Epidemiol. 2002, 23, 274–276. [Google Scholar] [CrossRef]
- Scarano, A.; Inchingolo, F.; Rapone, B.; Festa, F.; Tari, S.R.; Lorusso, F. Protective Face Masks: Effect on the Oxygenation and Heart Rate Status of Oral Surgeons during Surgery. Int. J. Environ. Res. Public Health 2021, 18, 2363. [Google Scholar] [CrossRef]
- Guler, A.U.; Kurt, S.; Kulunk, T. Effects of various finishing procedures on the staining of provisional restorative materials. J. Prosthet. Dent. 2005, 93, 453–458. [Google Scholar] [CrossRef]
- Rishi, E.; Rishi, P.; Nandi, K.; Shroff, D.; Therese, K.L. Endophthalmitis caused by Enterococcus faecalis: A case series. Retina 2009, 29, 214–217. [Google Scholar] [CrossRef] [PubMed]
- Peng, C.H.; Cheng, C.K.; Chang, C.K.; Chen, Y.L. Multiresistant enterococci: A rare cause of complicated corneal ulcer and review of the literature. Can. J. Ophthalmol. 2009, 44, 214–215. [Google Scholar] [CrossRef]
- Paranhos, R.M.; Batalhão, C.H.; Semprini, M.; Regalo, S.C.; Ito, I.Y.; Chiarello de Mattos, M.d.G. Evaluation of ocular prosthesis biofilm and anophthalmic cavity contamination after use of three cleansing solutions. J. Appl. Oral Sci. 2007, 15, 33–38. [Google Scholar] [CrossRef] [PubMed][Green Version]
- Rapone, B.; Ferrara, E.; Corsalini, M.; Converti, I.; Grassi, F.R.; Santacroce, L.; Topi, S.; Gnoni, A.; Scacco, S.; Scarano, A.; et al. The Effect of Gaseous Ozone Therapy in Conjunction with Periodontal Treatment on Glycated Hemoglobin Level in Subjects with Type 2 Diabetes Mellitus: An Unmasked Randomized Controlled Trial. Int. J. Environ. Res. Public Health 2020, 17, 54675. [Google Scholar] [CrossRef]
- Williams, M.A.; McMullan, R.; Hedderwick, S.; Mulholland, D.A.; Best, R.M. Diagnosis and treatment of endogenous fungal endophthalmitis. Ophthalmologica. 2006, 220, 134–136. [Google Scholar] [CrossRef]
- Katsikogianni, M.; Missirlis, Y.F. Concise review of mechanisms of bacterial adhesion to biomaterials and of techniques used in estimating bacteria-material interactions. Eur. Cell Mater. 2004, 8, 37–57. [Google Scholar] [CrossRef] [PubMed]
- Yoda, I.; Koseki, H.; Tomita, M.; Shida, T.; Horiuchi, H.; Sakoda, H.; Osaki, M. Effect of surface roughness of biomaterials on Staphylococcus epidermidis adhesion. BMC Microbiol. 2014, 14, 234. [Google Scholar] [CrossRef]
- Gantz, L.; Fauxpoint, G.; Arntz, Y.; Pelletier, H.; Etienne, O. In vitro comparison of the surface roughness of polymethyl methacrylate and bis-acrylic resins for interim restorations before and after polishing. J. Prosthet. Dent. 2021, 125, 833.e1–833.e10. [Google Scholar] [CrossRef]
- Rapone, B.; Corsalini, M.; Converti, I.; Loverro, M.T.; Gnoni, A.; Trerotoli, P.; Ferrara, E. Does Periodontal Inflammation Affect Type 1 Diabetes in Childhood and Adolescence? A Meta-Analysis. Front. Endocrinol. 2020, 11, 278. [Google Scholar] [CrossRef] [PubMed]
- Sen, D.; Göller, G.; Işsever, H. The effect of two polishing pastes on the surface roughness of bis-acryl composite and methacrylate based resins. J. Prosthet. Dent. 2002, 88, 527–532. [Google Scholar] [CrossRef]
- Quirynen, M.; Bollen, C.M. The influence of surface roughness and surface-free energy on supra- and subgingival plaque formation in man. A review of the literature. J. Clin. Periodontol. 1995, 22, 1–4. [Google Scholar] [CrossRef]
- Rashid, H. The effect of surface roughness on ceramics used in dentistry: A review of literature. Eur. J. Dent. 2014, 8, 571–579. [Google Scholar] [CrossRef] [PubMed]
- Silva, S.; Pires, P.; Monteiro, D.R.; Negri, M.; Gorup, L.F.; Camargo, E.R.; Barbosa, D.B.; Oliveira, R.; Williams, D.W.; Henriques, M.; et al. The effect of silver nanoparticles and nystatin on mixed biofilms of Candida glabrata and Candida albicans on acrylic. Med. Mycol. 2013, 51, 178–184. [Google Scholar] [CrossRef] [PubMed]


| Group | Variable | Min | Max | Range | Median | s2 | IQR | SS |
|---|---|---|---|---|---|---|---|---|
| Ra | ||||||||
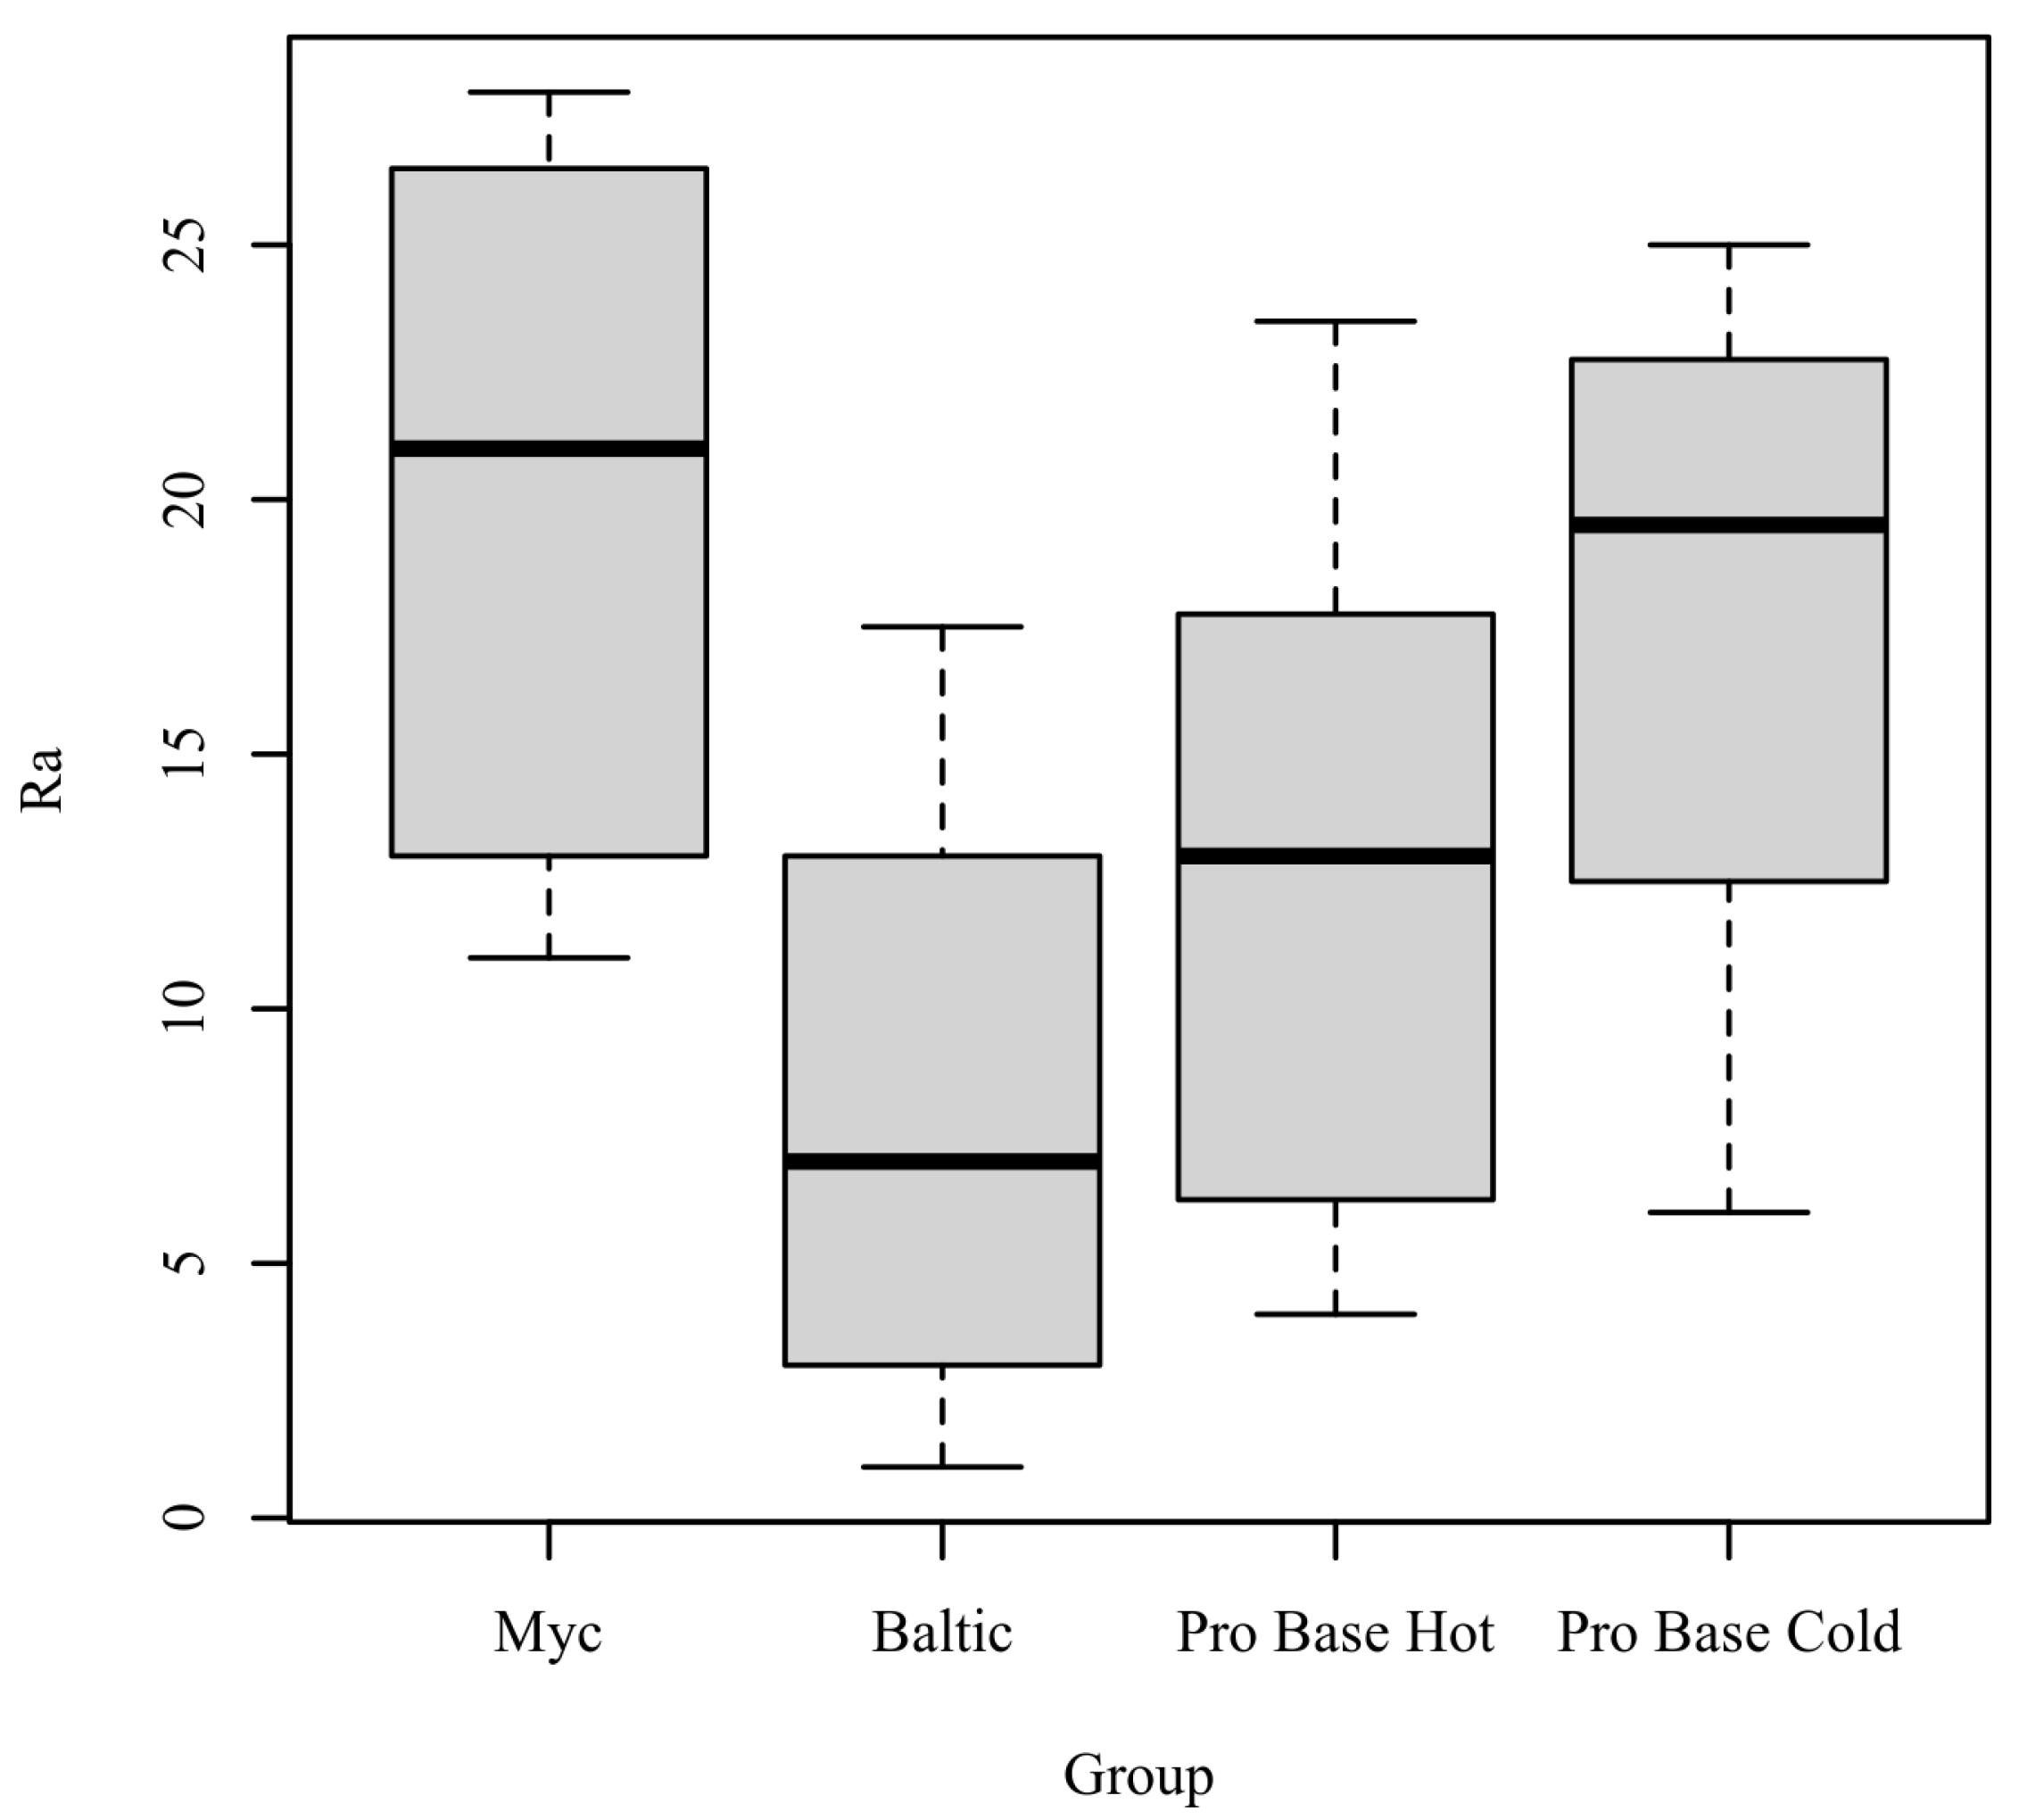
| Myc | 6.7 | 9.32 | 2.62 | 8 | 1.25 | 2.22 | 7.52 | |
| Baltic | 4.6 | 7.6 | 3 | 6 | 1.25 | 2.2 | 7.53 | |
| ProBase Hot | 5.67 | 8.12 | 2.45 | 6.89 | 0.91 | 2.09 | 5.49 | |
| ProBase Cold | 5.98 | 8.76 | 2.78 | 7.76 | 0.94 | 1.56 | 5.69 | |
| Rv | ||||||||
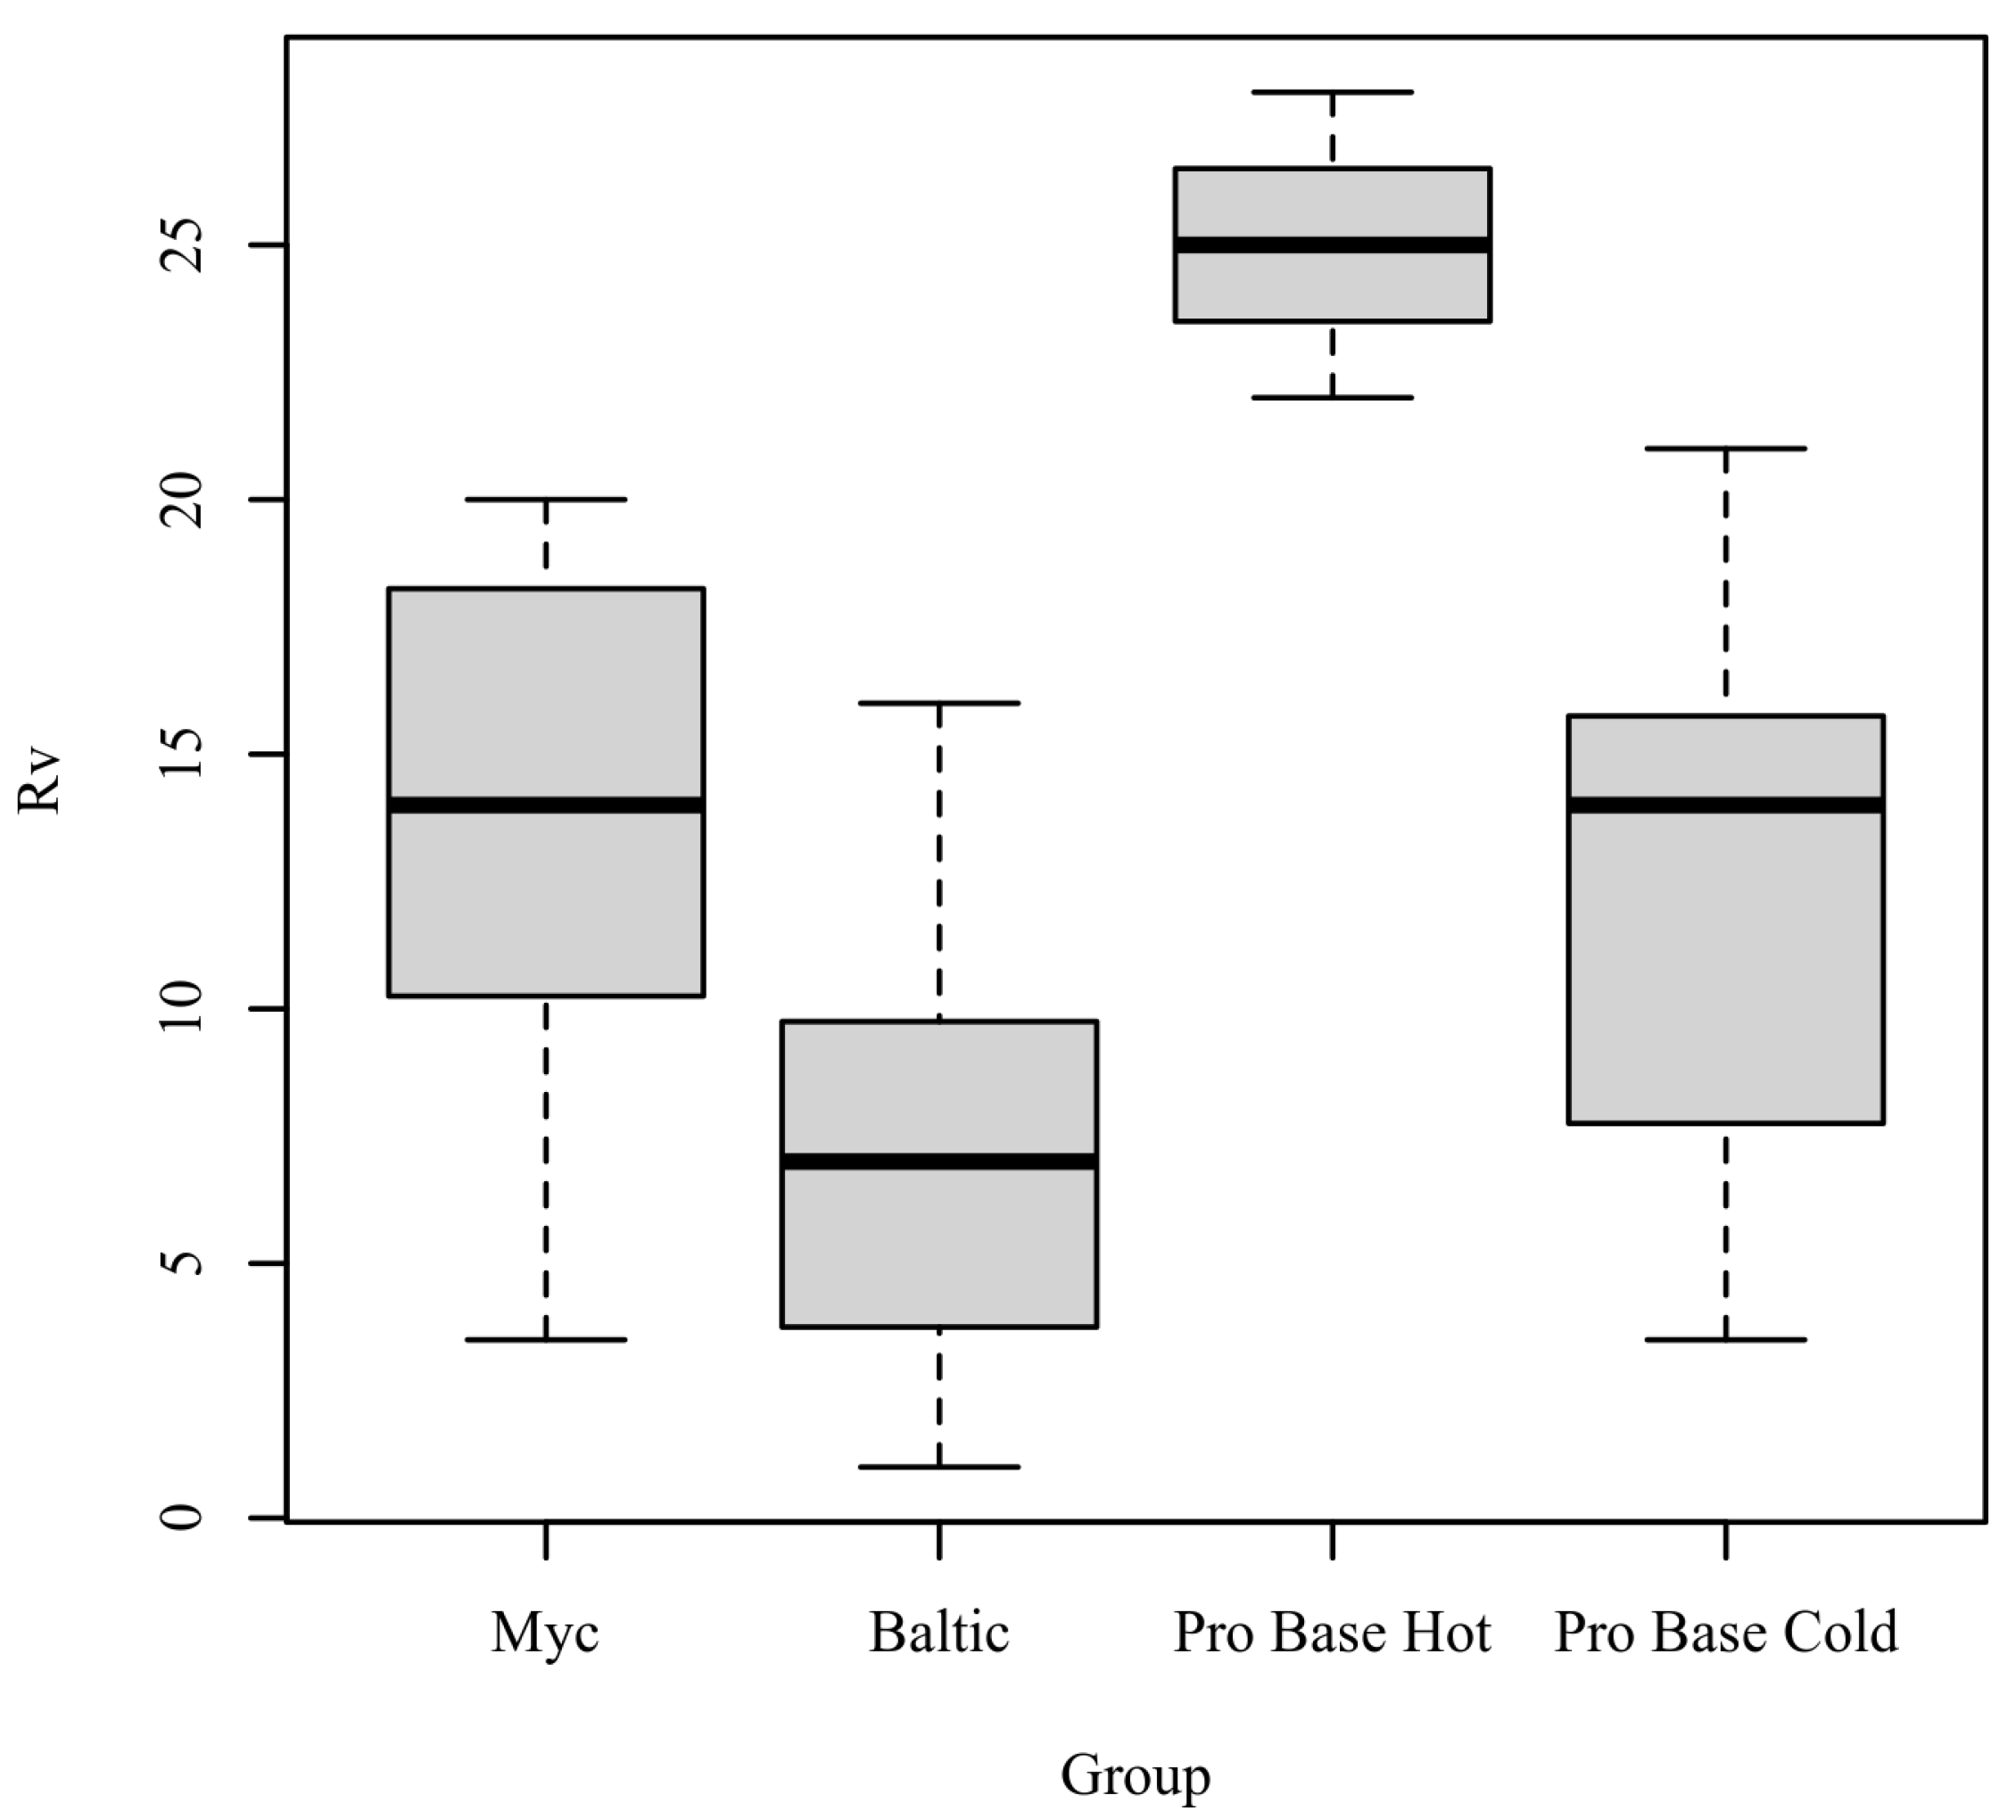
| Myc | 8.12 | 9.6 | 1.48 | 9.12 | 0.27 | 0.87 | 1.64 | |
| Baltic | 7.89 | 9.13 | 1.24 | 8.34 | 0.20 | 0.81 | 1.22 | |
| ProBase Hot | 11.23 | 15.55 | 4.32 | 14.78 | 2.57 | 2.67 | 15.44 | |
| ProBase Cold | 8.12 | 9.78 | 1.66 | 9.12 | 0.366 | 1.1 | 2.2 | |
| Rp | ||||||||
| Myc | 10.89 | 13.11 | 2.22 | 12.89 | 0.67 | 0.98 | 4.05 | |
| Baltic | 5.67 | 12.12 | 6.45 | 9.89 | 4.68 | 3.34 | 28.08 | |
| ProBase Hot | 10.56 | 12.34 | 1.78 | 11.76 | 0.47 | 1.34 | 2.83 | |
| ProBase Cold | 8.66 | 11.56 | 2.9 | 10.12 | 0.78 | 0.91 | 4.73 | |
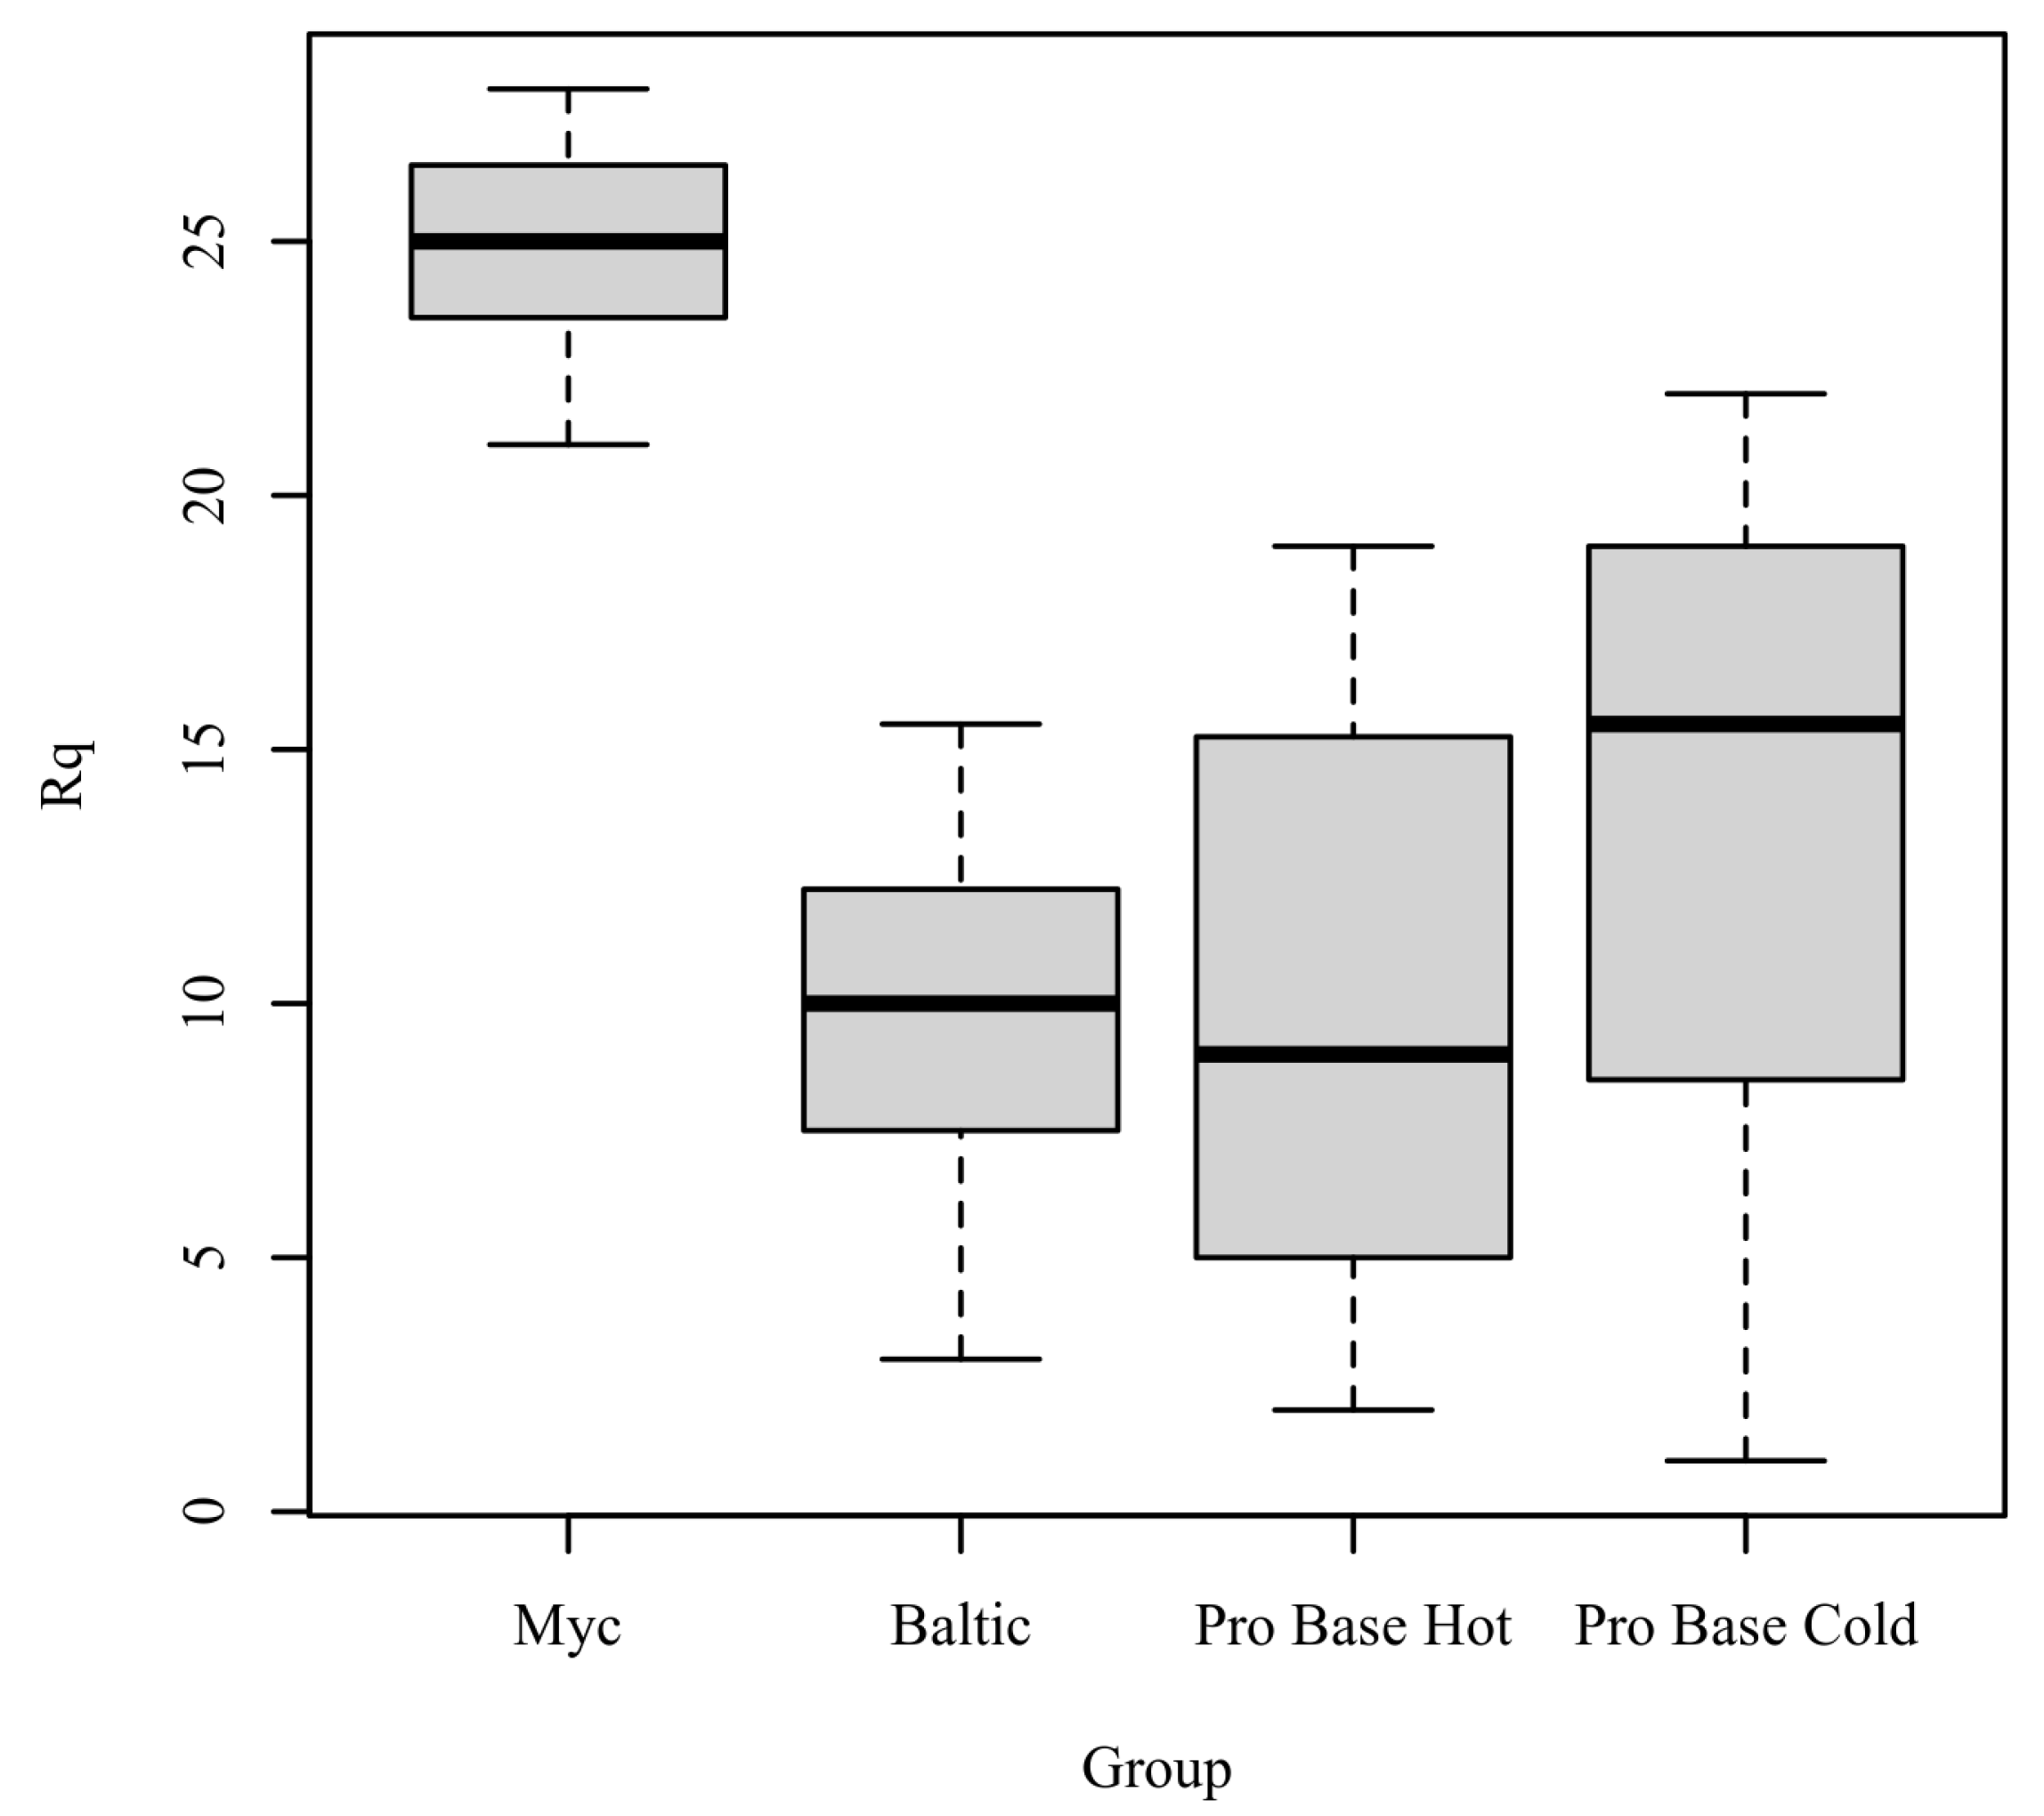
| Rq | ||||||||
| Myc | 37.67 | 43.12 | 5.45 | 40.12 | 22.66 | 1.26 | 16.01 | |
| Baltic | 21.56 | 34.56 | 5 | 32.12 | 13.35 | 2.99 | 20.1 | |
| ProBase Hot | 26.67 | 36.89 | 10.22 | 31.56 | 12.62 | 5.89 | 75.73 | |
| ProBase Cold | 29.56 | 39.12 | 17.12 | 34.56 | 35.21 | 7.67 | 65.14 |
| Level | Mean Rank | χ2 | df | p |
|---|---|---|---|---|
| Myc | 19.86 | 8.23 | 3 | 0.041 |
| Baltic | 8.21 | |||
| ProBase Hot | 12.64 | |||
| ProBase Cold | 17.29 |
| Comparison | Observed Difference | Critical Difference |
|---|---|---|
| Myc–Baltic | 11.64 | 11.60 |
| Myc–ProBase Hot | 7.21 | 11.60 |
| Myc–ProBase Cold | 2.57 | 11.60 |
| Baltic–ProBase Hot | 4.43 | 11.60 |
| Baltic–ProBase Cold | 9.07 | 11.60 |
| ProBase Hot–ProBase Cold | 4.64 | 11.60 |
| Level | Mean Rank | χ2 | df | p |
|---|---|---|---|---|
| Myc | 13.50 | 17.47 | 3 | <0.001 |
| Baltic | 7.29 | |||
| ProBase Hot | 25.00 | |||
| ProBase Cold | 12.21 |
| Comparison | Observed Difference | Critical Difference |
|---|---|---|
| Myc–Baltic | 6.21 | 11.60 |
| Myc–ProBase Hot | 11.50 | 11.60 |
| Myc–ProBase Cold | 1.29 | 11.60 |
| Baltic–ProBase Hot | 17.71 | 11.60 |
| Baltic–ProBase Cold | 4.93 | 11.60 |
| ProBase Hot–ProBase Cold | 12.79 | 11.60 |
| Level | Mean Rank | χ2 | df | p |
|---|---|---|---|---|
| Myc | 23.43 | 16.19 | 3 | 0.001 |
| Baltic | 8.43 | |||
| ProBase Hot | 17.29 | |||
| ProBase Cold | 8.86 |
| Comparison | Observed Difference | Critical Difference |
|---|---|---|
| Myc–Baltic | 15.00 | 11.60 |
| Myc–ProBase Hot | 6.14 | 11.60 |
| Myc–ProBase Cold | 14.57 | 11.60 |
| Baltic–ProBase Hot | 8.86 | 11.60 |
| Baltic–ProBase Cold | 0.43 | 11.60 |
| ProBase Hot–ProBase Cold | 8.43 | 11.60 |
| Level | Mean Rank | χ2 | df | p |
|---|---|---|---|---|
| Myc | 24.86 | 15.64 | 3 | 0.001 |
| Baltic | 9.71 | |||
| ProBase Hot | 10.07 | |||
| ProBase Cold | 13.36 |
| Comparison | Observed Difference | Critical Difference |
|---|---|---|
| Myc–Baltic | 15.14 | 11.60 |
| Myc–ProBase Hot | 14.79 | 11.60 |
| Myc–ProBase Cold | 11.50 | 11.60 |
| Baltic–ProBase Hot | 0.36 | 11.60 |
| Baltic–ProBase Cold | 3.64 | 11.60 |
| ProBase Hot–ProBase Cold | 3.29 | 11.60 |
Publisher’s Note: MDPI stays neutral with regard to jurisdictional claims in published maps and institutional affiliations. |
© 2022 by the authors. Licensee MDPI, Basel, Switzerland. This article is an open access article distributed under the terms and conditions of the Creative Commons Attribution (CC BY) license (https://creativecommons.org/licenses/by/4.0/).
Share and Cite
Rapone, B.; Pedone, S.; Carnevale, A.; Plantamura, P.; Scarano, A.; Demelio, A.; Demelio, G.P.; Corsalini, M. Profilometer Comparison of the Surface Roughness of Four Denture Base Resins: An In Vitro Study. Appl. Sci. 2022, 12, 1837. https://doi.org/10.3390/app12041837
Rapone B, Pedone S, Carnevale A, Plantamura P, Scarano A, Demelio A, Demelio GP, Corsalini M. Profilometer Comparison of the Surface Roughness of Four Denture Base Resins: An In Vitro Study. Applied Sciences. 2022; 12(4):1837. https://doi.org/10.3390/app12041837
Chicago/Turabian StyleRapone, Biagio, Sebastian Pedone, Antonio Carnevale, Pasquale Plantamura, Antonio Scarano, Antonio Demelio, Giuseppe Pompeo Demelio, and Massimo Corsalini. 2022. "Profilometer Comparison of the Surface Roughness of Four Denture Base Resins: An In Vitro Study" Applied Sciences 12, no. 4: 1837. https://doi.org/10.3390/app12041837
APA StyleRapone, B., Pedone, S., Carnevale, A., Plantamura, P., Scarano, A., Demelio, A., Demelio, G. P., & Corsalini, M. (2022). Profilometer Comparison of the Surface Roughness of Four Denture Base Resins: An In Vitro Study. Applied Sciences, 12(4), 1837. https://doi.org/10.3390/app12041837