
Dynamic Characteristics of Unsteady Aerodynamic Pressure on an Enclosed Housing for Sound Emission Alleviation Caused by a Passing High-Speed Train

 , ,
, ,
Abstract
1. Introduction
2. Numerical Methodology
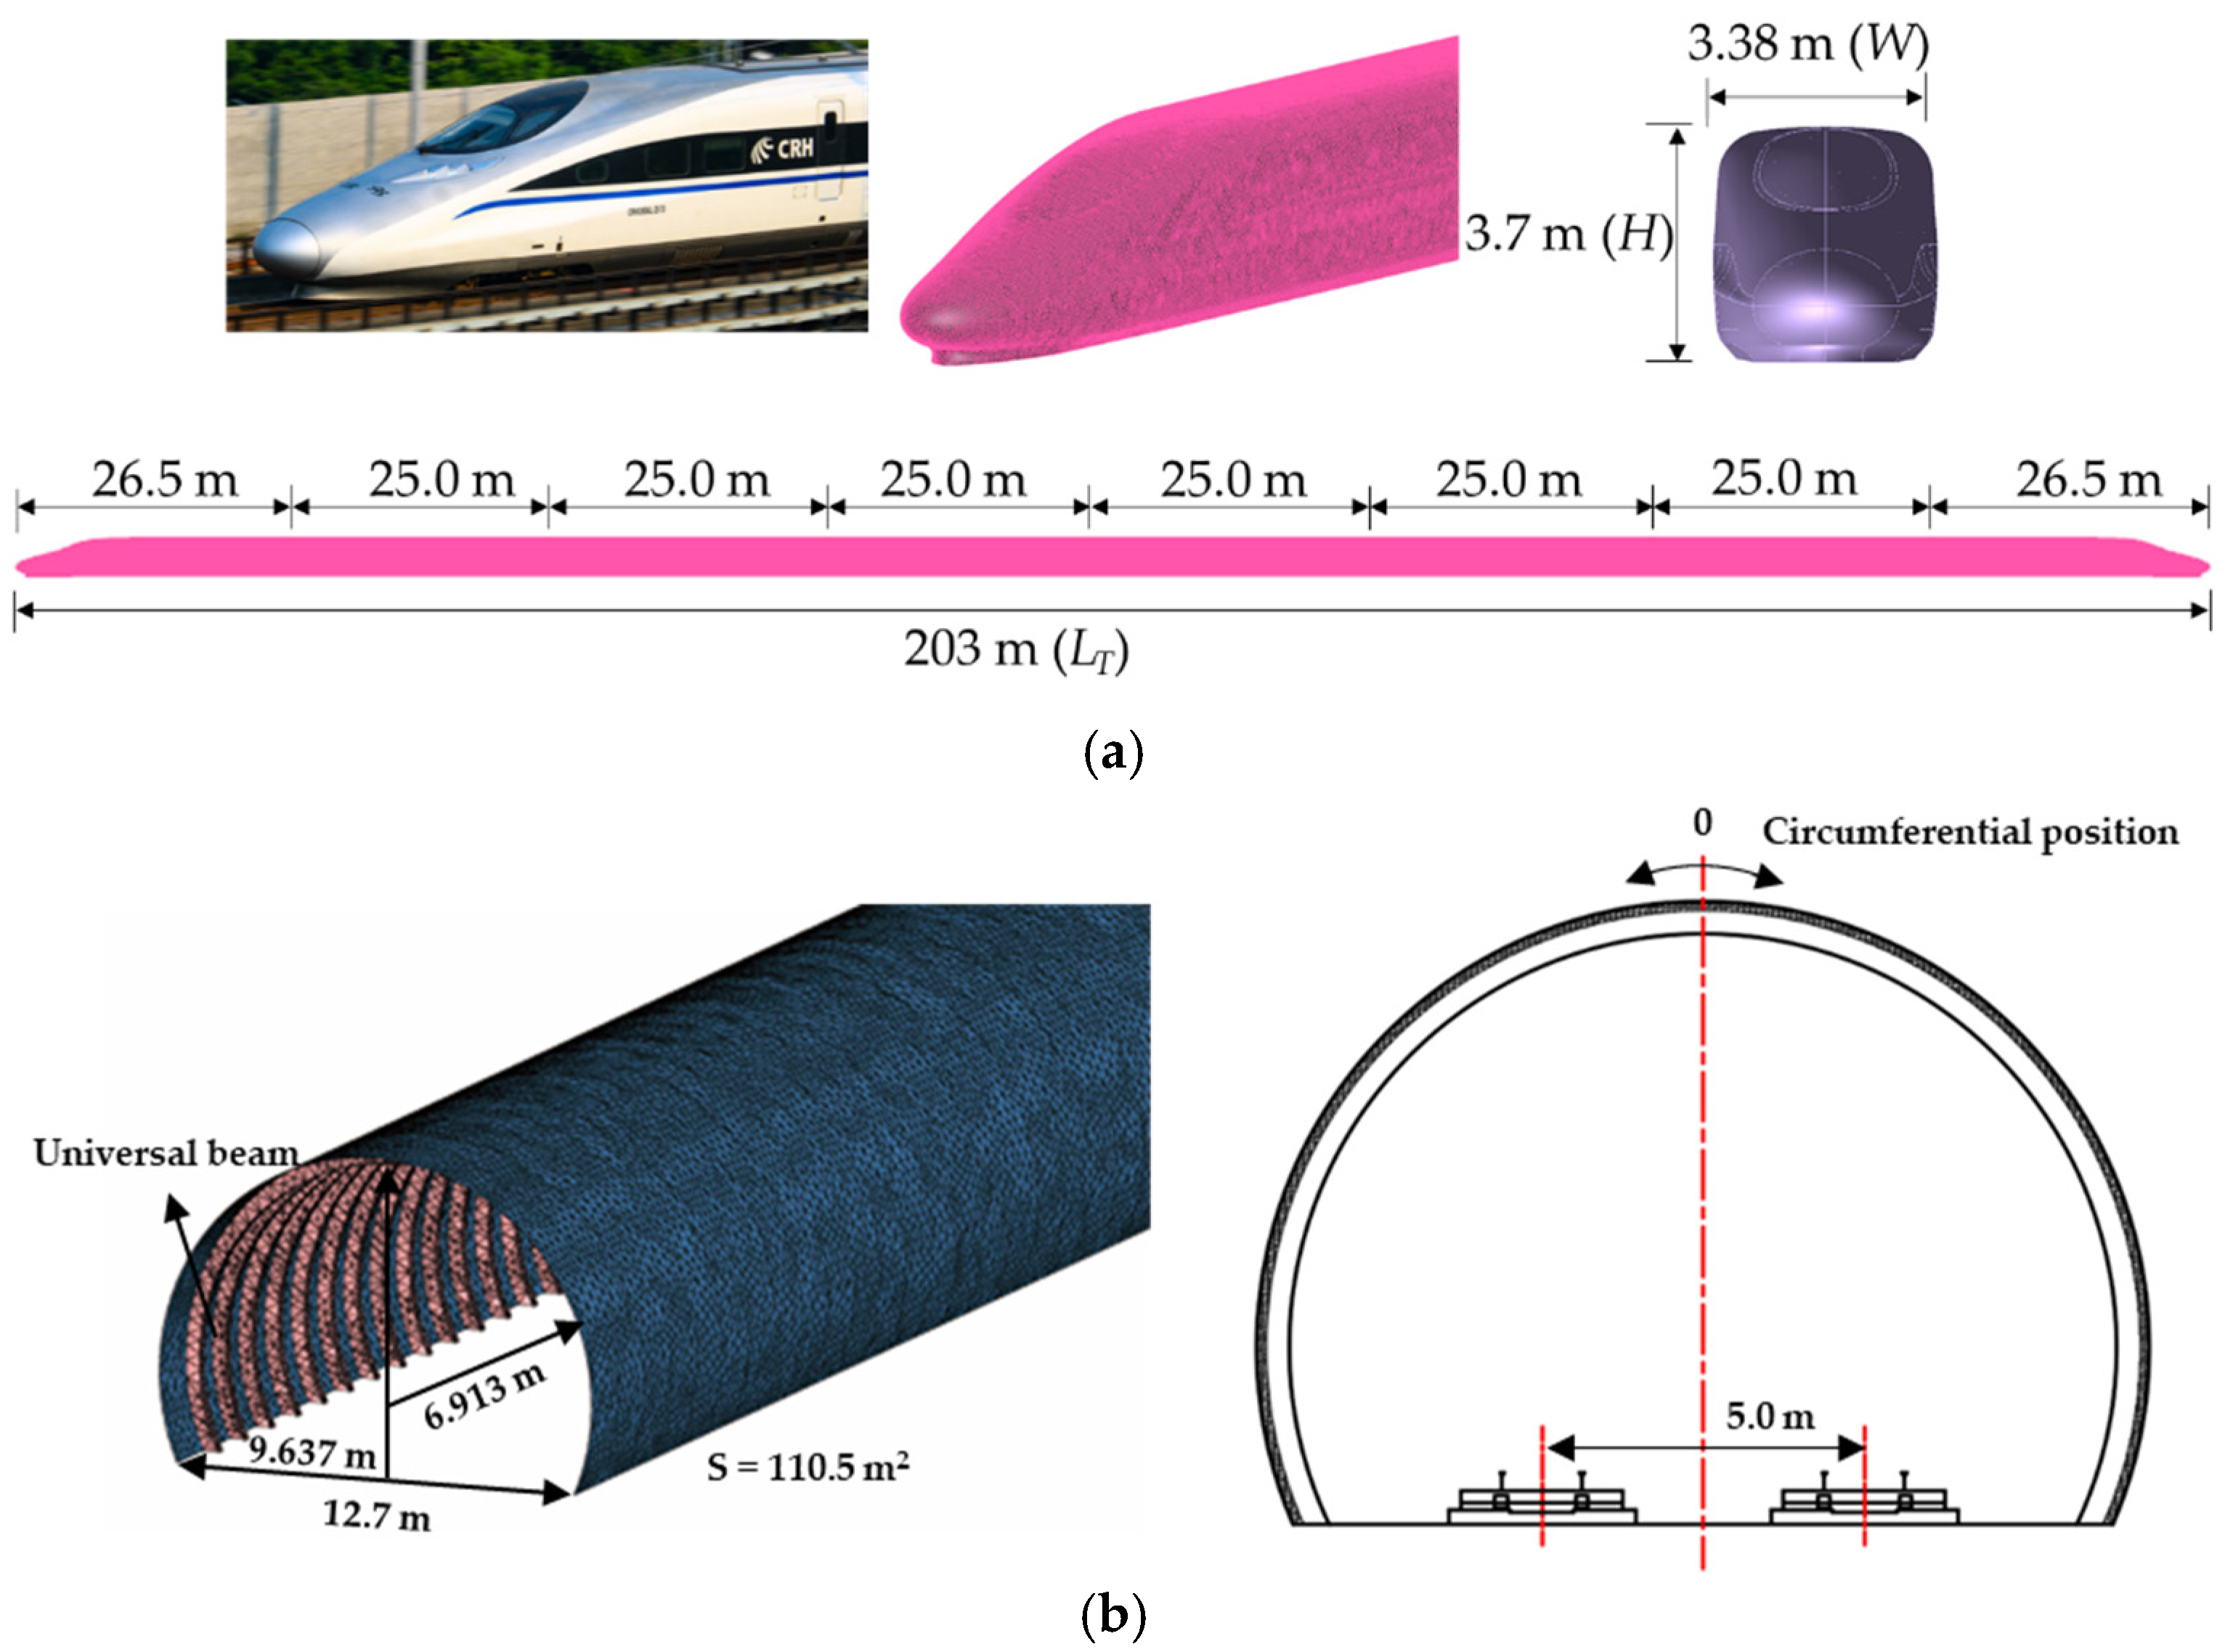
2.1. Geometry
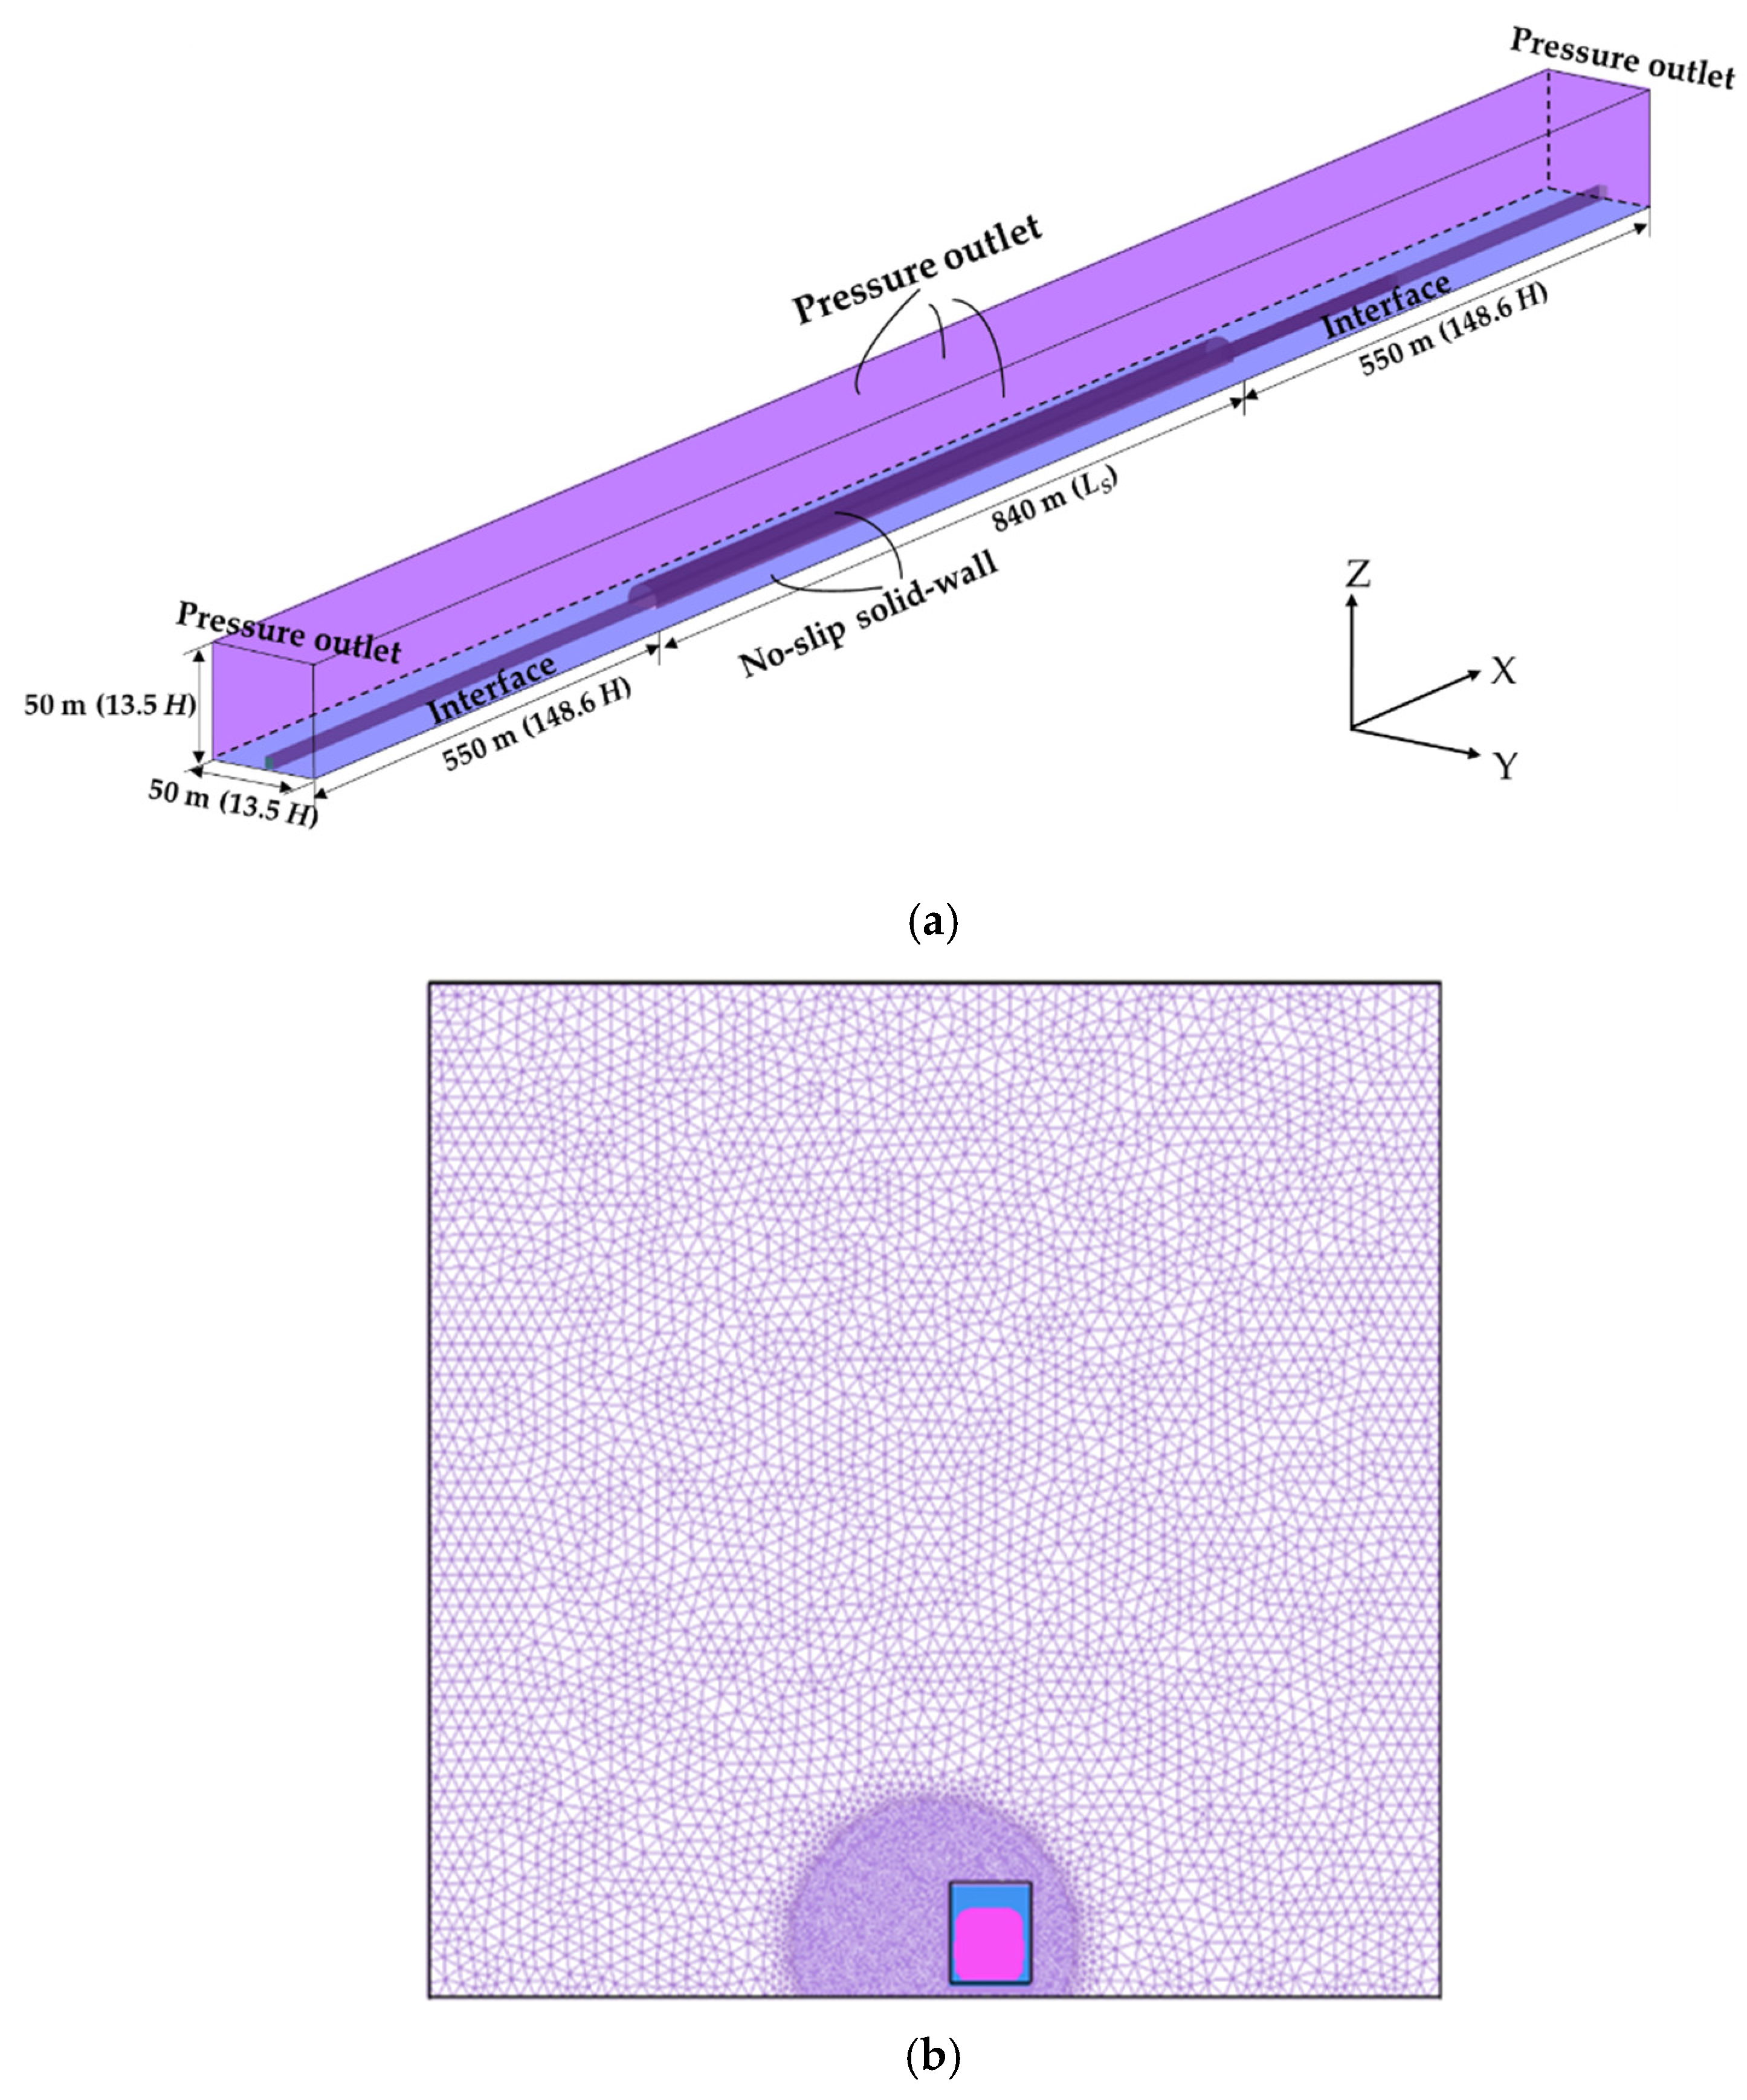
2.2. Computational Domain and Mesh
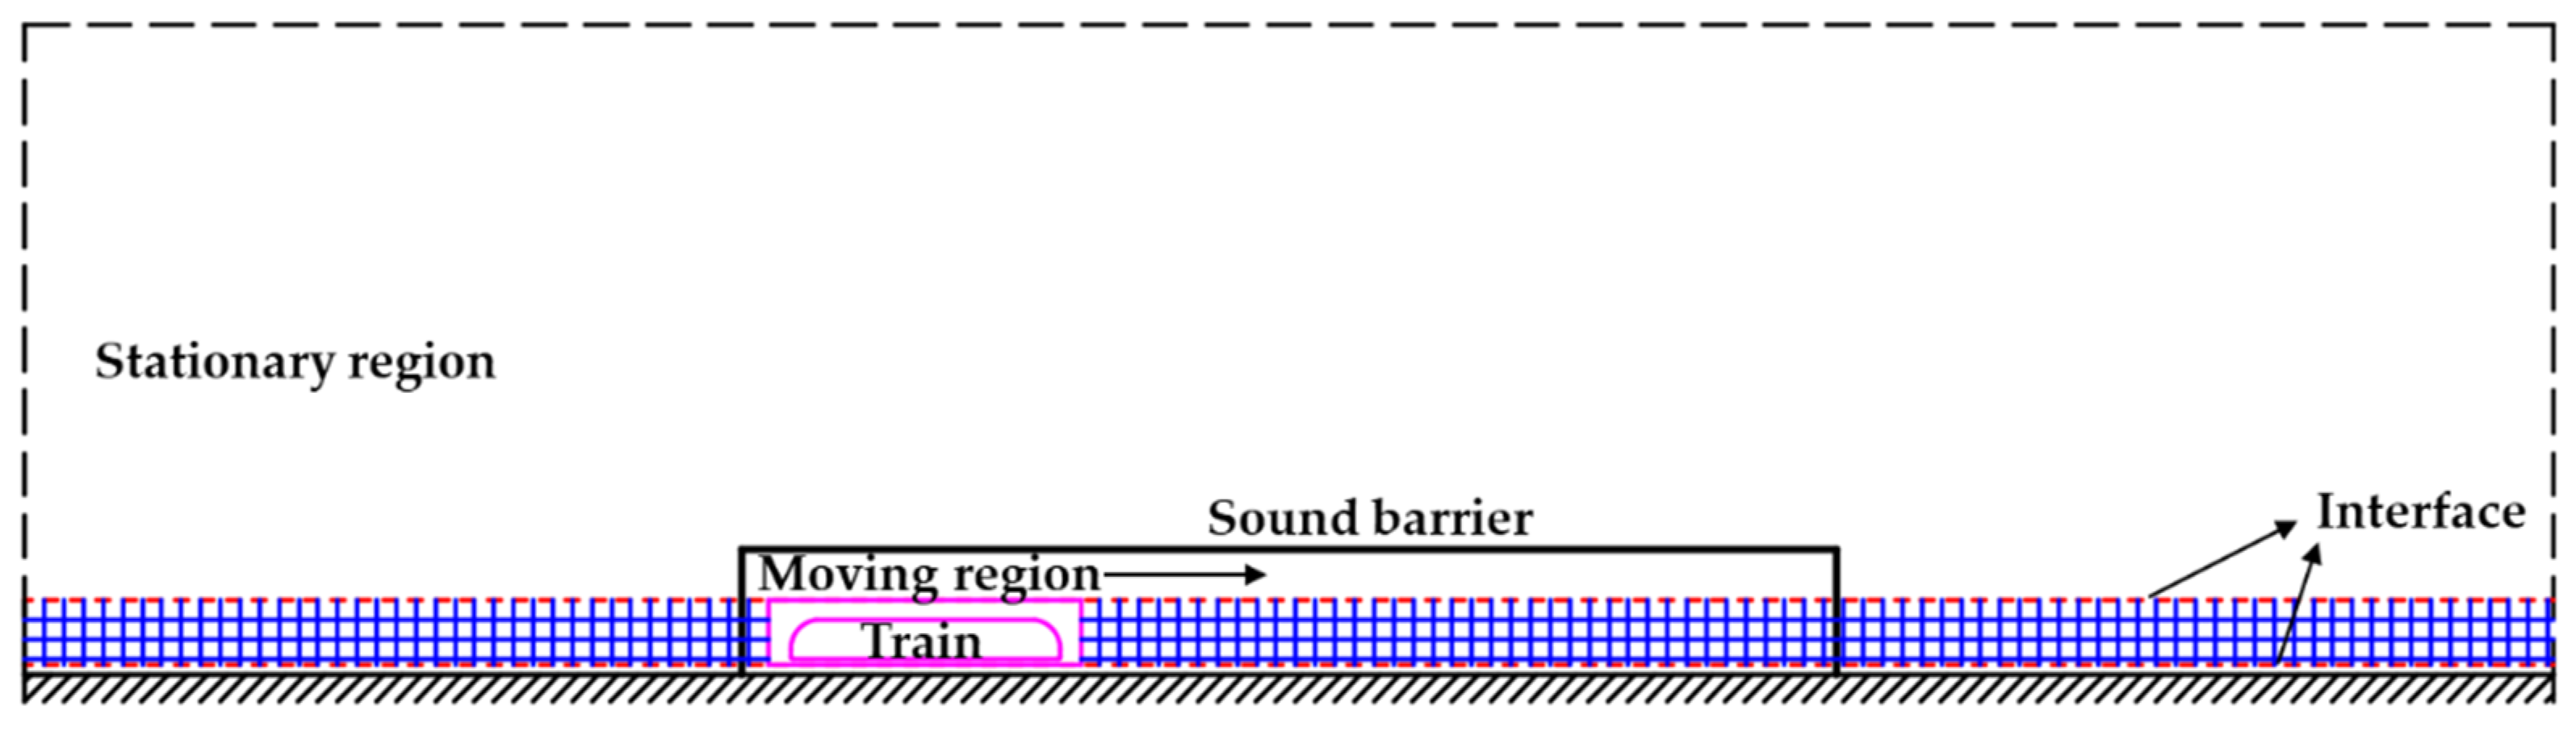
2.3. Numerical Method
2.4. Layout of Measurement Points
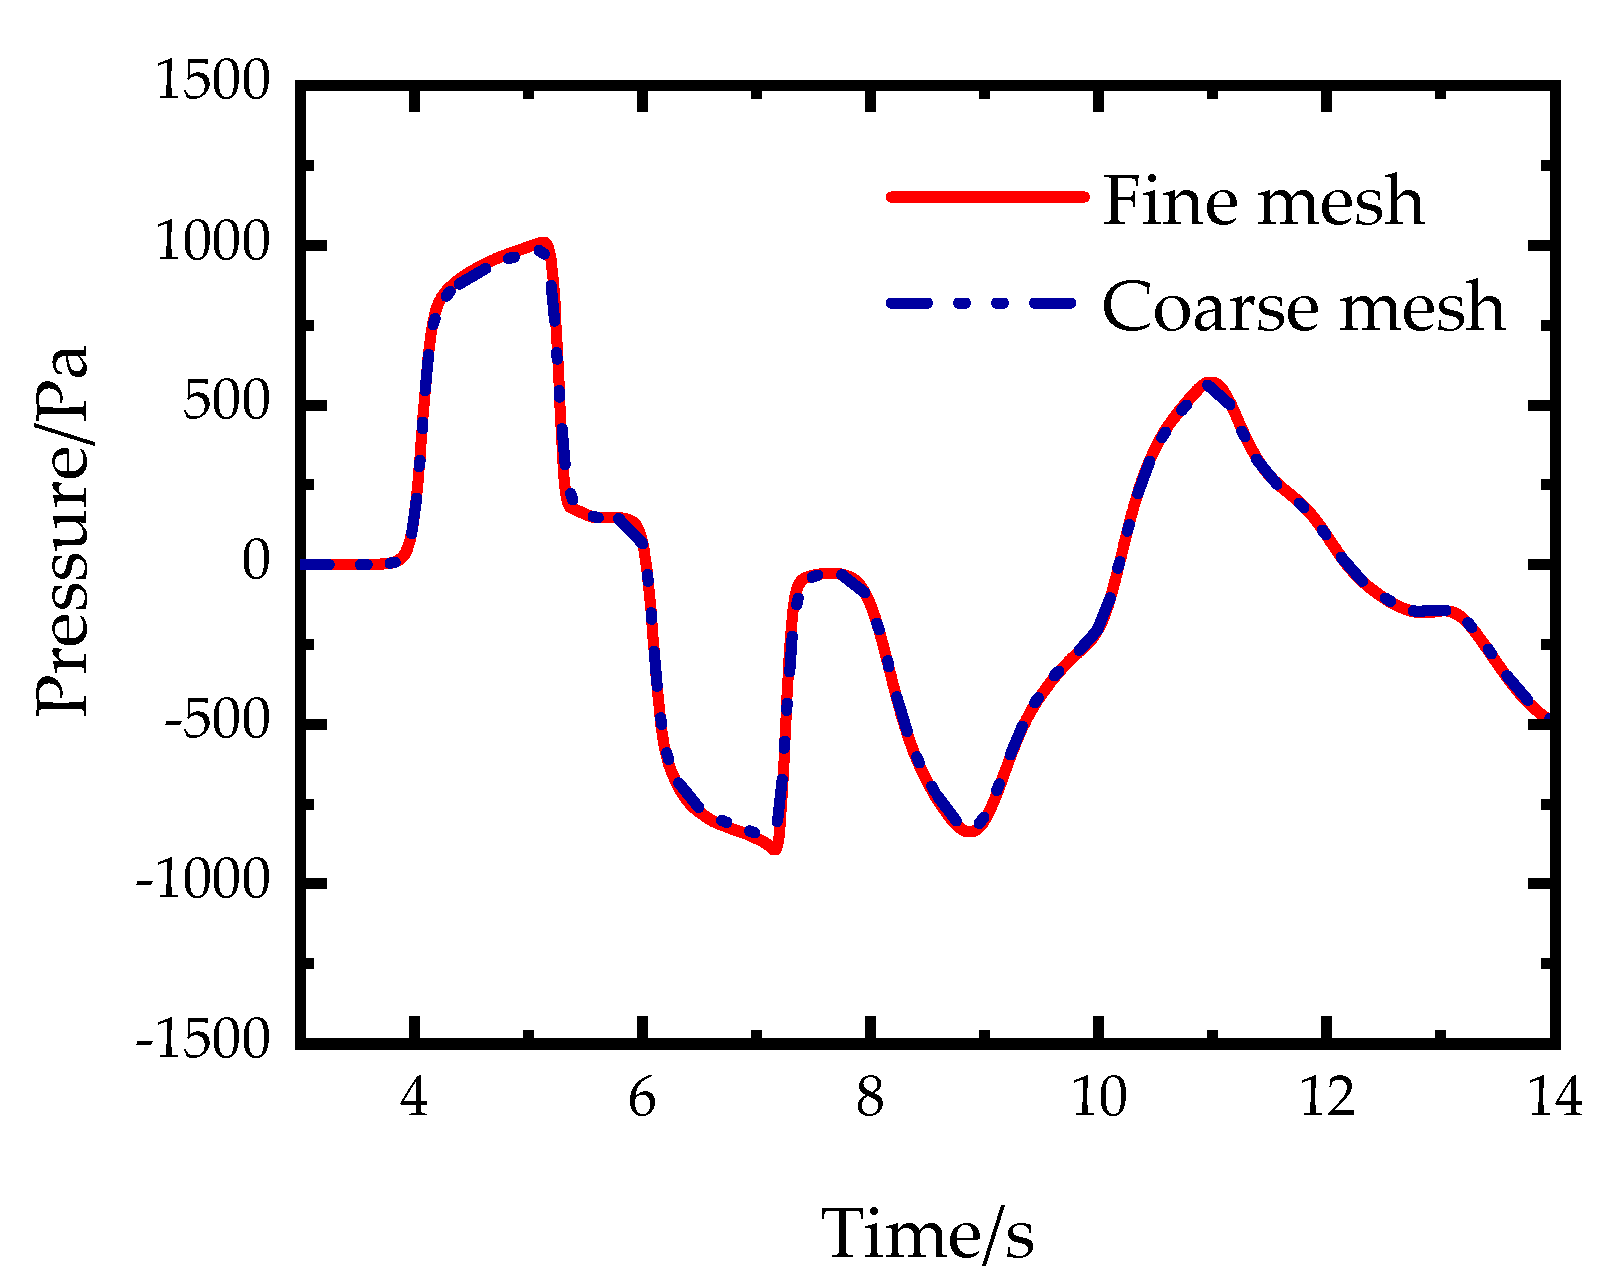
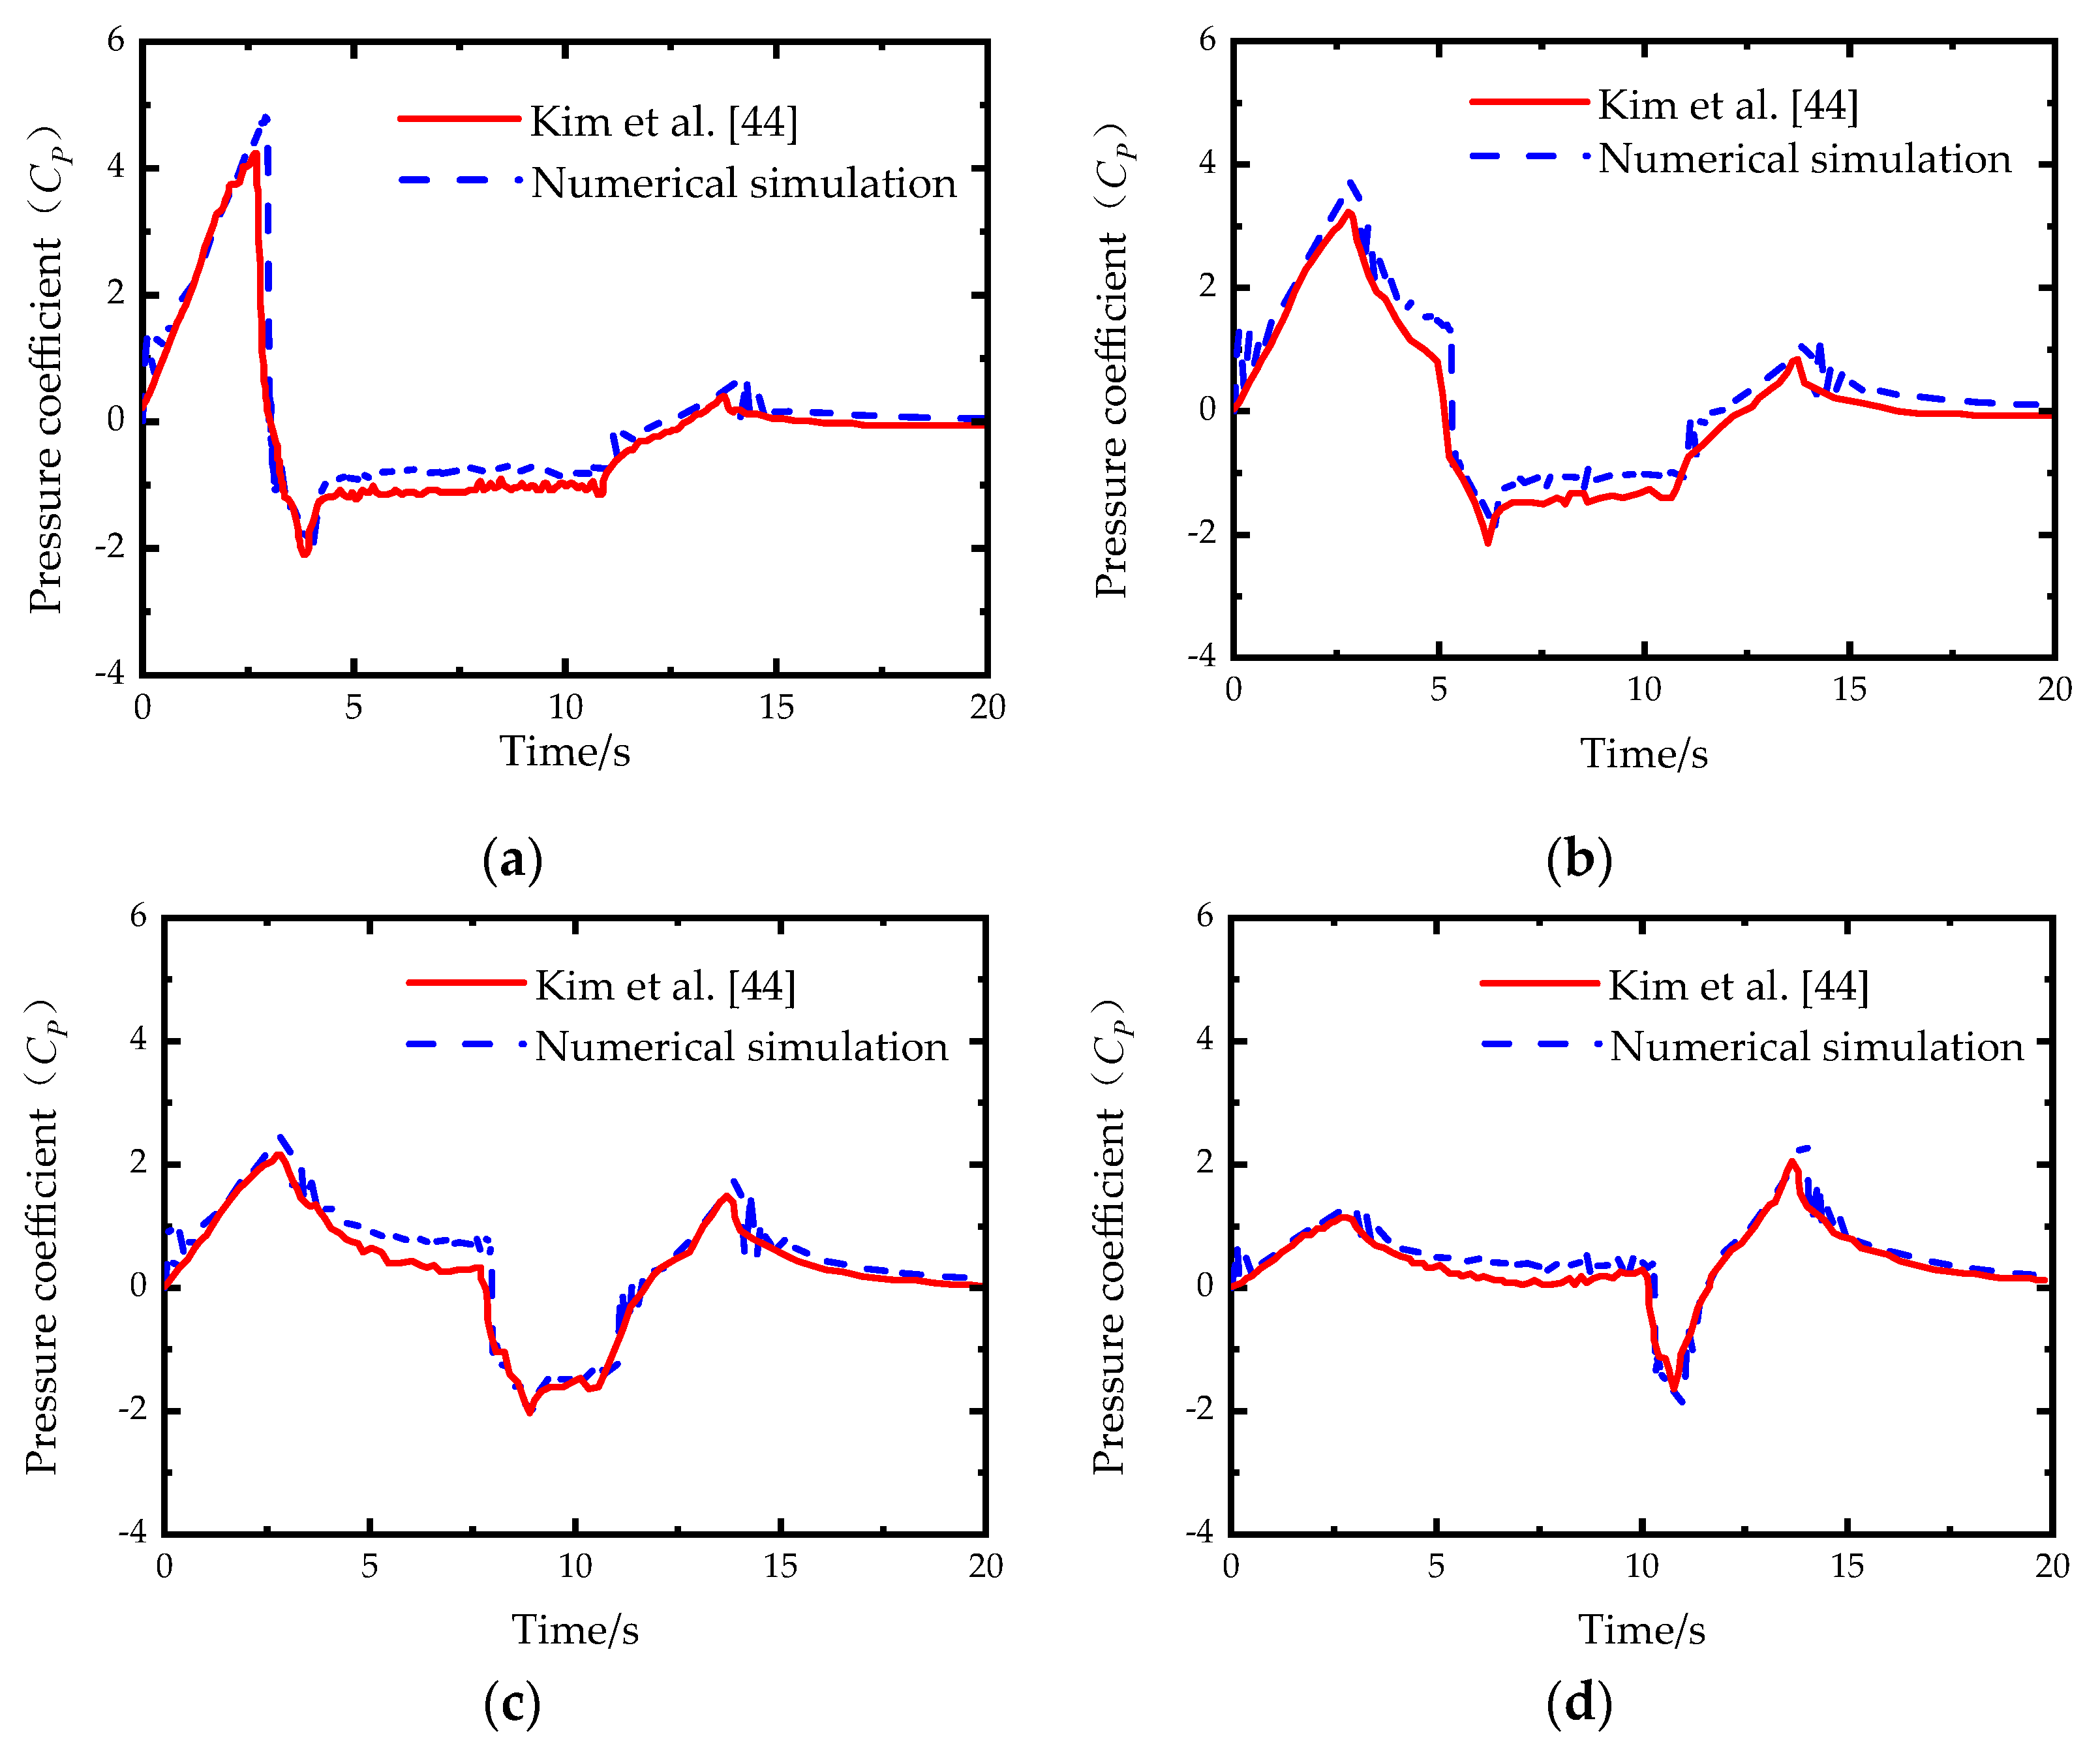
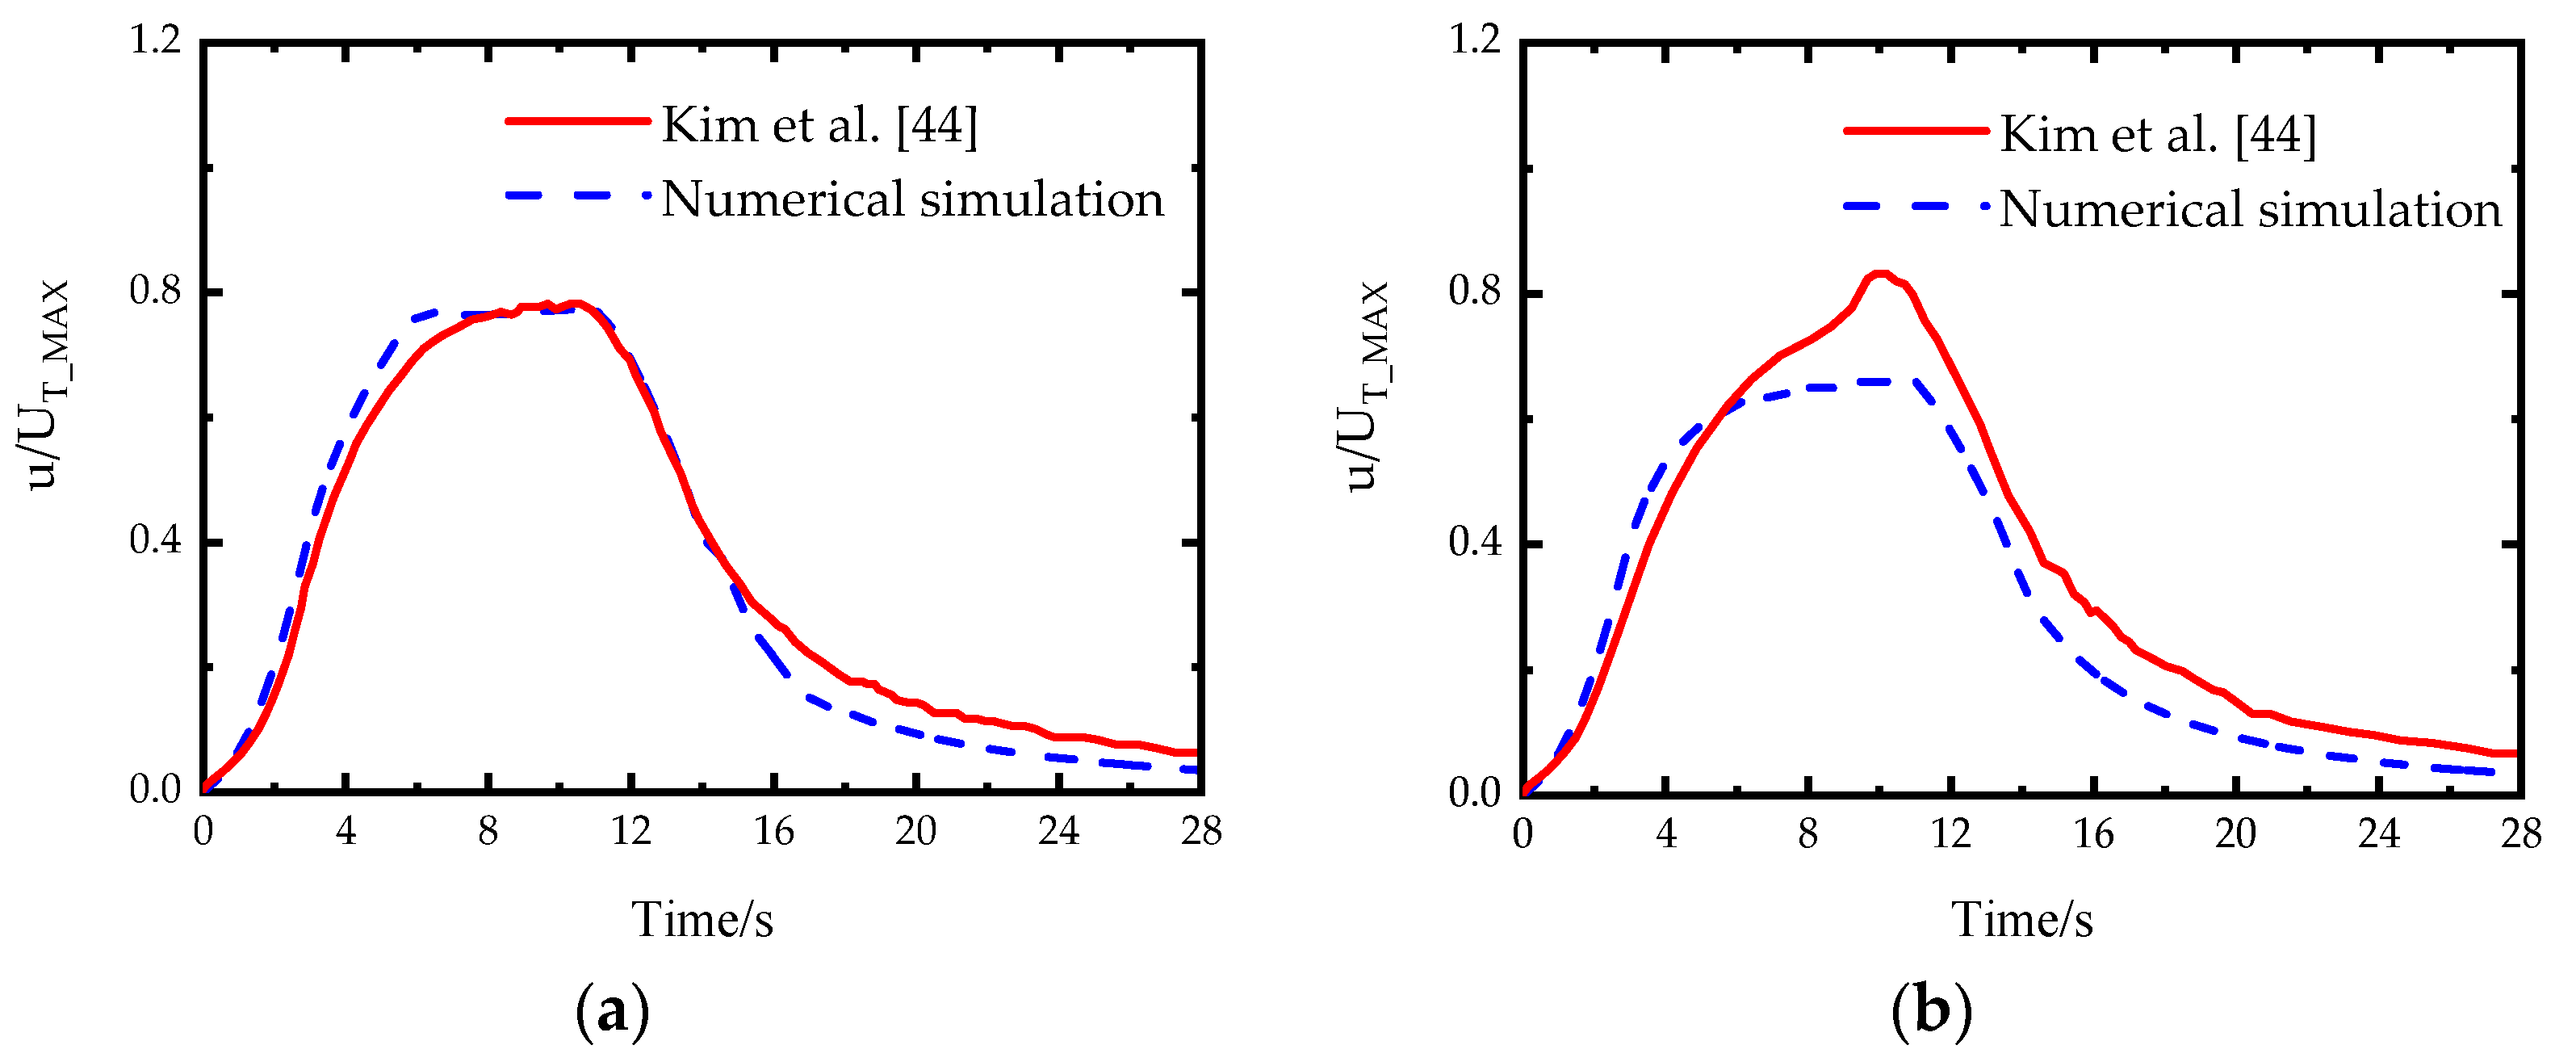
3. Validation
4. Results and Discussion
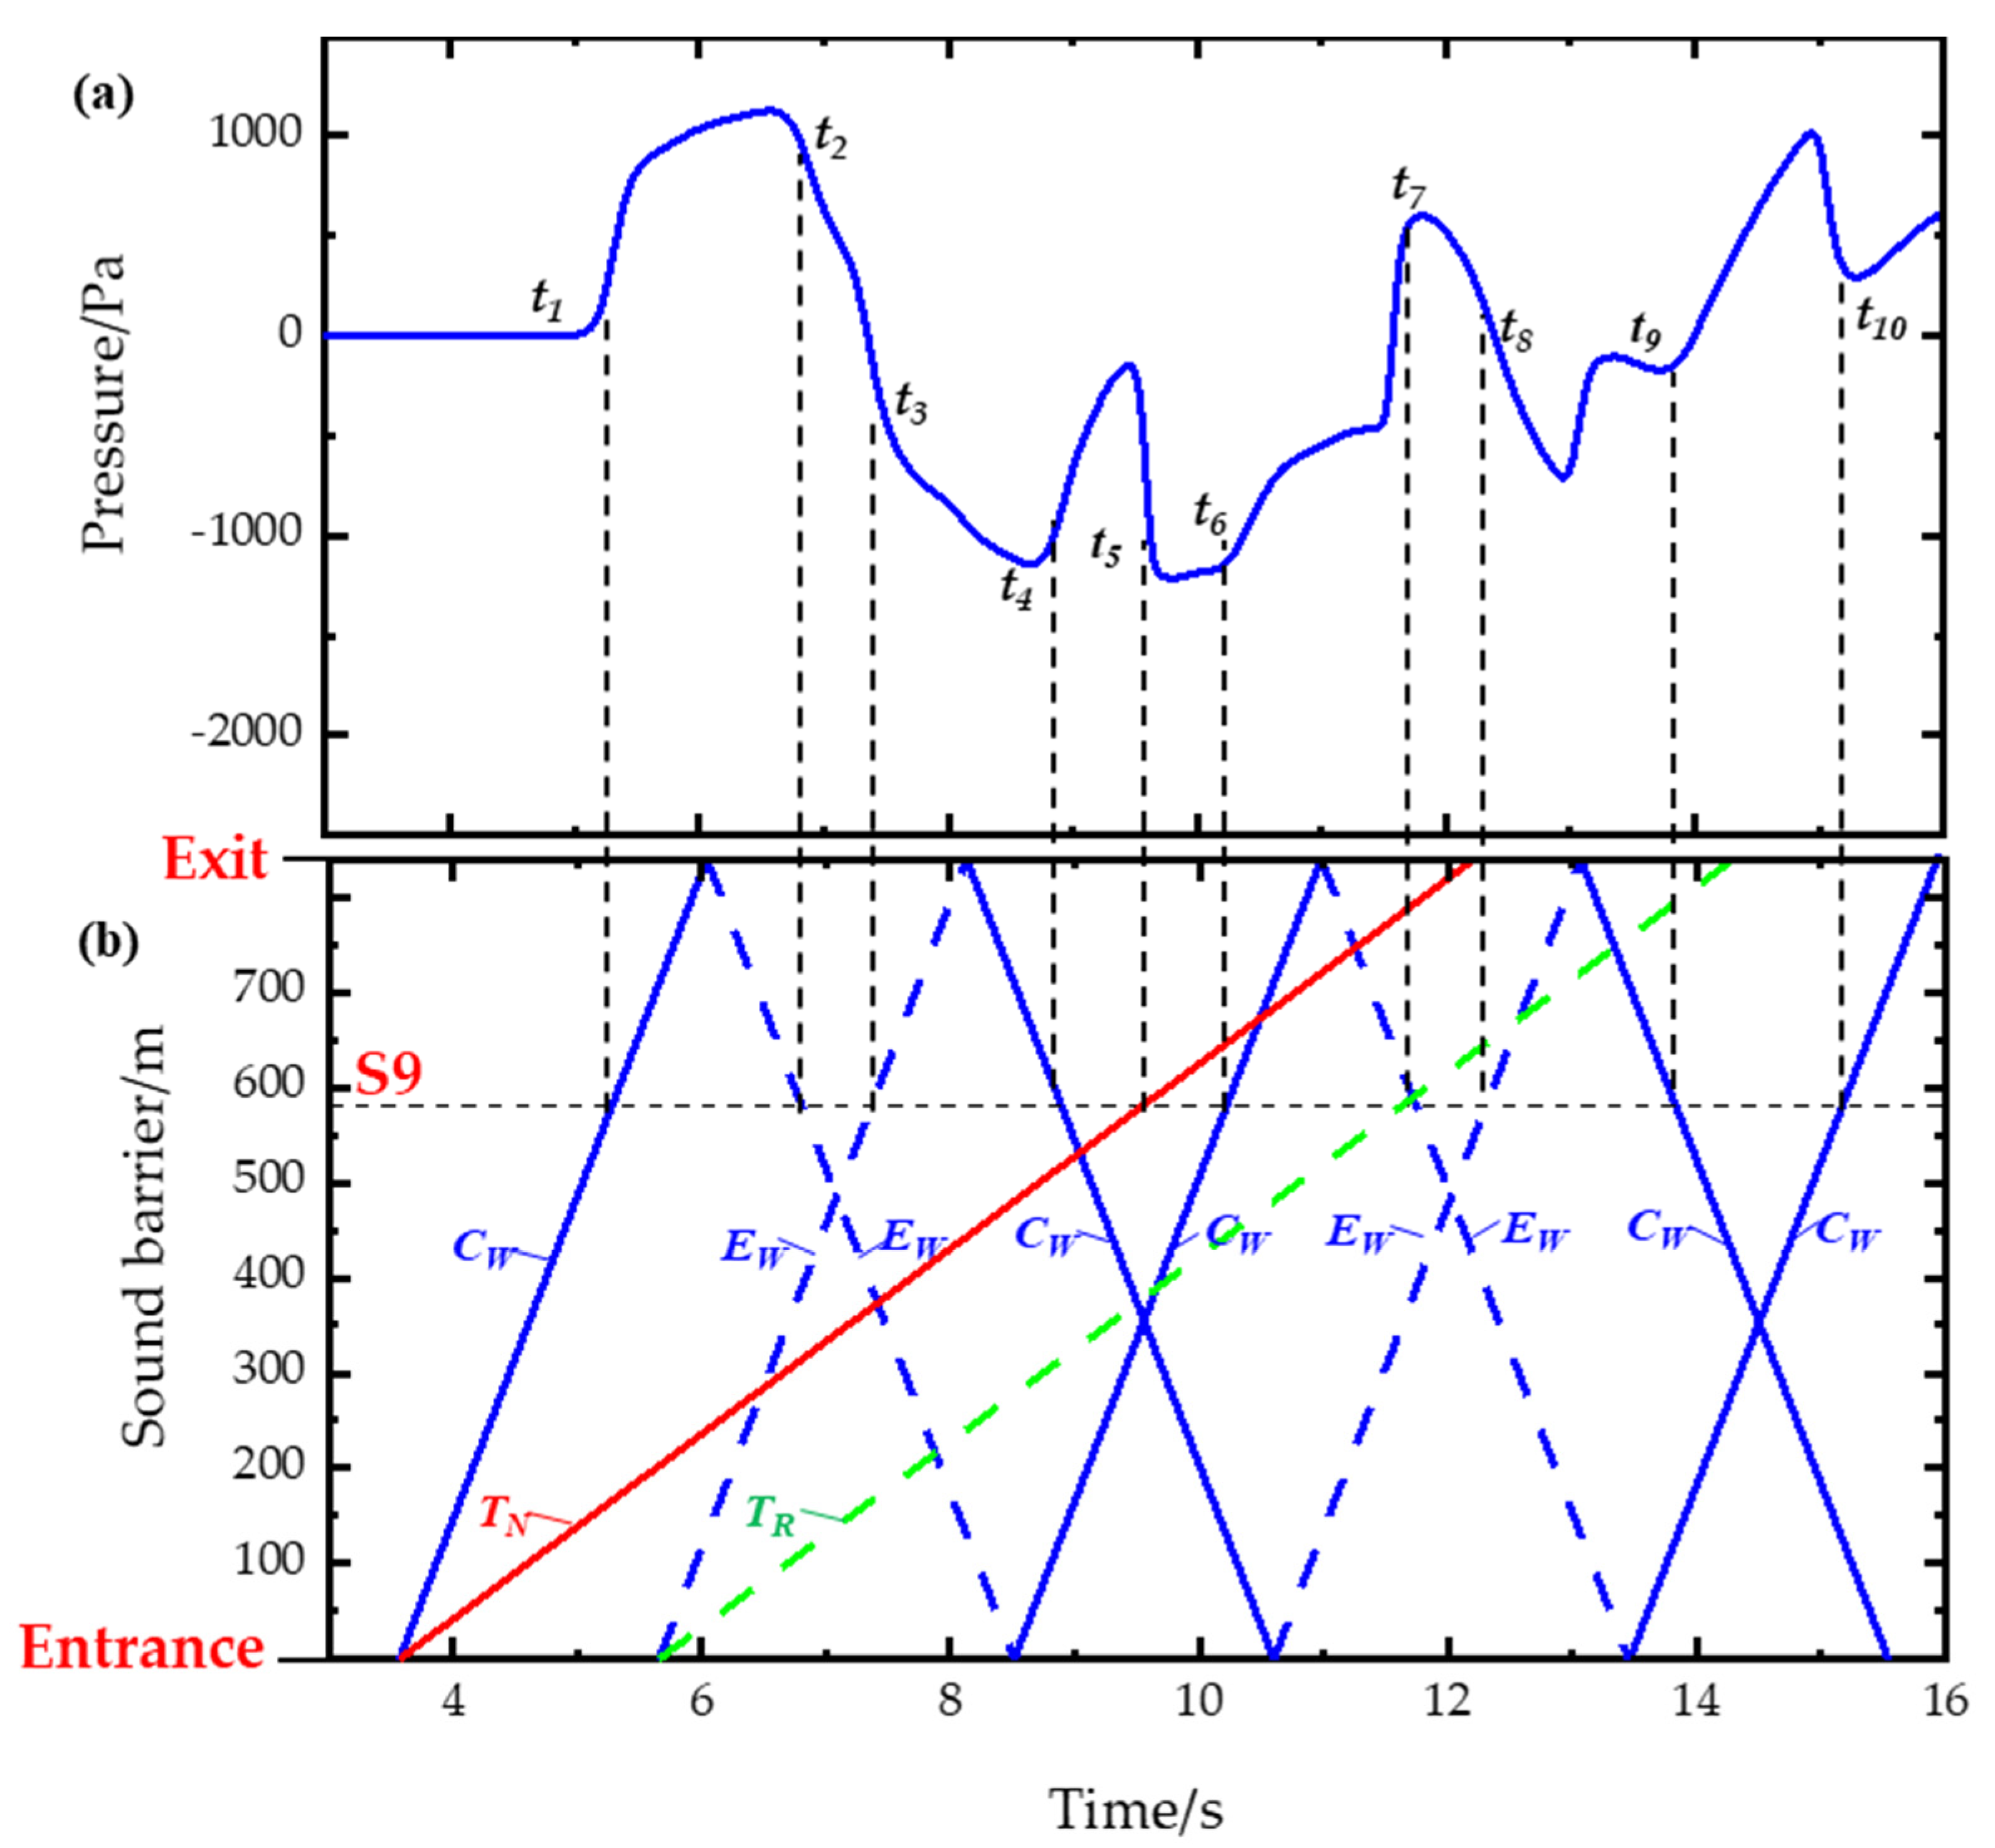
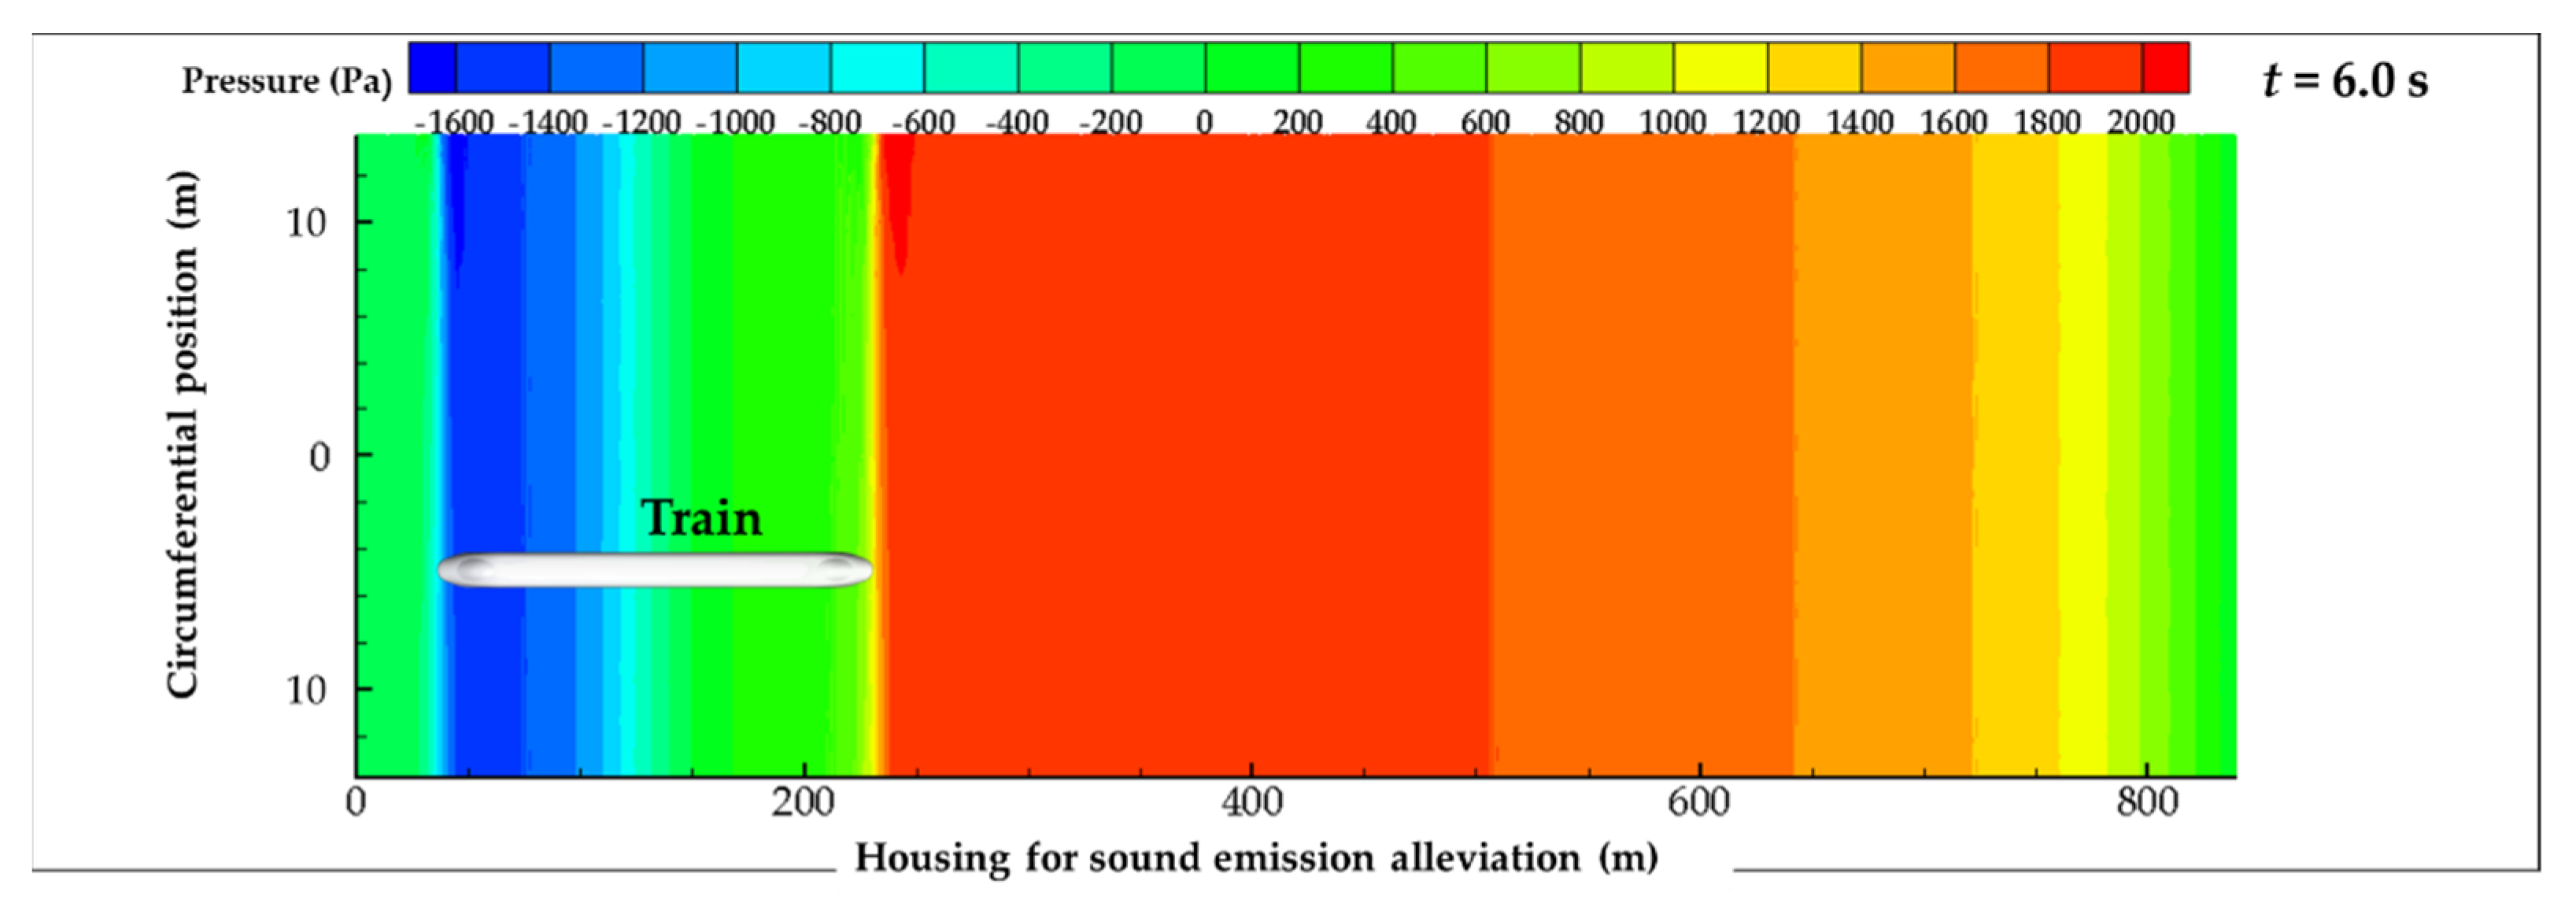
4.1. Wave Propagation
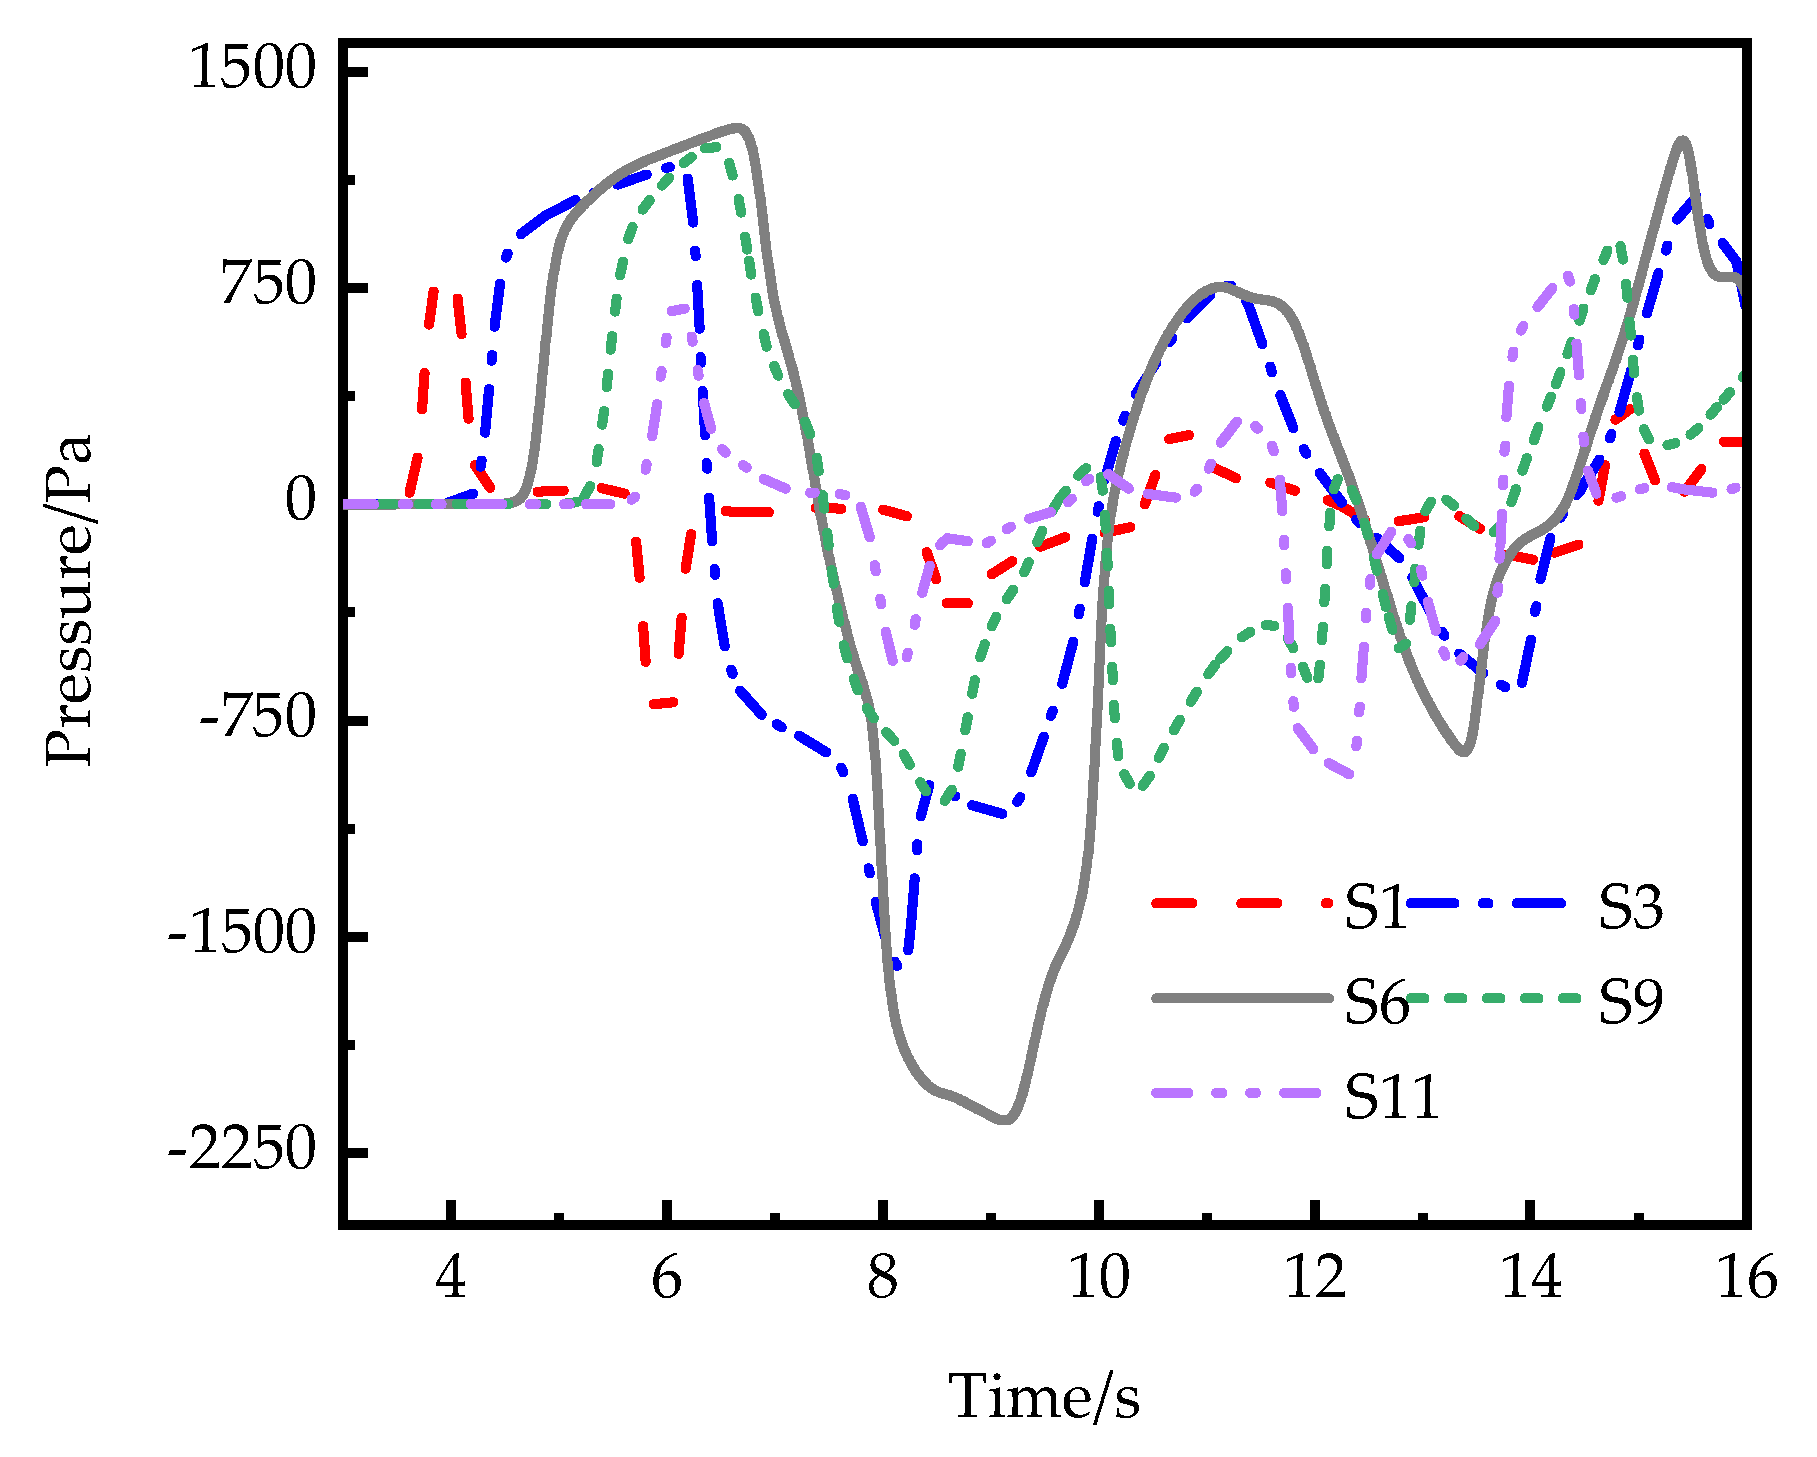
4.2. Extreme Pressure, Duration of Extreme Pressure and Impact Effects
4.3. Dominant Frequency and Decay Rate of the Aerodynamic Pressure after the Train Exits
5. Conclusions
- (1)
- The unsteady aerodynamic pressure is complicated and aperiodic when the train is running in the enclosed housing for sound emission alleviation. The reasons for the variation in the aerodynamic pressure are clearly caused by the propagation of the aerodynamic pressure wave, similar to that in a tunnel.
- (2)
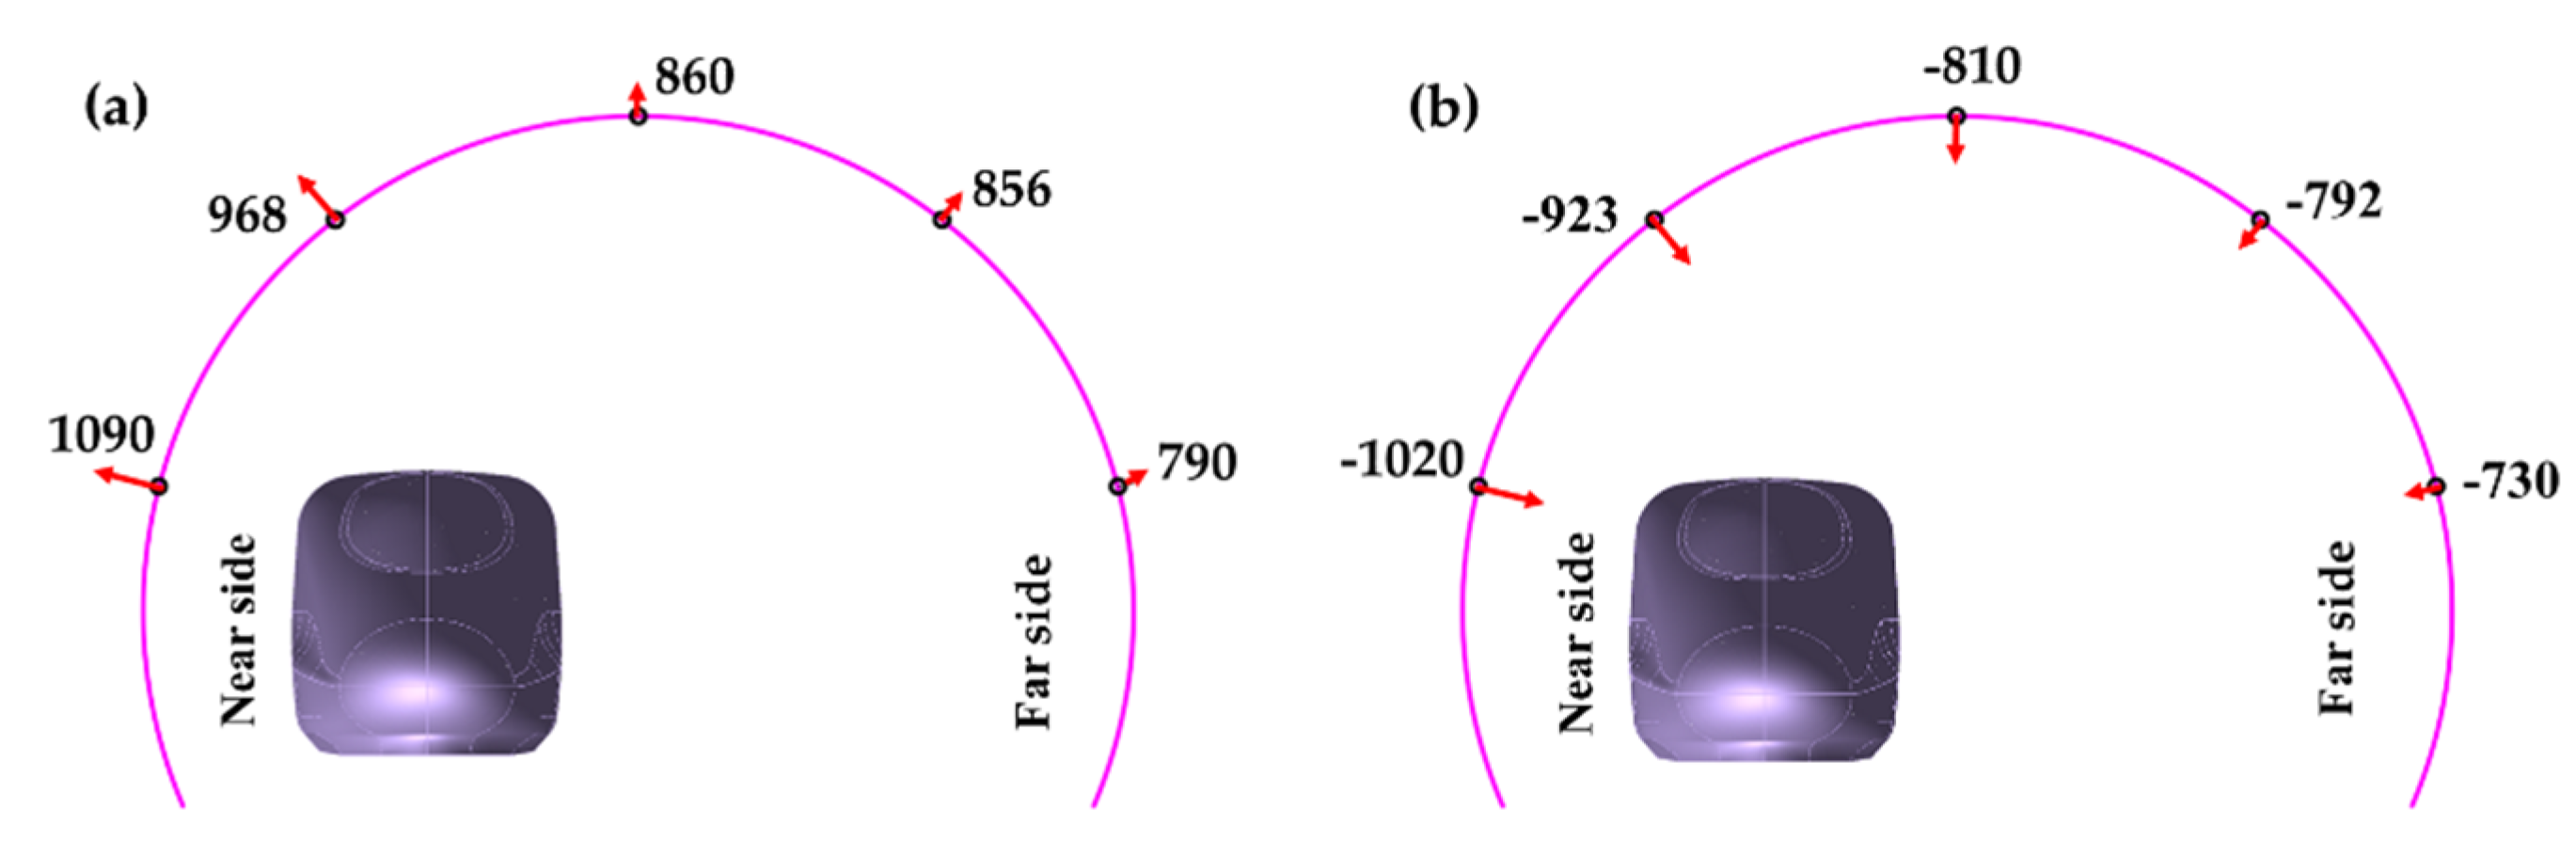
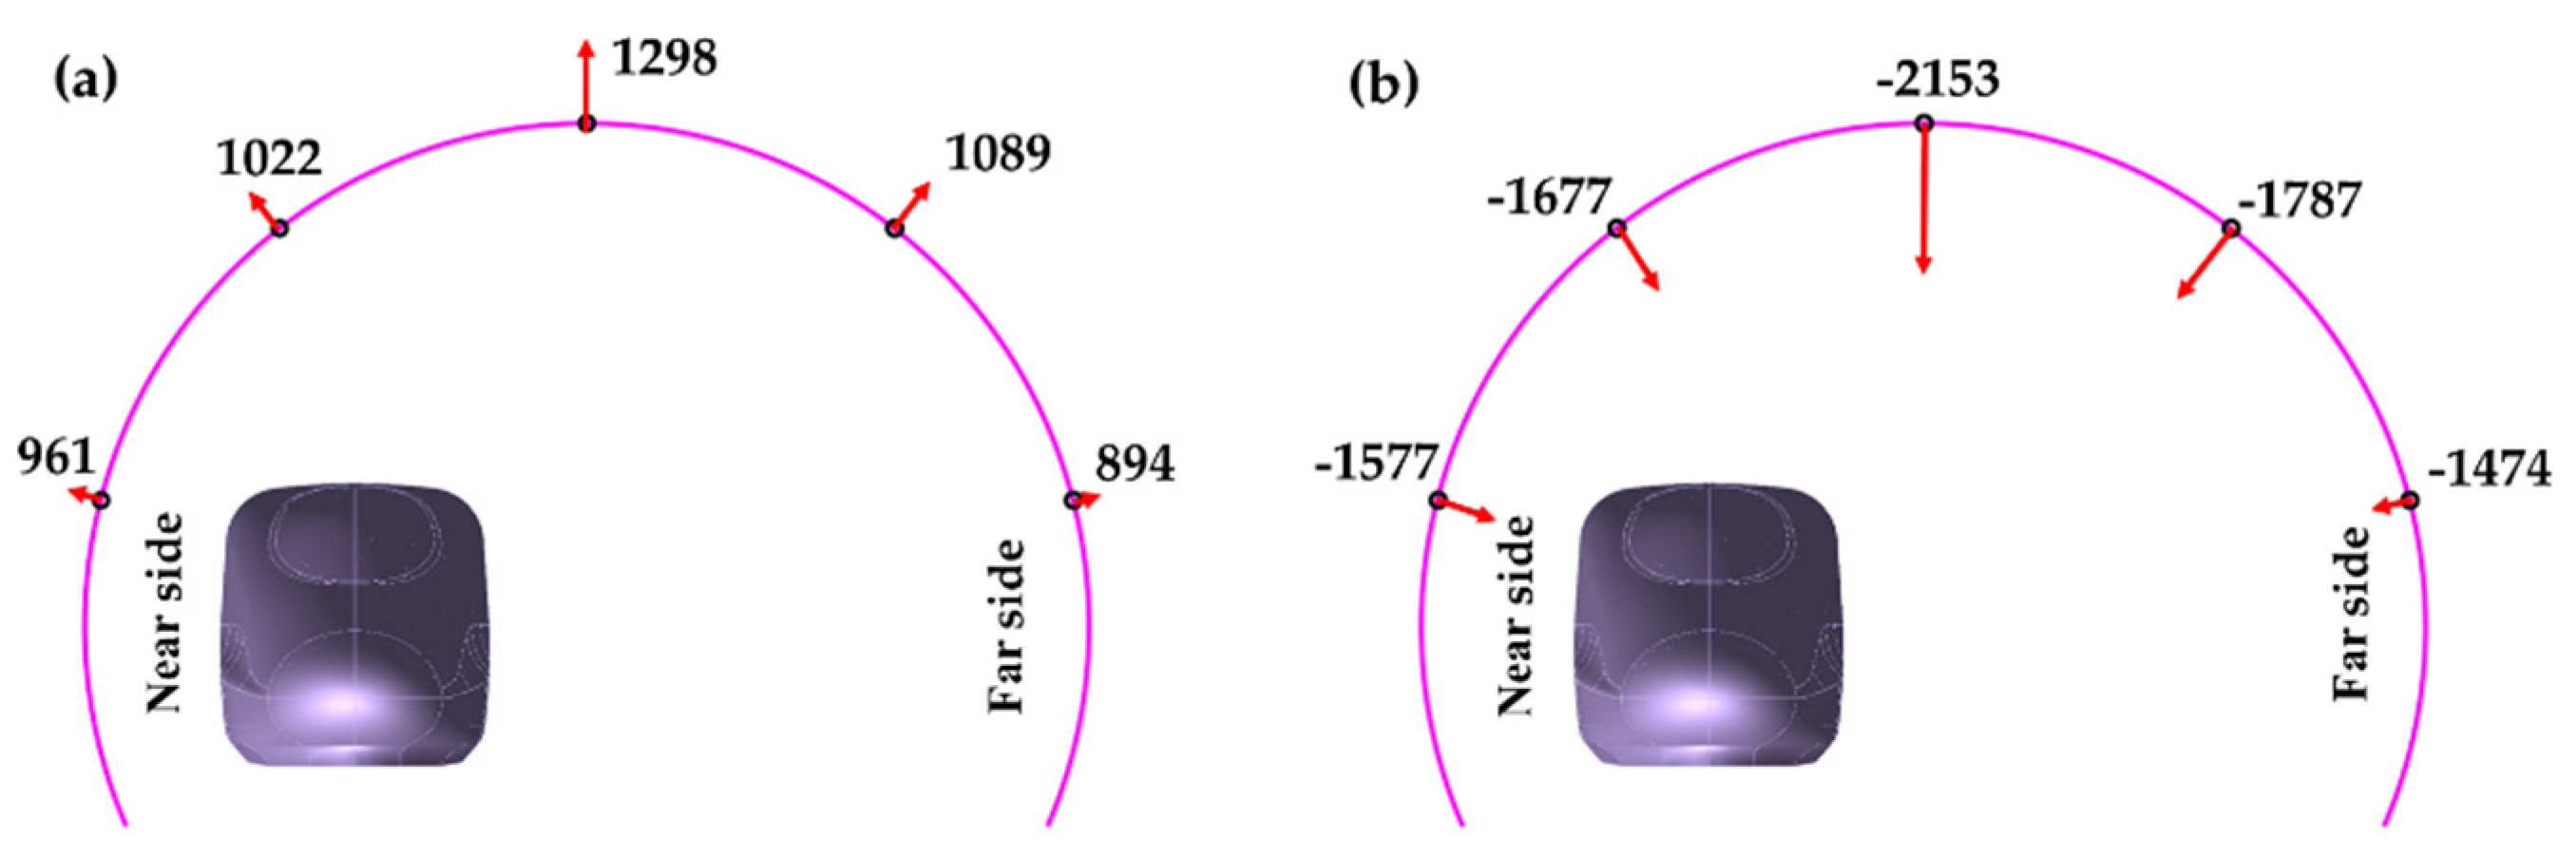
- The extreme aerodynamic pressure at the central region is always higher than those close to the entrance and exit. In particular, negative and positive extreme pressures appearing in the middle section are −2153 Pa and 1298 Pa, respectively. The maximum peak-to-peak pressure is 3451 Pa.
- (3)
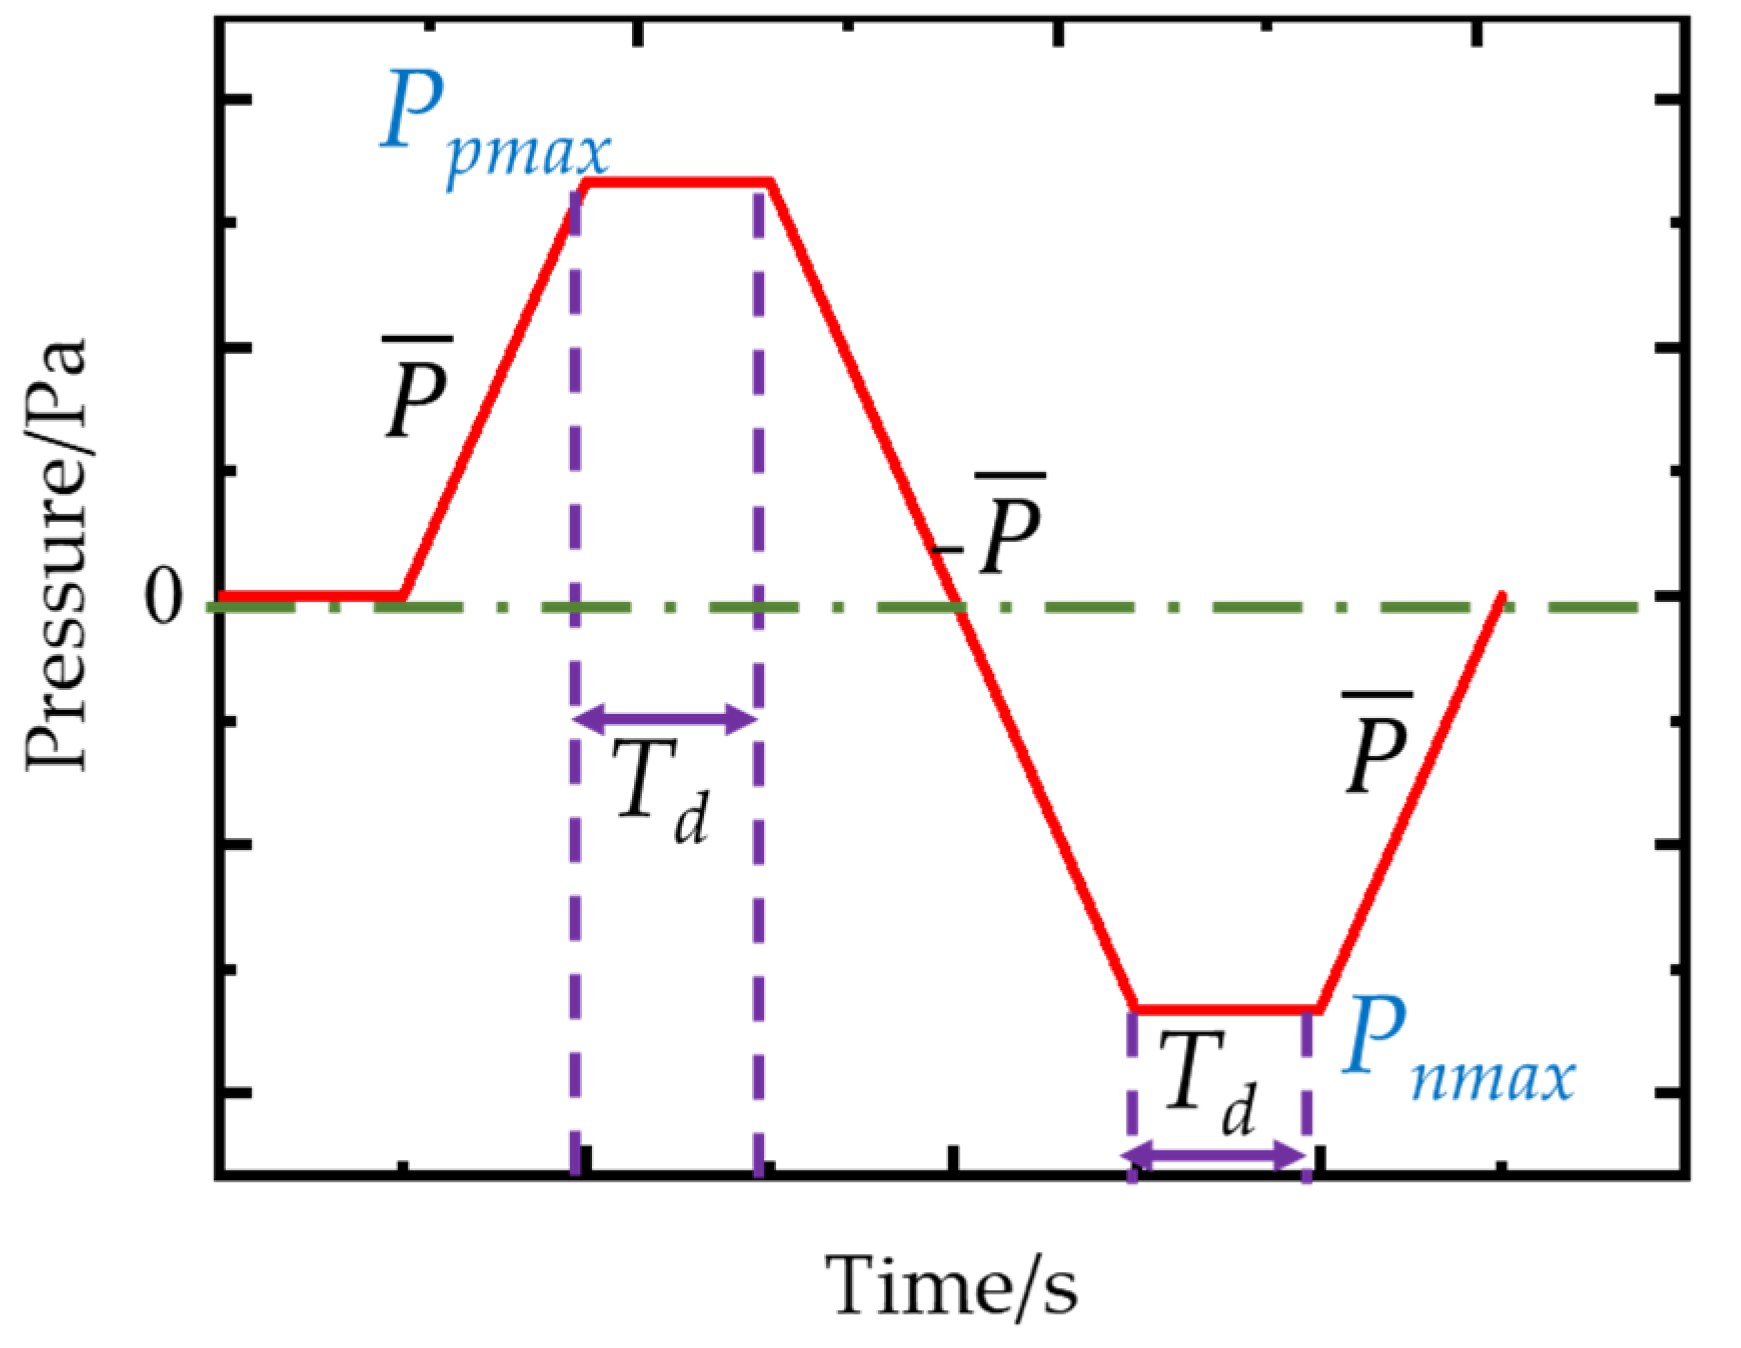
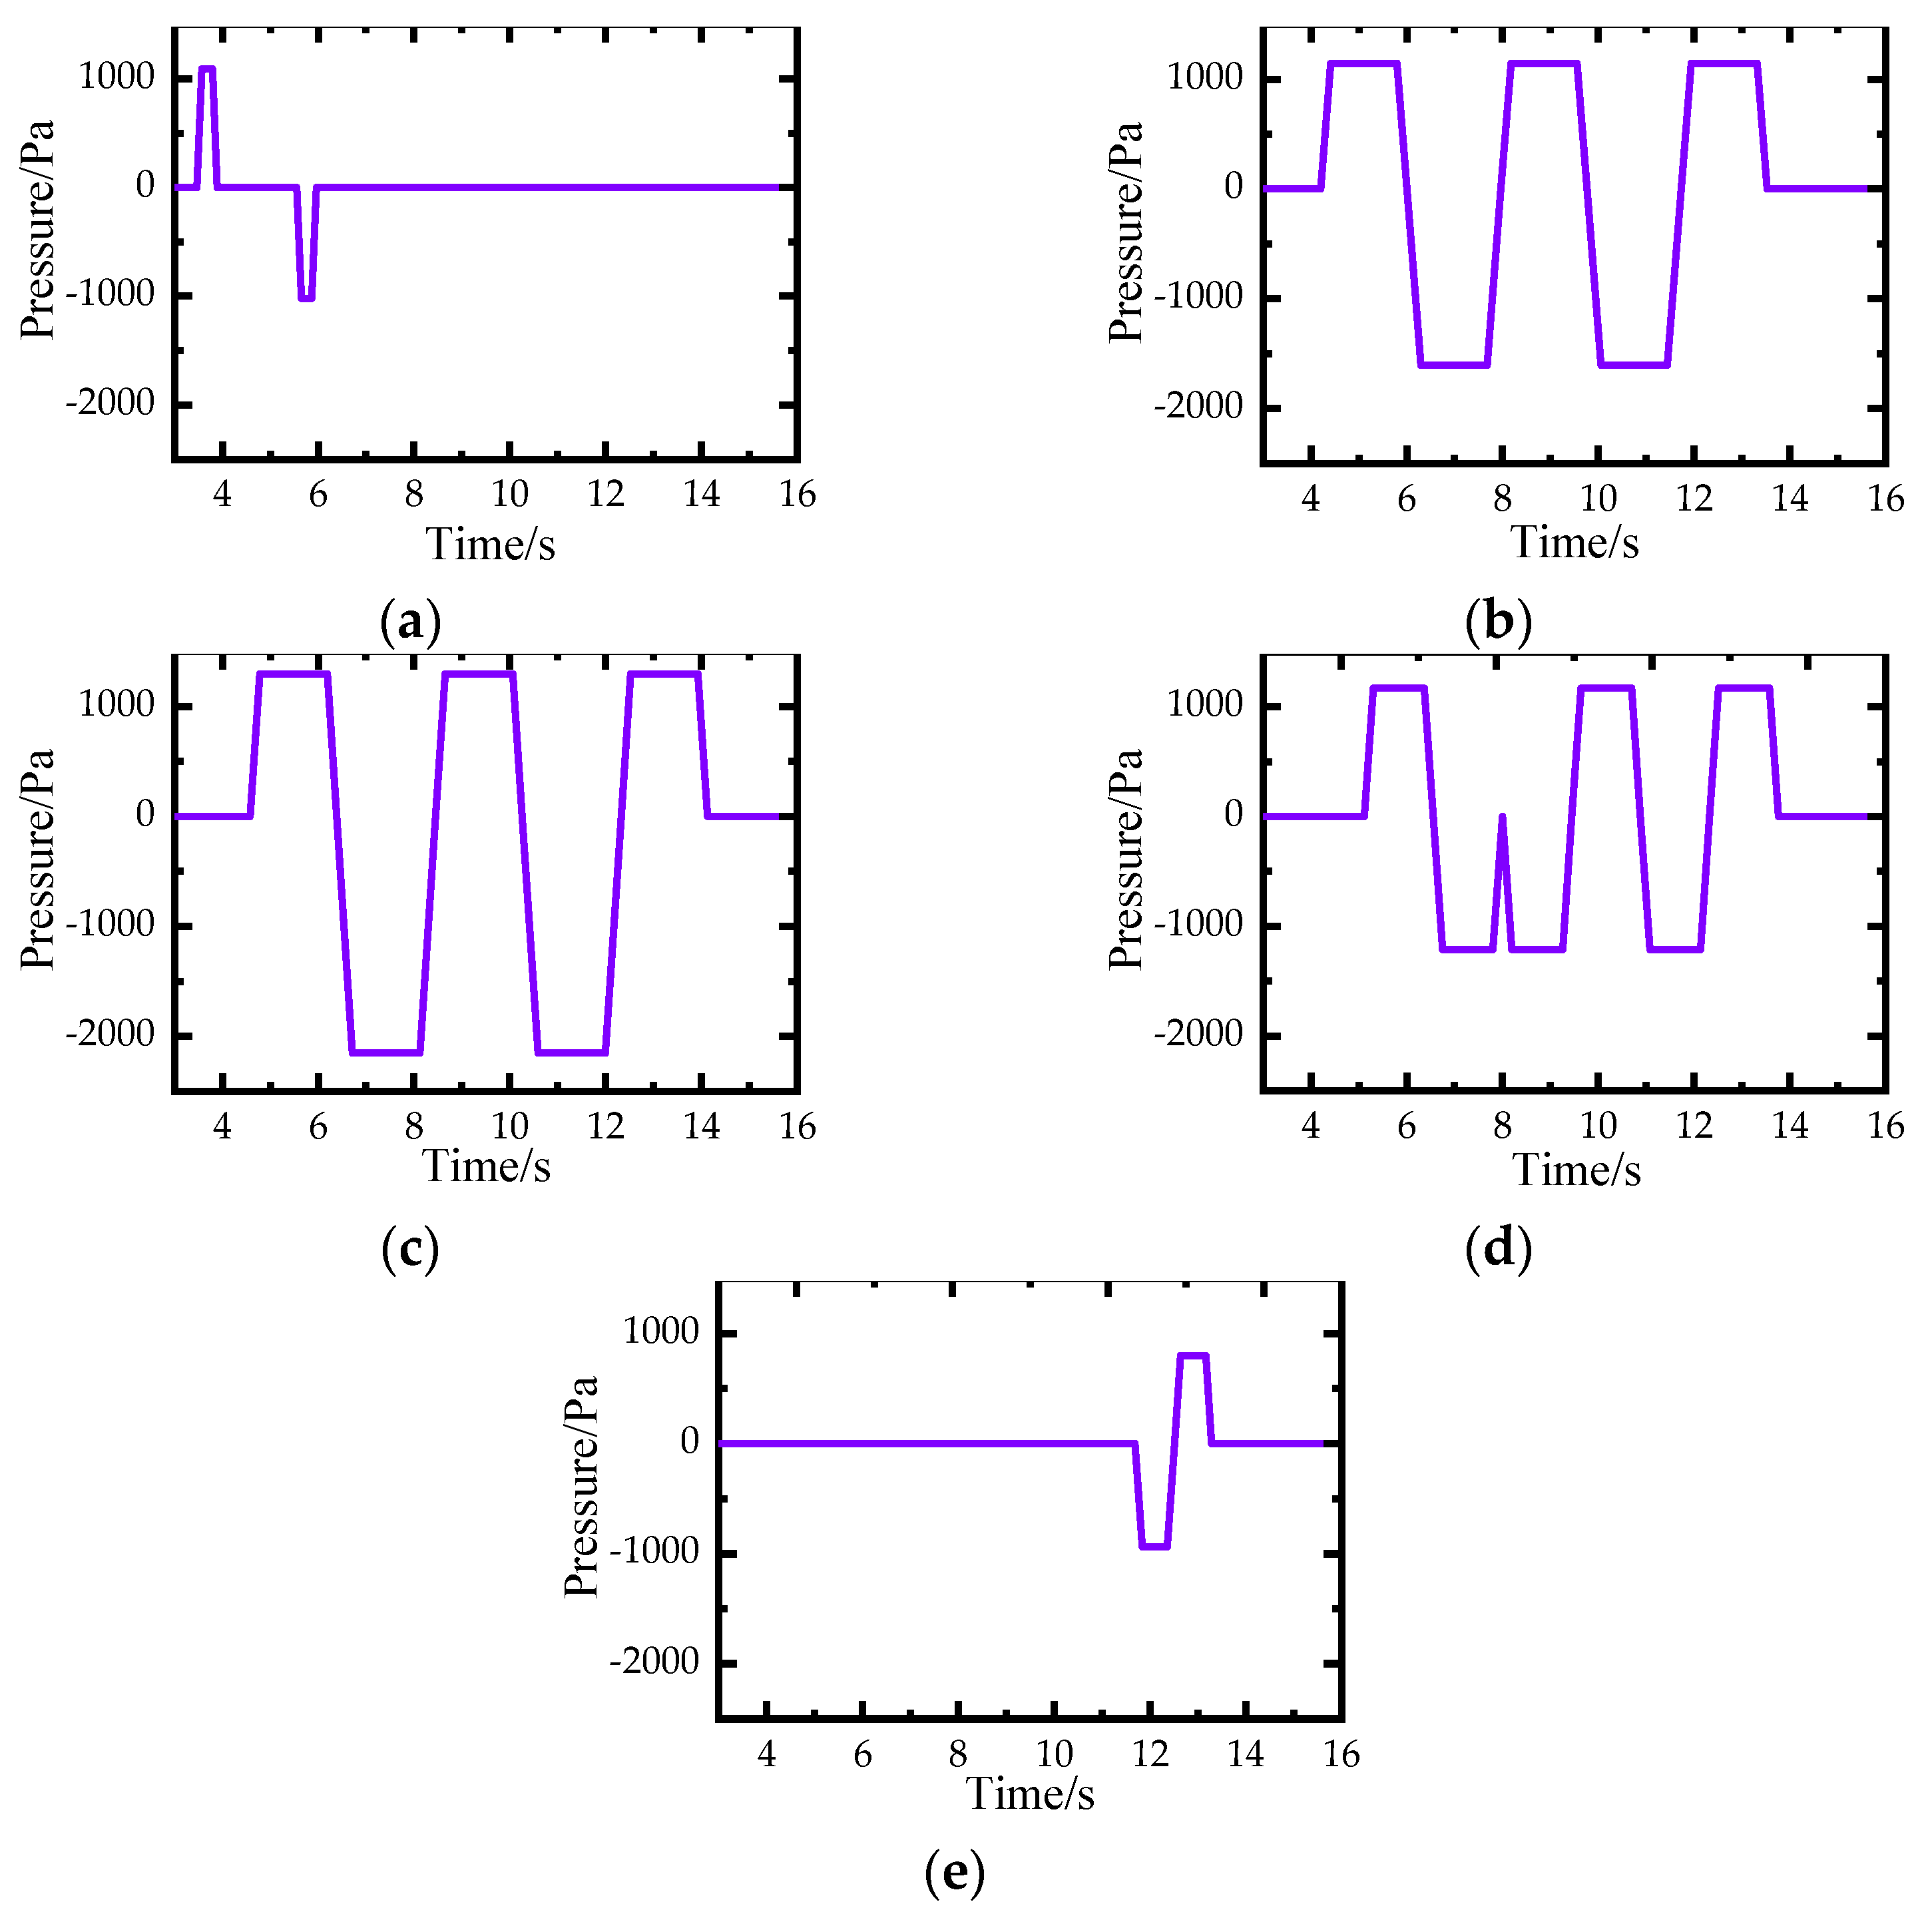
- To further quantify the dynamic characteristics of the train-induced aerodynamic pressure on the housing for sound emission alleviation, an ideal model of aerodynamic pressure is proposed using the duration of the extreme aerodynamic pressure and the pressure change rate. The longest duration of the extreme aerodynamic pressure appears in the middle section, and the highest pressure change rate occurs at the entrance section. In other sections, the pressure change rate is relatively close. The ideal model is much simpler than the original aerodynamic pressure and can be adopted to calculate the structural responses of the housing for sound emission alleviation. The rationality of the parameters in the ideal model needs further studies.
- (4)
- For the special enclosed housing for sound emission alleviation, the longest durations of the positive and negative extreme aerodynamic pressures are calculated as 1.41 s and 1.04 s, respectively. The highest positive and negative pressure change rates are calculated as 9.881 kPa/s and −10.415 kPa/s, respectively. In other sections, the average pressure change rate is calculated as 5.4 kPa/s and −5.9 kPa/s.
- (5)
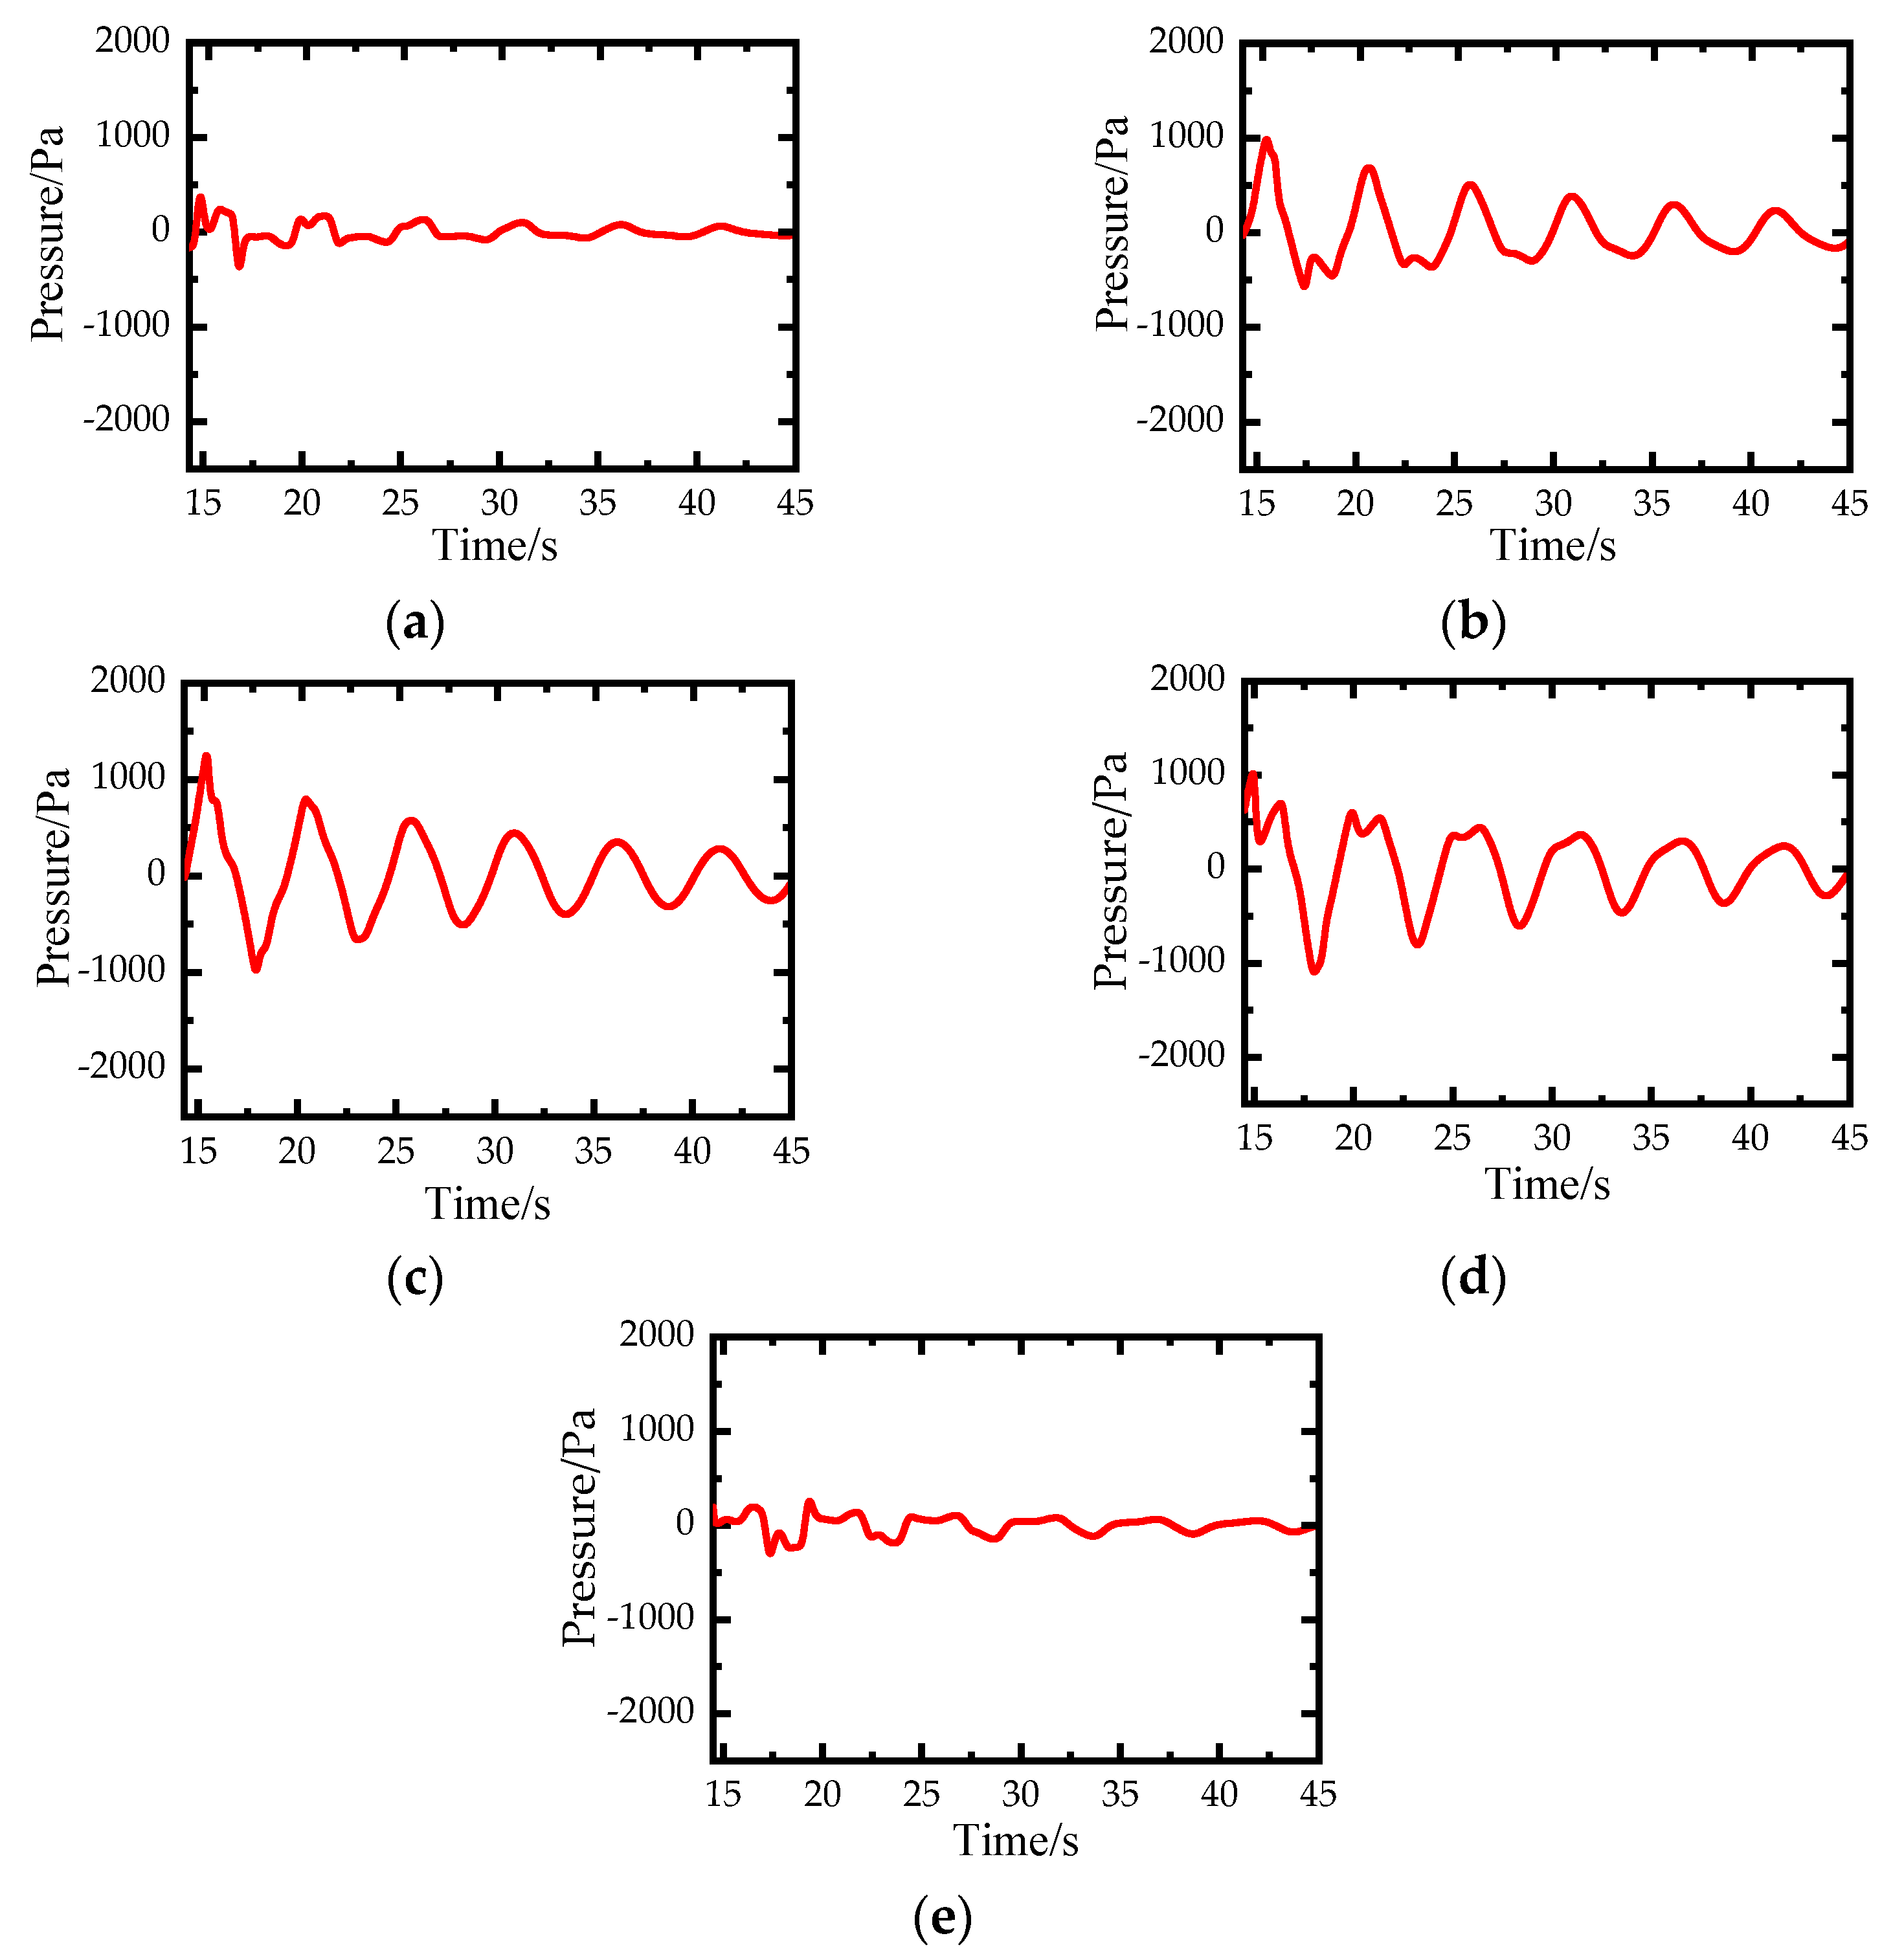
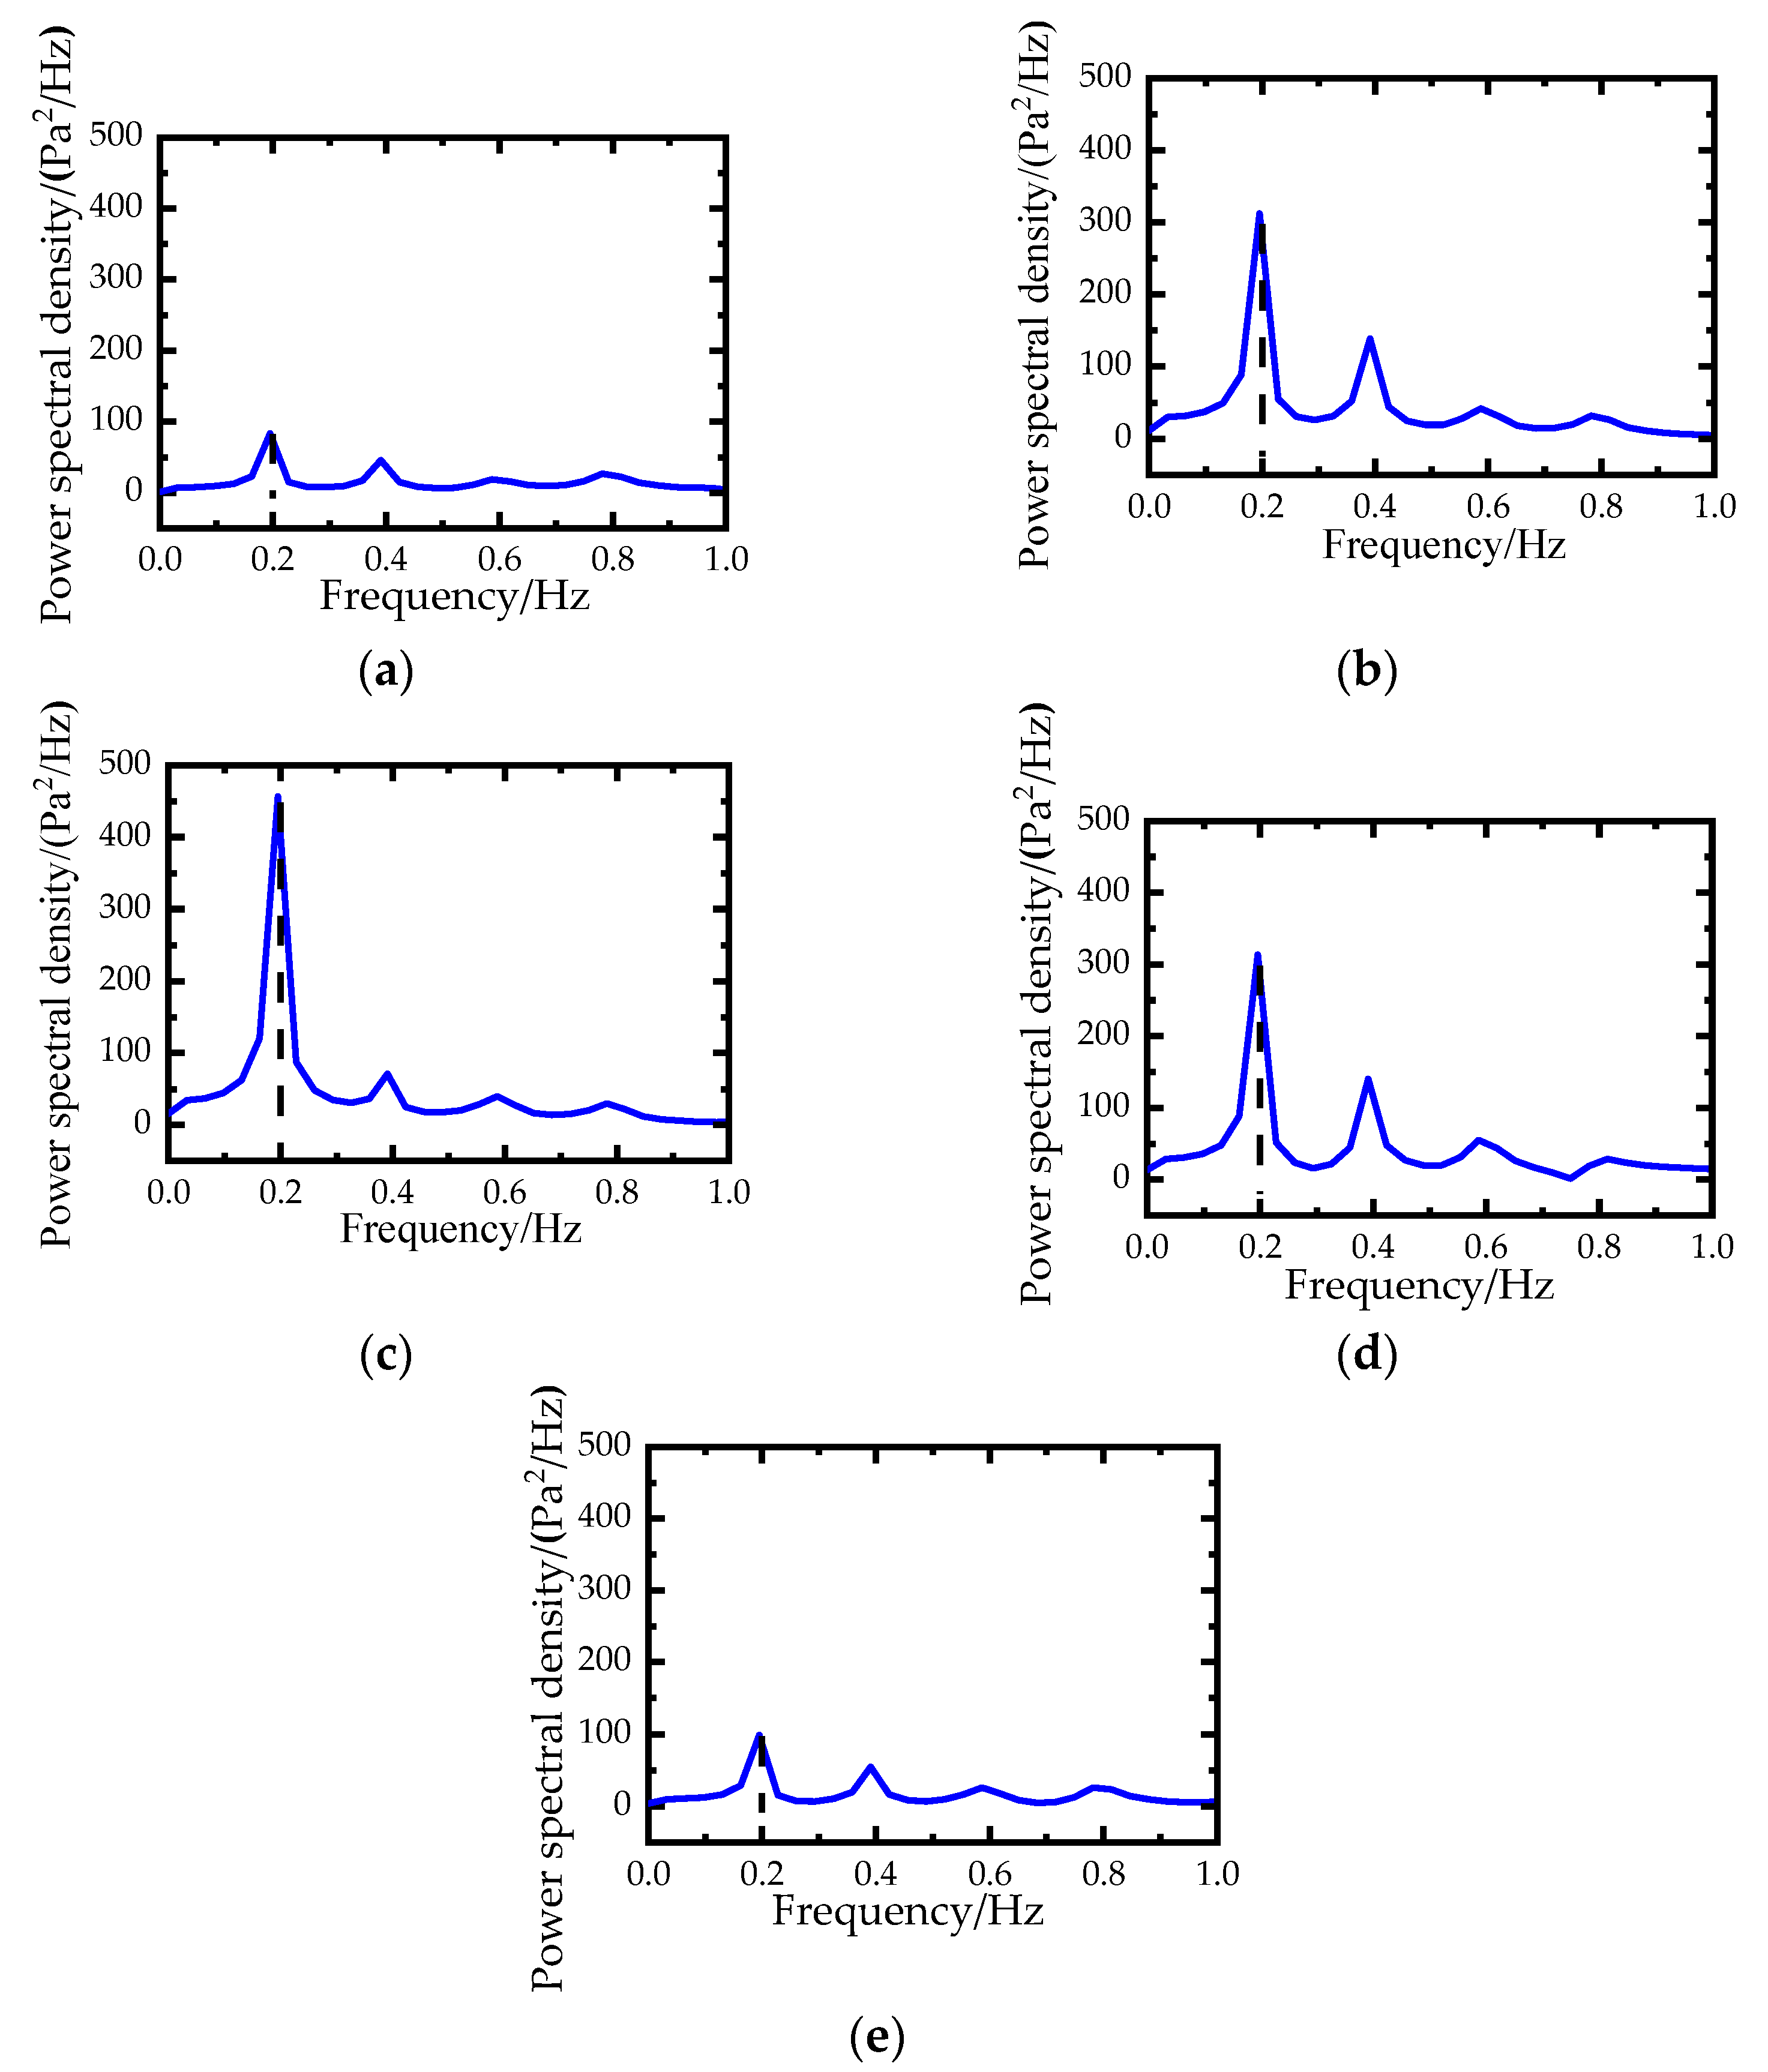
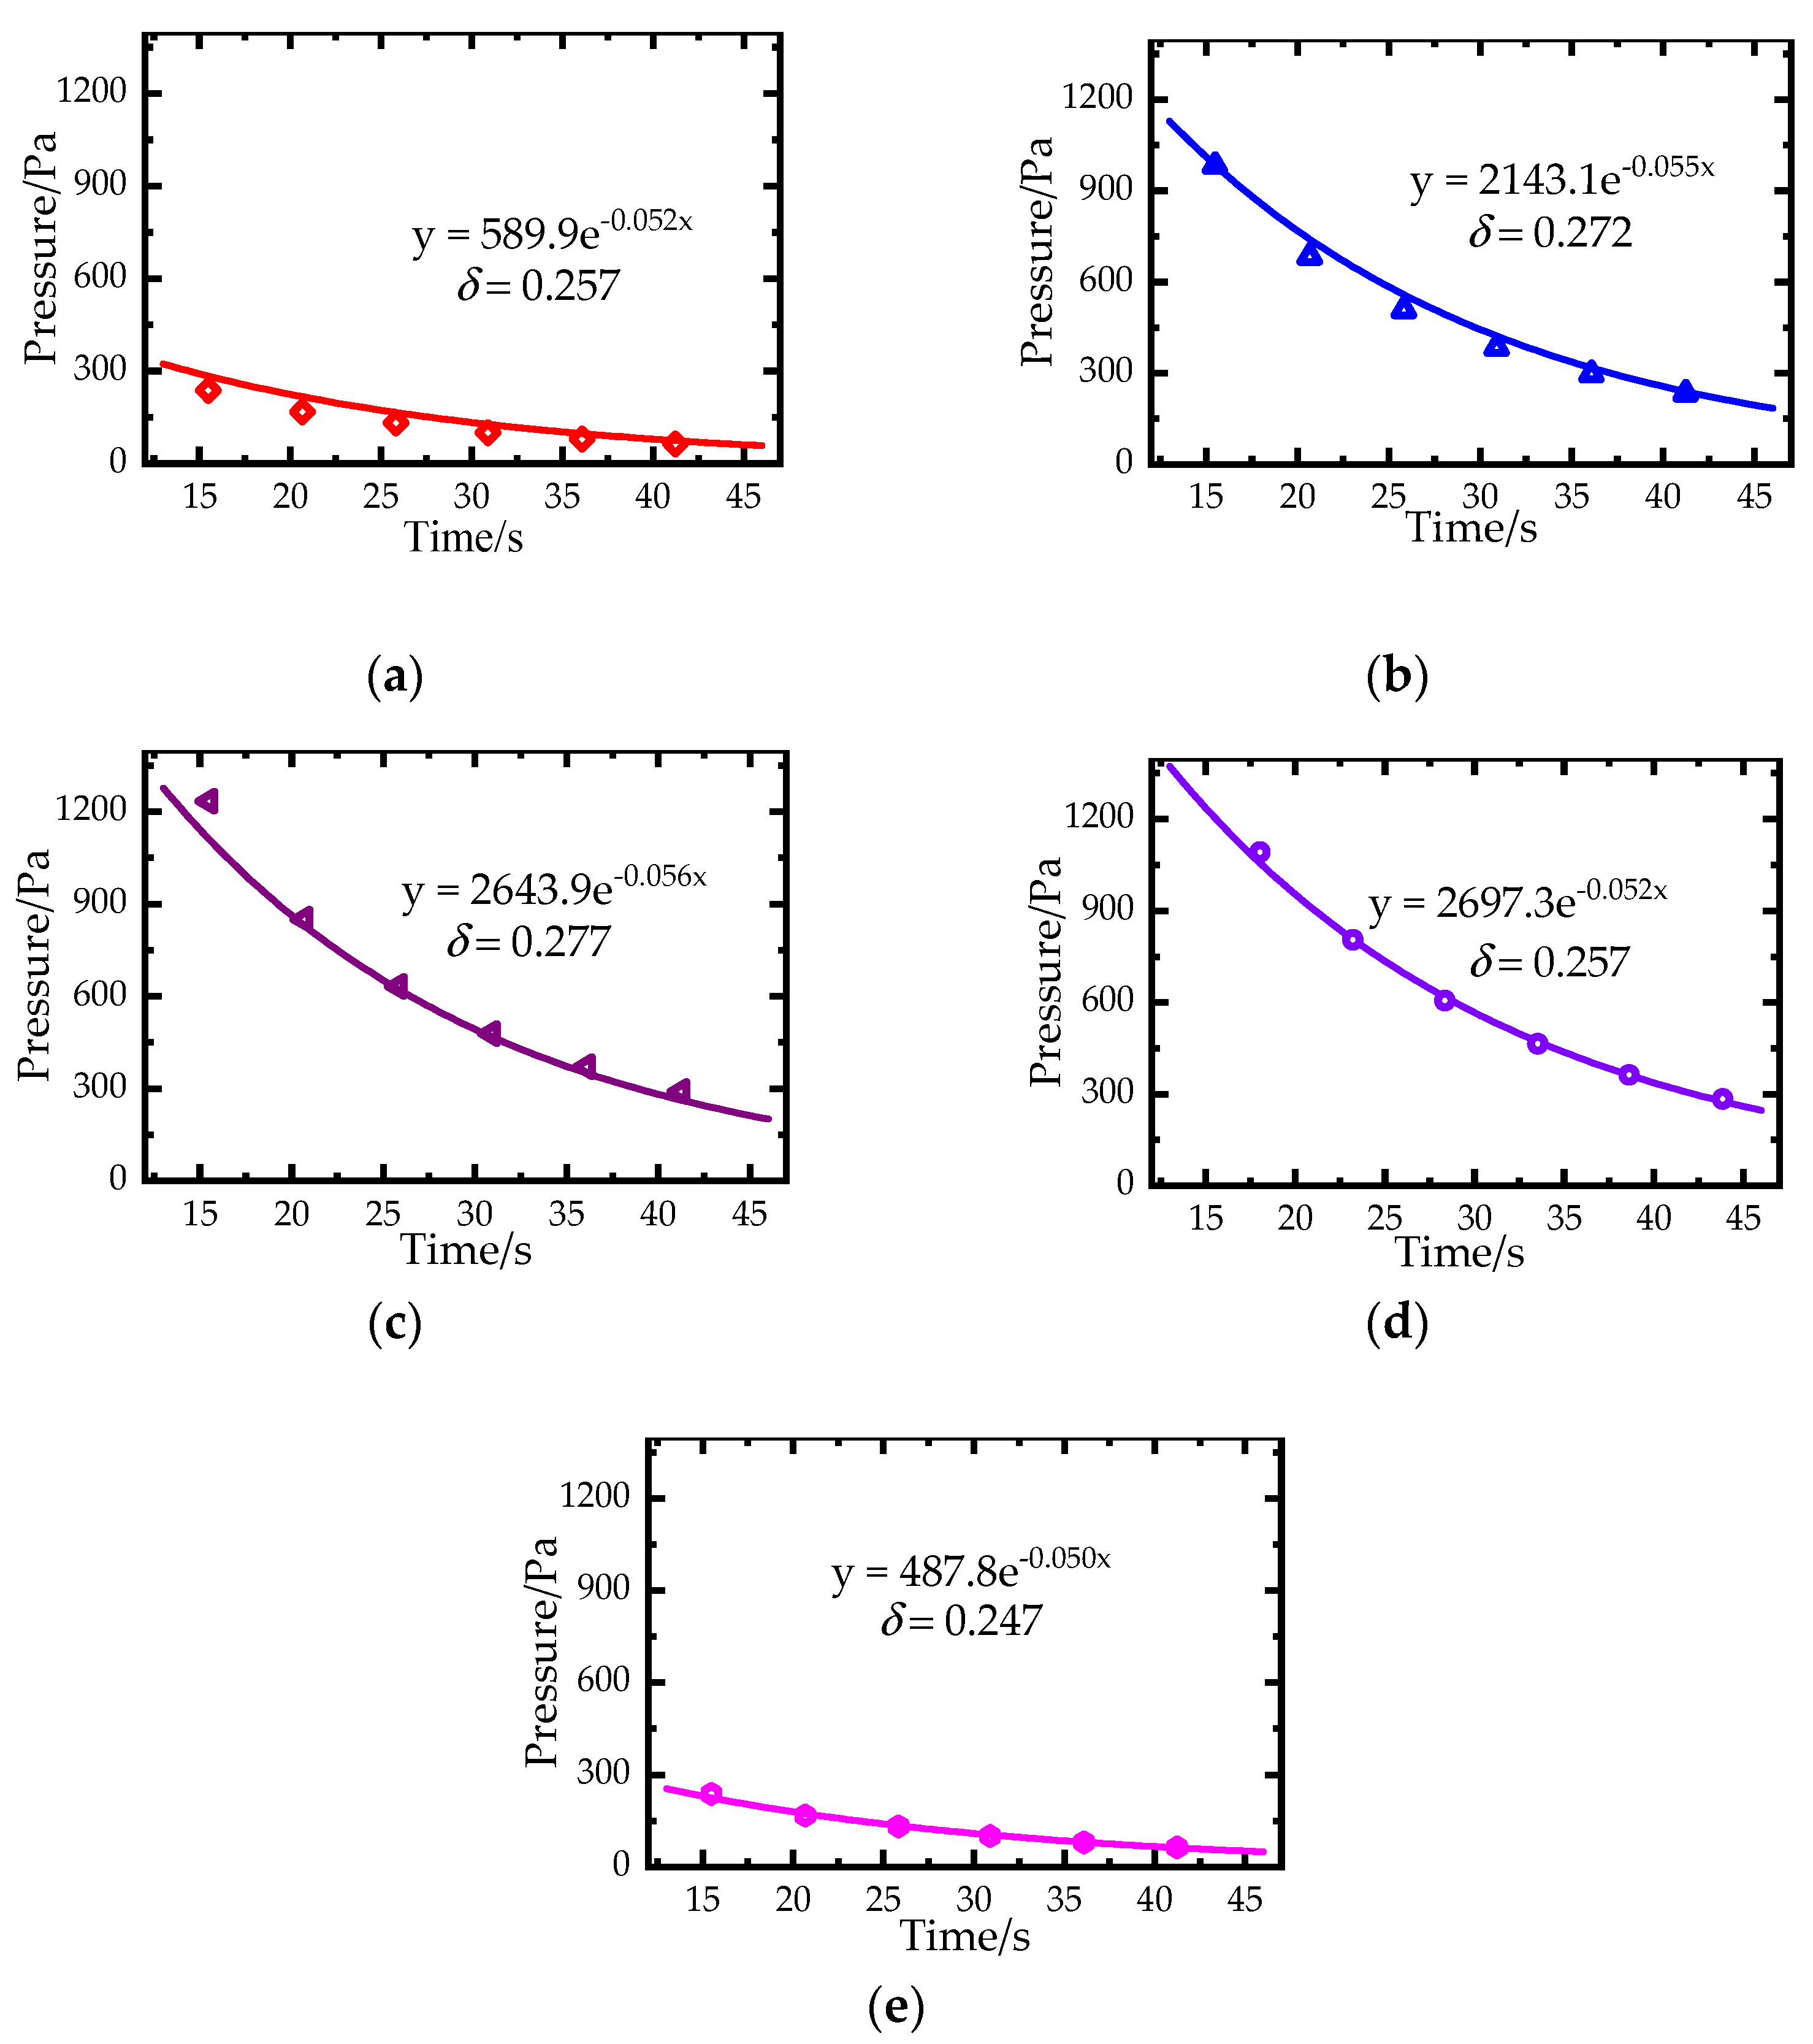
- After the train exits the housing for sound emission alleviation, the aerodynamic pressure reverts to periodic decay curves. The pressure amplitude at the central region is always higher than those close to the entrance/exit. To better understand the aerodynamic pressure in this process, the dominant frequency and decay rate are proposed to express the dynamic characteristics. For the special enclosed housing for sound emission alleviation, the dominant frequency is identified as 0.2 Hz, and the decay rate is calculated as 0.262.
Author Contributions
Funding
Institutional Review Board Statement
Informed Consent Statement
Data Availability Statement
Conflicts of Interest
References
- Planning Engineering Consulting + Services China Ltd. Consultation Report of the Noise Barriers in Chinese Railway Passenger Dedicated Line. 2007.
- Baker, C.; Jordan, S.; Gilbert, T.; Quinn, A.; Sterling, M.; Johnson, T.; Lane, J. Transient aerodynamic pressures and forces on trackside and overhead structures due to passing trains. Part 1: Model scale experiments; Part 2: Standards applications. Proc. Inst. Mech. Eng. Part F J. Rail Rapid Transit 2014, 228, 37–70. [Google Scholar] [CrossRef]
- Lü, M.; Li, Q.; Ning, Z.; Ji, Z. Study on the aerodynamic load characteristic of noise reduction barrier on high-speed railway. J. Wind. Eng. Ind. Aerodyn. 2018, 176, 254–262. [Google Scholar] [CrossRef]
- Xiong, X.H.; Li, A.H.; Liang, X.F.; Zhang, J. Field study on high-speed train induced fluctuating pressure on a bridge noise barrier. J. Wind. Eng. Ind. Aerodyn. 2018, 177, 157–166. [Google Scholar] [CrossRef]
- Soper, D.; Gillmeier, S.; Baker, C.; Morgan, T.; Vojnovic, L. Aerodynamic forces on railway acoustic barriers. J. Wind. Eng. Ind. Aerodyn. 2019, 191, 266–278. [Google Scholar] [CrossRef]
- Kikuchi, K.; Iida, M.; Takasaki, T.; Takami, H. Field Measurement of Wayside Low-Frequency Noise Emitted from Tunnel Portals and Trains of High-Speed Railway. J. Low Freq. Noise Vib. Act. Control 2005, 24, 219–231. [Google Scholar] [CrossRef]
- Fukuda, T.; Ozawa, S.; Iida, M.; Takaski, T.; Wakabayashi, Y. Distortion of compression wave propagating through very long tunnel with slab tracks. JSME Int. J. Ser. B 2006, 49, 1156–1164. [Google Scholar] [CrossRef]
- Liu, T.H.; Tian, H.Q.; Jin, X.S. Experimental study of full-scale train on aerodynamics in tunnel. Acat. Aerodyn. Sin. 2008, 26, 42–46. (In Chinese) [Google Scholar]
- Liu, T.H.; Tian, H.Q.; Liang, X.F. Aerodynamic Effects Caused by Trains Entering Tunnels. J. Transp. Eng. 2010, 136, 846–853. [Google Scholar] [CrossRef]
- Liu, T.H.; Chen, X.D.; Li, W.H.; Xie, T.Z.; Chen, Z.W. Field study on the interior pressure variations in high-speed trains passing through tunnels of different lengths. J. Wind. Eng. Ind. Aerodyn. 2017, 169, 54–66. [Google Scholar] [CrossRef]
- Ko, Y.Y.; Chen, C.H.; Hoe, I.T.; Wang, S.T. Field measurements of aerodynamic pressures in tunnels induced by high speed trains. J. Wind. Eng. Ind. Aerodyn. 2012, 100, 19–29. [Google Scholar] [CrossRef]
- Iida, M.; Tanaka, Y.; Kikuchi, K.; Fukuda, T. Pressure waves radiated directly from tunnel portals at train entry or exit. Q. Rep. RTRI 2001, 42, 83–88. (In Japanese) [Google Scholar] [CrossRef][Green Version]
- Bellenoue, M.; Moriniere, V.; Kageyama, T. Experimental 3-D Simulation of the Compression Wave, due to Train-Tunnel Entry. J. Fluid Struct. 2002, 16, 581–595. [Google Scholar] [CrossRef]
- Winslow, A.; Howe, M.S.; Iida, M. Influence of a Scarfed Portal on the Compression Wave Generated by a High-Speed Train Entering a Tunnel. J. Low Freq. Nois. 2009, 24, 203–217. [Google Scholar] [CrossRef]
- Iida, M.; Kikuchi, K.; Fukuda, T. Analysis and Experiment of Compression Wave Generated by Train Entering Tunnel Entrance Hood. JSME Int. J. Ser. B 2006, 49, 761–770. [Google Scholar] [CrossRef]
- Ricco, P.; Baron, A.; Molteni, P. Nature of pressure waves induced by a high-speed train travelling through a tunnel. J. Wind. Eng. Ind. Aerodyn. 2007, 95, 781–808. [Google Scholar] [CrossRef]
- Doi, T.; Ogawa, T.; Masubuchi, T.; Kaku, J. Development of an experimental facility for measuring pressure waves generated by high-speed trains. J. Wind. Eng. Ind. Aerodyn. 2010, 98, 55–61. [Google Scholar] [CrossRef]
- Heine, D.; Ehrenfried, K. Experimental Study of the Pressure Rise due to Tunnel Entry of a High-Speed Train. In Proceedings of the 18th STAB/DGLR Symposium, Stuttgart, Germany, 1 January 2014. [Google Scholar]
- Yang, Q.S.; Song, J.H.; Yang, G.W. A moving model rig with a scale ratio of 1/8 for high speed train aerodynamics. J. Wind. Eng. Ind. Aerodyn. 2016, 152, 50–58. [Google Scholar] [CrossRef]
- Zhang, L.; Yang, M.Z.; Niu, J.Q.; Liang, X.F.; Zhang, J. Moving model tests on transient pressure and micro-pressure wave distribution induced by train passing through tunnel. J. Wind. Eng. Ind. Aerodyn. 2019, 191, 1–21. [Google Scholar] [CrossRef]
- Ogawa, T.; Fujii, K. Numerical investigation of three-dimensional compressible flows induced by a train moving into a tunnel. Comput. Fluids. 1997, 26, 565–585. [Google Scholar] [CrossRef]
- Kwon, H.B.; Kim, T.Y.; Lee, D.H.; Kim, M.S. Numerical simulation of unsteady compressible flows induced by a high-speed train passing through a tunnel. Proc. Inst. Mech. Eng. Part F J. Rail Rapid Transit 2003, 217, 111–124. [Google Scholar] [CrossRef]
- Li, X.H.; Deng, J.; Chen, D.W.; Xie, F.F.; Zheng, Y. Unsteady simulation for a high-speed train entering a tunnel. J. Zhejiang Univ. Sci. A. 2011, 12, 957–963. [Google Scholar] [CrossRef]
- Uystepruyst, D.; William-Louis, M.; Monnoyer, F. 3D numerical design of tunnel hood. Tunn. Undergr. Space Technol. 2013, 38, 517–525. [Google Scholar] [CrossRef]
- Chu, C.R.; Chien, S.Y.; Wang, C.Y.; Wu, T.R. Numerical simulation of two trains intersecting in a tunnel. Tunn. Undergr. Space Technol. 2014, 42, 161–174. [Google Scholar] [CrossRef]
- Rabani, M.; Faghih, A.K. Numerical analysis of airflow around a passenger train entering the tunnel. Tunn. Undergr. Space Technol. 2015, 45, 203–213. [Google Scholar] [CrossRef]
- Liu, T.H.; Chen, Z.W.; Chen, X.D.; Xie, T.Z.; Zhang, J. Transient loads and their influence on the dynamic responses of trains in a tunnel. Tunn. Undergr. Space Technol. 2017, 66, 121–133. [Google Scholar] [CrossRef]
- Zhou, X.S.; Liu, T.H.; Chen, Z.W.; Zou, X.; Liu, D.R. Effect of ambient wind on pressure wave generated by high-speed train entering a tunnel. J. Cent. South Univ. 2017, 24, 1465–1475. [Google Scholar] [CrossRef]
- Li, W.H.; Liu, T.H.; Pedro, M.V.; Chen, Z.W.; Guo, Z.J.; Li, M.; Xia, Y.T.; Liu, H.K. Aerodynamic effects of a high-speed train travelling through adjoining & separated tunnels. Tunn. Undergr. Space Technol. 2021, 113, 103973. [Google Scholar]
- Yang, W.C.; Deng, E.; Lei, M.F.; Zhang, P.P.; Yin, R.S. Flow structure and aerodynamic behavior evolution during train entering tunnel with entrance in crosswind. J. Wind. Eng. Ind. Aerodyn. 2018, 175, 229–243. [Google Scholar] [CrossRef]
- Li, W.H.; Liu, T.H.; Chen, Z.W.; Guo, Z.J.; Huo, X.S. Comparative study on the unsteady slipstream induced by a single train and two trains passing each other in a tunnel. J. Wind. Eng. Ind. Aerodyn. 2020, 198, 104095. [Google Scholar] [CrossRef]
- Ferziger, J.; Peric, M. Computational Method for Fluid Dynamics, 3rd ed.; Springer: Berlin/Heidelberg, Germany, 2002. [Google Scholar]
- Huang, Y.D.; Gong, X.L.; Peng, Y.J.; Kim, C.N. Effects of the solid curtains on natural ventilation performance in a subway tunnel. Tunn. Undergr. Space Technol. 2013, 38, 526–533. [Google Scholar] [CrossRef]
- Chen, W.L.; Li, H.; Hu, H. An experimental study on the unsteady vortices and turbulent flow structures around twin-box-girder bridge deck models with different gap ratios. J. Wind. Eng. Ind. Aerodyn. 2014, 132, 27–36. [Google Scholar] [CrossRef]
- Li, H.; Chen, W.L.; Xu, F.; Li, F.C.; Ou, J.P. A numerical and experimental hybrid approach for the investigation of aerodynamic forces on stay cables suffering from rain-wind induced vibration. J. Fluids Struct. 2010, 26, 1195–1215. [Google Scholar] [CrossRef]
- Tian, H.Q. Train Aerodynamics; China Railway Publishing House: Beijing, China, 2007. (In Chinese) [Google Scholar]
- Chen, W.L.; Zhang, Q.Q.; Li, H.; Hu, H. An experimental investigation on vortex induced vibration of a flexible inclined cable under a shear flow. J. Fluids Struct. 2015, 54, 297–311. [Google Scholar] [CrossRef]
- Chen, W.L.; Xin, D.B.; Xu, F.; Li, H.; Ou, J.P.; Hu, H. Suppression of vortex-induced vibration of a circular cylinder using suction-based flow control. J. Fluids Struct. 2013, 42, 25–39. [Google Scholar] [CrossRef]
- Huang, Y.D.; Hong, T.H.; Kim, C.N. A numerical simulation of train-induced unsteady airflow in a tunnel of Seoul subway. J. Mech. Sci. Technol. 2012, 26, 785–792. [Google Scholar] [CrossRef]
- Chen, W.L.; Li, H.; Hu, H. Flow around a circular cylinder with slit. Exp. Therm. Fluid Sc. 2017, 82, 287–301. [Google Scholar]
- Laima, S.; Li, H.; Chen, W.; Li, F. Investigation and control of vortex-induced vibration of twin box girders. J. Fluids Struct. 2013, 39, 205–221. [Google Scholar] [CrossRef]
- Chen, W.L.; Gao, D.L.; Li, H.; Hu, H. Passive jet control of flow around a circular cylinder. Exp. Fluids. 2015, 56, 1–15. [Google Scholar] [CrossRef]
- Xu, F.; Chen, W.L.; Xiao, Y.Q.; Li, H.; Ou, J.P. Numerical study on the suppression of the vortex-induced vibration of an elastically mounted cylinder by a traveling wave wall. J. Fluid Struct. 2014, 44, 145–165. [Google Scholar] [CrossRef]
- Kim, J.Y.; Kim, K.Y. Experimental and numerical analyses of train-induced unsteady tunnel flow in subway. Tunn. Undergr. Space Technol. 2007, 22, 166–172. [Google Scholar] [CrossRef]
- Liu, M.Z.; Zhu, C.G.; Cui, T.; Zhang, H.; Zheng, W.D.; You, S.J. An alternative algorithm of tunnel piston effect by replacing three-dimensional model with two-dimensional model. Build Environ. 2018, 128, 55–67. [Google Scholar] [CrossRef]
- Izadi, T.; Mehrabian, M.A.; Abouali, O.; Ahmadi, G. 3-D numerical analysis of train-induced flow inside four ventilated underground subway stations connecting tunnels. J. Wind. Eng. Ind. Aerodyn. 2019, 193, 103974. [Google Scholar] [CrossRef]
- Liu, F.; Yao, S.; Liu, T.H.; Zhang, J. Analysis on aerodynamic pressure of tunnel wall of high-speed railways by full-scale train test. J. Zhejiang Univ. 2016, 50, 2018–2024. (In Chinese) [Google Scholar]
- Ji, P.; Wang, T.; Wu, F. Calculation grid and turbulence model for numerical simulating pressure fluctuations in high-speed train tunnel. J. Cent. South Univ. 2019, 26, 2870–2877. [Google Scholar] [CrossRef]
- Ray, W.C.; Joseph, P. Dynamics of Structures, 2nd ed.; McGraw-Hill: New York, NY, USA, 1993. [Google Scholar]


| Sections | Ppmax (Pa) | Pnmax (Pa) | Peak-to-Peak (Pa) |
|---|---|---|---|
| 1 | 1090 | −1020 | 2110 |
| 2 | 1047 | −1088 | 2135 |
| 3 | 1145 | −1607 | 2752 |
| 4 | 1237 | −2076 | 3312 |
| 5 | 1285 | −2111 | 3396 |
| 6 | 1298 | −2153 | 3451 |
| 7 | 1277 | −2023 | 3300 |
| 8 | 1227 | −1963 | 3190 |
| 9 | 1170 | −1212 | 2382 |
| 10 | 944 | −909 | 1853 |
| 11 | 799 | −936 | 17 |
| Sections | Ppmax | Pnmax | ||
|---|---|---|---|---|
| Td (s) | (kPa/s) | Td (s) | (kPa/s) | |
| S1 | 0.222 | 9.881 | 0.154 | −10.415 |
| S3 | 1.379 | 3.288 | 0.347 | −5.488 |
| S6 | 1.410 | 5.780 | 1.041 | −6.569 |
| S9 | 1.059 | 6.227 | 0.719 | −5.842 |
| S11 | 0.356 | 6.366 | 0.526 | −5.609 |
Publisher’s Note: MDPI stays neutral with regard to jurisdictional claims in published maps and institutional affiliations. |
© 2022 by the authors. Licensee MDPI, Basel, Switzerland. This article is an open access article distributed under the terms and conditions of the Creative Commons Attribution (CC BY) license (https://creativecommons.org/licenses/by/4.0/).
Share and Cite
Jing, H.; Ji, X.; He, X.; Zhang, S.; Zhou, J.; Zhang, H. Dynamic Characteristics of Unsteady Aerodynamic Pressure on an Enclosed Housing for Sound Emission Alleviation Caused by a Passing High-Speed Train. Appl. Sci. 2022, 12, 1545. https://doi.org/10.3390/app12031545
Jing H, Ji X, He X, Zhang S, Zhou J, Zhang H. Dynamic Characteristics of Unsteady Aerodynamic Pressure on an Enclosed Housing for Sound Emission Alleviation Caused by a Passing High-Speed Train. Applied Sciences. 2022; 12(3):1545. https://doi.org/10.3390/app12031545
Chicago/Turabian StyleJing, Haiquan, Xiaoyu Ji, Xuhui He, Shifeng Zhang, Jichao Zhou, and Haiyu Zhang. 2022. "Dynamic Characteristics of Unsteady Aerodynamic Pressure on an Enclosed Housing for Sound Emission Alleviation Caused by a Passing High-Speed Train" Applied Sciences 12, no. 3: 1545. https://doi.org/10.3390/app12031545
APA StyleJing, H., Ji, X., He, X., Zhang, S., Zhou, J., & Zhang, H. (2022). Dynamic Characteristics of Unsteady Aerodynamic Pressure on an Enclosed Housing for Sound Emission Alleviation Caused by a Passing High-Speed Train. Applied Sciences, 12(3), 1545. https://doi.org/10.3390/app12031545