Article

An Intrusion Detection and Classification System for IoT Traffic with Improved Data Engineering

1
Department of Information Systems, Faculty of Computing and Information Technology, King Abdulaziz University, Jeddah 21589, Saudi Arabia
2
Department of Cybersecurity, Princess Sumaya University for Technology (PSUT), Amman 11941, Jordan
3
Department of Information Technology, Faculty of Computing and Information Technology, King Abdulaziz University, Jeddah 21589, Saudi Arabia
4
Department of Networks and Communications Engineering, College of Computer Science and Information Systems, Najran University, Najran 61441, Saudi Arabia
*
Author to whom correspondence should be addressed.
Appl. Sci. 2022, 12(23), 12336; https://doi.org/10.3390/app122312336
Submission received: 1 November 2022 / Revised: 29 November 2022 / Accepted: 30 November 2022 / Published: 2 December 2022

Abstract

:
Nowadays, the Internet of Things (IoT) devices and applications have rapidly expanded worldwide due to their benefits in improving the business environment, industrial environment, and people’s daily lives. However, IoT devices are not immune to malicious network traffic, which causes potential negative consequences and sabotages IoT operating devices. Therefore, developing a method for screening network traffic is necessary to detect and classify malicious activity to mitigate its negative impacts. This research proposes a predictive machine learning model to detect and classify network activity in an IoT system. Specifically, our model distinguishes between normal and anomaly network activity. Furthermore, it classifies network traffic into five categories: normal, Mirai attack, denial of service (DoS) attack, Scan attack, and man-in-the-middle (MITM) attack. Five supervised learning models were implemented to characterize their performance in detecting and classifying network activities for IoT systems. This includes the following models: shallow neural networks (SNN), decision trees (DT), bagging trees (BT), k-nearest neighbor (kNN), and support vector machine (SVM). The learning models were evaluated on a new and broad dataset for IoT attacks, the IoTID20 dataset. Besides, a deep feature engineering process was used to improve the learning models’ accuracy. Our experimental evaluation exhibited an accuracy of 100% recorded for the detection using all implemented models and an accuracy of 99.4–99.9% recorded for the classification process.

1. Introduction

Cyber-physical systems (CPS) and the Internet of Things (IoT) have considerably expanded our capability to realize our ecosystem and the surrounding world. CPS is frequently used when referring to large, interconnected devices, such as industrial machines and smart cars. In contrast, IoT is frequently used to refer to small, interconnected devices, such as those in a smart home [1]. IoT technology has touched almost every pitch of everyday life with its widespread applications. This, in turn, has substantially improved our life quality as a result of adopting the IoT “know-how” of several life, which have the potential to collect, harvest, and investigate data concerning the adjoining environment [2]. This context has accelerated the improvement of smart cities by enabling communication between things (machines) and between machines and humans. Such communications have recently been termed machine-to-machine (M2M) and machine-to-human (M2H) communication. IoT devices continue to expand swiftly and are being connected and spread through diverse applications and services. The number of IoT devices will likely exceed 125 billion by 2030 [3].
IoT systems have been recently adopted in almost all areas of real-life applications. Many applications have been mentioned in the literature [4]. As such, smart cities require extensive use of technologies and connectivity resources to increase the overall quality of people’s lives [5], as a smart environment involves multiple IoT applications like monitoring the snow level, fire detection, pollution monitoring, earthquakes, landslides, early detection [6], smart grids involve applications related to different monitoring, management, and measurements [7], smart agriculture, which includes monitoring soil moisture, humidity, temperature, and selective irrigation in dry zones [8], home automation, which contains various IoT applications such as remotely controlling electrical appliances to save energy, systems deployed (i.e., camera based on AI) on doors and windows disclosing intruders (hackers) [9], and security and emergencies include applications that, for example, allow only authorized persons to enter restricted (selected) areas and safe human and robotics interaction [10].
Even though IoT is considered a powerful technology with marvelous consequences and potential for spread and growth, IoT devices are vulnerable to various cyber-attacks and threats [11]. This is due to constrictions in processing capability, storage, memory capabilities, and communication capacity for the tiny energy-aware endpoint devices that reside within the IoT infrastructure. Indeed, confidentiality, integrity, and availability (CIA) are among the sizeable challenges of the IoT ecosystem [12]. Figure 1 illustrates the various cyber-attacks on IoT systems.
With the enormous and uninterrupted growth of cyber-attack occurrences in IoT infrastructures [13], it has become almost ridiculous to identify and thwart such attacks using conventional intrusion detection systems (IDSs) built based on the attack’s signature. While the signature-based IDS can provide highly accurate and precise detection performance for the attacks/intrusions that match the pre-stored intrusion patterns (such as patterns of network traffic, sequences of system calls, … etc.), the problem occurs and even increases when a new attack (zero-day) is discovered. This is because traditional signature-based IDSs work depends on the pre-knowledge of a potential attack signature. Therefore, they can only detect an attack if it is pre-deposited in their database.
Therefore, to tackle this limitation, an anomaly-based IDS has been proposed to replace the conventional IDS using adopting smarter and more intelligent techniques. Instead of matching the attack’s signature with the pre-existing intrusion patterns, anomaly-based IDS defines a profile describing “normal” behavior and then detects deviations. This can detect potential new attacks (zero-day attacks). However, it still fails to detect all unknown attacks accurately in a dynamic environment such as an IoT ecosystem, and the cost of the false detection rate is still high. Thus, many zero-day attacks remain undiscovered due to the existing limitations of IoT devices and conventional anomaly detection methods. Such functionalities are usually facilitated through vital and essential defense means, such as a network intrusion detection system (NIDS), which is used to examine network traffic to identify anomalous activity [14]. Figure 2 illustrates the typical deployment of NIDS in communication networks [15]. To obtain a trusted environment and network, the anomaly-based-IDS can be utilized alongside conventional cyber-defense systems like firewall systems [16] to examine the network traffic, and anomaly-IDS can distinguish the traffic as benign or malicious by using its pre-trained models.

1.1. Our Contributions

This study proposed an intrusion detection and classification system that can detect and classify the zero-day attacks of common IoT malicious traffic using machine learning models utilizing the sovereignty of Nvidia-Quad GPUs. Specifically, our model distinguishes between normal and anomaly network activity. Furthermore, it classifies network traffic into five categories: normal, Mirai attack, DoS attack, Scan attack, and MITM attack. Five supervised machine learning models, named Shallow Neural Networks (SNNs), Decision Trees (DT), Bagged Tree (BT), K-Nearest Neighbor (KNN), and Support Vector Machine (SVM), were implemented to detect and classify network activity in an IoT system. In addition, we have applied different data preprocessing and feature engineering processes to increase the prediction accuracy of the aforementioned machine learning models. As a result, the accuracy rates for all models have scored extremely high ratios rates between 99.40% to 100%. Such accuracy scores have outperformed the performance of all other existing models. The main contributions of this research can be summarized as follows:
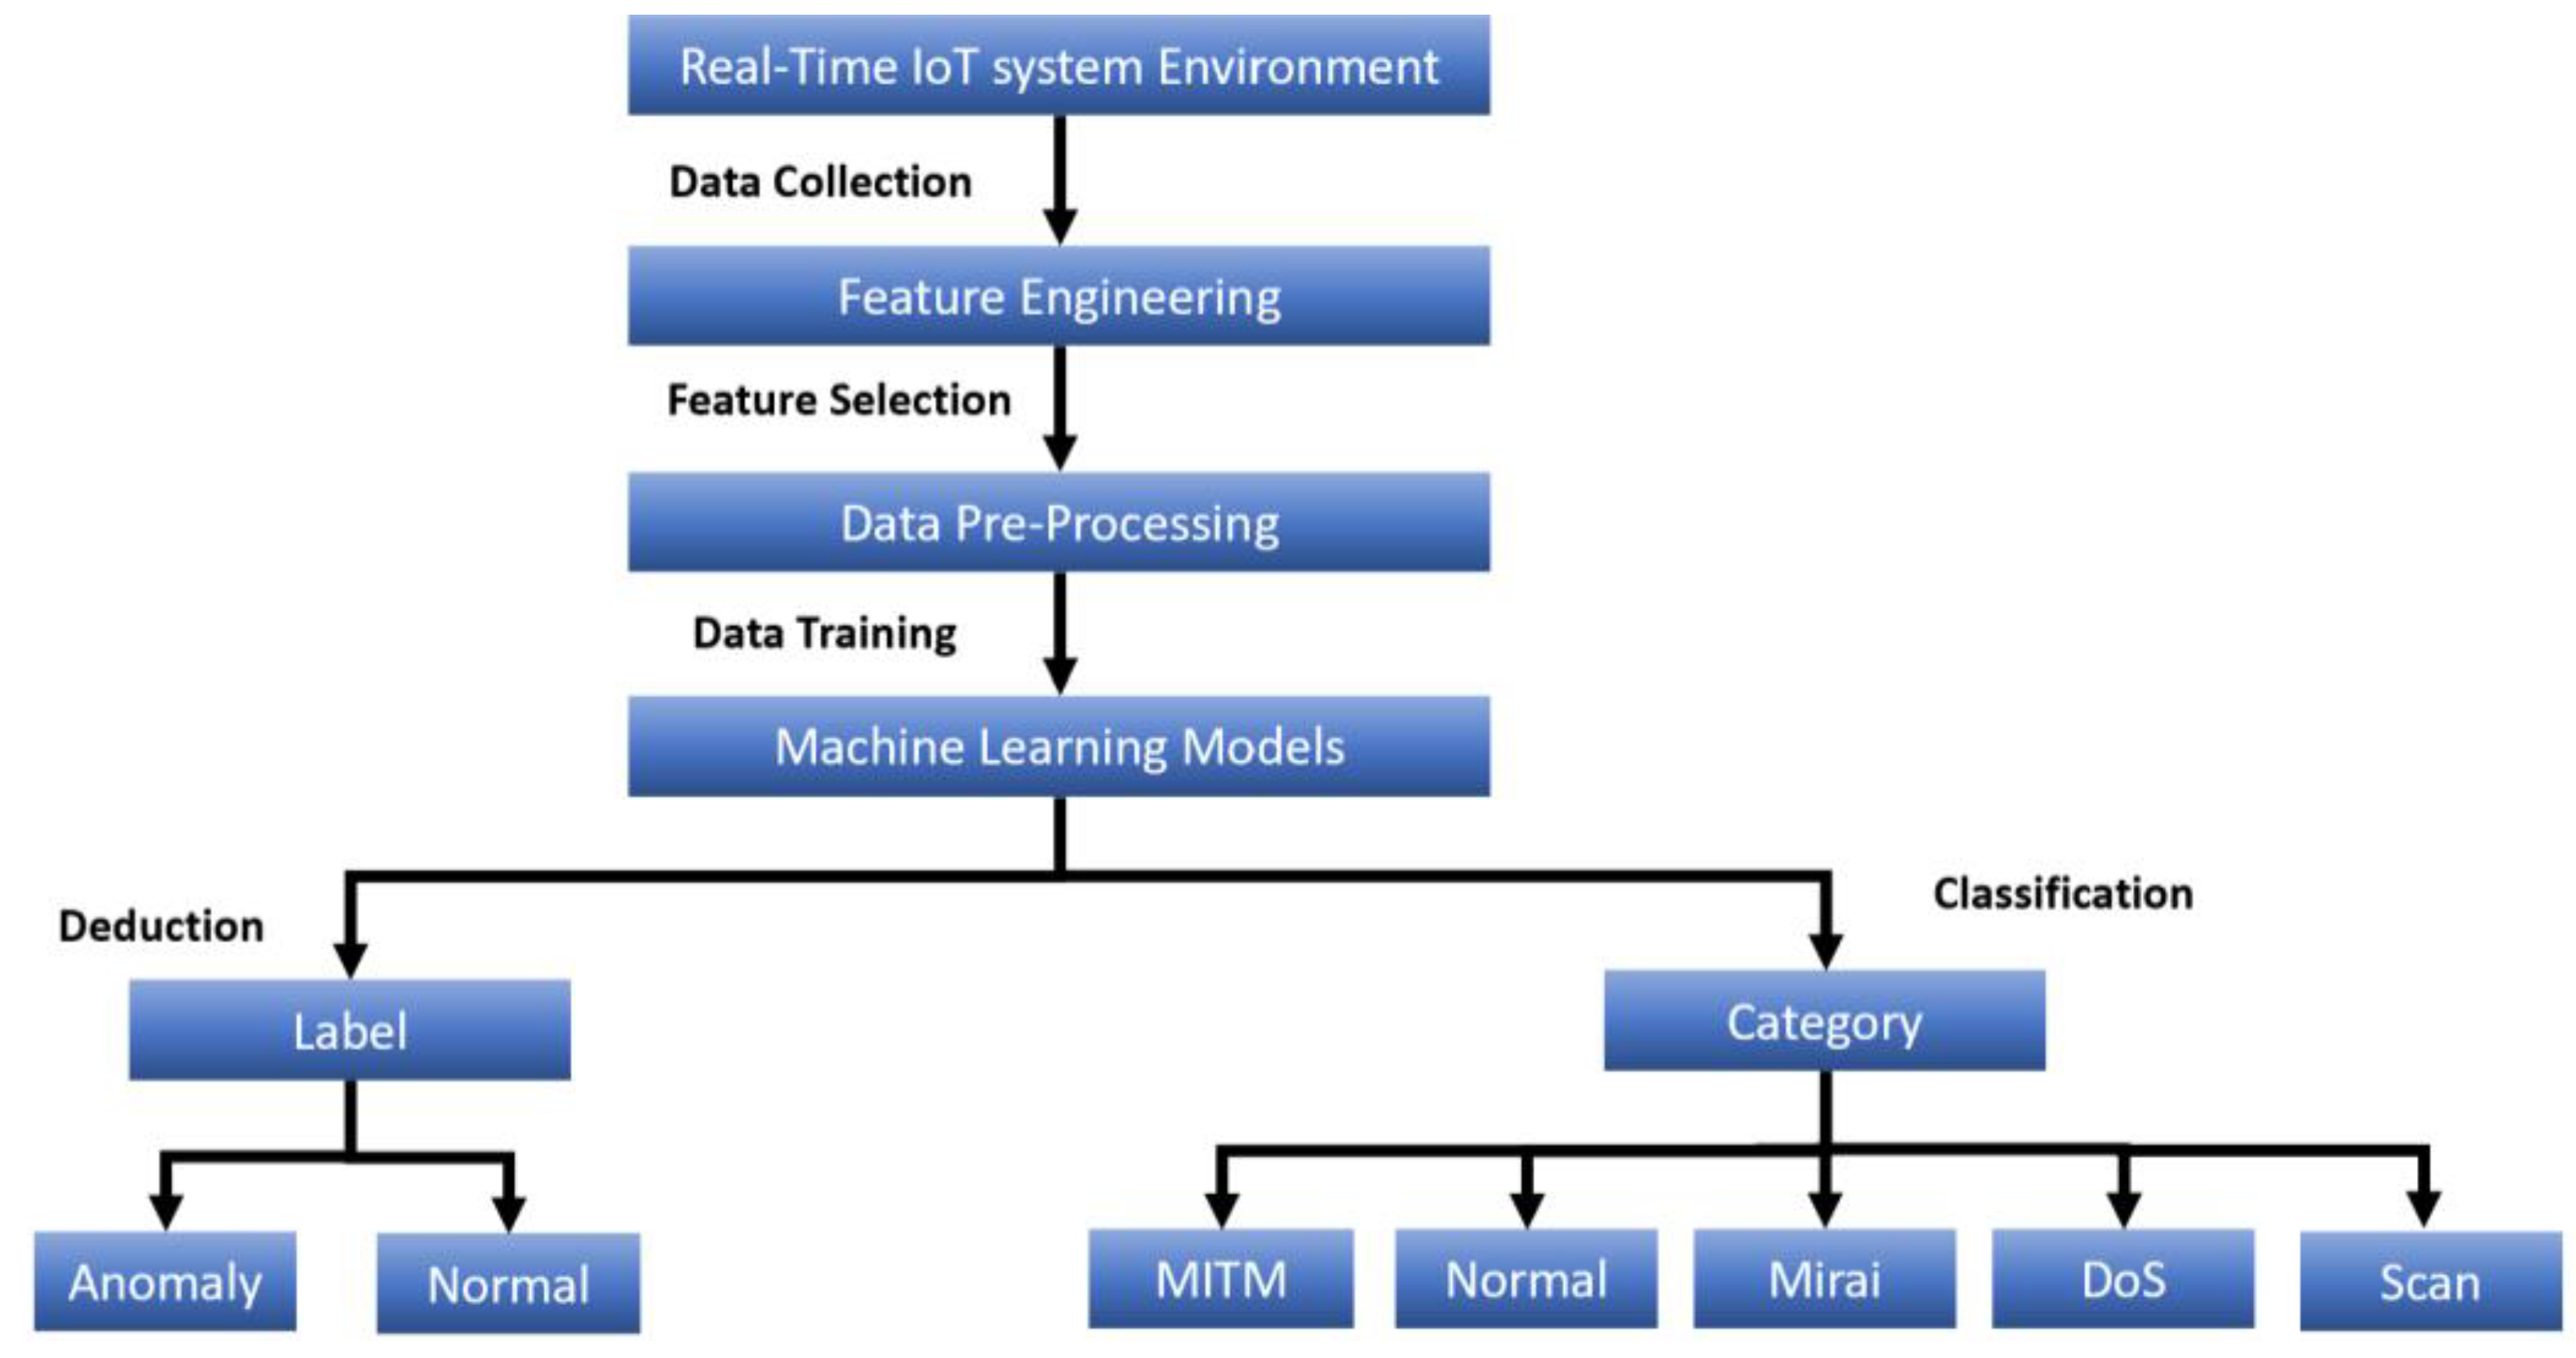
  • We present a comprehensive intrusion detection and classification system that can identify and classify the IoT traffic of an IoTID20 dataset into binary classes (normal and anomaly) or five classes (normal, Mirai attack, DoS attack, Scan attack, and MITM attack). In addition, we stipulate an illuminated depiction of our system modules and the machine learning algorithms.
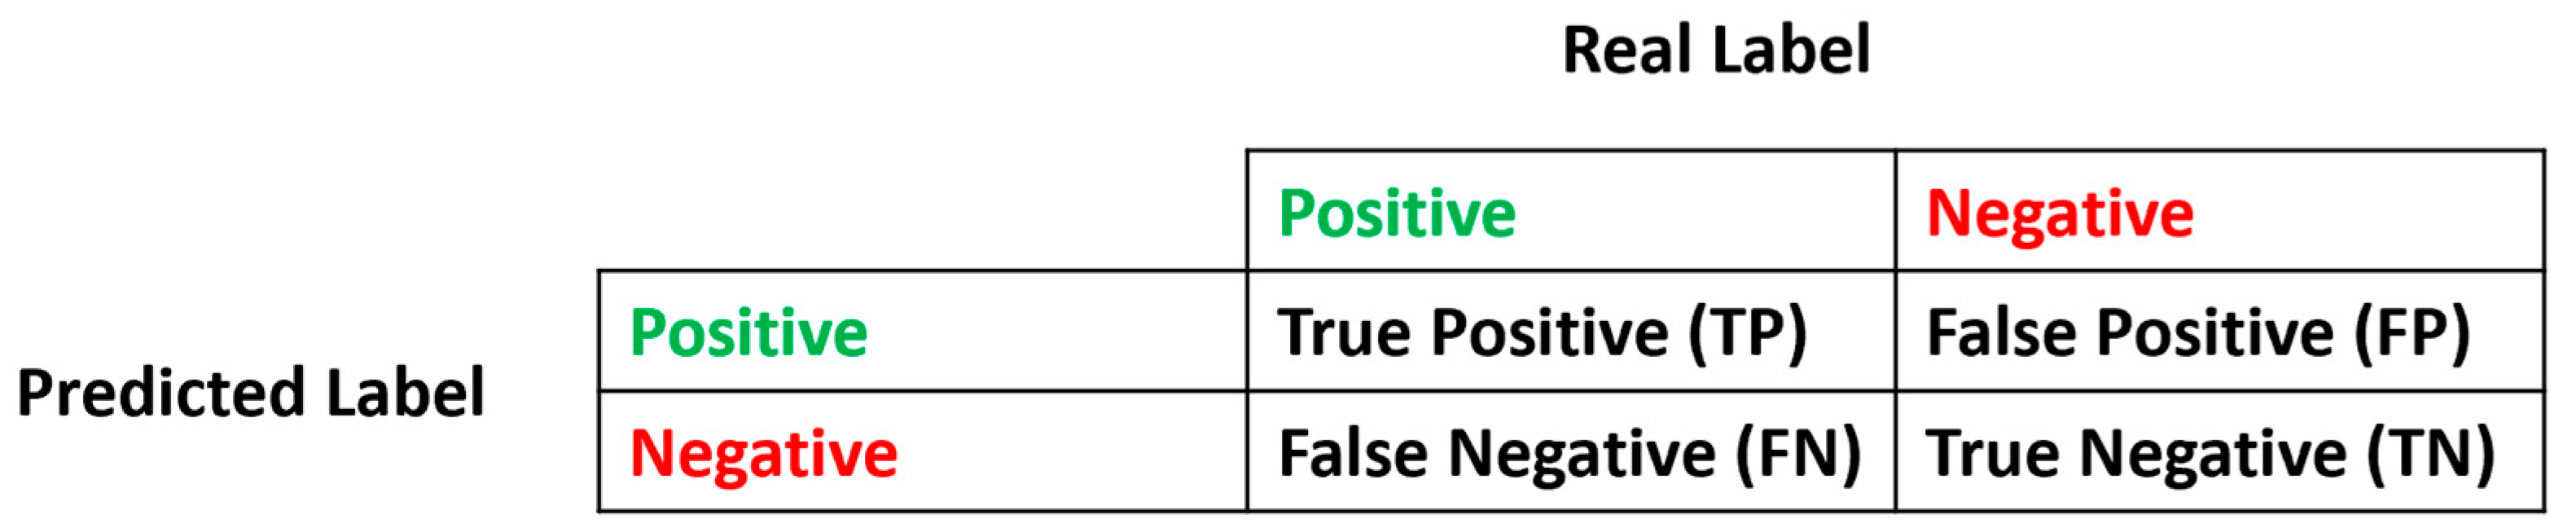
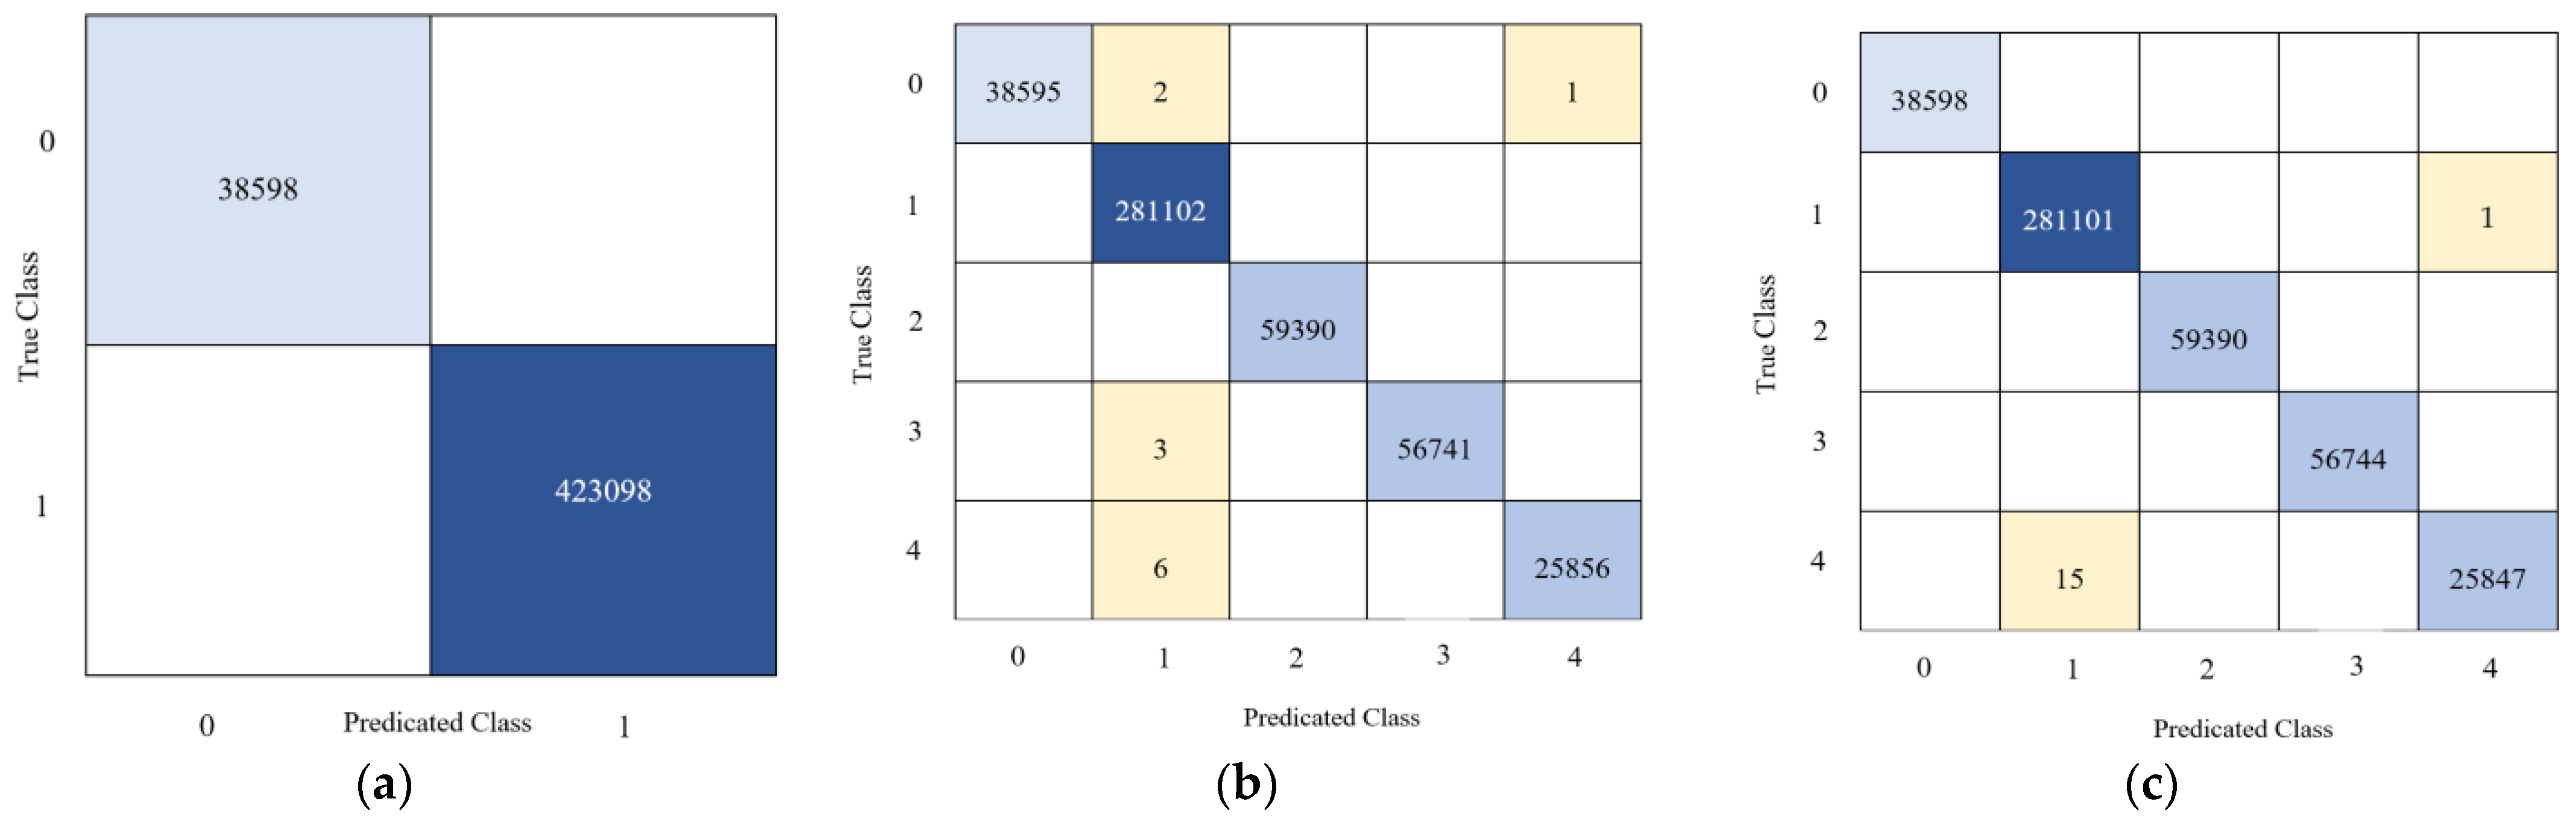
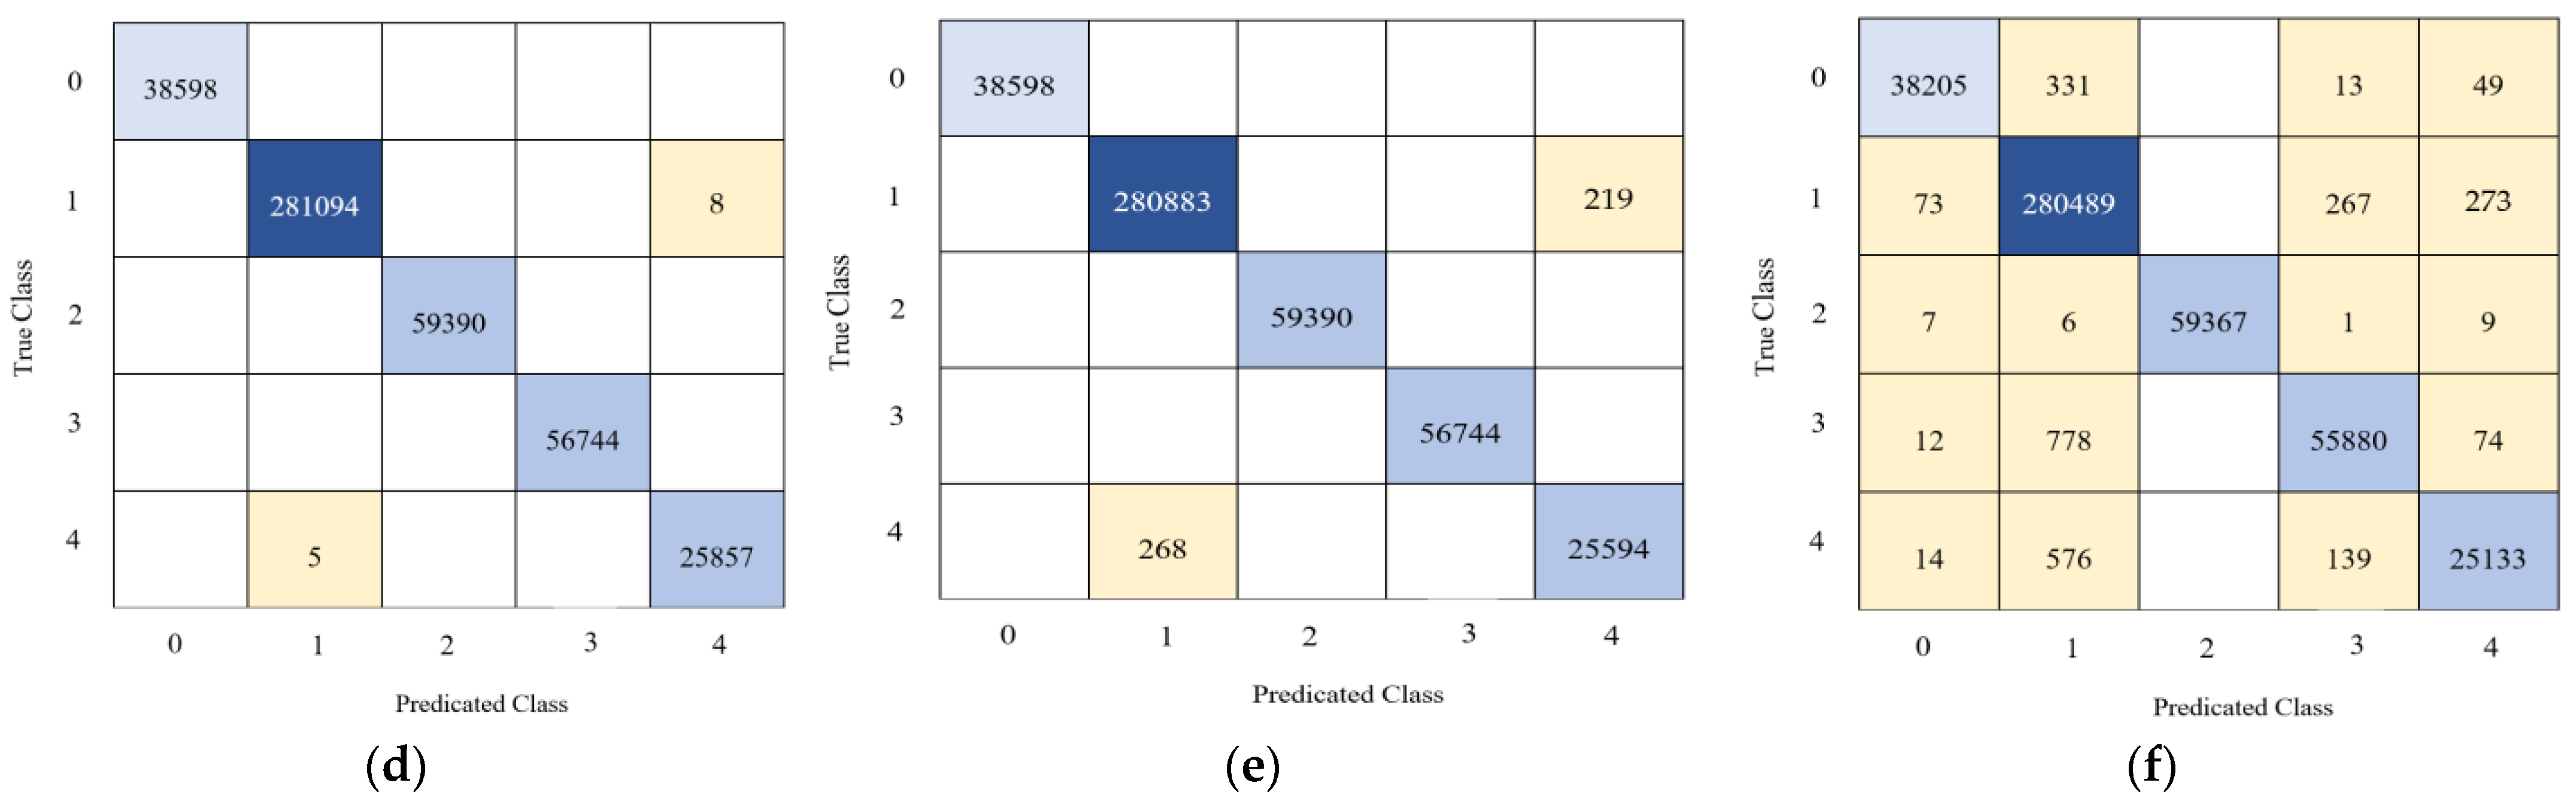
  • We provide an extensive feature engineering and data preprocessing framework that significantly improves the system performance evaluation. In addition, we provide a thorough development, validation environment, configurations, and extensive simulation results to better perceive the proposed solution methodology. The system has been evaluated using standard performance indicators of machine learning models such as confusion matrix, accuracy, precision, recall, F-score, and specificity.
  • We compare our findings with other related state-of-the-art works, machine-learning-based intrusion detection systems (ML-IDSs), and intrusion classification systems (ML-ICSs) employing the same dataset. We show that our proposed system is superior.

1.2. Paper Organization

This paper is organized as follows. Section 2 presents a systematic summary of the current related state-of-the-art research. Section 3 revisits and reviews the machine learning algorithm employed in this study. In Section 4, dataset collection and data engineering are discussed and elaborated on in this section. It also represents and justifies the dataset used by our system. Detailed information about the proposed method architecture, development, and data preprocessing is shown in Section 5. The experiments and results of this research are discussed in Section 6. Finally, Section 7 presents the conclusion of the research findings and future work.

2. Related Research

Consequently, over the past decade, there have been large endeavors in handling security concerns related to intrusion/cyber-attacks detection in the IoT system. Most of these anomaly-based IDS systems were developed by employing the techniques of machine learning (ML) and deep learning (DL) techniques to provide intelligent cybersecurity decision-making. Since ML/DL techniques operate using datasets of records and features that are used to train and test the predictive IDS models, it should be noted that not all of the features/records in a dataset are relevant or significant while training/testing classification/detection models.
Therefore, data engineering and feature preprocessing have formulated a core phase of every ML/DL-based IDS model that played a major role in making the raw data collected from the IoT ecosystem usable for further analysis and predictions. In anomaly detection challenges, for example, feature/data engineering is more significant in the IoT ecosystem since the features may include null or zero features. Relevant features, in some cases, are more difficult to extract by only ML/DL algorithms without using feature/data engineering approaches. Techniques of relevant features to identify attacks have been made to classify the data by industrial companies and researchers.
Several auspicious state-of-the-art models for anomaly intrusion detection models have been implemented for IoT cybersecurity using machine and deep learning approaches [17,18,19,20,21,22,23,24,25,26,27,28,29,30,31,32]. Table 1 summarizes the reviewed research models for anomaly-based IDS using machine/deep learning approaches to solve cybersecurity concerns of cyber-attacks on IoT systems.

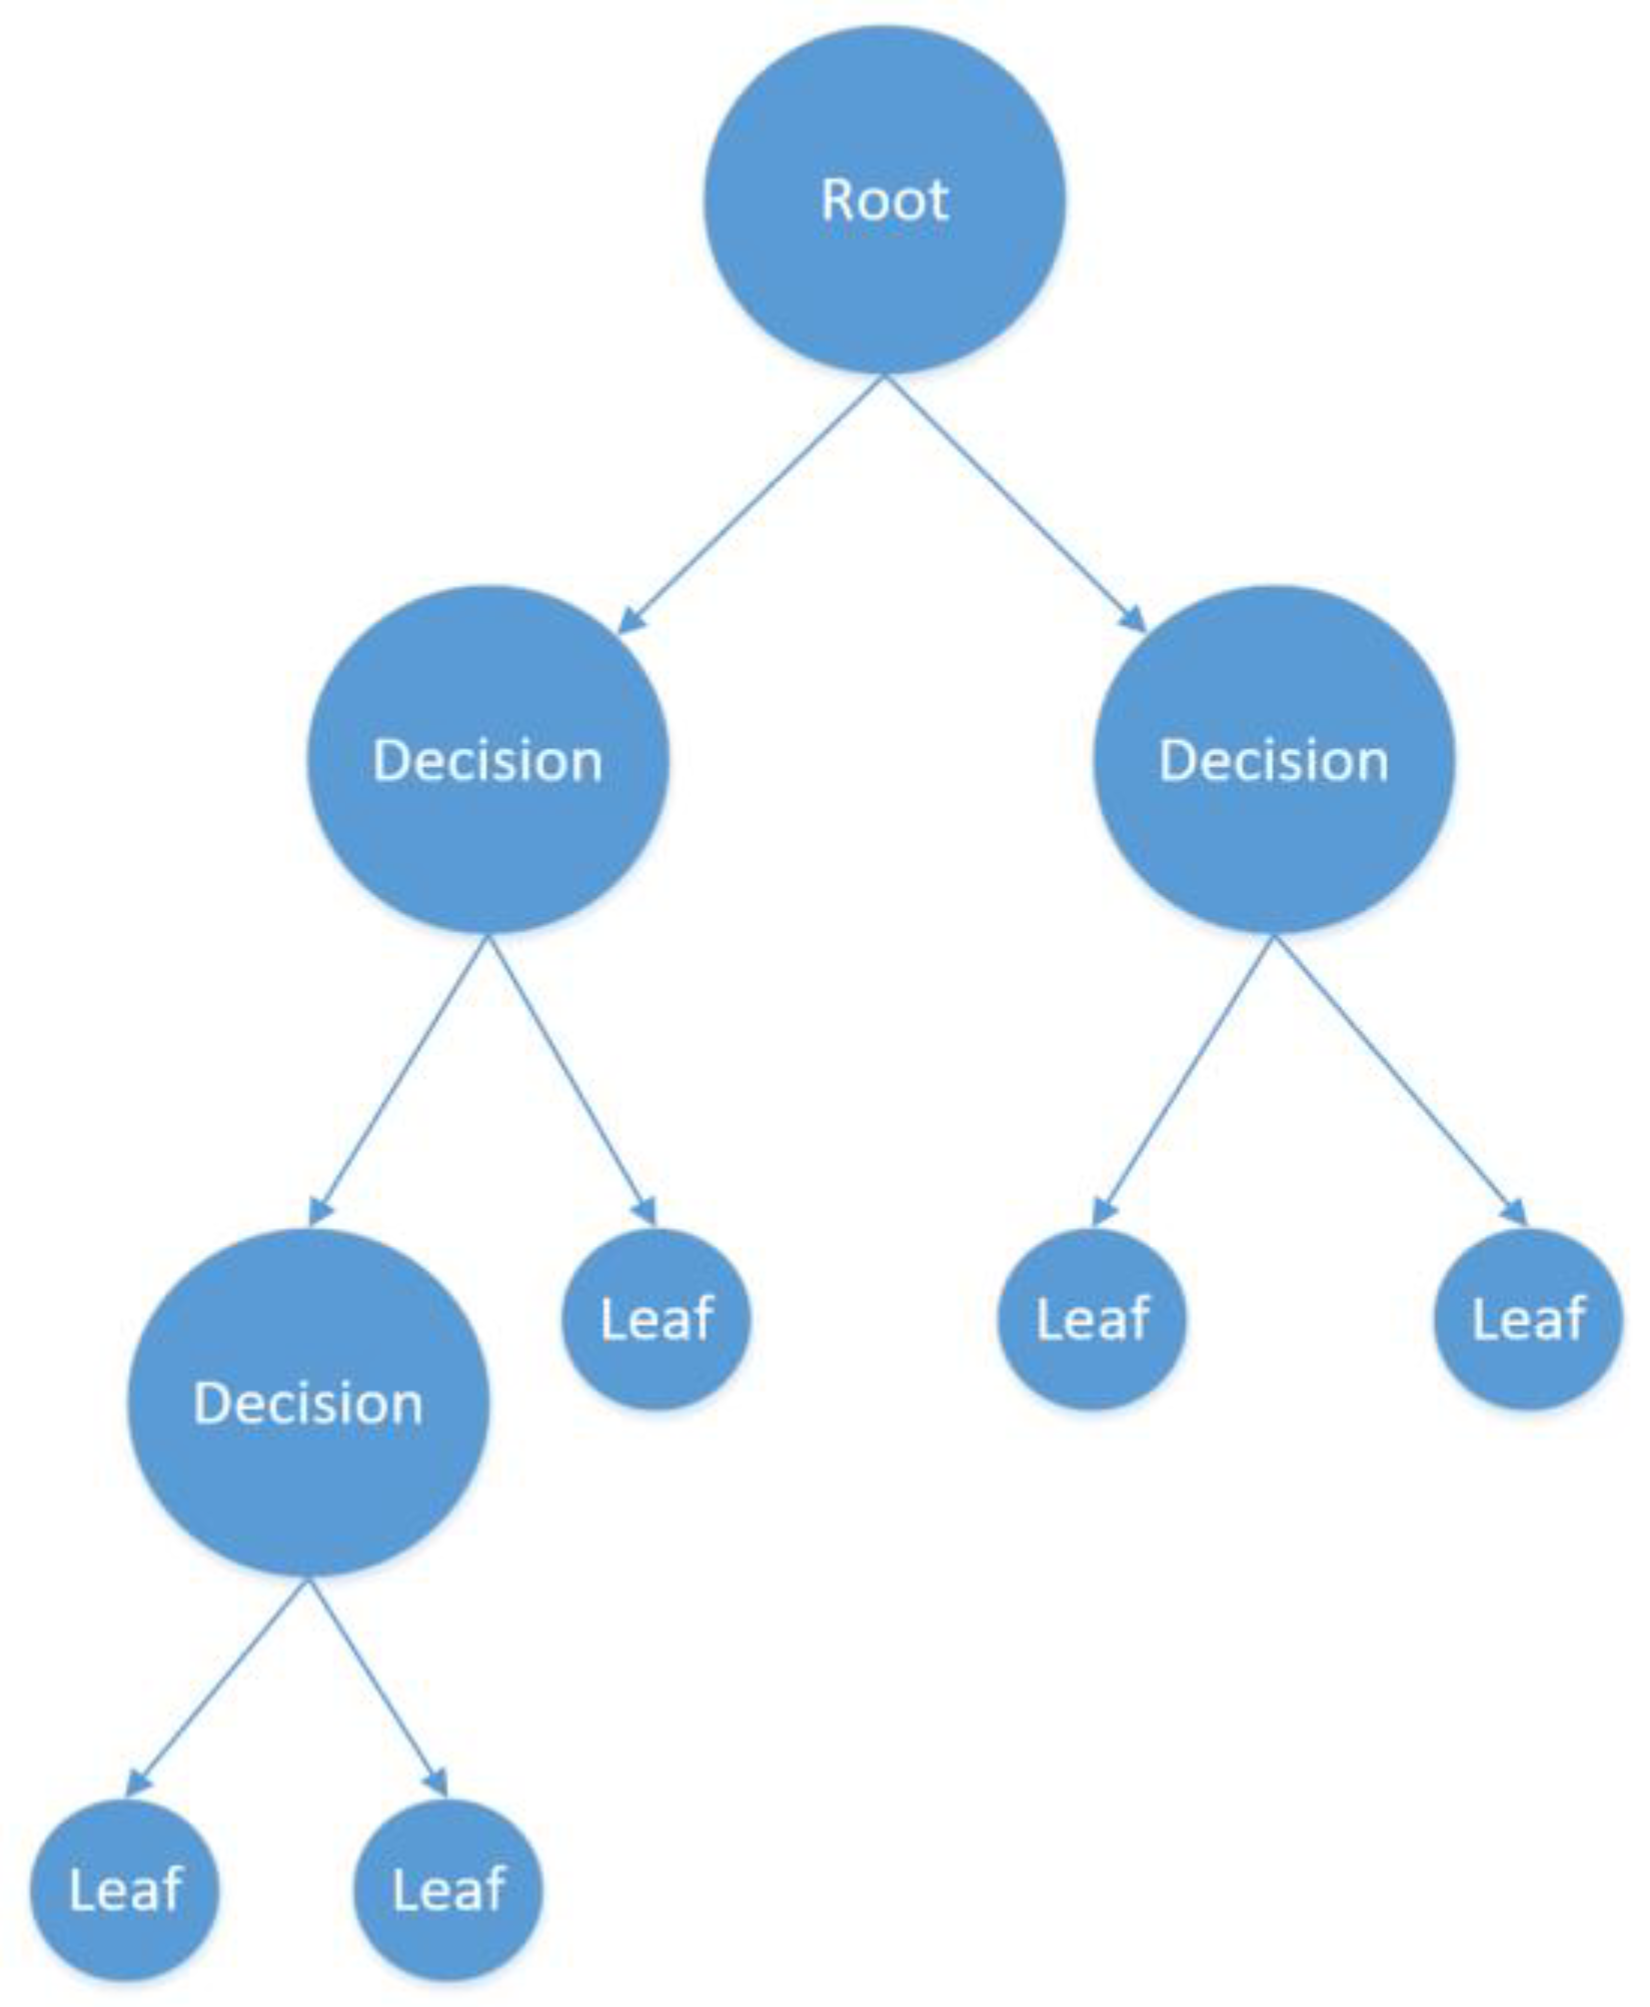
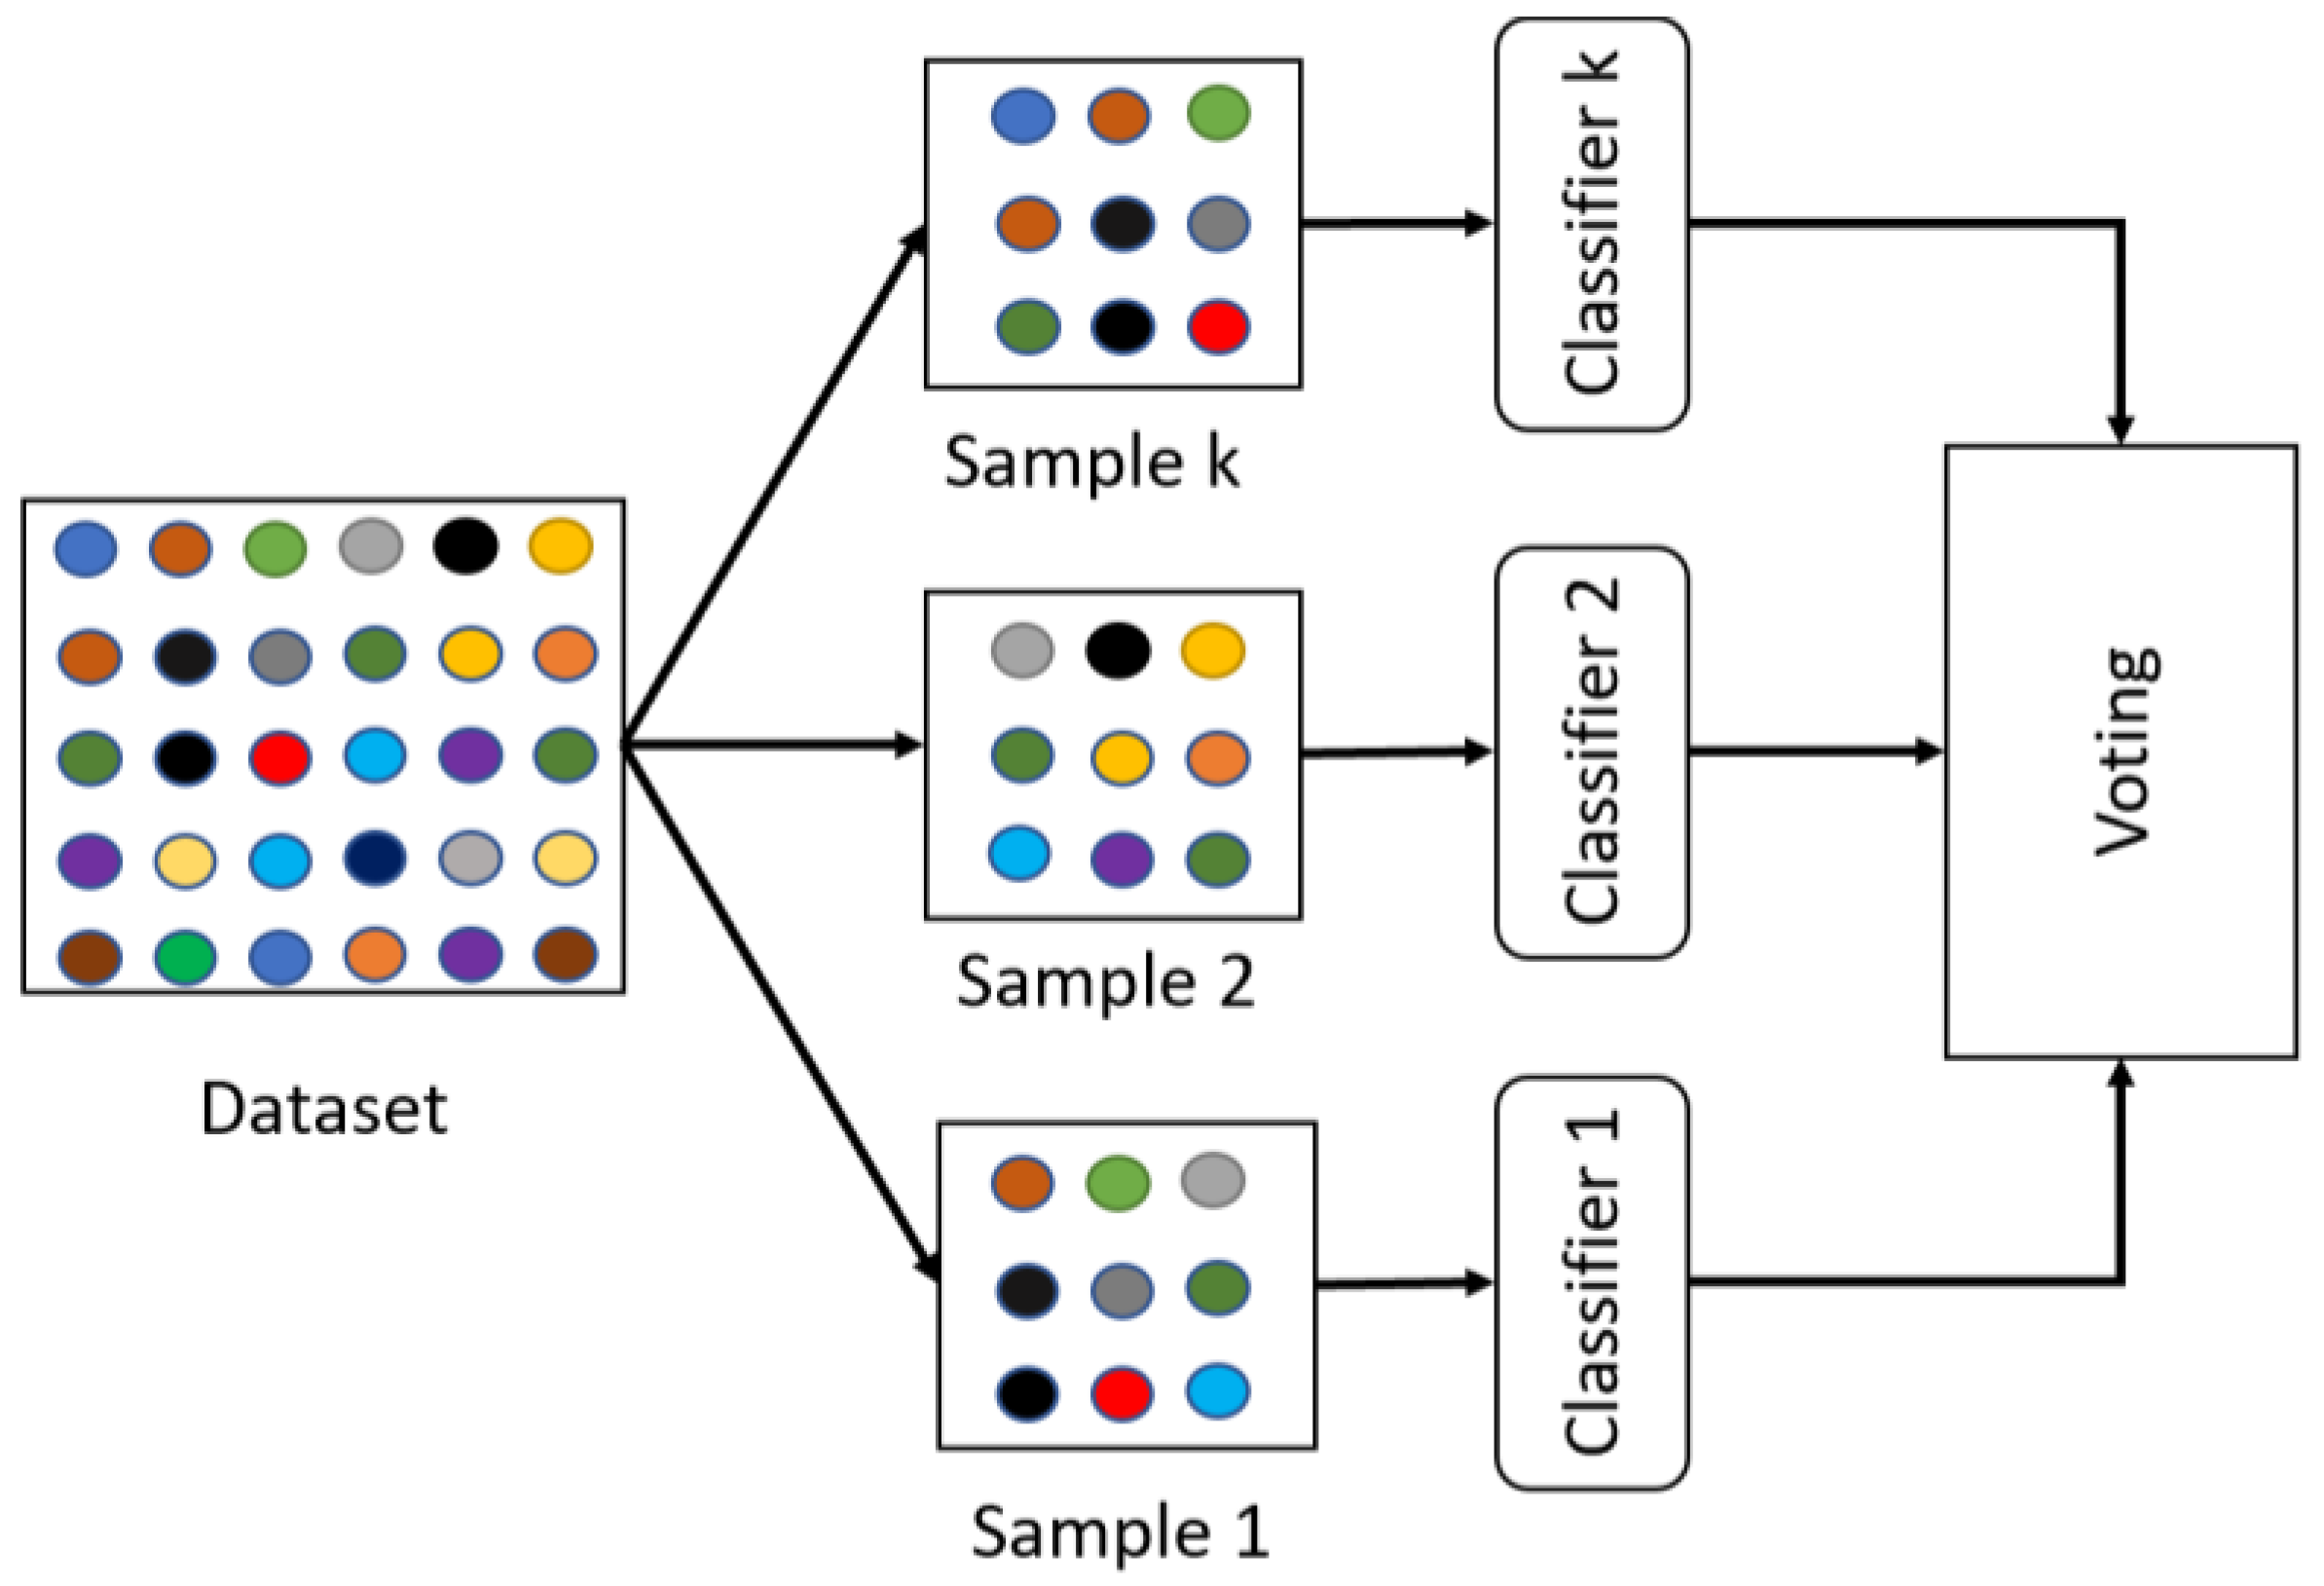
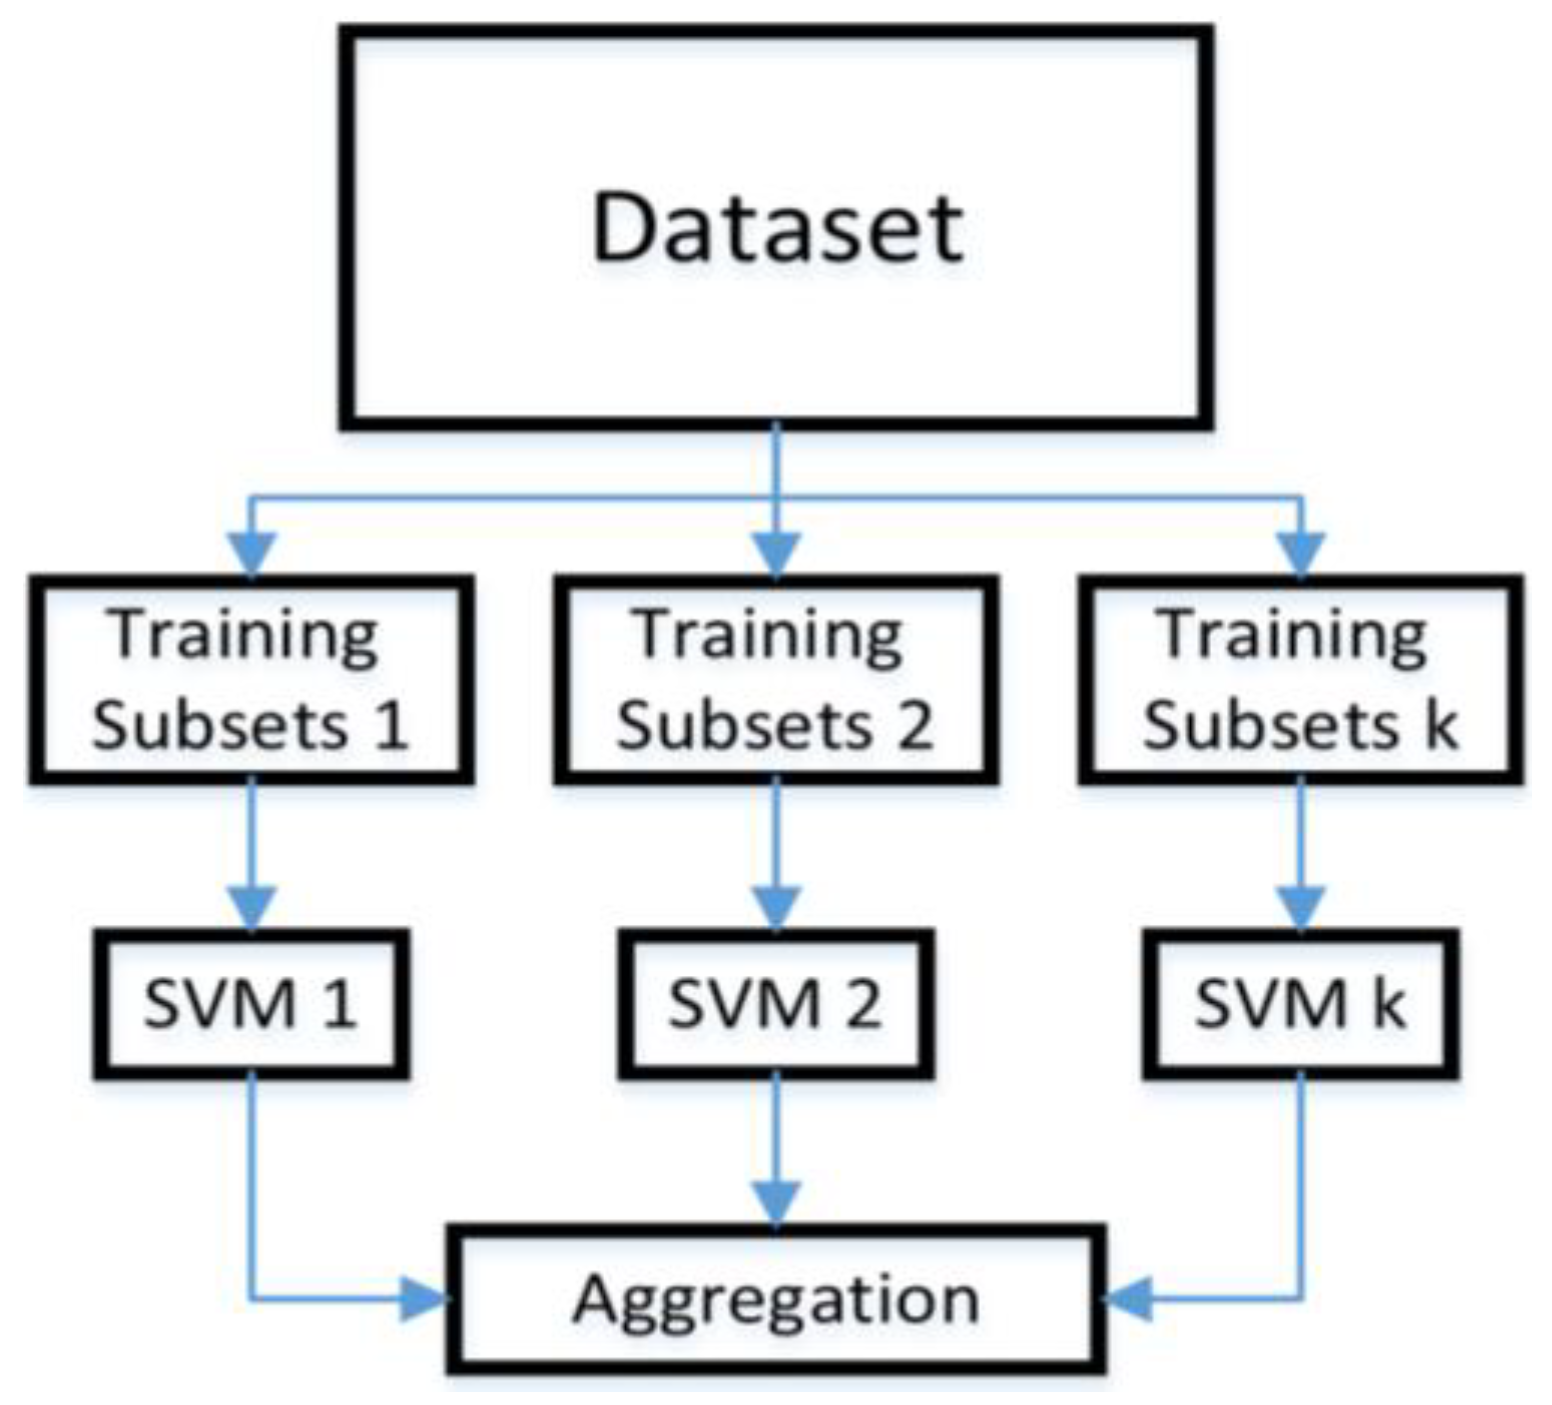
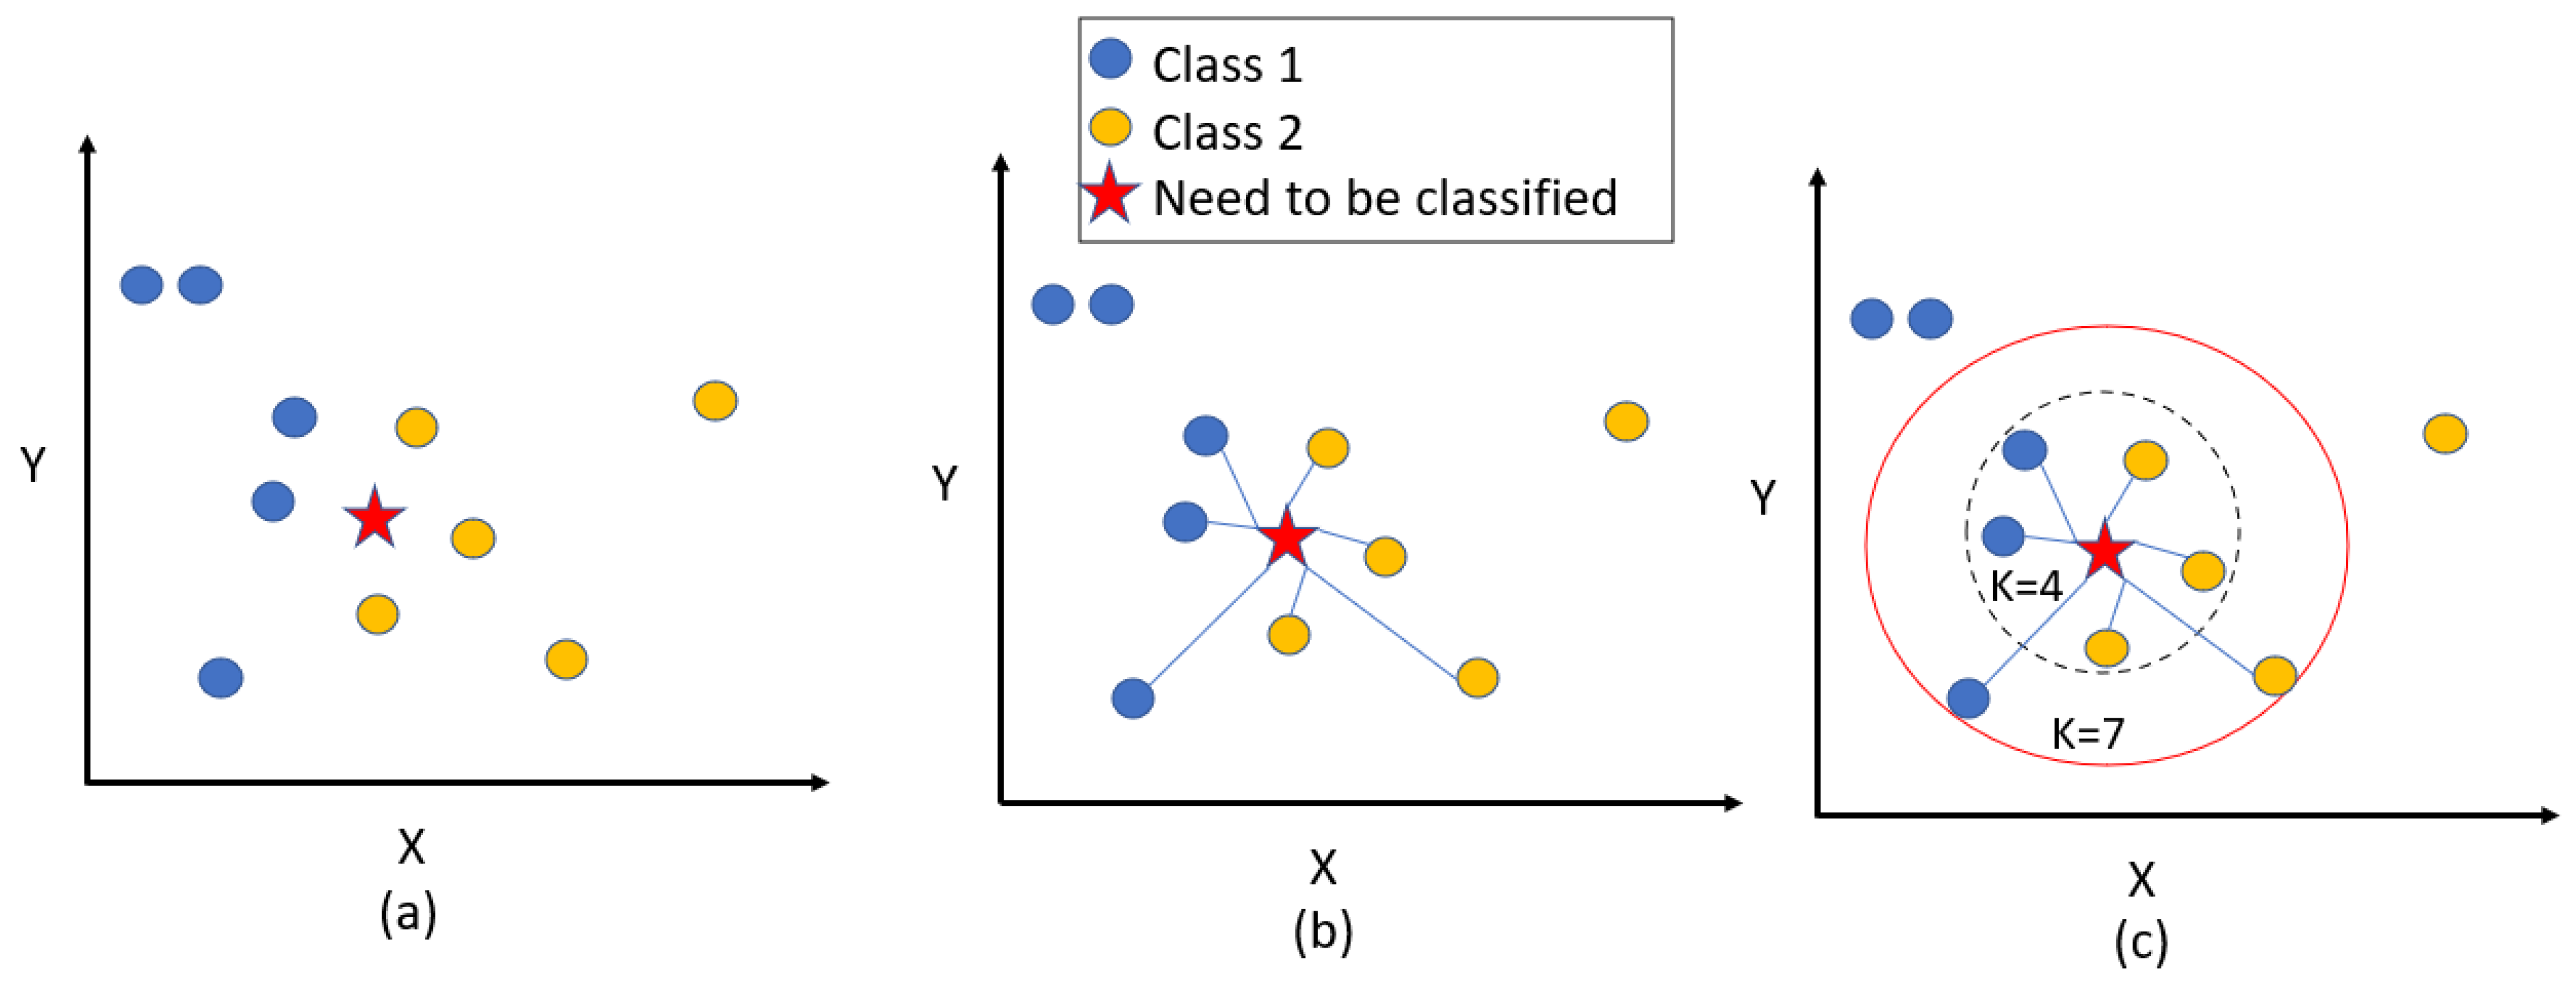
3. Machine Learning Algorithms-Revisited

In this research, machine learning was used to detect and classify network activity attacks, as was mentioned above. Varieties of supervised machine learning classifiers were used: Shallow Neural Networks (SNNs), Decision Trees (DT), Bagged Trees (BT), K-Nearest Neighbor (KNN), and Support Vector Machine (SVM).
SNNs are feedforward neural networks that use multilayer perceptron (MLP) [33]. Classification and regression problems can be solved using SNNs based on supervised learning. Two SNNs models were developed; the first model predicts two classifications (label feature), and the second predicts five classifications (category feature). Figure 3 depicts the second model. The input layer contains 71 input nodes, the hidden layer has ten nodes, and the output layer has five. The 71 features from the dataset were fed to the SNNs model and then processed by ten hidden nodes. The dot in the figure means there are 71 nodes. Finally, the model predicts the five categories. For the detection procedure, we have a similar SNN model; however, the model has two output nodes instead of five nodes.
Decision Trees (DT) are widely used machine learning methods in various fields, such as image processing, pattern recognition, and classification [33]. Figure 4 shows a generic model of the DT, and continuously, the data are divided into subset nodes based on a particular parameter [7].
Bagged Trees (BT) is a machine learning algorithm that can be used as a classifier and solve the variance issue of a dataset with a noisy sample. Figure 5 depicts an overview of the BT process. In the beginning, the dataset is divided into samples to be prepared for training. Next, each sample is trained independently with a classifier. Finally, the most frequent class predicted by the classifiers is selected [7].
SVM is used for solving classification, regression, and linear and nonlinear problems [33]. The training data is classified based on hyperplanes (lines). The training process of SVM is shown in Figure 6, the dataset is first subsetted into k training subsections, and each subsection is assigned to an independent SVM for training. In the end, the training result is aggregated [7].
KNN is a machine-learning method that can be used as a classifier [33]. It classifies dataset points based on similarity; therefore, data points with similarities are close to each other. Figure 7 [33] illustrates the KNN algorithm’s procedure, which includes three figures, a, b, and c. First, in (a), the new item, which has the star shape, needs to be classified as class 1 (has a blue color circle) or class 2, which has a yellow color. Then, in (b), the distance between the new item and the neighbors is calculated. Finally, in (c), based on the K value and class popularity, the new item is categorized. Therefore, in our case, when K = 4, the new item is classified as class 2 (because 2 of class 1 vs. 3 of class 2). In addition, the new item is still classified as class 2 when K = 7 (because 3 of class 1 vs. 4 of class 2).

4. Data Collection and Engineering

This section discusses the dataset used in this research to evaluate the anomaly-based IDS for the IoT system and the data engineering performed over the dataset to improve the learning and validation processes.

4.1. Dataset of IoT System

IoT devices can operate in many domains, such as smart cities, healthcare systems, education systems, smart homes, smart grids, and transportation systems [34]. Our research concentrates on a smart home IoT system; therefore, the IoTID20 dataset [35] was used to test and evaluate the performance of our proposed model. The environment used to collect the IoTID20 dataset consists of IoT devices connected through an access point network [35]. The IoT devices comprise a laptop, smartphone, EZVIZ camera, and SKT NUGU speaker. The laptop and the smartphone were used to establish intrusion attacks, and Wireshark monitors the IoT traffic. The security camera and the AI speaker are the victims, as shown in Figure 8. A detail about the experiment can be found in this reference [35].
The dataset was collected from a real-time scenario using IoT devices, as shown in Figure 8. The original IoTID20 dataset includes 86 columns and 625,783 rows. Each row in the dataset is labeled with the type of network activity. We preprocessed the dataset to increase the classification accuracy of the label, category, and sub-category features. However, we focused our study on label and category features and will express the reason in the Features Engineering section (Section 4.2). Label features include binary classification, which is normal, and anomaly. Category features have five classifications: normal, Mirai attack, DoS attack, Scan attack, and MITM attack [35].

4.2. Features Engineering

Features engineering removes unnecessary features or extracts new features from existing features to increase the accuracy of the machine learning models [34]. Duplicated records were removed from the original dataset, and there were 164,087 duplications of records. As a result, the dataset had 461,696 records. Table 2 represents statistical information about this research dataset. Moreover, the dataset has the source IP address (Src_IP) and destination IP address (Dst_IP) as features. However, machine learning models cannot sufficiently handle the format of IP addresses, such as “192.168.0.13” [36]. Therefore, to solve this issue and help the machine learning models obtain the most use of IP address information, we split the four IP address parts, octet numbers, into features, e.g., Src_IP_oct1: 192 Src_IP_oct2: 168, Src_IP_oct3: 0, and Src_IP_oct4: 13. By doing so, the machine learning model can understand and distinguish between the network and host portions. Furthermore, the IoTID20 dataset has a timestamp as a feature. Therefore, we extracted the following information from the timestamp feature and included them in the dataset as new features: day of the week, hour, and am or pm to use it more efficiently. According to our experiment, those new features helped increase detection accuracy and machine learning classification. Finally, we converted the label and category string values to numerical values. For example, we mapped the values of the label feature normal to 0 and anomaly to 1, as shown while the numerical conversion of the category feature was normal (0), Mirai (1), DoS (2), Scan (3), and MITM (4). Table 3 outline the features that are included in the dataset. The table lists the feature, feature description, and feature data type (Integer: INT or Double: DBL), comprising 71 features.
By looking at Figure 9, we can observe that intrusion attacks occurred every day of the week except Monday. In addition, most of the intrusion attacks took place on Thursdays. Figure 10 illustrates whether the network traffic occurred in the morning or evening. It is worth saying that most of the network traffic recorded in the morning was intrusion attacks, and a few pieces of traffic were normal network packets. However, some network traffic occurred in the evening—intrusion activities.

5. System Development and Specifications

This section will discuss the data models and preprocessing used in this research by explaining the IoT system’s architecture and a detailed explanation of the development and implementation of machine learning models used for detection and classification. Finally, it discusses the conducted simulation experiments, training, testing, and validation of the results. Classification is an intelligent technique to place a particular data set into a specific category based on predefined criteria [36]. In our case, the machine learning models are supposed to detect and classify IoT intrusion attacks by prediction procedure based on 71 selected features. The detection and classification machine learning models used in this research are supervised learning, so the models estimate the target output based on the chosen features [37]. This paper used machine learning models to predict the label and category features of the IoTID20 dataset. Figure 11 shows the architecture of the proposed research model.

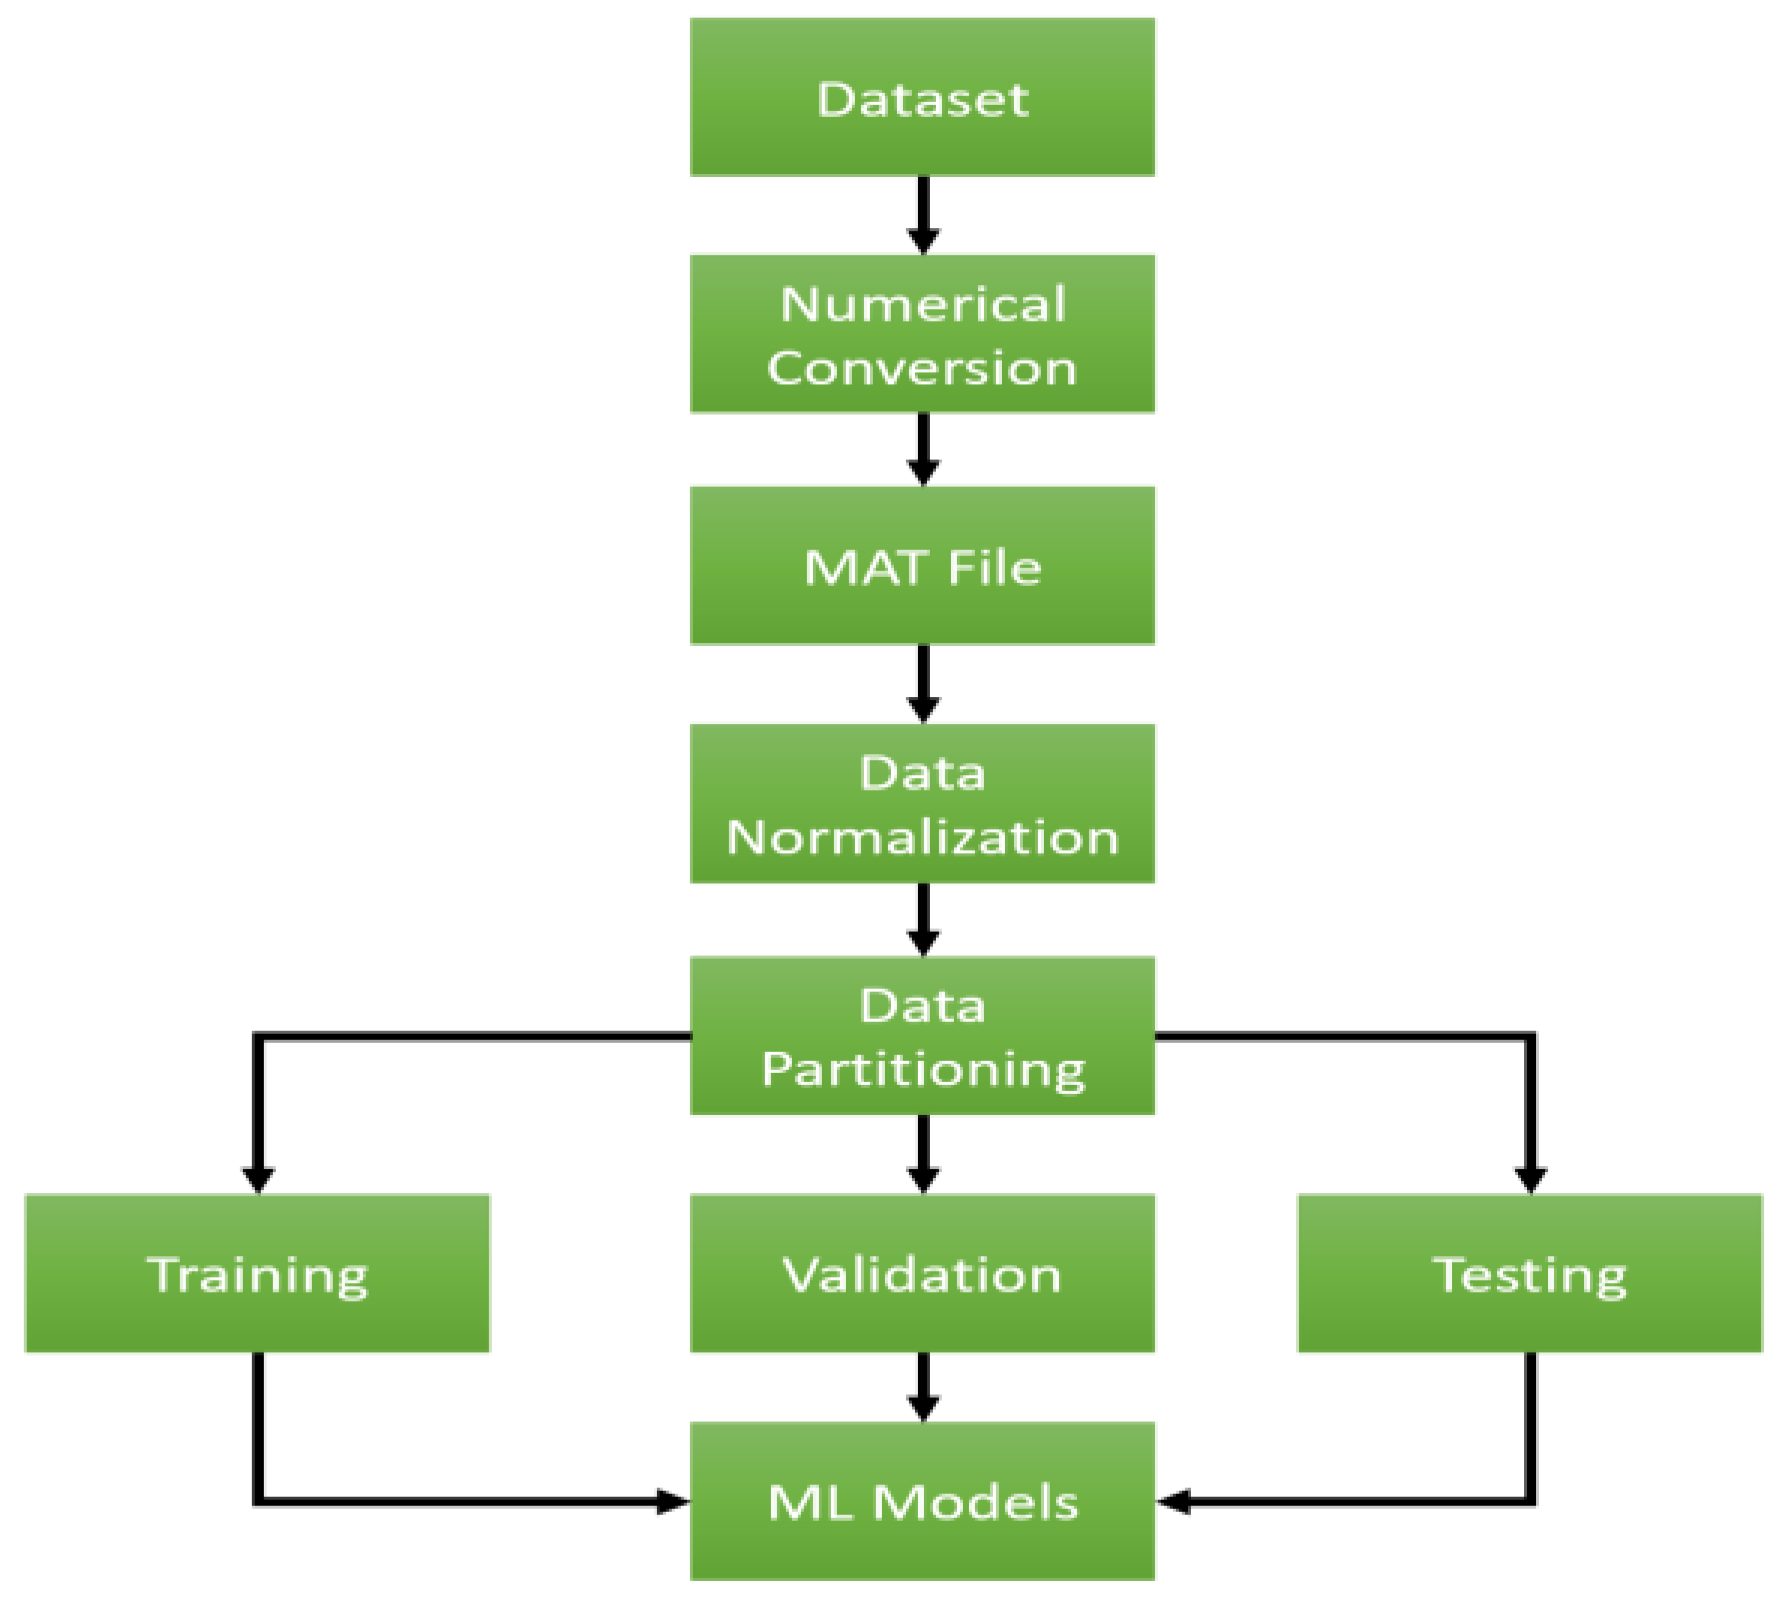
5.1. Data Pre-Processing

Data preprocessing is a technique to prepare the dataset to be fed to a machine learning model [38]. Figure 12 depicts the preprocessing step. Initially, the dataset was stored in a Comma-Separated Value (CSV) format. Next, any string value of the matrix was converted to a numerical record, as discussed in the Feature Engineering section (Section 4.2). Then, the CSV file was converted to a MAT file (Matlab matrix). After that, the dataset was normalized, so each matrix value had a value between 0 and 1. For the data partitioning procedure, data were randomly divided into parts 70% for training, 25% for testing, and 5% for validation. We used an across-validation technique as a validation scheme for our research. Finally, data were fed to the machine learning model, which will be discussed next.

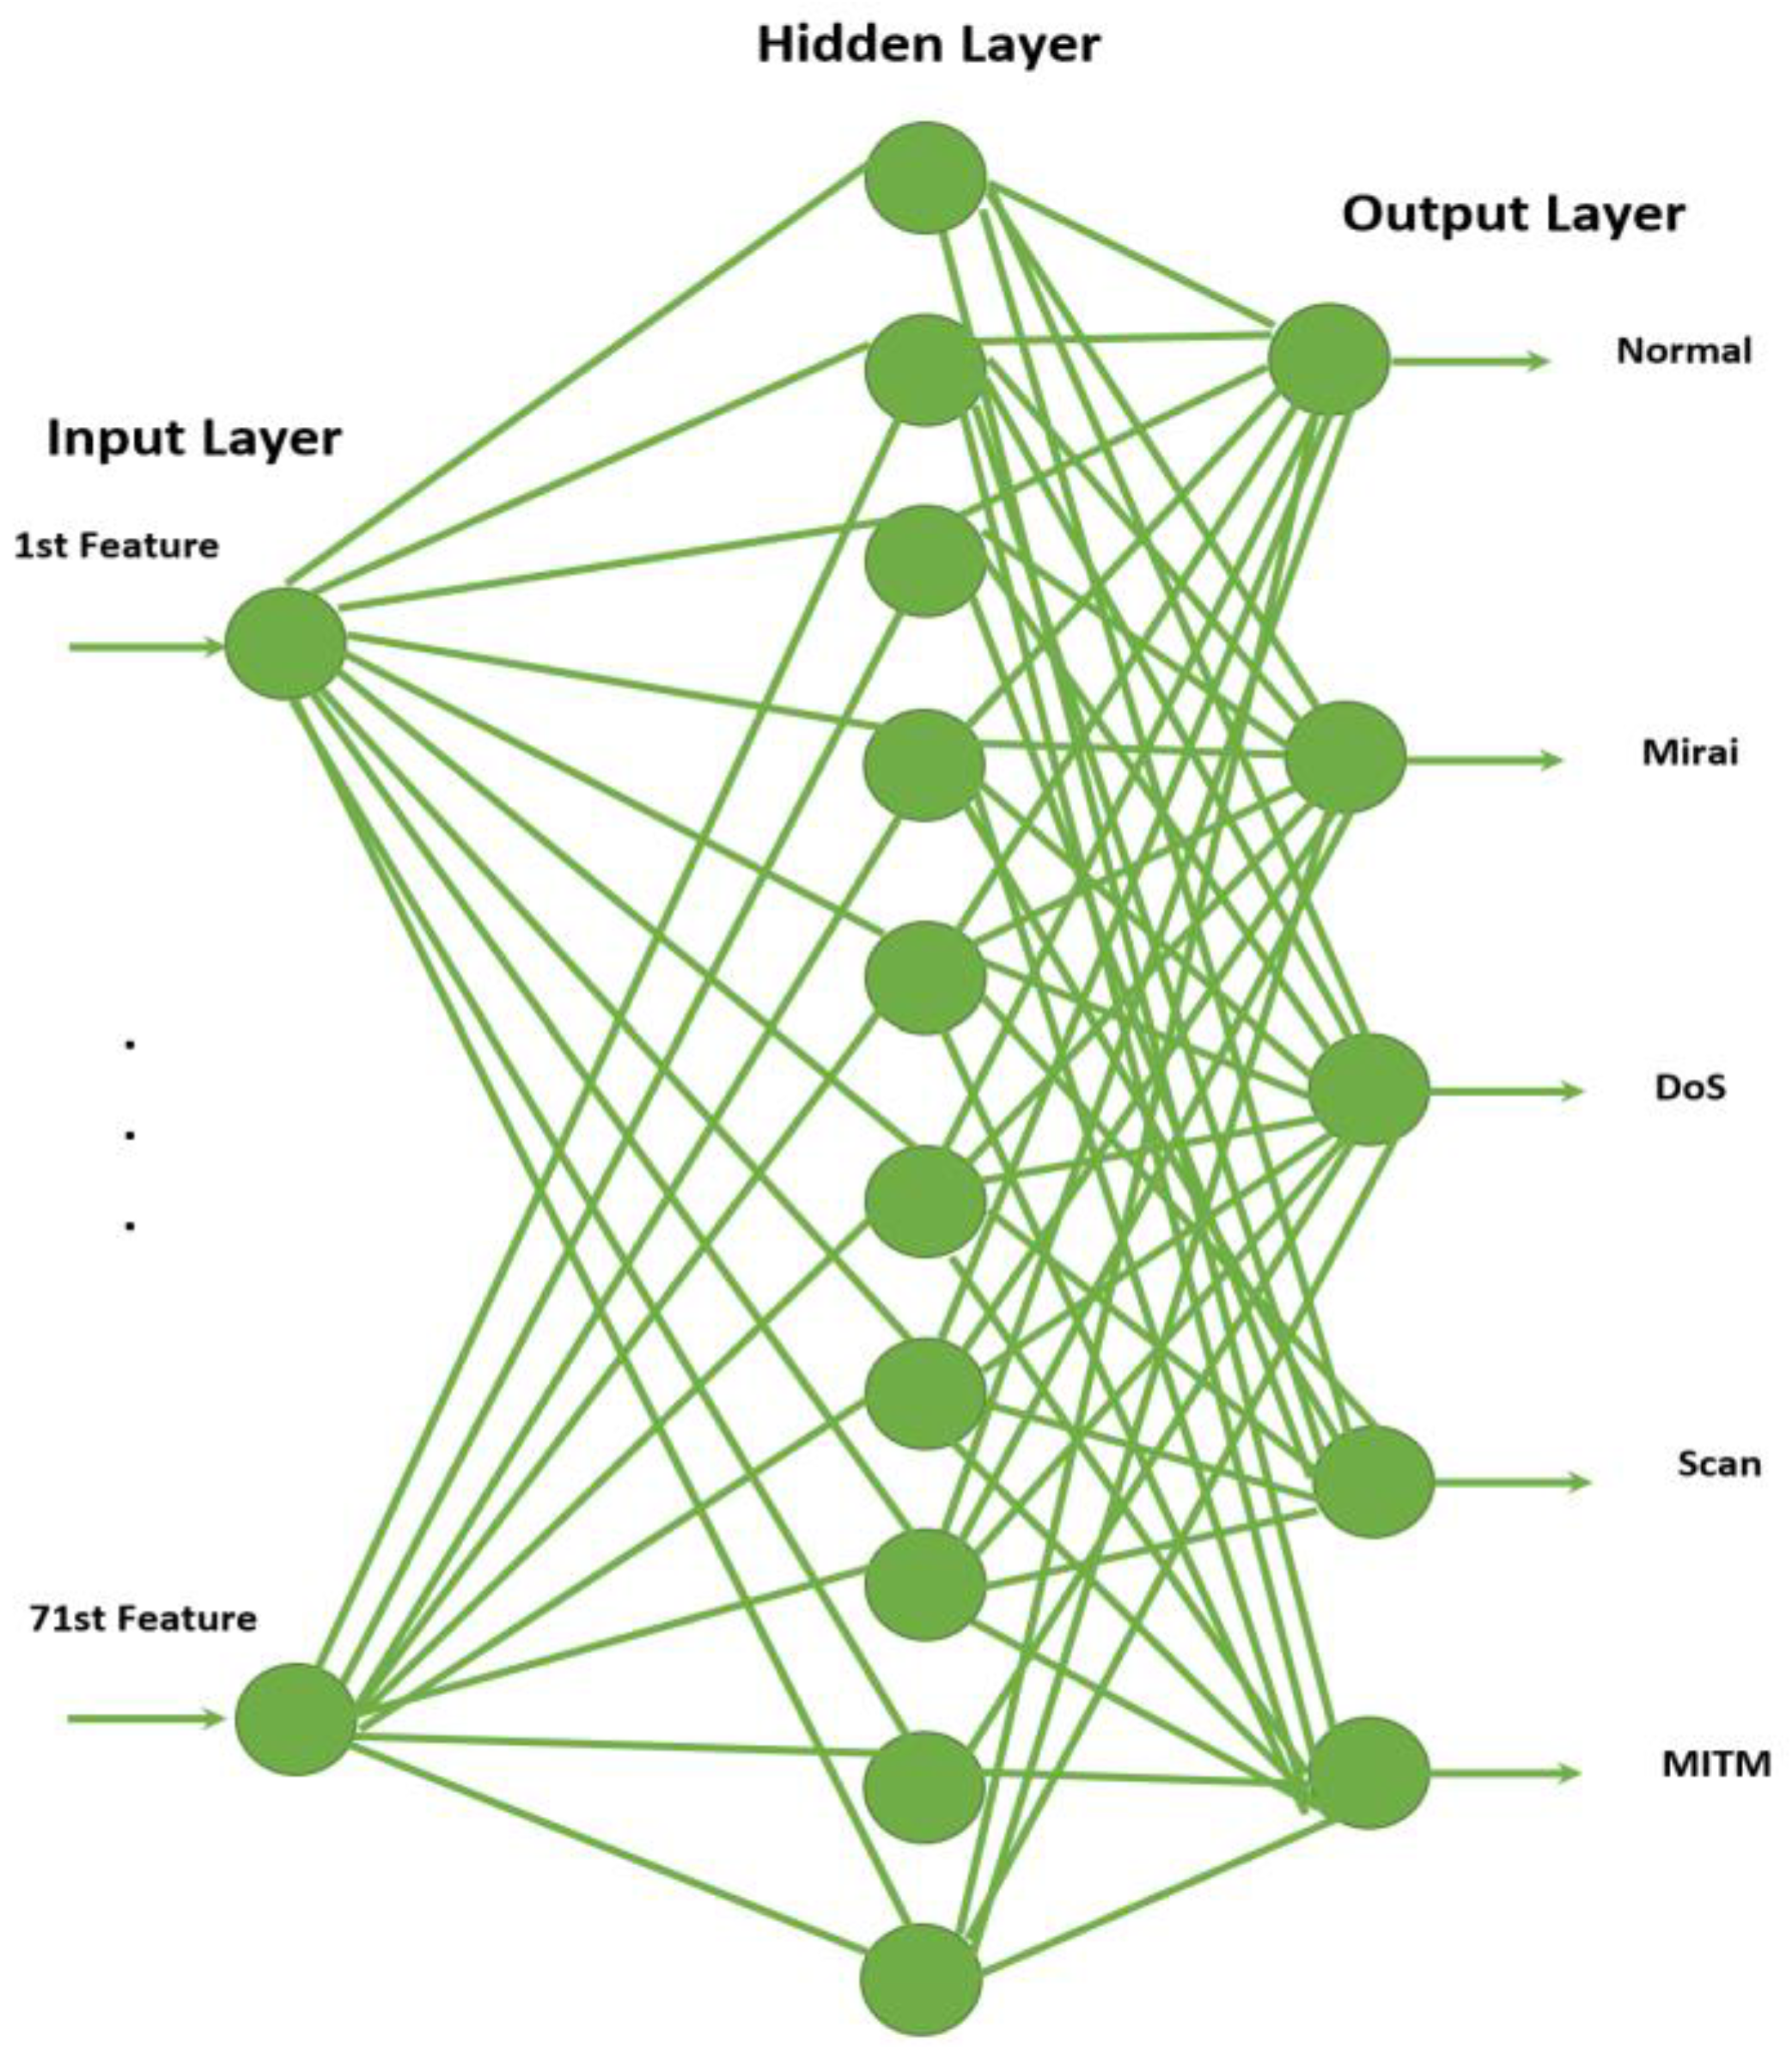
5.2. Detection and Classification Procedures

The detection procedure generates the label feature, which consists of two classifications, and the output is either normal or an anomaly using the machine learning models mentioned earlier. The classification procedure generates the category feature, which consists of five classifications. The output is either normal, Mirai attack, DoS attack, Scan attack, or MITM attack using the earlier machine learning models.

5.3. Implementation and Validation Environment

The IoTID20 dataset was used to train, validate, and test our proposed detection and classification models. The aforementioned machine learning classifiers (i.e., SNN, DT, NB, SVM, and KNN) were trained, tested, and validated using the IoTID20 dataset. MATLAB® version 2022a [39] developed, tested, and validated the five-machine learning based on the MATLAB classification learner. Classification learner is an application that can be used by the MATLAB platform to easily train, test, and validate numerical datasets by various of the most common machine learning algorithms [40]. Table 4 briefly describes the hardware and software environment the authors used to experiment [41].

6. Results and Discussion

This research proposes predictive models based on machine learning to detect and classify network activity. Ten models were trained, tested, and validated, five for detection and the remaining for classification purposes. For the detection model, network activities were classified into two groups (normal and anomaly). Meanwhile, for the classification model, network activities were classified into five groups (Normal, Mirai attack, DoS attack, Scan attack, and MITM attack)

6.1. Accuracy Evaluation

We evaluated our machine learning models based on the confusion matrix illustrated in Figure 13. The confusion matrix utilizes the True Positive Rate (TPR) and False Negative Rate (FPR). First, TPR and FPR were calculated using Equation (1) and Equation (2), respectively. Then the accuracy was calculated using Equation (3) [42].
TPR = TP / ( TP + FN )
FPR = FP / ( FP + TN )
Accuarcy = ( TP + TN ) / ( TP + TN + FP + FN )
TP is the true positive, meaning that the number of normal traffic is correctly classified as normal. FN is the false negative, meaning that the number of anomaly traffic is classified as normal traffic. Likewise, FP is the false positive, meaning that the number of normal traffic is classified as anomaly traffic. Finally, TN is the false negative, meaning the anomaly traffic is correctly classified as anomaly traffic. In addition, we have evaluated our models in terms of other standard metrics, including precision, recall, F1-Score, and specificity, as represented in Table 5 [43].
Table 5 shows that our detection ML models achieved 100% accuracy in the four metrics (Precision, recall, F1-Score, and specificity). In addition, we accomplished between 99.12% to 99.99% for classification ML models. The reason is that the comprehensive and enhanced data engineering as we have thoroughly investigated the dataset to come up with optimal (best) features that led to almost optimal performance of (precision, recall, F1-Score, and specificity) in the case of detection ML models. We discussed the data engineering process in Section 4.2.
Precision   = TP / ( TP + FP )  
Recall   = TP / ( TP + FN )
F 1 Score   = 2 × ( Precision   ×   Recall ) / ( Precision + Recall )
Specificity   = TN / ( TN + FP )
The confusion matrices for the detection model (binary classification) of all ML techniques were equal for all and are shown in Figure 14a; thus, there was no need for them to be repeated.

6.2. Our Results

Figure 14b illustrates the confusion matrix of the classification model using SNNs. In the case of the detection model, our SNNs have no mislabeled traffic, and the total network traffic classified as normal is 38,596. However, 423,096 of the traffic is classified as anomaly traffic. In the case of the classification model, only twelve of the traffic in the total network traffic were mislabeled. Therefore, the overall accuracy of the two models reached 100%.
The performance of DT is shown in Figure 14c, which shows the confusion matrix of the DT classification model. There are no misclassified traffic in the detection model, and only thirteen network activities were misclassified in the classification model. Therefore, the overall accuracy of the two models reached 100%.
The evaluation performance of BT is represented in Figure 14d, which shows the confusion matrix of the BT classification model. There was no misclassified traffic using the detection model, and only sixteen traffic samples were misclassified using the classification model. In brief, the accuracy of the detection and classification models is 100%.
The performance response of SVM is shown in Figure 14e, which illustrates the confusion matrixes of the SVM classification model. There was no misclassified traffic using the detection model, and only 487 out of 461,696 network activities were misclassified using the classification model. In summary, the accuracy of the detection model is 100%, and the overall accuracy of the classification model reached 99.80%.
The performance of KNN models is shown in Figure 14f, which illustrates the confusion matrix of the KNN classification model. The accuracy of the detection model was 100%, and the overall accuracy of the classification model reached 99.40%. Overall, SSNs, DT, and BT recorded 99.99% better performance than SVM and KNN.

6.3. Comparing Our Findings with Existing Results

To our knowledge, Table 6 lists the recent machine models that researchers have developed to detect or classify the IoTID20 dataset. The table lists two types of classification used by researchers: detection (binary classification) and classification (multiclass classification). For machine learning, it is generally simpler to perform binary classification than multiclass classification [44]. The reason is that in binary classification, the ML needs to select from two decisions, i.e., 0 or 1; however, with multiclass classification, ML needs to choose from more than two decisions and perform sub-binary classification.
We can observe that our results slightly exceed other results due to the comprehensive data engineering process conducted in this research, as stated earlier in Features Engineering subsection (Section 4.2). Additionally, it is worth saying that in this research [35], the authors used several machine learning classifiers such as DT, SVM, and ensemble to detect and classify network activities in the IoTID20 dataset. They claimed they reached 100% using DT for detection and classification models. However, they accomplished low accuracy using SVM (less than 80% in the detection model and less than 50% in the case of the classification model); we reached an accuracy of 100% for the detection model and 99.80% for the classification model using SVM due to the feature engineering we discussed earlier.

6.4. Limitations of the Study

The Minimum Redundancy and Maximum Relevance (MRMR) algorithms were used for the feature selection procedure [46]. Each feature was ranked based on minimum redundancy and maximum relevance and assigned an importance score [47]. Therefore, a feature with a high score is more important than a less-score feature. In addition, a large drop in the rank between features will ease the feature selection. However, a small drop will make the feature selection more challenging. Thus, this research discarded the sub-category feature because, after performing the MRMR algorithm on the sub-category feature, we observed that the drop in score between the 11th and the 72nd was relatively small, as shown in Figure 15.

7. Conclusions and Future Work

This research presents a new automated and intelligent intrusion detection system which was modeled, implemented, and evaluated. The proposed predictive IDS utilizes machine learning techniques to detect and classify network activity in an IoT system. Particularly, five supervised learning models have been used, including shallow neural networks (SNNs), decision trees (DT), bagged trees (BT), support vector machine (SVM), and k-nearest neighbor (kNN). The developed models were evaluated on a recent broad dataset known as the IoTID20. Additionally, the features’ engineering approach was used with the dataset to increase the accuracy of the machine learning models. We used the confusion matrix metric to evaluate our models. As a result, our detection models recorded 100% for all machine learning models mentioned above. Furthermore, our classification models recorded 100% for the SNNs, DT, and BT, while KNN and SVM recorded 99.80% and 99.40%, respectively.
Moreover, we will evaluate our predictive models with multiple IoT system datasets. In the future, we will seek to incorporate more datasets to develop a comparative study that compares the selected ML algorithms using several datasets. This will enrich the detection ability to detect more attack vectors in addition to those mentioned in this paper. Additionally, we believe that real-world deployment of the proposed IDS and ICS in various IoT or CPS networks (such as the internet of autonomous vehicles) is essential for more precise implementation representation and practical investigations. Furthermore, one can employ the deep neural networks or the log-linear neural networks [48]-based intrusion detection system to provide deeper detection for the sub-categories of the stated attack vectors.

Author Contributions

Conceptualization, A.A.A. and Q.A.A.-H.; Methodology, A.A.A. and Q.A.A.-H.; Software, A.A.A.; Validation, Q.A.A.-H., A.T. and A.A.; Formal analysis, A.A.A., Q.A.A.-H. and A.T.; Investigation, Q.A.A.-H. and A.T.; Resources, A.T.; Writing—original draft, A.A.A., Q.A.A.-H. and A.T.; Writing—review & editing, A.A.A., Q.A.A.-H., A.T. and A.A.; Visualization, A.A.; Funding acquisition, A.A.A. and A.A. All authors have read and agreed to the published version of the manuscript.

Funding

This project was funded by the Deanship of Scientific Research (DSR) at King Abdulaziz University, Jeddah, under grant No. IFPIP: 701-611-1443. The authors, therefore, acknowledge with thanks DSR for technical and financial support.

Institutional Review Board Statement

Not applicable.

Informed Consent Statement

Not applicable.

Data Availability Statement

The dataset employed in this research can be retrieved online from: https://sites.google.com/view/iot-network-intrusion-dataset/home (accessed on 11 June 2022).

Conflicts of Interest

The authors declare that they have no conflict of interest to report regarding the present study.

References

  1. Kiourtis, A.; Mavrogiorgou, A.; Kyriazis, D.; Maglogiannis, I.; Themistocleous, M. Exploring the complete data path for data interoperability in cyber-physical systems. Int. J. High-Perform. Comput. Netw. 2018, 12, 339–349. [Google Scholar] [CrossRef]
  2. Smadi, A.A.; Ajao, B.T.; Johnson, B.K.; Lei, H.; Chakhchoukh, Y.; Abu Al-Haija, Q. A Comprehensive survey on cyber-physical smart grid testbed architectures: Requirements and challenges. Electronics 2021, 10, 1043. [Google Scholar] [CrossRef]
  3. Al-Haija, A.Q.; Krichen, M.; Elhaija, A. Machine-learning-based darknet traffic detection system for IoT applications. Electronics 2022, 11, 556. [Google Scholar] [CrossRef]
  4. Hassija, V.; Chamola, V.; Saxena, V.; Jain, D.; Goyal, P.; Sikdar, B. A survey on IoT security: Application areas, security threats, and solution architectures. IEEE Access 2019, 7, 82721–82743. [Google Scholar] [CrossRef]
  5. Gharaibeh, A. Smart cities: A survey on data management, security, and enabling technologies. IEEE Commun. Surv. Tutor. 2017, 19, 2456–2501. [Google Scholar] [CrossRef]
  6. Ray, S.; Jin, Y.; Raychowdhury, A. The changing computing paradigm with the internet of things: A Tutorial Introduction. IEEE Des. Test Comput. 2016, 33, 76–96. [Google Scholar] [CrossRef]
  7. Abu Al-Haija, Q.; Smadi, A.A.; Allehyani, M.F. Meticulously intelligent identification system for smart grid network stability to optimize risk management. Energies 2021, 14, 6935. [Google Scholar] [CrossRef]
  8. Quy, V.K.; Hau, N.V.; Anh, D.V.; Quy, N.M.; Ban, N.T.; Lanza, S.; Randazzo, G.; Muzirafuti, A. IoT-enabled smart agriculture: Architecture, applications, and challenges. Appl. Sci. 2022, 12, 3396. [Google Scholar] [CrossRef]
  9. Jose, A.C.; Malekian, R. Improving smart home security: Integrating logical sensing into smart home. IEEE Sens. J. 2017, 17, 4269–4286. [Google Scholar] [CrossRef] [Green Version]
  10. Al-Haija, Q.A.; Al-Saraireh, J. Asymmetric identification model for human-robot contacts via supervised learning. Symmetry 2022, 14, 591. [Google Scholar] [CrossRef]
  11. Albulayhi, K.; Smadi, A.A.; Sheldon, F.T.; Abercrombie, R.K. IoT intrusion detection taxonomy, reference architecture, and analyses. Sensors 2021, 21, 6432. [Google Scholar] [CrossRef] [PubMed]
  12. Mahmoud, R.; Yousuf, T.; Aloul, F.; Zualkernan, I. Internet of things (IoT) security: Current status, challenges, and prospective measures. In Proceedings of the 2015 10th International Conference for Internet Technology and Secured Transactions (ICITST), London, UK, 14–16 December 2015; pp. 336–341. [Google Scholar]
  13. Albulayhi, K.; Sheldon, F.T. An adaptive deep-ensemble anomaly-based intrusion detection system for the internet of things. In 2021 IEEE World AI IoT Congress (AIIoT); AIIoT: Seattle, WA, USA, 2021; pp. 0187–0196. [Google Scholar]
  14. Abu Al-Haija, Q. Top-down machine learning-based architecture for cyberattacks identification and classification in IoT communication networks. Front. Big Data 2022, 4, 782902. [Google Scholar] [CrossRef] [PubMed]
  15. Ahmad, Z.; Khan, A.S.; Wai Shiang, C.; Abdullah, J.; Ahmad, F. Network intrusion detection system: A systematic study of machine learning and deep learning approaches. Trans. Emerg. Telecommun. Technol. 2021, 32, e4150. [Google Scholar] [CrossRef]
  16. Abu Al-Haija, Q.; Ishtaiwi, A. Machine learning based model to identify firewall decisions to improve cyber-defense. Int. J. Adv. Sci. Eng. Inf. 2021, 11, 1688–1695. [Google Scholar] [CrossRef]
  17. Abdulhammed, R.; Hassan, M.; Ali, A.; Miad, F.; Abdelshakour, A. Features dimensionality reduction approaches for machine learning-based network intrusion detection. Electronics 2019, 8, 322. [Google Scholar] [CrossRef] [Green Version]
  18. Sarwar, A.; Hasan, S.; Khan, W.U. Design of an advance intrusion detection system for IoT networks. In Proceedings of the 2022 2nd International Conference on Artificial Intelligence (ICAI), Islamabad, Pakistan, 30–31 March 2022. [Google Scholar]
  19. Song, Y.; Hyun, S.; Cheong, Y.-G. Analysis of autoencoders for network intrusion detection. Sensors 2021, 21, 4294. [Google Scholar] [CrossRef]
  20. Alkahtani, H.; Aldhyani, T.H.H. Intrusion detection system to advance internet of things infrastructure-based deep learning algorithms. Complexity 2021, 2021, 5579851. [Google Scholar] [CrossRef]
  21. Yang, L.; Shami, A. A lightweight concept drift detection and adaptation framework for IoT data streams. IEEE Internet Things Mag. 2021, 4, 96–101. [Google Scholar] [CrossRef]
  22. Al-Haija, Q.A.; Zein-Sabatto, S. An efficient deep-learning-based detection and classification system for cyber-attacks in IoT communication networks. Electronics 2020, 9, 2152. [Google Scholar] [CrossRef]
  23. Albulayhi, K.; Abu Al-Haija, Q.; Alsuhibany, S.A.; Jillepalli, A.A. IoT intrusion detection using machine learning with a novel high performing feature selection method. Appl. Sci. 2022, 12, 5015. [Google Scholar] [CrossRef]
  24. Shahraki, A.; Abbasi, M.; Haugen, Ø. Boosting algorithms for network intrusion detection: A comparative evaluation of real AdaBoost, Gentle AdaBoost and Modest AdaBoost. Eng. Appl. Artif. Intell. 2021, 94, 10370–10380. [Google Scholar] [CrossRef]
  25. Moustafa, N. A new distributed architecture for evaluating AI-based security systems at the edge: Network TON_IoT datasets. Sustain. Cities Soc. 2021, 72, 102994. [Google Scholar] [CrossRef]
  26. Priya, V.; Thaseen, I.S.; Gadekallu, T.R.; Aboudaif, M.K.; Nasr, E.A. Robust attack detection approach for IIoT using ensemble classifier. Comput. Mater. Contin. 2021, 66, 2457–2470. [Google Scholar]
  27. Abu Al-Haija, Q.; Al-Dala’ien, M. ELBA-IoT: An ensemble learning model for botnet attack detection in iot networks. J. Sens. Actuator Netw. 2022, 11, 18. [Google Scholar] [CrossRef]
  28. AlShahrani, B.M.M. Classification of cyber-attack using Adaboost regression classifier and securing the network. Turk. J. Comput. Math. Educ. 2021, 12, 1215–1223. [Google Scholar]
  29. Yang, X.; David, L.; Xia, X.; Sun, J. TLEL: A two-layer ensemble learning approach for just-in-time defect prediction. Inf. Softw. Technol. 2017, 87, 206–220. [Google Scholar] [CrossRef]
  30. Al-Haija, Q.A.; Al-Badawi, A. Attack-Aware IoT network traffic routing leveraging ensemble learning. Sensors 2022, 22, 241. [Google Scholar] [CrossRef]
  31. Ashraf, J.; Keshk, M.; Moustafa, N.; Abdel-Basset, M.; Khurshid, H.; Bakhshi, A.D.; Mostafa, R.R. IoTBoT-IDS: A novel statistical learning-enabled botnet detection framework for protecting networks of smart cities. Sustain. Cities Soc. 2021, 72, 103041. [Google Scholar] [CrossRef]
  32. Abu Al-Haija, Q.; Al Badawi, A.; Bojja, G.R. Boost-defence for resilient iot networks: A head-to-toe approach. Expert Syst. 2022, 39, e12934. [Google Scholar] [CrossRef]
  33. Uddin, S.; Khan, A.; Hossain, M.E.; Moni, M.A. Comparing different supervised machine learning algorithms for disease prediction. BMC Med. Inform. Decis. Mak. 2019, 19, 281. [Google Scholar] [CrossRef]
  34. Derhab, A.; Aldweesh, A.; Emam, A.Z.; Khan, F.A. Intrusion detection system for internet of things based on temporal convolution neural network and efficient feature engineering. Wirel. Commun. Mob. Comput. 2020, 2020, 16. [Google Scholar] [CrossRef]
  35. Ullah, I.; Mahmoud, Q.H. A scheme for generating a dataset for anomalous activity detection in IoT networks. In Proceedings of the Canadian Conference on Artificial Intelligence (CCAI), Ottawa, ON, Canada, 13–15 May 2020; pp. 508–520. [Google Scholar]
  36. Shao, E. Encoding IP Address as a Feature for Network Intrusion Detection. Ph.D. Thesis, Purdue University Graduate School, West Lafayette, IN, USA, 2019. [Google Scholar]
  37. Al-Haija, Q.A.; Alsulami, A.A. High-performance classification model to identify ransomware payments for heterogeneous bitcoin networks. Electronics 2021, 10, 2113. [Google Scholar] [CrossRef]
  38. Ahmad, T.; Aziz, M.N. Data preprocessing and feature selection data preprocessing and feature selection. ICIC Express Lett. 2019, 13, 93–101. [Google Scholar]
  39. MathWorks Introduces Release 2022A of Matlab and Simulin MATLAB and Simulink. Available online: https://www.mathworks.com/company/newsroom/mathworks-introduces-release-2022a-of-matlab-and-simulink.html (accessed on 26 November 2022).
  40. Classification Learner, MATLAB. Available online: https://www.mathworks.com/help/stats/classificationlearner-app.html (accessed on 26 November 2022).
  41. User Guides for Nvidia Graphics Cards NVIDIA. Available online: https://nvidia.custhelp.com/app/answers/detail/a_id/4756/~/user-guides-for-nvidia-graphics-cards (accessed on 25 November 2022).
  42. Alsulami, A.A.; Abu Al-Haija, Q.; Alqahtani, A.; Alsini, R. Symmetrical Simulation Scheme for Anomaly Detection in Autonomous Vehicles Based on LSTM Model. Symmetry 2022, 14, 1450. [Google Scholar] [CrossRef]
  43. Nancy, A.A.; Ravindran, D.; Vincent, P.D.R.; Srinivasan, K.; Reina, D.G. Iot-cloud-based smart healthcare monitoring system for heart disease prediction via deep learning. Electronics 2022, 11, 2292. [Google Scholar] [CrossRef]
  44. Abdi, A.; Nabi, R.M.; Sardasht, M.; Mahmood, R. Multiclass classifiers for stock price prediction: A comparison study. J. Harbin Inst. Technol. 2022, 54, 2022. [Google Scholar]
  45. Reddy, D.K.K.; Behera, H.S.; Nayak, J.; Naik, B.; Ghosh, U.; Sharma, P.K. Exact greedy algorithm based split finding approach for intrusion detection in fog-enabled IoT environment. J. Inf. Secur. Appl. 2021, 60, 102866. [Google Scholar] [CrossRef]
  46. Fang, H.; Tang, P.; Si, H. Feature selections using minimal redundancy maximal relevance algorithm for human activity recognition in smart home environments. J. Healthc. Eng. 2020, 2020, 8876782. [Google Scholar] [CrossRef]
  47. Zhao, Z.; Anand, R.; Wang, M. Maximum relevance and minimum redundancy feature selection methods for a marketing machine learning platform. In Proceedings of the 2019 IEEE International Conference on Data Science and Advanced Analytics (DSAA), Washington, DC, USA, 5–8 October 2019; pp. 442–452. [Google Scholar]
  48. Sun, H.; Grishman, R. Lexicalized dependency paths based supervised learning for relation extraction. Comput. Syst. Sci. Eng. 2022, 43, 861–870. [Google Scholar] [CrossRef]
Figure 1. Main types of cyber-attacks against the different layers of IoT systems.
Applsci 12 12336 g001
Figure 2. Typical NIDS architecture.
Applsci 12 12336 g002
Figure 3. Shallow Neural Networks.
Applsci 12 12336 g003
Figure 4. Decision Trees.
Applsci 12 12336 g004
Figure 5. Bagged Trees.
Applsci 12 12336 g005
Figure 6. Support Vector Machine.
Applsci 12 12336 g006
Figure 7. KNN Classifier. (a) shows the initial stage of the KNN algorithm. (b) shows the calculation stage for computing the distance between neighbors. (c) shows the classification stage based on the K value.
Applsci 12 12336 g007
Figure 8. IoT device architecture.
Applsci 12 12336 g008
Figure 9. Network traffic during the week.
Applsci 12 12336 g009
Figure 10. Network traffic in the morning and evening.
Applsci 12 12336 g010
Figure 11. The architecture of ML models for prediction instruction attacks.
Applsci 12 12336 g011
Figure 12. Data pre-processing.
Applsci 12 12336 g012
Figure 13. Confusion matrix for calculating TPR and FPR.
Applsci 12 12336 g013
Figure 14. Confusion Matrix: (a) Detection model (For all models), (b) SNNs Classification model, (c) DT Classification model, (d) BT Classification model, (e) SVM Classification model, (f) kNN Classification model.
Applsci 12 12336 g014aApplsci 12 12336 g014b
Figure 15. MRMR algorithm.
Applsci 12 12336 g015
Table 1. Summary of surveyed related research articles of supervised ML-based anomaly IDS.
Ref.Learning ModelsDatasetsNumber of Features/Number of RecordsCyber-Attacks
[17]Auto-Encoder, random forest (RF), naïve Bayes (NB), Linear/Quadratic Discriminator CICIDS201783 Features/
2,830,540 records
Distributed DoS (DDoS), Heartbleed, structured query language (SQL) Injection, Botnet.
[18]Particle Swarm (PSO),
XG Boost, RF
IoTID2083 Features/
450,00 records
Mirai, DoS, Scan, MITM
[19]Auto-Encoders (AEs)NSL-KDD/IoTID20/
N-BaIoT
43 Features/140,000
83 Features/450,000
114 Features/612,000
Norm, DoS, Probe, R2L, U2R
/Mirai, DoS, Scan, MITM
/Normal, Bashlite, Mirai
[20]Convolutional neural network (CNN), long short-term memory (LSTM), CNN-LSTMNSL-KDD/IoTID20/43 Features/140,000
83 Features/450,000
Norm, DoS, Probe, root to local (R2L), user to root (U2R), /Mirai, DoS, Scan, MITM
[21]LightGBM, Optimized Adaptive and Sliding Windowing (OASW)NSL-KDD/IoTID20/43 Features/140,000
83 Features/450,000
Norm, DoS, Probe, R2L, U2R
/Mirai, DoS, Scan, MITM
[22]Shallow CNNNSL-KDD43 Features/
150,000 Records
Norm, DoS, Probe, R2L, U2R
[23]Bagging, J48, KNN, Multilayer Perceptron (MLP), Ensemble.NSL-KDD/
IoTID20
11–60 Features/
150,00–450,00
Norm, DoS, Probe, R2L, U2R
/Mirai, DoS, Scan, MITM
[24]Adaboost, DTKDDCUP99, UNSW-NB15, NSL-KDD, CICIDS201743–100 Features/
140,000–612,000
DDoS, flooding, U2R, Jamming
[25]Gradient Boosting Machines, RF, NB, Deep Neural Networks (DNN)ToN_IoT7 Features/
1,300,000 records
Normal, DoS, DDoS, Injection, MITM, Password, Scan, Cross-site scripting (XSS), Backdoor, Ransome.
[26]SVM, NB, SNN, RFN_BaIoT, Bot_IoT114 Features/
612,000 records
Normal, Bashlite, Mirai
[27]Adaboost, RusBoost,
Bagging, Ensemble
WUSTL_IIOT-2018, N_BaIoT, and Bot_IoT100–114 Features/
100,000–612,000
Normal, Bashlite, Mirai, Port/Address Scanner.
[28]AdaBoostCICIDS 2019.88 Features/
4,201,795 Records
DDoS, Heartbleed, SQL Injection, Botnet.
[29]SNN, SVM, NB, RF, Self-organizing mapNSL-KDD, KDDCup99, ADFA-LD12, UNSWNB1543–100 Features/
140,000–612,000
DDoS, flooding, U2R, Jamming
[30]Ensembles:(Boosted DT, Subspace kNN, RUSBoosted DT), SNN, Bilayered NN, Logistic Regression KernelDistilled-Kitsune-2018/NSL-KDD dataset43 Features/
145,00–150,000
Mirai, operating system (OS) Scan, Fuzzing, Video Injection, Address Resolution Protocol (ARP), Wiretap, simple service discovery protocol (SSDP), Synchronous DoS, secure sockets layer(SSL)/DoS, Probe, R2L, U2R
[31]Beta Mixture ModelBoT-IoT 2112 Features/
3,000,000 records
DoS, DDoS, Keylogging, OS and Service Scan, and Data exfiltration attacks
[32]AdaBoost DTTON_IoT_2020 datasets7 Features/
1,300,000
DoS, DDoS, Injection Attacks, MITM, Password Attacks, Scanning, XSS Attacks, Backdoor attacks, and Ransomware attacks.
Table 2. IoTID20 dataset statistics.
LabelsNumber of RecordsCategoryNumber of Records
Normal38,598Normal38,598
Anomaly423,098Mirai281,102
DoS59,390
Scan56,744
MITM25,862
Table 3. Dataset feature description.
FeaturesDescriptionType
Src_PortSource port numberINT
Dst_PortDestination port numberINT
ProtocolProtocol type assigned numberINT
Flow_DurationFlow duration in seconds INT
Tot_Fwd_PktsTotal number of forwarding packetsINT
Tot_Bwd_PktsTotal number of backward packetsINT
TotLen_Fwd_PktsThe total length of forwarding packets INT
TotLen_Bwd_PktsThe total length of backward packets INT
Fwd_Pkt_Len_MaxMax length of forwarding packets INT
Fwd_Pkt_Len_MinMin length of forwarding packets INT
Fwd_Pkt_Len_MeanMean length of forwarding packets DOB
Fwd_Pkt_Len_StdStander deviation length of forwarding packets DOB
Bwd_Pkt_Len_MaxMax length of backward packets INT
Bwd_Pkt_Len_MinMin length of backward packetsINT
Bwd_Pkt_Len_MeanMean length of backward packets DOB
Bwd_Pkt_Len_StdStander deviation length of backward packets DOB
Flow_Byts/sFlow bytes in secondsINT
Flow_Pkts/sFlow packets in secondsINT
Flow_IAT_MeanMean of the flow inter-arrival time (IAT) DOB
Flow_IAT_StdStander deviation of the flow IATDOB
Flow_IAT_MaxMax of the flow IATINT
Flow_IAT_MinMin of the flow IATINT
Fwd_IAT_TotTotal of the forwarding IATINT
Fwd_IAT_MeanMean of the forwarding IAT DOB
Fwd_IAT_StdStander deviation of the forwarding IATDOB
Fwd_IAT_MaxMax of the forwarding IAT INT
Fwd_IAT_MinMin of the forwarding IAT INT
Bwd_IAT_TotTotal of the backward IATINT
Bwd_IAT_MeanMean of the backward IAT DOB
Bwd_IAT_StdStander deviation of the backward IAT DOB
Bwd_IAT_MaxMax of the backward IAT INT
Bwd_IAT_MinMin of the backward IAT INT
Fwd_Header_LenLength of the forwarding headerINT
Bwd_Header_LenLength of the backward header INT
Fwd_Pkts/sForward packet in secondsINT
Bwd_Pkts/sBackward packet in secondsINT
Pkt_Len_MinMin of packet length INT
Pkt_Len_MaxMax of packet length INT
Pkt_Len_MeanMean of packet length DOB
Pkt_Len_StdStander deviation of packet length DOB
Pkt_Len_VarThe variance in packet length DOB
ACK_Flag_CntAcknowledgment flag CntINT
Down/Up_RatioDown or up ratioINT
Pkt_Size_AvgAverage packet size DOB
Fwd_Seg_Size_AvgAverage forward segment size DOB
Bwd_Seg_Size_AvgAverage backward segment size DOB
Subflow_Fwd_PktsSubflow forward packetINT
Subflow_Fwd_BytsSubflow forward bytesINT
Subflow_Bwd_PktsSubflow backward packetINT
Subflow_Bwd_BytsSubflow backward bytesINT
Init_Bwd_Win_BytsInitial backward window bytesINT
Fwd_Act_Data_PktsForward acknowledgment data packetsINT
Active_MeanMean active time DOB
Active_StdStander deviation active time DOB
Active_MaxMax active time INT
Active_MinMin active time INT
Idle_MeanMean idle time DOB
Idle_StdStander deviation idle time DOB
Idle_MaxMax idle time INT
Idle_MinMin idle time INT
Src_IP_oct1Source IP octet number part 1INT
Src_IP_oct2Source IP octet number part 2INT
Src_IP_oct3Source IP octet number part 3INT
Src_IP_oct4Source IP octet number part 4INT
Dst_IP_oct1Destination IP octet number part 1INT
Dst_IP_oct2Destination IP octet number part 2INT
Dst_IP_oct3Destination IP octet number part 3INT
Dst_IP_oct4Destination IP octet number part 4INT
Timestamp_DayOfWeekTimestamp day of the weekINT
Timestamp_HourTimestamp in hourINT
Timestamp_AmPm_nTimestamp AM or PMINT
Table 4. Hardware and software description.
Hardware/SoftwareDescription
MATLABVersion 2022a
CPUIntel® Core™ i7-9750H CPU @ 2.60 GHz
Memory16.0 GB
GPUNVIDIA GeForce RTX 2070 GDDR6 @ 8 GB
Table 5. Accuracy evaluation results.
ML ModelDetection/ClassificationPrecisionRecallF1-ScoreSpecificity
SSNsDetection100%100%100%100%
SSNsClassification100%99.99%99.99%100%
DTDetection100%100%100%100%
DTClassification99.99%99.99%99.99%100%
BTDetection100%100%100%100%
BTClassification100%99.99%99.99%100%
SVMDetection100%100%100%100%
SVMClassification99.78%99.81%99.79%99.96%
KNNDetection100%100%100%100%
KNNClassification98.88%99.36%99.12%99.84%
Table 6. Comparing our ML models’ accuracy with existing ML models’ accuracy.
ResearchDetection/ClassificationML ModelAccuracy
Sarwar et al. [18]DetectionRandom Forest98%
Sarwar et al. [18]ClassificationRandom Forest83%
Song. et al. [19]ClassificationAuto-Encoders94.50%
Alkahtani et al. [20]ClassificationConvolutional Neural Networks + Long Short-Term Memory 98.40%
Yang et al. [21]DetectionLightGBM + Optimized Adaptive Sliding Windowing99.9%
Al-Haija et al. [22]ClassificationConvolutional Neural Networks 98.2%
Reddy et al. [45]ClassificationXGBoost99.7%
Proposed MethodClassificationShallow Neural Networks100%
Proposed MethodDetectionShallow Neural Networks100%
Proposed MethodClassificationDecision Trees99.9%
Proposed MethodDetectionDecision Trees100%
Proposed MethodClassificationBagged Trees99.9%
Proposed MethodDetectionBagged Trees100%
Proposed MethodClassificationSupport Vector Machines99.80%
Proposed MethodDetectionSupport Vector Machines 100%
Proposed MethodClassificationK-Nearest Neighbor (KNN)99.40%
Proposed MethodDetectionK-Nearest Neighbor (KNN)100%
Publisher’s Note: MDPI stays neutral with regard to jurisdictional claims in published maps and institutional affiliations.

