
Can Bioelectrical Impedance Analysis (BIA) Be Used to Predict Pig’s Meat Quality In Vivo?

 ,
,  ,
, 
Abstract
1. Introduction
2. Materials and Methods
2.1. Material
2.2. Methods
2.2.1. The Bioelectrical Impedance (BIA)
2.2.2. Meat in Carcass
2.2.3. pH
2.2.4. Color of meat
2.2.5. Drip Loss
2.2.6. Glycolytic Potential
2.2.7. The Content of Intramuscular Fat
2.2.8. Statistical Method
3. Results and Discussion
4. Conclusions
Author Contributions
Funding
Institutional Review Board Statement
Informed Consent Statement
Data Availability Statement
Conflicts of Interest
References
- Berri, C.; Picard, B.; Lebret, B.; Andueza, D.; Lefèvre, F.; Le Bihan-Duval, E.; Beauclercq, S.; Chartrin, P.; Vautier, A.; Legrand, I.; et al. Predicting the quality of meat: Myth or reality? Foods 2019, 8, 436. [Google Scholar] [CrossRef] [PubMed]
- Gagaoua, M.; Duffy, G.; Alvarez, C.; Burgess, C.M.; Hamill, R.; Crofton, E.; Botinestean, C.; Ferragina, A.; Cafferky, J.; Mullen, A.M.; et al. Current research and emerging tools to improve fresh red meat quality. Ir. J. Agric. Food Res. 2022, 1–23. [Google Scholar] [CrossRef]
- Mortimer, S.; Przybylski, W. Breeding strategies for improving meat quality. In Meat Quality Genetic and Environmental Factors; Przybylski, W., Hopkins, D., Eds.; CRC Press: Boca Raton, FL, USA; Taylor & Francis Group: Boca Raton, FL, USA, 2016; pp. 257–285. [Google Scholar]
- Kristensen, L.; Støier, S.; Würtz, J.; Hinrichsen, L. Trends in meat science and technology: The future looks bright, but the journey will be long. Meat Sci. 2014, 98, 322–329. [Google Scholar] [CrossRef] [PubMed]
- Savoia, S.; Albera, A.; Brugiapaglia, A.; Di Stasio, L.; Cecchinato, A.; Bittante, G. Prediction of meat quality traits in the abattoir using portable near-infrared spectrometers: Heritability of predicted traits and genetic correlations with laboratory-measured traits. J. Anim. Sci. Biotechnol. 2021, 12, 29. [Google Scholar] [CrossRef] [PubMed]
- Shi, Y.; Wang, X.; Saidul, B.; Young, J.; Newman, D.; Berg, E.; Sun, X. A Review on Meat Quality Evaluation Methods Based on Non-Destructive Computer Vision and Artificial Intelligence Technologies. Food Sci. Anim. Resour. 2021, 41, 563–588. [Google Scholar] [CrossRef] [PubMed]
- Wojnowski, W.; Majchrzak, T.; Dymerski, T.; Gębicki, J.; Namieśnik, J. Electronic noses: Powerful tools in meat quality assessment. Meat Sci. 2017, 131, 119–131. [Google Scholar] [CrossRef] [PubMed]
- Xiong, Z.; Sun, D.W.; Pu, H.; Gao, W.; Dai, Q. Applications of emerging imaging techniques for meat quality and safety detection and evaluation: A review. Crit. Rev. Food Sci. Nutr. 2017, 57, 755–768. [Google Scholar] [CrossRef]
- Alarcon-Rojo, A.D.; Carrillo-Lopez, L.M.; Reyes-Villagrana, R.; Huerta-Jiménez, M.; Garcia-Galicia, I.A. Ultrasound and meat quality: A review. Ultrason. Sonochem. 2019, 55, 369–382. [Google Scholar] [CrossRef]
- Narsaiah, K.; Biswas, A.K.; Mandal, P.K. Nondestructive methods for carcass and meat quality evaluation. In Meat Quality Analysis; Academic Press: Cambridge, MA, USA, 2020; pp. 37–49. [Google Scholar]
- Yanmaz, B. Use of Infrared Thermography in Determining Meat Quality. Eurasian J. Food Sci. Technol. 2020, 4, 54–58. [Google Scholar]
- Antequera, T.; Caballero, D.; Grassi, S.; Uttaro, B.; Palacios, T.P. Evaluation of fresh meat quality by Hyperspectral Imaging (HSI), Nuclear Magnetic Resonance (NMR) and Magnetic Resonance Imaging (MRI): A review. Meat Sci. 2021, 172, 108340. [Google Scholar] [CrossRef]
- Sanchez, P.D.C.; Arogancia, H.B.T.; Boyles, K.M.; Pontillo, J.B.; Ali, M.M. Emerging nondestructive techniques for the quality and safety evaluation of pork and beef: Recent advances, challenges, and future perspectives. Appl. Food Res. 2022, 2, 100147. [Google Scholar] [CrossRef]
- Kyle, U.G.; Bosaeus, I.; Lorenzo, A.D.; Deurenberg, P.; Elia, M.; Gomez, J.M.; Heitmann, B.L.; Kent-Smith, L.; Melchior, J.-C.; Pirlich, M.; et al. Bioelectrical impedance analysis. Part I: Review of principles and methods. Clin. Nutr. 2004, 23, 1226–1243. [Google Scholar]
- Skalicky, M. Housing conditions influence the survival and body composition of ageing rats. Exp. Gerontol. 2001, 36, 159–170. [Google Scholar] [CrossRef]
- Yokoi, K.; Lukaski, H.C.; Uthus, E.O.; Nielsen, F.H. Use of bioimpedance spectroscopy to estimate body water distribution in rats fed high dietary sulfur amino acids. J. Nutr. 2001, 131, 1302–1308. [Google Scholar] [CrossRef][Green Version]
- Barcelos, S.S.; Vargas, J.A.C.; Mezzomo, R.; Gionelli, M.P.; Gomes, D.I.; Oliveira, L.R.S.; Luz, J.B.; Maciel, D.I.; Lves, K.S. Predicting the chemical composition of the body and the carcass of hair sheep using body parts and carcass measurements. Animal 2021, 15, 100139. [Google Scholar] [CrossRef]
- Bohuslavek, Z.; Pipek, P.; Maly, J. Use of BIA method for the estimation of beef carcass composition–weight of longissimus lumborum muscle, ratio of muscle tissue and fat in loin crosssection. Czech J. Anim. Sci. 2002, 47, 387–394. [Google Scholar]
- Elliott, D.A.; Backus, R.C.; Van Loan, M.D.; Rogers, Q.R. Evaluation of multifrequency bioelectrical impedance analysis for the assessment of extracellular and total body water in healthy cats. J. Nutri. 2002, 132, 1757S–1759S. [Google Scholar] [CrossRef] [PubMed]
- Fielding, C.L.; Magdesian, K.G.; Elliott, D.A. Use of multifrequency bioelectrical impedance analysis for estimation of total body water and extracellular and intracellular fluid volumes in horses. Am. J. Vet. Res. 2004, 65, 320–326. [Google Scholar] [CrossRef]
- Huff-Lonergan, E.; Lonergan, S.M. Mechanisms of water-holding capacity of meat: The role of postmortem biochemical and structural changes. Meat Sci. 2005, 71, 194–204. [Google Scholar] [CrossRef]
- Schumacher, L.L.; Viégas, J.; dos Santos Cardoso, G.; Moro, A.B.; Tonin, T.J.; Pereira, S.N.; da Rocha, L.T.; Van Caeneghen, A.L.; Teixeira, J.V. Bioelectrical impedance analysis (BIA) in animal production. Rev. Mex. Cienc. Pecu. 2021, 12, 553–572. [Google Scholar]
- Damez, J.-L.; Clerjon, S. Meat quality assessment using biophysical methods related to meat structure. Meat Sci. 2008, 80, 132–149. [Google Scholar] [CrossRef] [PubMed]
- van Kempen, T. Infrared technology in animal production. Worlds Poult. Sci. J. 2001, 57, 29–48. [Google Scholar] [CrossRef]
- Bertram, H.C.; Andersen, H.J. Applications of NMR in meat science. Annu. Rep. NMR Spectrosc. 2004, 5353, 157–202. [Google Scholar]
- Sokolov, N.V.; Karmanov, D.A. Ultrasonic Assessment of Meat Quality Traits in Pigs. Rus. Agric. Sci. 2013, 39, 78–81. [Google Scholar] [CrossRef]
- Monin, P.; Sellier, P. Pork of low technological quality with a normal rate of muscle pH fall in the immediate post-mortem period: The case of the Hampshire breed. Meat Sci. 1985, 12, 49–63. [Google Scholar] [CrossRef]
- Przybylski, W.; Sionek, B.; Jaworska, D.; Santé-Lhoutellier, V. The application of biosensors for drip loss analysis and glycolytic potential evaluation. Meat Sci. 2016, 117, 7–11. [Google Scholar] [CrossRef]
- PN-ISO 1444:2000; Meat and Meat Products–Determination of Three Fat Content. Polish Committee for Standardization: Warsaw, Poland, 2013.
- Hamilton, D.N.; Miller, K.D.; Ellis, M.; McKeith, F.K.; Wilson, E.R. Relationships between longissimus glycolytic potential and swine growth performance, carcass traits, and pork quality. Anim. Sci. J. 2003, 81, 2206–2212. [Google Scholar] [CrossRef]
- Nanni Costa, L.; Tassone, F.; Davoli, R.; Fontanesi, L.; Dall’Olio, S.; Colombo, M.; Russo, V. Glycolytic potential in semimembranosus muscle of Italian Large White pigs. J. Muscle Foods 2009, 20, 392–400. [Google Scholar] [CrossRef]
- Swantek, P.M.; Marchello, M.J.; Tilton, J.E.; Crenshaw, J.D. Prediction of fat-free mass of pigs from 50 to 130 kilograms live weight. J. Anim. Sci. 1999, 77, 893–897. [Google Scholar] [CrossRef]
- Marchello, M.J.; Berg, P.T.; Swantek, P.M.; Tilton, J.E. Predicting live and carcass lean using bioelectrical impedance technology in pigs. Livest. Prod. Sci. 1999, 58, 151–157. [Google Scholar] [CrossRef]
- Daza, A.; Mateos, A.; Ovejero, I.; Bote, C.L. Prediction of body composition of Iberian pigs by means bioelectrical impedance. Meat Sci. 2006, 72, 43–46. [Google Scholar] [CrossRef] [PubMed]
- Suliga, P.; Abie, S.M.; Egelandsdal, B.; Alvesike, O.; Johny, A.; Kathiresan, P.; Münch, D. Beyond standard PSE testing: An exploratory study of bioimpedance as a maker for ham defects. Meat Sci. 2022, 194, 108980. [Google Scholar] [CrossRef]
- Fang, H.T.; Liu, H.Y. Deligeersang. Variations and mutual relationships of bio-impedance value, pH value and water loss rate of bovine muscles. Food Sci. 2008, 29, 116–119. [Google Scholar]
- Yang, Y.; Wang, Z.Y.; Ding, Q.; Huang, L.; Wang, C.; Zhu, D.Z. Moisture content prediction of porcine meat by bioelectrical impedance spectroscopy. Math. Comp. Model 2013, 58, 819–825. [Google Scholar] [CrossRef]
- Xie, Y.D.; Xiao, W.M.; Kang, D.C.; Zhou, G.H.; Xu, X.L.; Zhang, W.G. A method for detection of chilled pork freshness using bioimpedance. J. Nanjing Agric. Univ. 2016, 39, 845–851. [Google Scholar]
- Cox, M.K.; Heintz, R.; Hartman, K. Measurements of resistance and reactance in fish with the use of bioelectrical impedance analysis: Sources of error. Fish. Bull. 2011, 109, 34–47. [Google Scholar]
- Bertotti, F.S. Sistema de biotelemetria passiva e técnica de medição para aquisição da impedância elétrica de tecido animal post mortem. Ph.D. Thesis, Universidade Tecnológica Federal do Paraná, Curitiba, Brazil, 2010. [Google Scholar]
- Afonso, J.; Guedes, C.; Santo, V.; Morais, R.; Silva, J.; Teixeira, A.; Silva, S. Utilization of bioelectrical impedance to predict intramuscular fat and physicochemical traits of the beef Longissimus thoracis et Lumborum Muscle. Foods 2020, 9, 836. [Google Scholar] [CrossRef]
- Zollinger, B.L.; Farrow, R.L.; Lawrence, T.E.; Latman, N.S. Prediction of beef carcass salable yield and trimmable fat using bioelectrical impedance analysis. Meat Sci. 2010, 84, 449–454. [Google Scholar] [CrossRef]
- Copenhafer, T.L.; Richert, B.T.; Schnickel, A.P.; Grant, A.L.; Gerrard, D.E. Augmented postmortem glycolysis does not occur early postmortem in AMPKγ 3-mutated porcine muscle of halothane positive pigs. Meat Sci. 2006, 73, 590–599. [Google Scholar] [CrossRef]
- Moro, A.B.; Galvani, D.G.; Montanholi, Y.R.; Bertemes-Filho, P.; Venturini, R.S.; Martins, A.A.; da Silva, L.P.; Pires, C.C. Assessing the composition of the soft tissue in lamb carcasses with bioimpedance and accessory measures. Meat Sci. 2020, 169, 108192. [Google Scholar]


| Variables | Statistical Measures | |
|---|---|---|
| Mean | Standard Deviation | |
| Hot carcass weight (kg) | 84.61 | 8.89 |
| Meat in carcass (%) | 60.24 | 1.29 |
| Rz/Xc/HCW | 9.14 | 3.22 |
| Rz (Ω) | 166.00 | 31.92 |
| Xc (Ω) | 23.22 | 6.40 |
| Rz/Xc | 7.63 | 2.46 |
| pH1 | 6.49 | 0.17 |
| pH2 | 5.62 | 0.06 |
| PG (mmol/L) | 130.87 | 16.99 |
| Color L* | 55.12 | 1.58 |
| Color a* | 16.17 | 0.74 |
| Color b* | 9.35 | 0.74 |
| Natural drip loos (%) | 3.66 | 2.05 |
| Intramuscular fat (%) | 1.71 | 1.26 |
| Variables | Pearson Correlations | Spearman Correlations | ||||||
|---|---|---|---|---|---|---|---|---|
| Rz/Xc/HCW | Rz/Xc | Rz (Ω) | Xc (Ω) | Rz/Xc/HCW | Rz/Xc | Rz (Ω) | Xc (Ω) | |
| pH1 | −0.06 | −0.03 | 0.48 * | 0.29 | −0.03 | 0.48 * | 0.29 | −0.03 |
| Color b* | −0.40 | −0.39 | −0.32 | 0.35 | −0.62 * | 0.36 | 0.44 | −0.51 * |
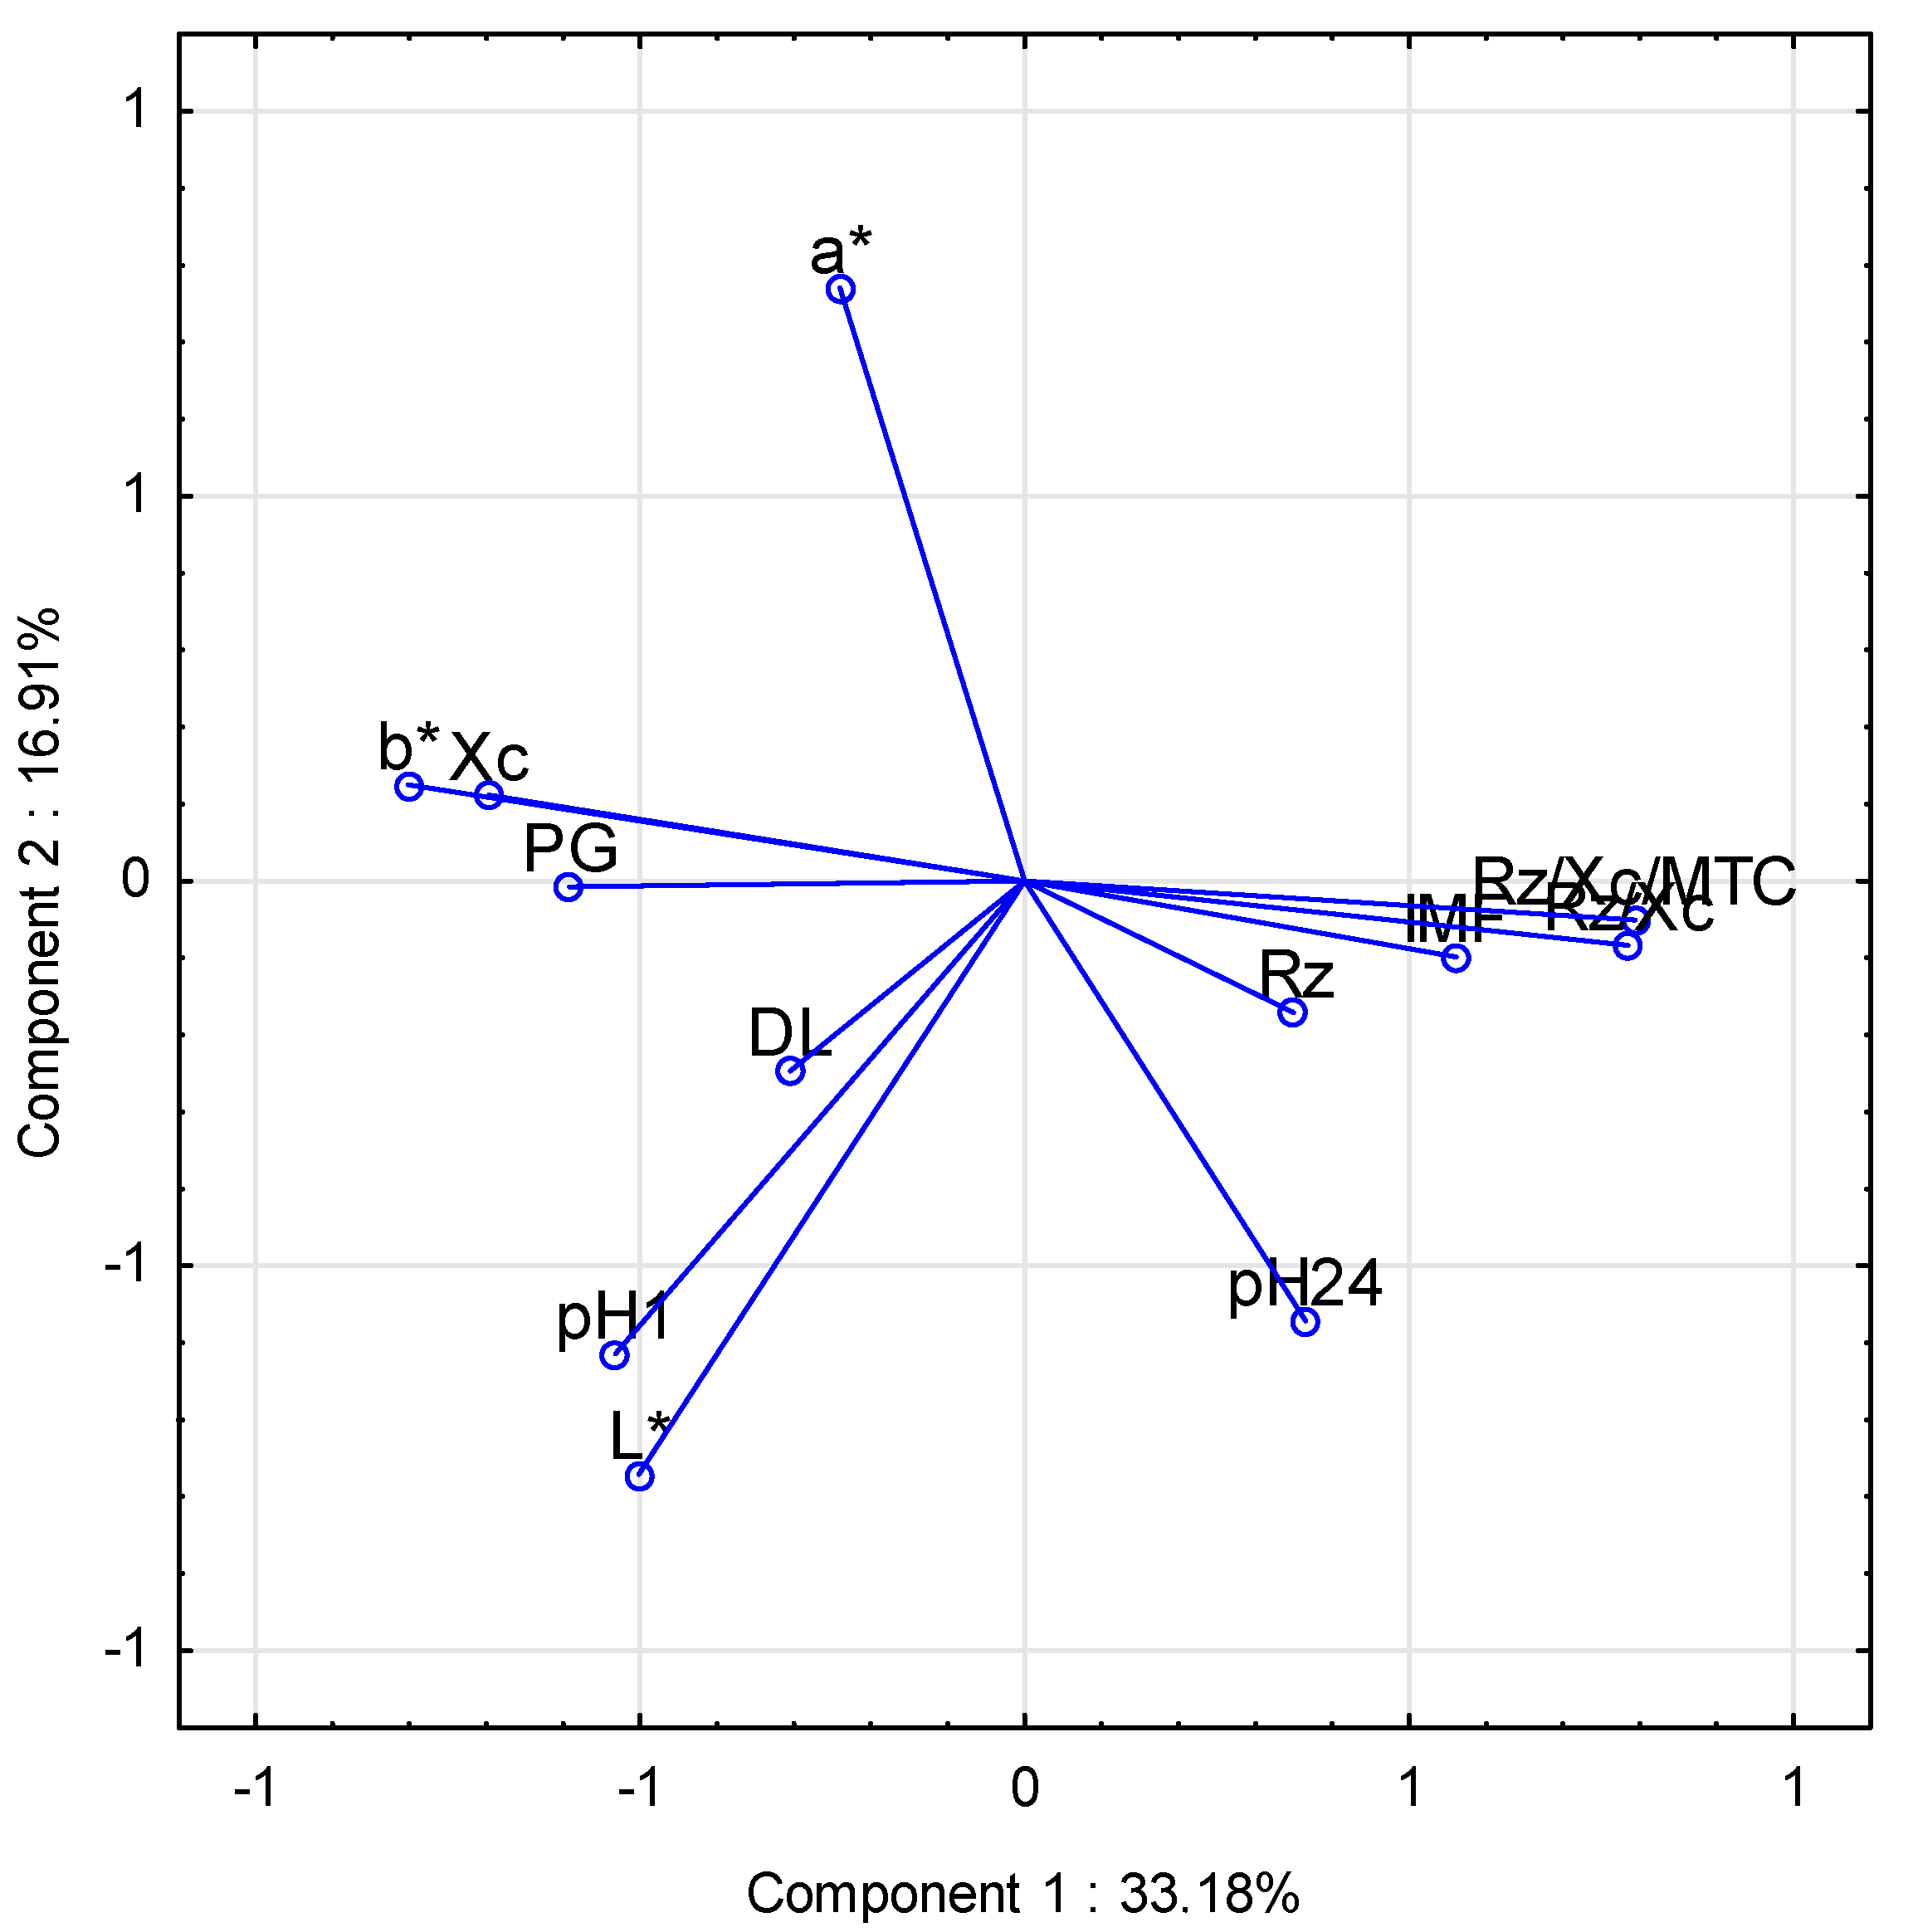
| Variables | Principal Component | |
|---|---|---|
| Component 1 | Component 2 | |
| Rz/Xc/HCW | 0.79 | −0.05 |
| Rz (Ω) | 0.35 | −0.17 |
| Xc (Ω) | −0.70 | 0.11 |
| Rz/Xc | 0.78 | −0.08 |
| pH1 | −0.53 | −0.61 |
| pH24 | 0.37 | −0.57 |
| PG (mmol/L) | −0.59 | −0.01 |
| Color L* | −0.50 | −0.77 |
| Color a* | −0.24 | 0.77 |
| Color b* | −0.80 | 0.13 |
| Natural drip loos (%) | −0.31 | −0.25 |
| Intramuscular fat (%) | 0.56 | −0.10 |
| Variables | Clusters | ||
|---|---|---|---|
| Cluster 1 | Cluster 2 | Cluster 3 | |
| Rz/Xc/HCW | 11.05 | 8.66 | 7.80 |
| Rz (Ω) | 197.00 a | 170.33 b | 117.50 c |
| Xc (Ω) | 22.00 | 25.33 | 20.00 |
| Rz/Xc | 9.08 | 7.45 | 6.21 |
| pH1 | 6.48 | 6.52 | 6.44 |
| pH24 | 5.66 a | 5.58 b | 5.65 a |
| PG (mmol/L) | 115.13 a | 140.98 b | 127.78 ab |
| Color L* | 55.15 | 55.25 | 54.81 |
| Color a* | 15.64 | 16.48 | 16.14 |
| Color b* | 8.69 a | 9.71 b | 9.39 ab |
| Natural drip loos (%) | 2.59 | 4.02 | 4.19 |
| Intramuscular fat (%) | 2.48 | 1.41 | 1.45 |
Publisher’s Note: MDPI stays neutral with regard to jurisdictional claims in published maps and institutional affiliations. |
© 2022 by the authors. Licensee MDPI, Basel, Switzerland. This article is an open access article distributed under the terms and conditions of the Creative Commons Attribution (CC BY) license (https://creativecommons.org/licenses/by/4.0/).
Share and Cite
Przybylski, W.; Jaworska, D.; Sot, M.; Sieczko, L.; Niemyjski, S.; Dukaczewska, K.; Wojtasik-Kalinowska, I. Can Bioelectrical Impedance Analysis (BIA) Be Used to Predict Pig’s Meat Quality In Vivo? Appl. Sci. 2022, 12, 12035. https://doi.org/10.3390/app122312035
Przybylski W, Jaworska D, Sot M, Sieczko L, Niemyjski S, Dukaczewska K, Wojtasik-Kalinowska I. Can Bioelectrical Impedance Analysis (BIA) Be Used to Predict Pig’s Meat Quality In Vivo? Applied Sciences. 2022; 12(23):12035. https://doi.org/10.3390/app122312035
Chicago/Turabian StylePrzybylski, Wiesław, Danuta Jaworska, Magdalena Sot, Leszek Sieczko, Stanisław Niemyjski, Karina Dukaczewska, and Iwona Wojtasik-Kalinowska. 2022. "Can Bioelectrical Impedance Analysis (BIA) Be Used to Predict Pig’s Meat Quality In Vivo?" Applied Sciences 12, no. 23: 12035. https://doi.org/10.3390/app122312035
APA StylePrzybylski, W., Jaworska, D., Sot, M., Sieczko, L., Niemyjski, S., Dukaczewska, K., & Wojtasik-Kalinowska, I. (2022). Can Bioelectrical Impedance Analysis (BIA) Be Used to Predict Pig’s Meat Quality In Vivo? Applied Sciences, 12(23), 12035. https://doi.org/10.3390/app122312035