Article

A Cost-Effective Triplet Lens Design with Chromatic Aberration Correction Based on Optimization Algorithm and Illustration Method

1
Department of Optics and Photonics, National Central University, Chungli 32001, Taiwan
2
Department of Electrical Engineering, Feng Chia University, Taichung 40724, Taiwan
*
Author to whom correspondence should be addressed.
Appl. Sci. 2022, 12(23), 11881; https://doi.org/10.3390/app122311881
Submission received: 16 October 2022 / Revised: 15 November 2022 / Accepted: 16 November 2022 / Published: 22 November 2022
(This article belongs to the Special Issue Advanced Optoelectronic Devices)

Abstract

:
This paper proposes an optimization algorithm combined with an illustration method to select the three best glass materials for the design of a thickened triplet lens and a correction of the paraxial chromatic aberrations. In the thin lens thickening process, chromatic aberration arises from the deviation between the real and paraxial chromatic aberrations. To solve this problem, we propose an optimization algorithm and illustration method, which are integrated into a thickened triplet lens design. We optimize the eight thickened triplet lens groups to obtain the longitudinal chromatic aberration curve for the best group in the visible light range from 0.4861 μm to 0.6563 μm. The chromatic aberration curve area is 3.33 × 10⁻⁷ (μm × mm) for the longitudinal chromatic aberration and 2.11 × 10⁻⁵ (μm × mm) for the lateral chromatic aberration. Finally, the chromatic aberration of the thicken triplet lens is close to that of the thin triplet lens design, and the proposed method can obtain a good optical performance.

1. Introduction

Chromatic aberration elimination is a critical part of the optical lens design. The correction of chromatic aberration of the long and short wavelengths at either end of the visible light range is called achromatic correction. However, after correction of the two wavelengths, residual chromatic aberrations at other wavelengths remain, which is called the secondary spectrum. Chromatic aberration correction of three wavelengths including the central wavelength produces a lens which is called apochromatic while four wavelength chromatic aberration corrections are needed for a super achromat [1]. Stephens [2,3] proposed a method for correction of chromatic aberration by selecting the four wavelengths of the F-line (wavelength 0.4861 μm), d-line (wavelength 0.5876 μm), C-line (wavelength 0.6563 μm), and the other wavelength between 0.3650 μm to 1.014 μm combining three different glasses. In 1970, Lessing [4] used a system of four lenses to eliminate the chromatic aberration of the four wavelengths of 0.3650 μm, 0.486 μm, 0.6563 μm, and 1.014 μm. In 1977, Wynne [5] proposed a way to correct secondary chromatic aberration using ordinary glass. Sharma [6] used a graph method to design a doublet lens. Robb [7] developed a method for correction of the longitudinal chromatic aberration for a doublet lens, which could correct the chromatic aberration for at least three wavelengths, and with some combinations for four wavelengths. Rayces and Rosete-Aguilar [8,9] designed an equal optical path system, which can correct spherical aberration, coma, and longitudinal chromatic aberration for a doublet lens. Duplov [10] proposed a system for an apochromatic telescope. Seong [11] used the Mach–Zehnder interferometer principle for the measurement of chromatic aberration. Benny [12] developed a wide-angle eye model and Ravikumar [13] calculated chromatic aberration correction on the retina. Ferrato [14] presented a microscope design for multi-band chromatic aberration correction. Sun et al. [15] proposed a new method for the optimization and correction of chromatic aberration with double prisms, and applied it to a stereo photographic system with achromatic double prism arrays [16] and a doublet lens [17]. In 2010, Sun [18] proposed an illustrating method for a triplet prism combination for minimizing the chromatic aberration.
In our previous publication [15], the triple prisms can be incorporated to correct the chromatic aberration for a thin triplet lens design by increasing the thickness of the thick lens and the spacing between the lenses while maintaining the focal length of the triplet lens. To correct for the increased chromatic aberration caused by the lens thickening, we used an optimization algorithm combined with an illustration method to ensure that the chromatic aberration of the thickened triplet lens system is close to that of a thin lens system. Finally, the triplet lens design is tested with satisfactory results.

2. Methods

2.1. Refractive Index versus Wavelength

The refractive index used in this study and coefficients for the SCHOTT glass are calculated by the Sellmeier equation [19], as shown in the following formula:
n 2 ( λ ) 1 = B 1 λ 2 λ 2 D 1 + B 2 λ 2 λ 2 D 2 + B 3 λ 2 λ 2 D 3
where B1, B2, B3, D1, D2, and D3 are the glass coefficients.

2.2. Chromatic Aberration of a Thin Lens

The formula for the refractive power of a thin lens is expressed as
K λ = 1 f λ = ( n λ 1 ) ( C 1 C 2 ) .
where Kλ, fλ, and nλ are the refractive power, focal length, and refractive index of a thin lens at a certain wavelength, respectively. We define C1 and C2 as the curvature of the first and second surface of the thin lens, respectively.
Since the lateral chromatic aberration of the thin lens is zero, the corrected chromatic aberration is dominated by the longitudinal chromatic aberration. Assuming εFC to be the primary color, which is defined as the refractive power difference between the F-line and C-line of the thin lens,
ε FC = K F K C = K d V d .
where Kd is the refractive power of the thin lens of d-line; Vd is the Abbe number; Vd = (nd − 1)/(nF − nC). Here, nF, nd, and nC are the refractive indexes of the F-line, d-line, and C-line, respectively, and KF and KC are the refractive powers of the F-line and the C-line.
If εdC is the second spectrum and defined as the difference in the refractive power between the d-line and the C-line of the thin lens, then
ε dC = K d K C = P d C V d K d .
where PdC = (nd − nC)/(nF − nC) is the relative partial dispersion.

2.3. Correction of Longitudinal Chromatic Aberration of a Thin Triplet Lens

Assuming that the total refractive power Kd of the fixed three lenses is 0.1 mm−1, and to calculate the primary color εFC and the second spectrum εdC for eliminating the longitudinal chromatic aberration, we apply the theoretical formulas shown in Equations (5)–(7):
K d = 1 f d = K d 1 + K d 2 + K d 3 = 0.1   mm 1 ,
ε FC = K d 1 V d 1 + K d 2 V d 2 + K d 3 V d 3 = 0 ,
ε dC = P d C 1 V d 1 K d 1 + P d C 2 V d 2 K d 2 + P d C 3 V d 3 K d 3 = 0 ,
where fd is the focal length of the thin triplet lens and fd = 10 mm; Kd1, Kd2, and Kd3 are the refractive powers of the first, second, and third lenses of the thin triplet lens group, respectively; Vd1, Vd2, and Vd3 are the Abbe numbers of the first, second, and third lenses of the thin triplets, respectively; and PdC1, PdC2, and PdC3 are the relative partial dispersion power of the first, second, and third lenses of the thin triplet lens group, respectively.
By solving Equations (5)–(7) simultaneously, the refractive power formulas for Kd1, Kd2, and Kd3 can be obtained.
K d 1 = V d 1 ( P dC 2 P dC 3 ) K d V d 1 ( P dC 2 P dC 3 ) + V d 2 ( P dC 3 P dC 1 ) + V d 3 ( P dC 1 P dC 2 ) ,
K d 2 = V d 2 ( P dC 3 P dC 1 ) K d V d 1 ( P dC 2 P dC 3 ) + V d 2 ( P dC 3 P dC 1 ) + V d 3 ( P dC 1 P dC 2 ) ,
K d 3 = V d 3 ( P dC 1 P dC 2 ) K d V d 1 ( P dC 2 P dC 3 ) + V d 2 ( P dC 3 P dC 1 ) + V d 3 ( P dC 1 P dC 2 )
Equations (2) and (8)–(10) are solved to obtain the curvature difference of each thin lens as follows.
( C 1 C 2 ) = K d 1 ( n d 1 1 ) ,
( C 3 C 4 ) = K d 2 ( n d 2 1 ) ,
( C 5 C 6 ) = K d 3 ( n d 3 1 )
Here, C1 and C2 are the curvatures of the first and second surfaces of the first thin lens group; C3 and C4 are the curvatures of the first and second surfaces of the second thin lens group; and C5 and C6 are the curvatures of the first and second surfaces of the third thin lens group, respectively.
After obtaining the curvature of each thin lens, the refractive power of the thin triplet lens at a certain wavelength can be calculated by the following equation.
K λ = ( n λ 1 1 ) ( C 1 C 2 ) + ( n λ 2 1 ) ( C 3 C 4 ) + ( n λ 3 1 ) ( C 5 C 6 ) .
The chromatic aberration correction of the three-piece glass lens is related to the glass’s nd, Vd, and PdC. The 106 kinds of glass produced by the Schott Glass Company are numbered as shown in Table 1.

2.4. Merit Function

The real chromatic aberration is corrected for optimization. The damped least-squares method [20,21] is applied for optimization of the design for correction of the chromatic aberration. A merit function is defined as the summation of the squared values of the weighting differences between the aberrations and their target values. The formula can be written as
ϕ = i = 1 m w i 2 ( e i t i ) 2 ,
where m is the total summation number; wi is the weighting factor; ei is the aberration; and ti is the target value. We define the function f(x1, x2, …., xn) as
f i = w i ( e i t i ) .
Before optimization, the n variables are denoted as x10, x20, …., xn0; the m aberrations before the optimization are f10, f20, …., fm0. After the optimization process, the variables are denoted as x1, x2, …, xn, and the aberrations as f1, f2, …., fm. Here, we define a matrix A, in which the elements are
A i j = f i x j ,
We get the equation
X = ( A T A + p I ) 1 A T f 0 ,
where AT is the transposed matrix of A; I is a unit matrix, p is a damping factor; and f0 is the matrix containing the elements f10, f20, …, fm0. If x and x0 are the matrices containing the elements x1, x2, …., xn, and x10, x20, …., xn0, respectively, we can obtain
x = x 0 + X .

3. The Combination of a Thin Triplet Lens Using the Illustration Method

With Equations (8)–(10), in addition to fixing the total refractive power of the triplet lens, the longitudinal chromatic aberrations for the three wavelengths of the F-line, d-line, and C-line can also be corrected, but longitudinal chromatic aberration between the F-line and d-line and between the d-line and C-line still remain. In order to reduce the residual longitudinal chromatic aberration, two new wavelengths, A-line and B-line, are added. If we let A-line (0.53685 μm) be the middle wavelength of the F-line and d-line, and B-line (0.62192 μm) be the middle wavelength of the d-line and C-line, then εAB is the longitudinal chromatic aberration between the A-line and the B-line. Equations (8)–(10) are substituted into Equation (20) to obtain Equations (21) and (22) to correct the chromatic aberrations of the three wavelengths for the F-line, d-line, and C-line:
ε AB = P AB 1 V d 1 K d 1 + P AB 2 V d 2 K d 2 + P AB 3 V d 3 K d 3 ,
ε AB = [ P AB 1 ( P dC 2 P dC 3 ) + P AB 2 ( P dC 3 P dC 1 ) + P AB 3 ( P dC 1 P dC 2 ) ] [ V d 1 ( P dC 2 P dC 3 ) + V d 2 ( P dC 3 P dC 1 ) + V d 3 ( P dC 1 P dC 2 ) ] K d ,
ε AB = E G K d ,
where PAB = (nA − nB)/(nF − nC); E = PAB1(PdC2 − PdC3) + PAB2(PdC3 − PdC1) + PAB3(PdC1 − PdC2); G = Vd1(PdC2 − PdC3) + Vd2 (PdC3 − PdC1) + Vd3(PdC1 − PdC2).
If the ratio of E to G is smaller, a smaller εAB can be obtained, and so a smaller E value and a larger G value can be obtained by selecting the appropriate combination of three types of glass material (PAB, PdC, Vd).

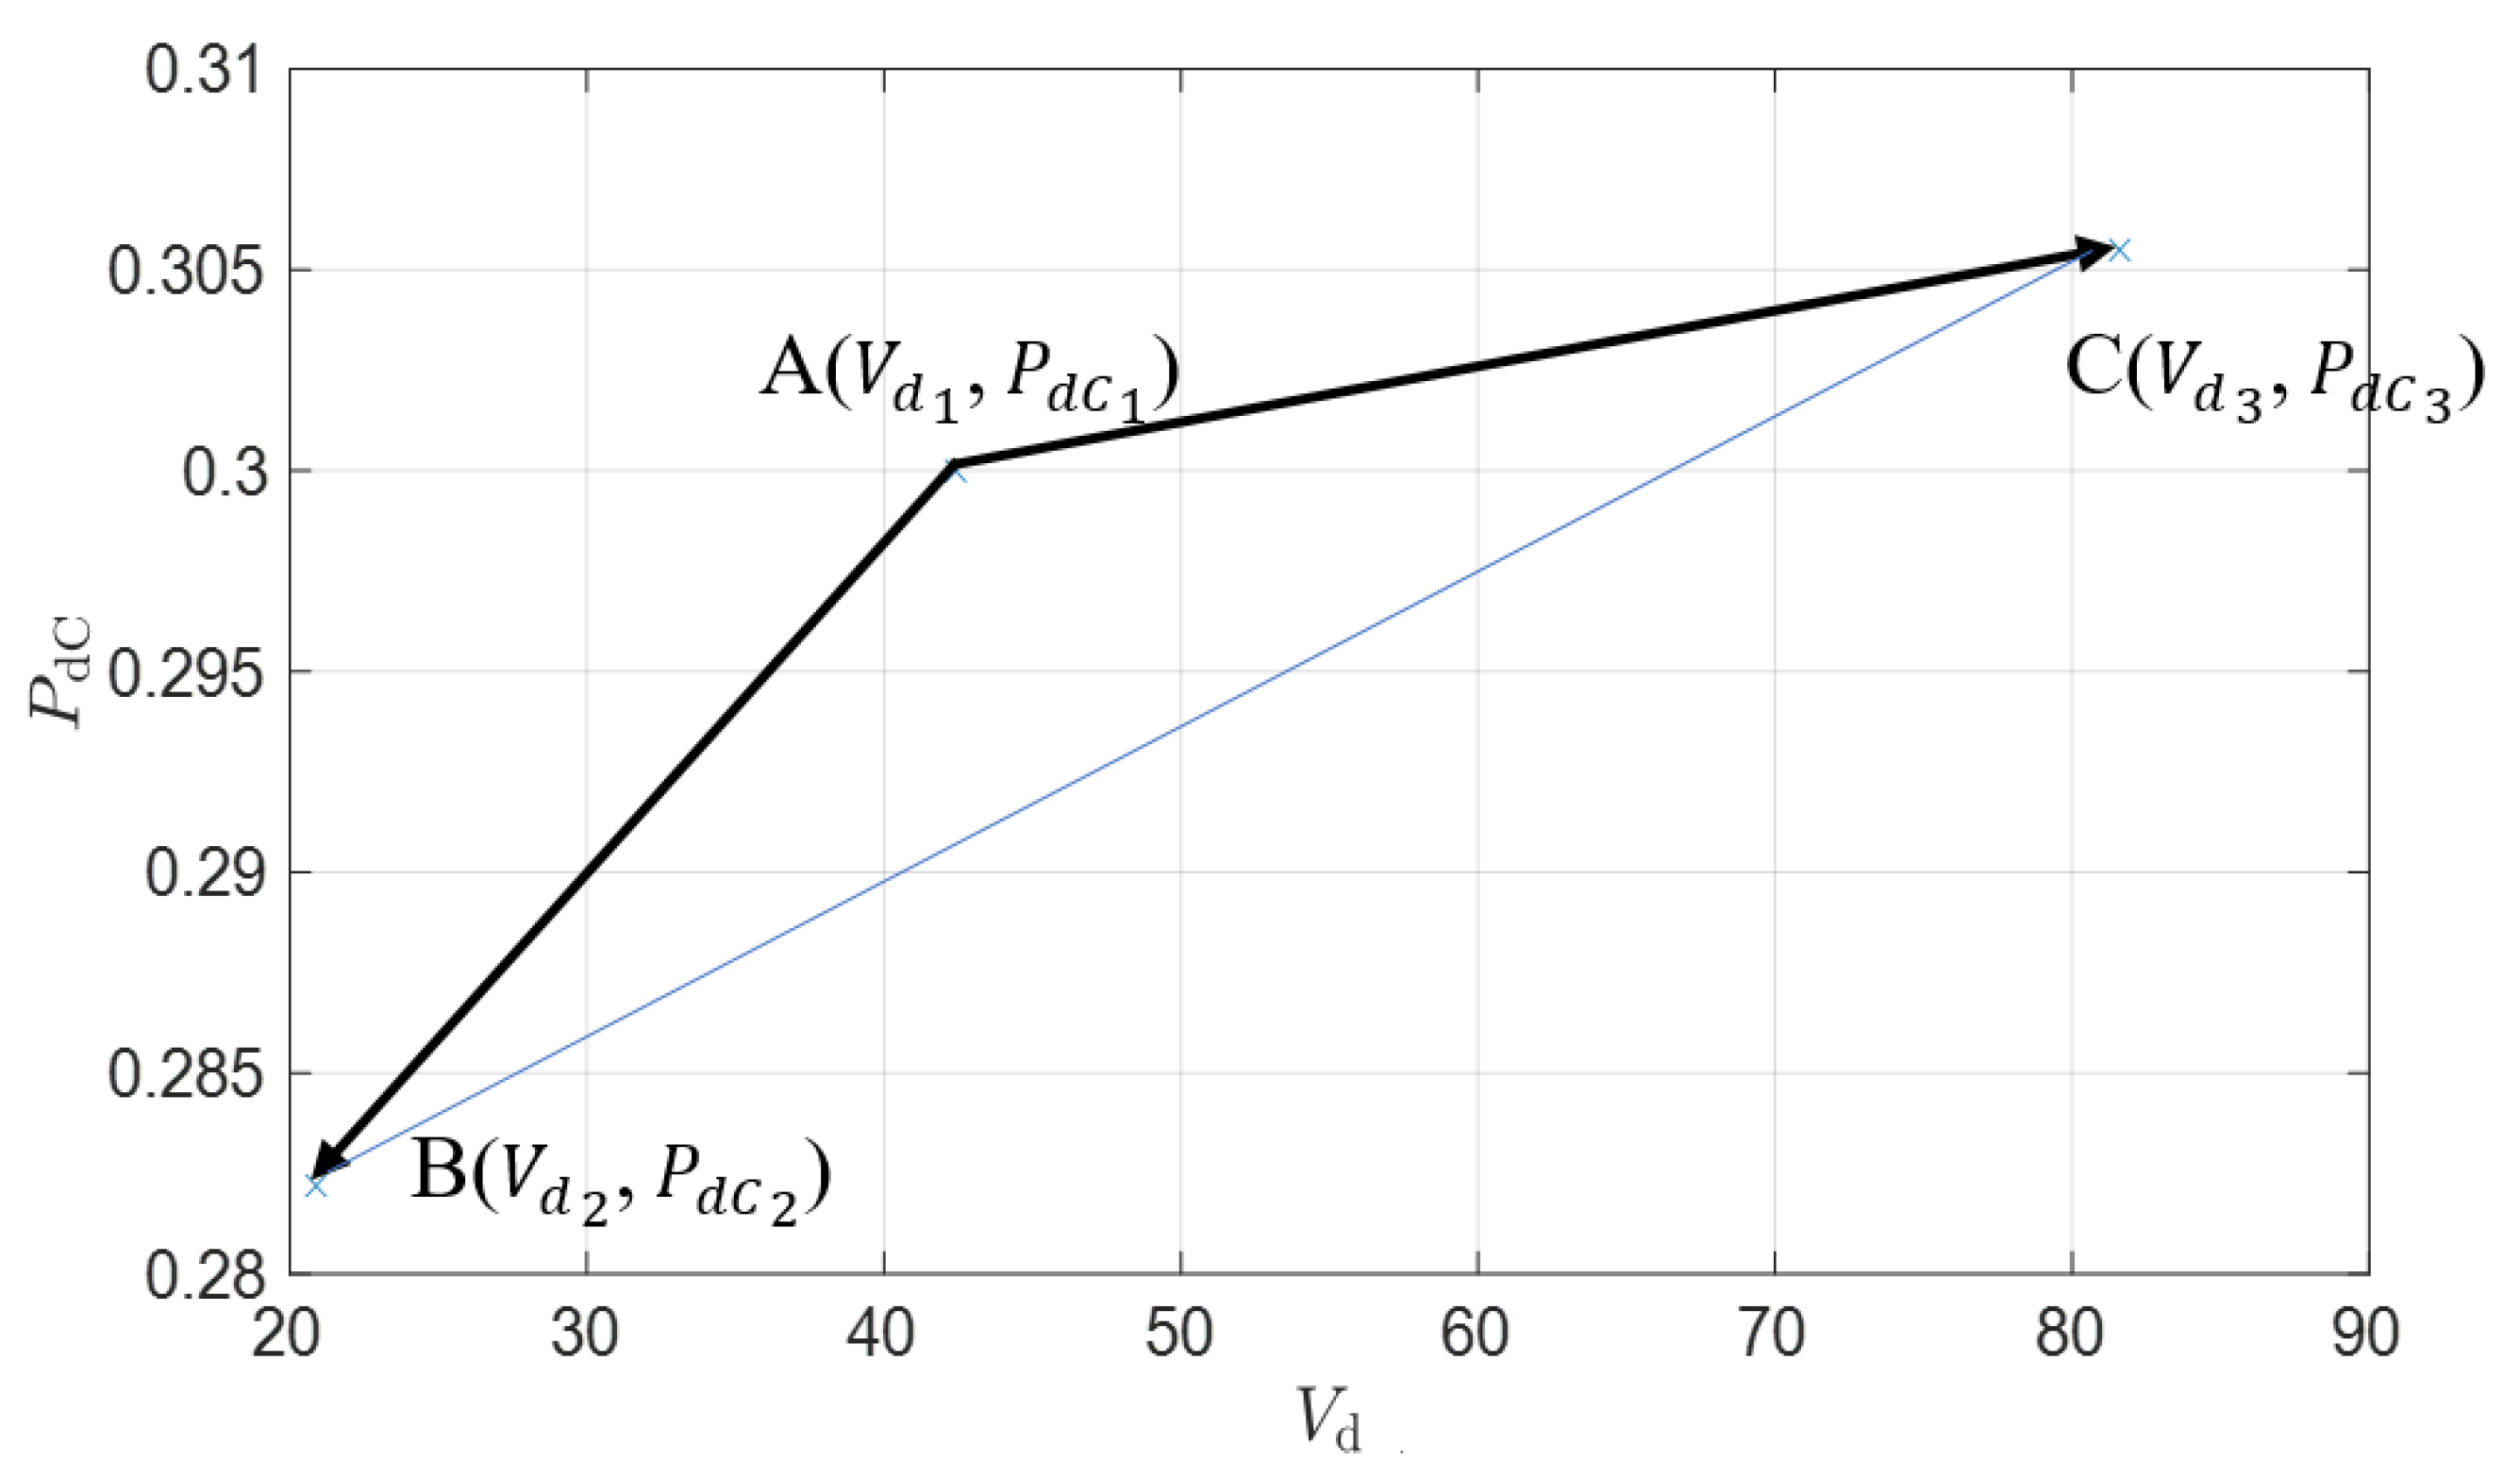
3.1. Vd − PdC Diagram (G Diagram)

If the Vd of the glass material is taken as the horizontal axis and the PdC is taken as the vertical axis, we can draw a figure called a G diagram. Taking three different pieces of glass (N-KZFS11, N-SF66, and N-PK52A) as an example, setting point A as N-KZFS11 (Vd1 = 42.41, PdC1 = 0.3000) and point B as N-SF66 (Vd2 = 20.88, PdC2 = 0.2822), then point C is N-PK52A (Vd3 = 81.60, PdC3 = 0.3055), as shown in Figure 1.
In Figure 1, the AB vector coordinate is (Vd2 − Vd1, PdC2 − PdC1) and the AC vector coordinate is (Vd3 − Vd1, PdC3 − PdC1). The absolute value formula of the cross product with the AB and AC vectors is shown in Equation (23).
| AB × AC | = V d 1 ( P d C 2 P d C 3 ) + V d 2 ( P d C 3 P d C 1 ) + V d 3 ( P d C 1 P d C 2 ) ,
| AB × AC | = G = 2 × Δ ABC .
Therefore, the G value is twice the area (ΔABC) enclosed by the three points ABC as shown in Figure 2 (namely, the Vd − PdC diagram).

3.2. PAB − PdC Diagram (E Diagram)

Plotting the glass material PAB on the horizontal axis and PdC on the vertical axis, we obtain the E diagram. Taking the same three pieces of glass (N-KZFS11, N-SF66, and N-PK52A) as an example, with N-KZFS11 at point A (PAB1 = 0.4604, PdC1 = 0.3000) and N-SF66 at point B (PAB2 = 0.4502, PdC2 = 0.2822), then N-PK52A is at point C (PAB3 = 0.4636, PdC3 = 0.3055), as shown in Figure 2.
For Figure 3, the absolute value formula of the cross product with the AB and AC vectors is expressed as
| AB × AC | = P AB 1 ( P d C 2 P d C 3 ) + P AB 2 ( P d C 3 P d C 1 ) + P AB 3 ( P d C 1 P d C 2 ) ,
| AB × AC | = E = 2 × Δ ABC .
Therefore, the E value is twice the area (ΔABC) enclosed by the three points ABC as shown in Figure 3 (namely, in the PAB − PdC diagram).

3.3. Illustration Method

According to Equation (22), the achromatic formulation of a thin triplet lens is εAB = (E/G)Kd. If we want to obtain a smaller chromatic aberration εAB between the A-line and the B-line, then the larger the value of the denominator G and the smaller the value of the numerator E. Coordinate diagrams for the 106 kinds of glass material (Vd, PdC, PAB) being selected from the Schott Optical Glass Catalog and numbered as listed in Table 1 can be drawn. As shown in Figure 4, PAB is on right vertical axis, Vd is on the left vertical axis, and PdC is on the horizontal axis. Blue indicates data for the Vd − PdC coordinate group and orange indicates data for the PAB − PdC group.
For the blue data group in the Vd − PdC diagram, the larger the area enclosed by the three glass options the better. Among them, blue No. 26 (N-FK58), No. 25 (N-FK51A), and No. 59 (N-PK52A) are farthest away from the blue data group, so these three types of glass material can be chosen as the benchmark, with the other two kinds farthest away from these three selected to obtain a larger area. However, the distribution of the orange data points in the PAB − PdC diagram is denser, and the area surrounding the three types of glass should be the smallest, which is difficult to observe by viewing the diagram. Thus, we must expand the relative coordinates of the orange data points. A line shows the trend of the orange data points for linear adjustment. The function for calculating the trend is PAB = 0.5278PdC + 0.3021. Let PAB be the adjusted coordinate value and ΔPAB = PAB − (0.5278PdC + 0.3021). The triangular area E′ of the adjusted ΔPAB − PdC is expressed as follows:
E = Δ P AB 1 ( P dC 2 P dC 3 ) + Δ P AB 2 ( P dC 3 P dC 1 ) + Δ P AB 3 ( P dC 1 P dC 2 )
E = P AB 1 ( P dC 2 P dC 3 ) + P AB 2 ( P dC 3 P dC 1 ) + P AB 3 ( P dC 1 P dC 2 ) = E ,
Figure 4 can be obtained by re-plotting the coordinate values of ΔPAB − PdC. We use the illustration method to design an example of a triplet lens combination. Looking at the section with the blue data point G in the figure, we first select glass No. 26 (N-FK58), and then choose the other two glasses in the data group which are the farthest apart PdC. The greater the base of the triangle, the larger the G value which can be obtained. At the same time, the three glass numbers selected also need to be close to the orange data point line, to obtain a smaller E value. Thus, we selected number 16 (N-KZFS11) and number 105 (P-SF6).
The focal length shift ΔfS is defined as the difference between the focal length of any wavelength (fλ) and the focal length of the center wavelength (fd), as shown in the following equation:
Δ f S = f λ f d
The illustration method was used to select eight triplet lens combinations. Figure 5 shows the chromatic aberration curve, in which the vertical axis shows the focal length shift ΔfS and the horizontal axis shows the wavelength.
Figure 6 shows the chromatic aberration curves for the eight groups comprised of three thin lenses selected by the illustration method. The wavelength of the light source starts from 0.48613 µm (F-line) and ends at 0.65627 µm (C-line) for the calculation of Δ f s . Zero indicates the position of the Δ f s of the center wavelength of 0.58613 µm (d-line). A total of eight chromatic aberration curves, labelled A to H, are obtained. The design parameters of the eight groups of triplet lenses are shown in Table 2. The value of the total chromatic aberration is defined as the area of the curve enclosed by the straight line with zero Δ f s used to calculate the area of the curve. The longitudinal chromatic aberration area (LCA) can be obtained from Equation (30). The parameters and data used in the calculation are listed in Table 2.
L C A = 0.48613 μ m 0.65627 μ m | Δ f S | Δ λ .

4. The Refractive Power of the Thick Triplet Lens Design

The illustration method described in the previous section is applied to design a thin triplet lens. The refractive power of the thin triplet lens and the characteristics of the glass materials are used to find the best chromatic aberration correction. The thickness of the thin lens is generally ignored (i.e., the thickness is assumed to be zero), but in fact, all lenses have thickness. If the thickness of the thin lens is considered, it will affect both the refractive power of the single lens and the refractive power of the triplet lens which will increase the longitudinal and lateral chromatic aberrations.

4.1. The Refractive Power of a Thick Lens

The formulation of the refractive power of a single thick lens is expressed as
K λ = K λ 1 + K λ 2 d n λ K λ 1 K λ 2 ,
K λ = ( n λ 1 ) ( C 1 h 2 h 1 C 2 ) ,
where Kλ is the refractive power of the thick lens; Kλ1 and Kλ2 are the refractive powers of the first and second surfaces of the thick lens; d is the thickness of the thick lens; and h1 and h2 are the heights of the marginal rays on the first and second surfaces, respectively.
Equations (2) and (32) are respectively multiplied by h1. If h1 = 0.5 Den, where Den is the entrance pupil diameter, then Equations (33) and (34) are obtained as follows:
h 1 K λ = ( n λ 1 ) ( h 1 C 1 h 1 C 2 ) = ( n λ 1 ) ( α 1 α 2 ) ,
h 1 K λ = ( n λ 1 ) ( h 1 C 1 h 2 C 2 ) = ( n λ 1 ) ( α 1 α 2 ) ,
Set the curvature factor αi as follows:
α i = h i C i , i = 1 , 2
where α1 and α2 are the curvature factors of the first and second surfaces of the lens, respectively. The marginal ray height is h1 = h2 for the thin lens.
In order to ensure that the refractive powers of the thin lens remains unchanged, if the curvature factors α1 and α2 remain unchanged after the lens is thickened, then the refractive power of the thick lens must be consistent with that of the thin lens.

4.2. The Refractive Power of a Thick Triplet Lens

The refractive power K′ of the thick triplet lens is
K = K λ 1 + h 3 h 1 K λ 2 + h 5 h 1 K λ 3 ,
K = ( n λ 1 1 ) ( C 1 h 2 h 1 C 2 ) + h 3 h 1 ( n λ 2 1 ) ( C 3 h 4 h 3 C 4 ) + h 5 h 1 ( n λ 2 1 ) ( C 5 h 6 h 5 C 6 ) ,
where Kλ1, Kλ2, and Kλ3 are the refractive powers of the first, second, and third lenses, respectively; C1 and C2 are the curvatures of the first and second surfaces of the first lens, respectively; C3 and C4 are the curvatures of the first and second surfaces of the second lens; C5 and C6 are the curvatures of the first and second surfaces of the third lens, respectively; h1 and h2 are the heights of the marginal rays on the first and second surfaces of the first lens, respectively; h3 and h4 are the heights of the marginal rays on the first and the second surfaces of the second lens, respectively; and h5 and h6 are the heights of the marginal rays on the first and the second surfaces of the third lens, respectively.
In the three thin lens designs it is assumed that the thickness of the lens is zero, the distance between the lenses is also zero, and the refractive power of the lens group is Kλ = 0.1 mm−1. Equations (14) and (37) are respectively multiplied by h1, which is the height of the marginal ray on the first surface of the triplet lens group. If h1 = 0.5 Den, where Den is the entrance pupil aperture, the following equations are obtained:
h 1 K λ = ( n λ 1 1 ) ( α 1 α 2 ) + ( n λ 2 1 ) ( α 3 α 4 ) + ( n λ 3 1 ) ( α 5 α 6 )
Comparing Equation (38) with Equation (39), it can be seen that the surface curvature factor αi is kept fixed. After the lens is thickened, the refractive power of each lens element and the refractive power of the triplet lens remain unchanged, that is, Kλ = Kλ = 0.1 mm−1.

5. Optimization Program and Design Results

When the thickness of the thin lens is added and the distance between the lenses is adjusted, the height of the marginal ray on the surface of the lens will change. The curvature of the surface will also change, the longitudinal chromatic aberration will increase, and the lateral chromatic aberration in the thin lens system will be zero. When the thickness of the lens increases, the lateral chromatic aberration also increases. In order to maintain the desired chromatic aberration result for the thin lens design, we use an optimization program to eliminate both the increase in the longitudinal and lateral chromatic aberrations due to the influence of the lens thickness. A flow chart of the optimization program is shown in Figure 6.
The eight triplet lens combinations selected by the illustration method (as shown in Table 2) are used as the starting values for optimization. During the optimization process, the thickness of the lens and the distance between the triplet lens are appropriately increased. The selected variables x0 are the respectively refractive powers of the triplet lenses kd1, kd2, and kd3. The optimization functions include the focal length fd of the triplet lens, the longitudinal chromatic aberration curve area (LCA), and the lateral chromatic aberration curve area (TCA) of the triplet lens group. The designed target value sets are tfd = 10 mm, tLCA = 0, and tTCA = 0. The optimization function is
ϕ = i = 1 3 f i 2 = w 1 2 ( f d 10 ) 2 + w 2 2 ( L C A t L C A ) 2 + w 3 2 ( T C A t T C A ) 2 ,
where ϕ stands for the merit function; fi is the design target; and wi is the corresponding weight for the design target.
The optimization results for the correction of the real longitudinal aberration and lateral chromatic aberration for the eight triplet lens groups selected by the illustration method are shown in Table 3, Figure 7 and Figure 8. Figure 7 and Figure 8 show graphs of the real longitudinal and lateral chromatic aberrations, respectively. The optimized focal length is 10 mm, and the real longitudinal chromatic aberration area value is up to 10 7 , which is similar to the chromatic aberration area obtained with the thin-lens illustration method, and the real lateral chromatic aberration area ranges from 10 5 to 10 6 .

6. Conclusions

To design a thickened triplet lens with chromatic aberration correction, it is more efficient and probably faster to start with the proposed illustration method and optimization program. For the design of a thin triplet lens group, the optimization algorithm associated with illustration method can be used to compare the PAB − PdC and Vd − PdC diagrams of the glass materials, and the selection of the three different types of glass materials with the smallest chromatic aberration can be performed effectively and quickly. Finally, eight lens groups of three thin elements were selected for examination. In the visible light range from 0.4861 μm to 0.6563 μm, the longitudinal chromatic aberration curve area of the optimal thin triplet lens is 2.67 × 10⁻⁷ (μm × mm). After the thickening of the thin lenses in the thin triplet lens combination selected by the proposed method and fixing the total refractive power, an optimization program combined with the illustration method is used to optimize the eight thickened triplet lens groups to obtain the longitudinal chromatic aberration curve for the best group in the visible light range. The curve area is 3.33 × 10⁻⁷ (μm × mm) for the longitudinal chromatic aberration and 2.11 × 10⁻⁵ (μm × mm) for the lateral chromatic aberration.

Author Contributions

Conceptualization and methodology, W.-S.S.; writing—review and editing, C.-L.T.; validation, W.-S.S. and C.-L.T.; software, S.-S.L., data curation, J.-S.L. All authors have read and agreed to the published version of the manuscript.

Funding

This research was supported in part by the National Science and Technology of Council, under project numbers MOST 110-2221-E-008-072 and 111-2622-E-035-003. This study was also supported by Feng Chia University (Contract No. 21H00723).

Institutional Review Board Statement

Not applicable.

Informed Consent Statement

Not applicable.

Data Availability Statement

Not applicable.

Conflicts of Interest

The authors declare no conflict of interest.

References

  1. Welford, W.T. Aberrations of the Symmetrical Optical System; Harcourt Brace Jovanovich: New York, NY, USA, 1974. [Google Scholar]
  2. Stephens, R.E. Selection of glasses for three-color achromats. J. Opt. Soc. Am. 1959, 49, 398–401. [Google Scholar] [CrossRef]
  3. Stephens, R.E. Four-color achromats and superchromats. J. Opt. Soc. Am. 1960, 50, 1016–1019. [Google Scholar] [CrossRef]
  4. Lessing, N.V.D. Selection of optical glasses in superchromats. Appl. Opt. 1970, 9, 1665–1668. [Google Scholar] [CrossRef] [PubMed]
  5. Wynne, C.G. Secondary spectrum correction with normal glasses. Opt. Commun. 1977, 21, 419–424. [Google Scholar] [CrossRef]
  6. Sharma, K.D.; Rama Gopal, S.V. Design of achromatic doublets: Evaluation of the double-graph technique. Appl. Opt. 1983, 22, 497–500. [Google Scholar] [CrossRef] [PubMed]
  7. Robb, P.N. Selection of optical glasses. 1: Two materials. Appl. Opt. 1985, 24, 1864–1877. [Google Scholar] [CrossRef] [PubMed]
  8. Rayces, J.L.; Rosete-Aguilar, M. Selection of glasses for achromatic doublets with reduced secondary spectrum. I. Tolerance conditions for secondary spectrum, spherochromatism, and fifth-order spherical aberration. Appl. Opt. 2001, 40, 5663–5676. [Google Scholar] [CrossRef] [PubMed]
  9. Rosete-Aguilar, M.; Raycesd, J.L. Selection of glasses for achromatic doublets with reduced secondary spectrum. II. Application of the method for selecting pairs of glasses with reduced secondary spectrum. Appl. Opt. 2001, 40, 5677–5686. [Google Scholar] [CrossRef] [PubMed]
  10. Duplov, R. Apochromatic telescope without anomalous dispersion glasses. Appl. Opt. 2006, 45, 5164–5167. [Google Scholar] [CrossRef] [PubMed]
  11. Seong, K.; Greivernkamp, J.E. Chromatic aberration measurement for transmission interferometric testing. Appl. Opt. 2008, 47, 6508–6511. [Google Scholar] [CrossRef] [PubMed]
  12. Benny, Y. Wide-angle chromatic aberration corrector for the human eye. J. Opt. Soc. Am. A 2007, 24, 1538–1544. [Google Scholar] [CrossRef]
  13. Ravikumar, S.; Thibos, L.N.; Bradley, A. Calculation of retinal image quality for polychromatic light. J. Opt. Soc. Am. A 2008, 25, 2395–2407. [Google Scholar] [CrossRef] [PubMed]
  14. Ferraro, P.; Miccio, L.; Grilli, S.; Paturzo, M.; De Nicola, S.; Finizio, A.; Osellame, R.; Laporta, P. Quantitative phase microscopy of microstructures with extended measurement range and correction of chromatic aberrations by multiwavelength digital holography. Opt. Express 2007, 15, 14591–14600. [Google Scholar] [CrossRef] [PubMed]
  15. Sun, W.S.; Tien, C.L.; Sun, C.C.; Lee, C.C. A Low-cost Optimization Design for Minimizing Chromatic Aberration by Doublet Prisms. J. Opt. Soc. Korea 2012, 16, 336–342. [Google Scholar] [CrossRef] [Green Version]
  16. Sun, W.S.; Tien, C.L.; Chu, P.Y.; Hung, Z.Y. Optimization design of a stereo-photographic system based on achromatic double-prism arrays. Appl. Opt. 2018, 57, 8034–8043. [Google Scholar] [CrossRef]
  17. Sun, W.S.; Chu, C.H.; Tien, C.L. Well-Chosen Method for an Optimal Design of Doublet Lens Design. Opt. Express 2009, 17, 1414–1428. [Google Scholar] [CrossRef] [PubMed]
  18. Sun, W.S. Illustrating Method of Triplet Prisms for Minimizing the Chromatic Aberration. In International Optical Design Conference; Optica Publishing Group: Jackson Hole, WY, USA, 2010; p. JMB33. [Google Scholar]
  19. Schott, Inc. TIE-29: Refractive index and dispersion. In Proceedings of Schott Technical Information; Schott Inc.: Jena, Germany, 2015. [Google Scholar]
  20. Wynne, C.G.; Worme, P.M.J.H. Lens design by computer. Appl. Opt. 1963, 2, 1233–1238. [Google Scholar] [CrossRef]
  21. Jamieson, T.H. Optimization Techniques in Lens Design; American Elsevier: New York, NY, USA, 1971. [Google Scholar]
Figure 1. Plot of PdC versus Vd for N-KZFS11, N-SF66, and N-PK52A glasses.
Applsci 12 11881 g001
Figure 2. PAB − PdC diagram of N-KZFS11, N-SF66, and N-PK52A.
Applsci 12 11881 g002
Figure 3. Vd − PdC and PAB − PdC diagrams for the 106 SCHOTT glass materials.
Applsci 12 11881 g003
Figure 4. Diagram of V d P dC and Δ P AB   P dC .
Applsci 12 11881 g004
Figure 5. Chromatic aberration curves of the eight triplet lens combinations selected by the illustration method.
Applsci 12 11881 g005
Figure 6. Flow chart of the optimization program.
Applsci 12 11881 g006
Figure 7. Real longitudinal chromatic aberration curve optimized for the eight triplet lens groups selected by the illustration method.
Applsci 12 11881 g007
Figure 8. Optimized real lateral chromatic aberration curve for the eight triplet lens groups selected by the illustration method.
Applsci 12 11881 g008
Table 1. Schott glass type and numbers.
NoGlass TypeNoGlass TypeNoGlass TypeNoGlass TypeNoGlass Type
1F223N-F245N-LAK33B67N-SF289P-LASF50
2F524N-FK546N-LAK3468N-SF490P-LASF51
3FK5HTi25N-FK51A47’N-LAK769N-SF591P-SF68
4K1026N-FK5848N-LAK870N-SF5792P-SF69
5K727N-K549N-LAK971N-SF693P-SF8
6LAFN728N-KF950N-LASF31A72N-SF6694P-SK57
7LASF3529N-KZFS1151N-LASF4073N-SF895P-SK57Q1
8LF530N-KZFS252N-LASF4174N-SK1196P-SK58A
9LLF131N-KZFS453N-LASF4375N-SK1497P-SK60
10N-BAF1032N-KZFS554N-LASF4476N-SK1698SF1
11N-BAF433N-KZFS855N-LASF4577N-SK299SF10
12N-BAF5134N-LAF256N-LASF46A78N-SK4100SF11
13N-BAF5235N-LAF2157N-LASF979N-SK5101SF2
14N-BAK136N-LAF3358N-PK5180N-SSK2102SF4
15N-BAK237N-LAF3459N-PK52A81N-SSK5103SF5
16N-BAK438N-LAF3560N-PSK382N-SSK8104SF56A
17N-BALF439N-LAF761N-PSK53A83’N-ZK105SF57
18N-BALF540N-LAK1062N-SF184N-ZK7A106SF6
19N-BASF241N-LAK1263N-SF1085P-BK7
20N-BASF6442N-LAK1464N-SF1186P-LAF37
21N-BK1043N-LAK2165N-SF1487P-LAK35
22N-BK744N-LAK2266N-SF1588P-LASF47
Table 2. Design parameters for the eight groups of thin triplet lenses selected by the illustration method.
NumberKd1
(mm−1)
Kd2 (mm−1)Kd3 (mm−1)C1 − C2 (mm−1)C3 − C4 (mm−1)C5 − C6 (mm−1)fd (mm−1)LCA (μm × mm)
A0.2504−0.17010.01970.5039−0.26670.0213106.4531 × 10 7
B0.2468−0.18190.03510.5072−0.28520.0477105.5363 × 10 7
C0.2264−0.15300.02650.4966−0.23990.0313105.8096 × 10 7
D0.2336−0.15090.01720.5124−0.24600.0171105.8880 × 10 7
E0.2224−0.14070.01830.4878−0.22070.0182102.6743 × 10 7
F0.2351−0.15280.01770.5155−0.24910.0192103.9891 × 10 7
G0.2645−0.17660.01210.5800−0.24520.0131106.2705 × 10 7
H0.2474−0.17690.02960.5084−0.27740.0349105.6752 × 10 7
Table 3. Optimization results for the eight triplet lens groups selected by the illustration method.
f d   ( mm ) LCA   ( mm × μ m ) TCA   ( mm × μ m )
A105.6328 × 10 7 8.2488 × 10 6
B104.8447 × 10 7 9.2612 × 10 6
C105.8346 × 10 7 8.1079 × 10 5
D104.5206 × 10 7 3.7359 × 10 5
E109.7842 × 10 7 4.4330 × 10 6
F104.3850 × 10 7 1.8181 × 10 5
G103.3362 × 10 7 2.1194 × 10 5
H105.4256 × 10 7 1.4754 × 10 5
Publisher’s Note: MDPI stays neutral with regard to jurisdictional claims in published maps and institutional affiliations.

