
Time Following a Gluten-Free Diet, Ultra-Processed Food Consumption and Quality of Life in Children with Celiac Disease

 , , ,
, , ,
Abstract
Featured Application
Abstract
1. Introduction
2. Materials and Methods
2.1. Subjects
2.2. Sociodemographic and Clinical Characteristics
2.3. Dietary Assessment
2.4. Quality of Life Assessment
2.5. Data Analyses
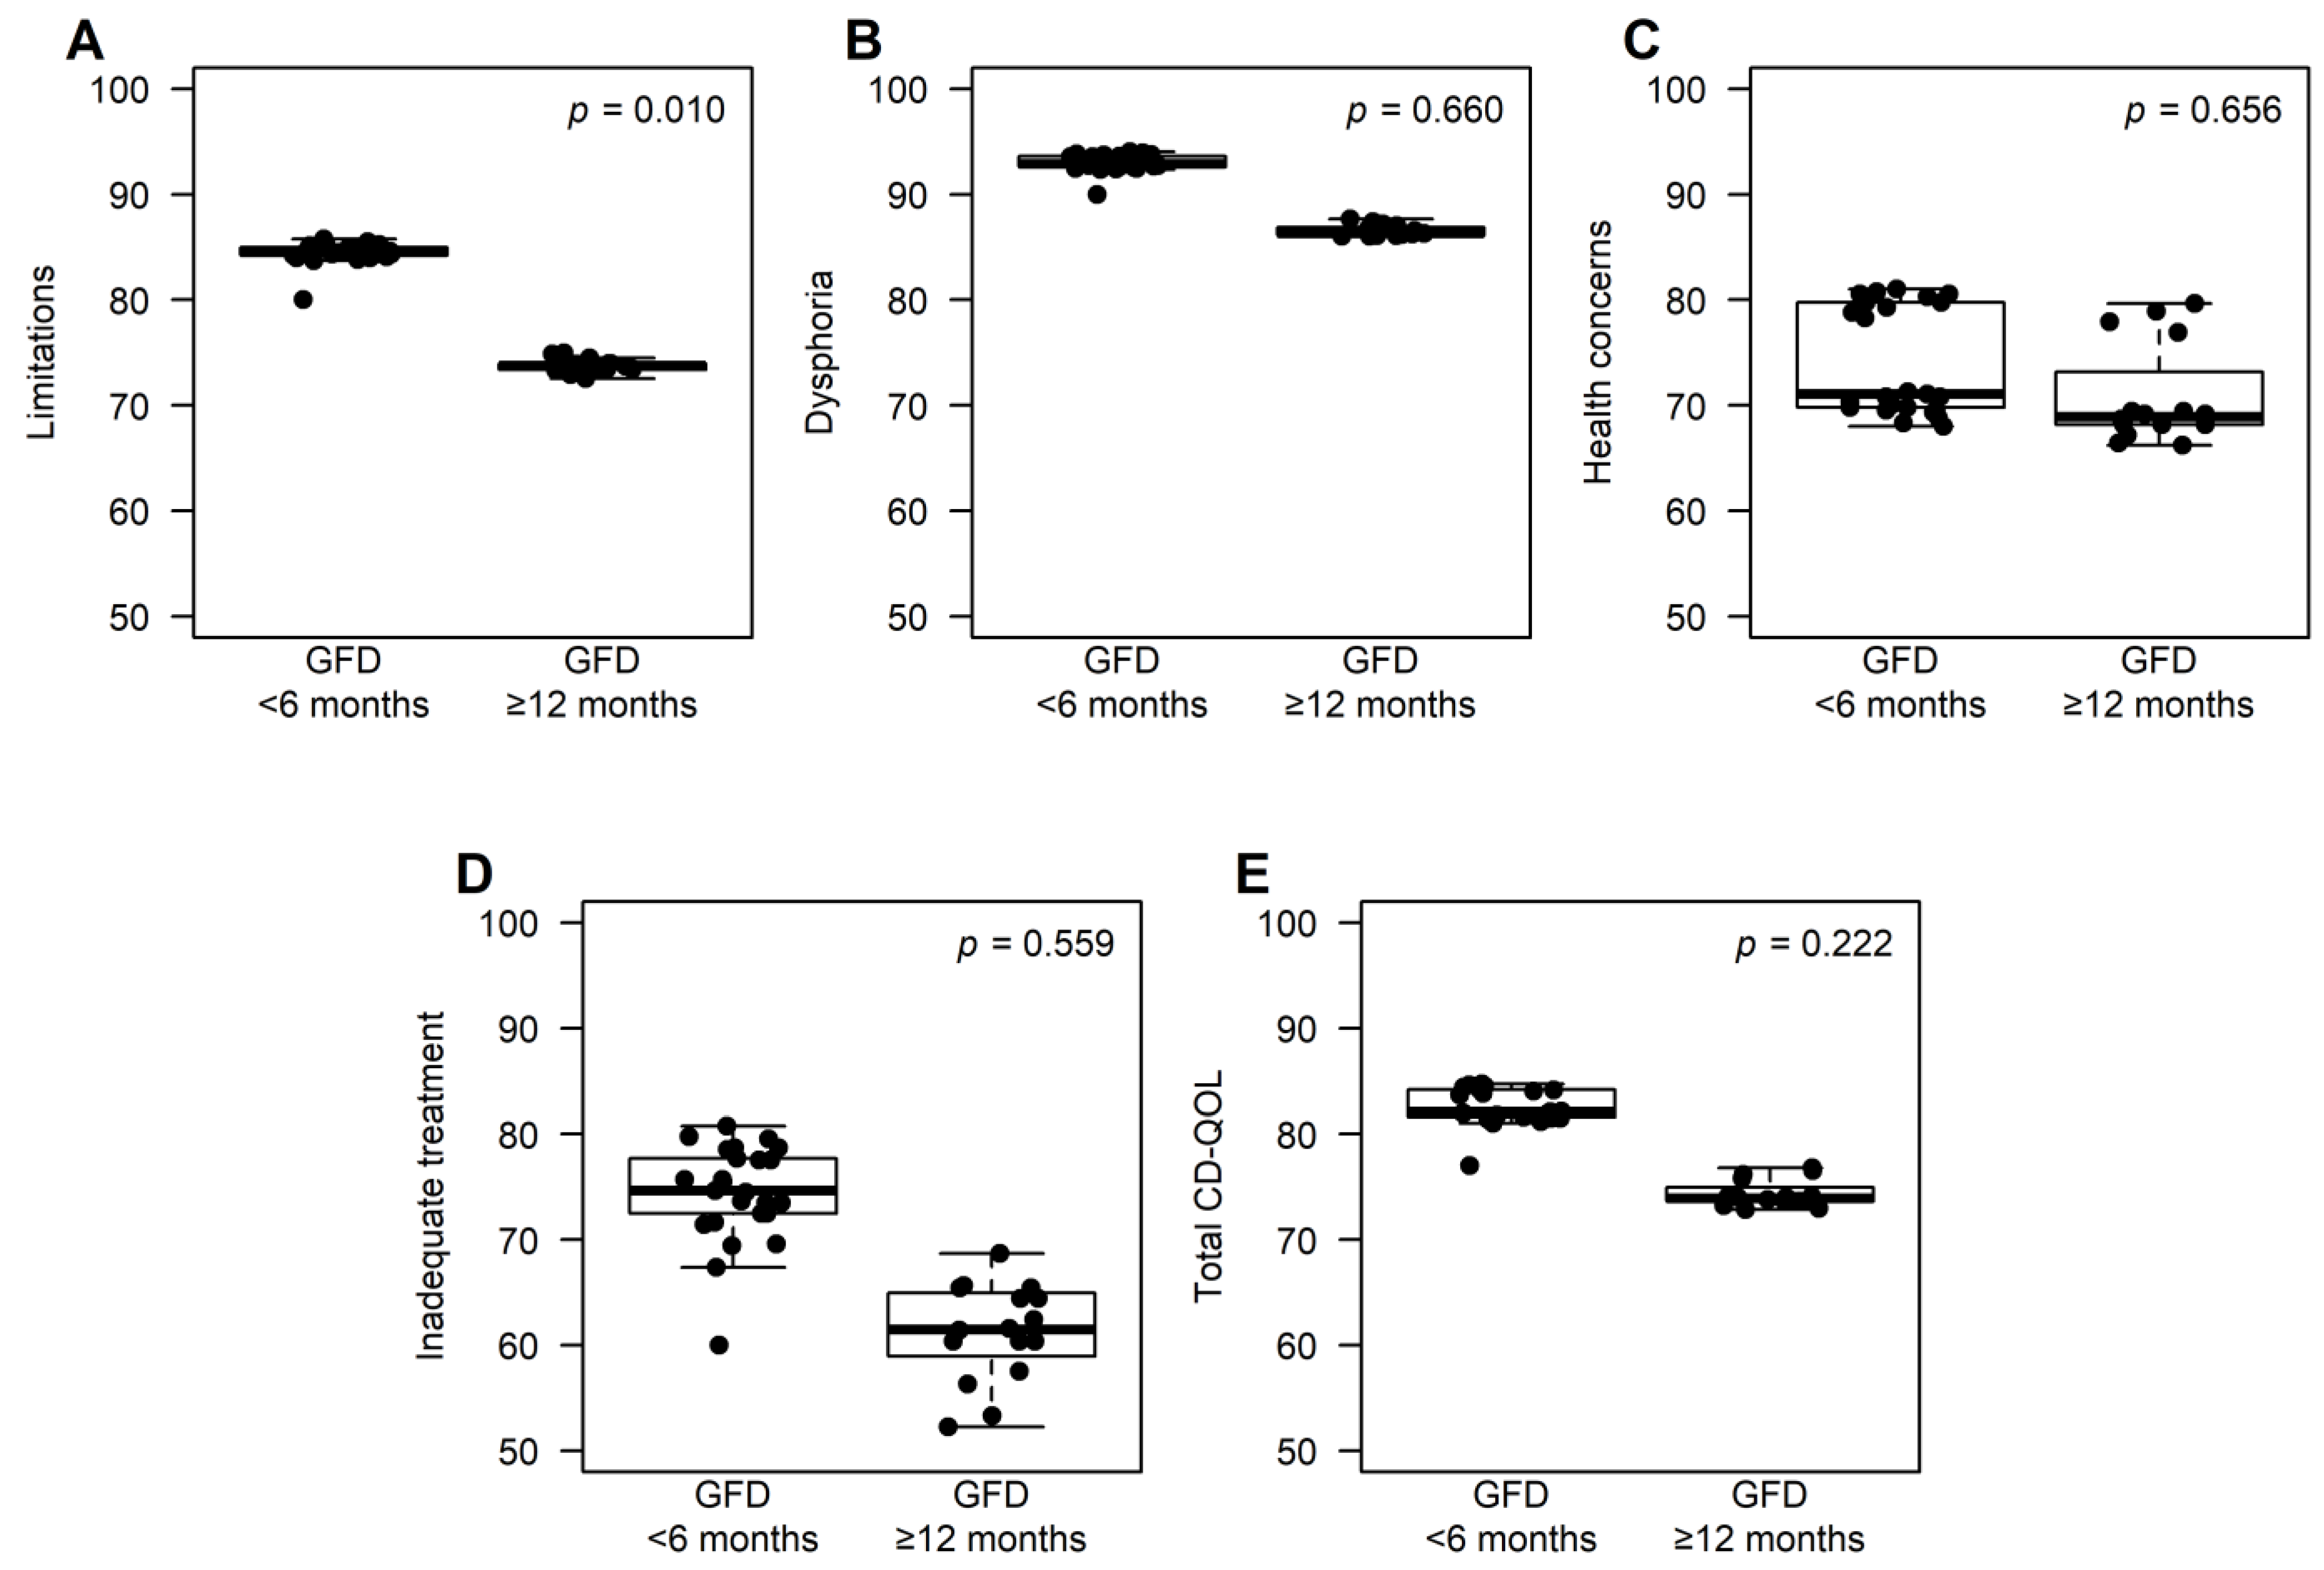
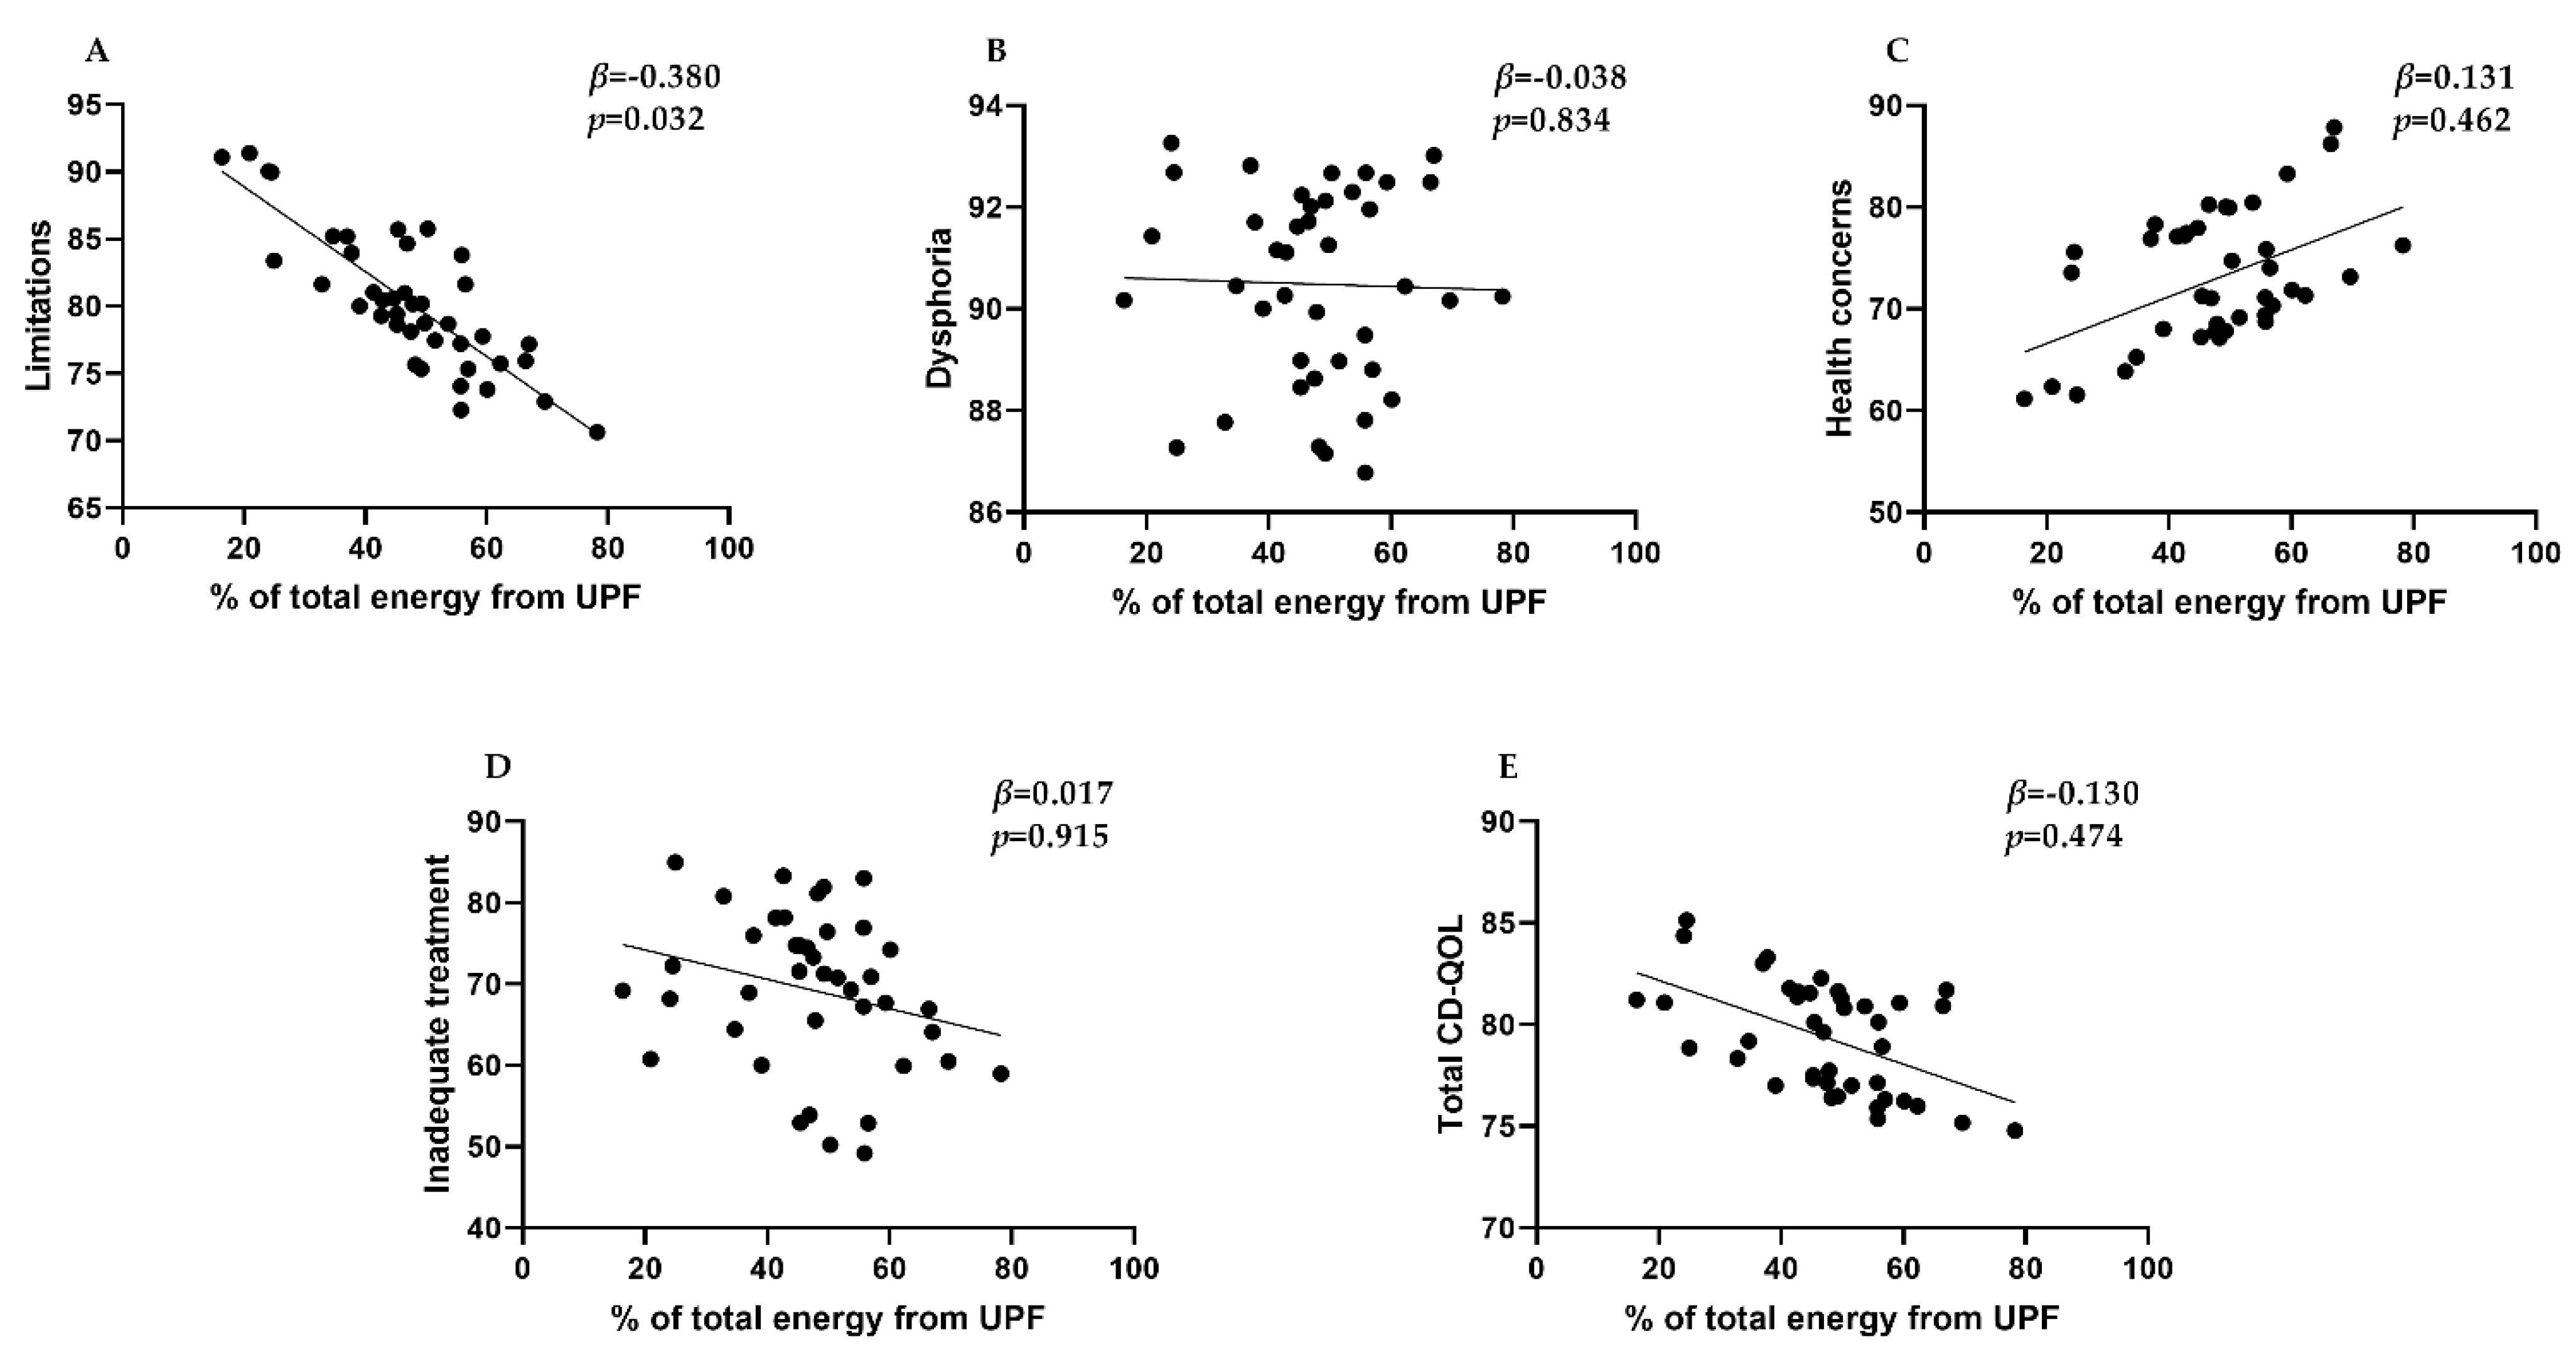
3. Results
4. Discussion
5. Conclusions
Author Contributions
Funding
Institutional Review Board Statement
Informed Consent Statement
Data Availability Statement
Acknowledgments
Conflicts of Interest
References
- Ludvigsson, J.F.; Leffler, D.A.; Bai, J.C.; Biagi, F.; Fasano, A.; Green, P.H.R.; Hadjivassiliou, M.; Kaukinen, K.; Kelly, C.P.; Leonard, J.N.; et al. The Oslo definitions for coeliac disease and related terms. Gut 2013, 62, 43–52. [Google Scholar] [CrossRef] [PubMed]
- Al-Toma, A.; Volta, U.; Auricchio, R.; Castillejo, G.; Sanders, D.S.; Cellier, C.; Mulder, C.J.; Lundin, K.E.A. European Society for the Study of Coeliac Disease (ESsCD) guidelinefor coeliac disease and other gluten-related disorders. United Eur. Gastroenterol. J. 2019, 7, 583. [Google Scholar] [CrossRef] [PubMed]
- King, J.A.; Jeong, J.; Underwood, F.E.; Quan, J.; Panaccione, N.; Windsor, J.W.; Coward, S.; Debruyn, J.; Ronksley, P.E.; Shaheen, A.A.; et al. Incidence of Celiac Disease Is Increasing over Time: A Systematic Review and Meta-analysis. Am. J. Gastroenterol. 2020, 115, 507–525. [Google Scholar] [CrossRef] [PubMed]
- Murray, J.A.; Watson, T.; Clearman, B.; Mitros, F. Effect of a gluten-free diet on gastrointestinal symptoms in celiac disease. Am. J. Clin. Nutr. 2004, 79, 669–673. [Google Scholar] [CrossRef] [PubMed]
- Zingone, F.; Siniscalchi, M.; Capone, P.; Tortora, R.; Andreozzi, P.; Capone, E.; Ciacci, C. The quality of sleep in patients with coeliac disease. Aliment. Pharmacol. Ther. 2010, 32, 1031–1036. [Google Scholar] [CrossRef]
- Altobelli, E.; Paduano, R.; Gentile, T.; Caloisi, C.; Marziliano, C.; Necozione, S.; di Orio, F. Health-related quality of life in children and adolescents with celiac disease: Survey of a population from central Italy. Health Qual. Life Outcomes 2013, 11, 204. [Google Scholar] [CrossRef]
- Barrio, J.; Cilleruelo, M.L.; Román, E.; Fernández, C. Health-related quality of life using specific and generic questionnaires in Spanish coeliac children. Health Qual. Life Outcomes 2020, 18, 250. [Google Scholar] [CrossRef]
- Sevinç, E.; Çetin, F.H.; Coşkun, B.D. Psychopathology, quality of life, and related factors in children with celiac disease. J. Pediatr. 2017, 93, 267–273. [Google Scholar] [CrossRef]
- Pynnönen, P.A.; Isometsä, E.T.; Verkasalo, M.A.; Kähkönen, S.A.; Sipilä, I.; Savilahti, E.; Aalberg, V.A. Gluten-free diet may alleviate depressive and behavioural symptoms in adolescents with coeliac disease: A prospective follow-up case-series study. BMC Psychiatry 2005, 5, 14. [Google Scholar] [CrossRef]
- Aguayo-Patrón, S.V.; Calderón de la Barca, A.M. Old Fashioned vs. Ultra-Processed-Based Current Diets: Possible Implication in the Increased Susceptibility to Type 1 Diabetes and Celiac Disease in Childhood. Foods 2017, 6, 100. [Google Scholar] [CrossRef]
- Martínez Steele, E.; Popkin, B.M.; Swinburn, B.; Monteiro, C.A. The share of ultra-processed foods and the overall nutritional quality of diets in the US: Evidence from a nationally representative cross-sectional study. Popul. Health Metr. 2017, 15, 6. [Google Scholar] [CrossRef] [PubMed]
- Moubarac, J.C.; Batal, M.; Louzada, M.L.; Martinez Steele, E.; Monteiro, C.A. Consumption of ultra-processed foods predicts diet quality in Canada. Appetite 2017, 108, 512–520. [Google Scholar] [CrossRef] [PubMed]
- Lustig, R.H. Ultraprocessed Food: Addictive, Toxic, and Ready for Regulation. Nutrients 2020, 12, 3401. [Google Scholar] [CrossRef] [PubMed]
- da Costa Louzada, M.L.; Baraldi, L.G.; Steele, E.M.; Martins, A.P.B.; Canella, D.S.; Moubarac, J.C.; Levy, R.B.; Cannon, G.; Afshin, A.; Imamura, F.; et al. Consumption of ultra-processed foods and obesity in Brazilian adolescents and adults. Prev. Med. 2015, 81, 9–15. [Google Scholar] [CrossRef]
- De Deus Mendonça, R.; Pimenta, A.M.; Gea, A.; De La Fuente-Arrillaga, C.; Martinez-Gonzalez, M.A.; Lopes, A.C.S.; Bes-Rastrollo, M. Ultraprocessed food consumption and risk of overweight and obesity: The University of Navarra Follow-Up (SUN) cohort study. Am. J. Clin. Nutr. 2016, 104, 1433–1440. [Google Scholar] [CrossRef]
- Rauber, F.; da Costa Louzada, M.L.; Steele, E.M.; Millett, C.; Monteiro, C.A.; Levy, R.B. Ultra-Processed Food Consumption and Chronic Non-Communicable Diseases-Related Dietary Nutrient Profile in the UK (2008–2014). Nutrients 2018, 10, 587. [Google Scholar] [CrossRef]
- Lane, M.M.; Davis, J.A.; Beattie, S.; Gómez-Donoso, C.; Loughman, A.; O’Neil, A.; Jacka, F.; Berk, M.; Page, R.; Marx, W.; et al. Ultraprocessed food and chronic noncommunicable diseases: A systematic review and meta-analysis of 43 observational studies. Obes. Rev. 2021, 22, e13146. [Google Scholar] [CrossRef]
- Nestares, T.; Martín-Masot, R.; Flor-Alemany, M.; Bonavita, A.; Maldonado, J.; Aparicio, V.A. Influence of Ultra-Processed Foods Consumption on Redox Status and Inflammatory Signaling in Young Celiac Patients. Nutrients 2021, 13, 156. [Google Scholar] [CrossRef]
- Husby, S.; Koletzko, S.; Korponay-Szabó, I.R.; Mearin, M.L.; Phillips, A.; Shamir, R.; Troncone, R.; Giersiepen, K.; Branski, D.; Catassi, C.; et al. European society for pediatric gastroenterology, hepatology, and nutrition guidelines for the diagnosis of coeliac disease. J. Pediatr. Gastroenterol. Nutr. 2012, 54, 136–160. [Google Scholar] [CrossRef]
- Cole, T.J.; Bellizzi, M.C.; Flegal, K.M.; Dietz, W.H. Establishing a standard definition for child overweight and obesity worldwide: International survey. BMJ Br. Med. J. 2000, 320, 1240. [Google Scholar] [CrossRef]
- Ruiz, M.D.; Artacho, R. Guía Para Estudios Dietéticos: Álbum Fotográfico de Alimentos; Universidad de Granada: Granada, Spain, 2011. [Google Scholar]
- Moreiras, O.; Carbajal, A.; Cabrera, L. Ingestas Diarias Recomendadas de Energía y Nutrientes para la Población Española. Tablas de Composición de Alimentos, 18th ed.; Grupo Anaya, S.A.: Madrid, Spain, 2016. [Google Scholar]
- Monteiro, C.A.; Moubarac, J.C.; Cannon, G.; Ng, S.W.; Popkin, B. Ultra-processed products are becoming dominant in the global food system. Obes. Rev. 2013, 14, 21–28. [Google Scholar] [CrossRef] [PubMed]
- Organización Panamericana de la Salud; Organización Mundial de la Salud. Alimentos y Bebidas Ultraprocesados en América Latina: Tendencias, Efecto Sobre la Obesidad e Implicaciones para las Políticas Públicas; Organización Panamericana de la Salud: Washington, DC, USA, 2015; p. 76. [Google Scholar]
- Dorn, S.D.; Hernandez, L.; Minaya, M.T.; Morris, C.B.; Hu, Y.; Leserman, J.; Lewis, S.; Lee, A.; Bangdiwala, S.I.; Green, P.H.R.; et al. The development and validation of a new coeliac disease quality of life survey (CD-QOL). Aliment. Pharmacol. Ther. 2010, 31, 666–675. [Google Scholar] [CrossRef] [PubMed]
- Zingone, F.; Swift, G.L.; Card, T.R.; Sanders, D.S.; Ludvigsson, J.F.; Bai, J.C. Psychological morbidity of celiac disease: A review of the literature. United Eur. Gastroenterol. J. 2015, 3, 136–145. [Google Scholar] [CrossRef] [PubMed]
- Burger, J.P.W.; de Brouwer, B.; IntHout, J.; Wahab, P.J.; Tummers, M.; Drenth, J.P.H. Systematic review with meta-analysis: Dietary adherence influences normalization of health-related quality of life in coeliac disease. Clin. Nutr. 2017, 36, 399–406. [Google Scholar] [CrossRef] [PubMed]
- Ludvigsson, J.F.; Card, T.; Ciclitira, P.J.; Swift, G.L.; Nasr, I.; Sanders, D.S.; Ciacci, C. Support for patients with celiac disease: A literature review. United Eur. Gastroenterol. J. 2015, 3, 146–159. [Google Scholar] [CrossRef]
- Byström, I.-M.; Hollén, E.; Fälth-Magnusson, K.; Johansson, A. Health-Related Quality of Life in Children and Adolescents with Celiac Disease: From the Perspectives of Children and Parents. Gastroenterol. Res. Pract. 2012, 2012, 986475. [Google Scholar] [CrossRef]
- Vriezinga, S.L.; Farih, N.; van der Meulen-De Jong, A.E.; Putter, H.; Rings, E.H.H.M.; Schaart, M.W.; Schweizer, J.J.; Wessels, M.M.S.; Mearin, M.L. Comparison of Patients’ and Doctors’ Reports on Health-related Quality of Life in Celiac Disease. J. Pediatr. Gastroenterol. Nutr. 2017, 64, 737–741. [Google Scholar] [CrossRef]
- Torres, J.B.; Roman, E.; Cilleruelo, M.; Marquez, M.; Mearin, M.L.; Fernandez, C. Health-related quality of life in Spanish children with coeliac disease. J. Pediatr. Gastroenterol. Nutr. 2016, 62, 603–608. [Google Scholar] [CrossRef]
- Van Doorn, R.K.; Winkler, L.M.F.; Zwinderman, K.H.; Mearin, M.L.; Koopman, H.M. CDDUX: A disease-specific health-related quality-of-life questionnaire for children with celiac disease. J. Pediatr. Gastroenterol. Nutr. 2008, 47, 147–152. [Google Scholar] [CrossRef]
- Olshan, K.L.; Leonard, M.M.; Serena, G.; Zomorrodi, A.R.; Fasano, A. Gut microbiota in Celiac Disease: Microbes, metabolites, pathways and therapeutics. Expert Rev. Clin. Immunol. 2020, 16, 1075–1092. [Google Scholar] [CrossRef]
- Walker, W.A. The importance of appropriate initial bacterial colonization of the intestine in newborn, child, and adult health. Pediatr. Res. 2017, 82, 387–395. [Google Scholar] [CrossRef] [PubMed]
- Rautava, S.; Luoto, R.; Salminen, S.; Isolauri, E. Microbial contact during pregnancy, intestinal colonization and human disease. Nat. Rev. Gastroenterol. Hepatol. 2012, 9, 565–576. [Google Scholar] [CrossRef] [PubMed]
- Nadal, I.; Donant, E.; Ribes-Koninckx, C.; Calabuig, M.; Sanz, Y. Imbalance in the composition of the duodenal microbiota of children with coeliac disease. J. Med. Microbiol. 2007, 56, 1669–1674. [Google Scholar] [CrossRef]
- Collado, M.C.; Donat, E.; Ribes-Koninckx, C.; Calabuig, M.; Sanz, Y. Imbalances in faecal and duodenal Bifidobacterium species composition in active and non-active coeliac disease. BMC Microbiol. 2008, 8, 232. [Google Scholar] [CrossRef]
- Bernardo, D.; Garrote, J.A.; Nadal, I.; León, A.J.; Calvo, C.; Fernández-Salazar, L.; Blanco-Quirós, A.; Sanz, Y.; Arranz, E. Is it true that coeliacs do not digest gliadin? Degradation pattern of gliadin in coeliac disease small intestinal mucosa. Gut 2009, 58, 886–887. [Google Scholar] [CrossRef]
- Adjibade, M.; Julia, C.; Allès, B.; Touvier, M.; Lemogne, C.; Srour, B.; Hercberg, S.; Galan, P.; Assmann, K.E.; Kesse-Guyot, E. Prospective association between ultra-processed food consumption and incident depressive symptoms in the French NutriNet-Santé cohort. BMC Med. 2019, 17, 78. [Google Scholar] [CrossRef]
- Gómez-Donoso, C.; Sánchez-Villegas, A.; Martínez-González, M.A.; Gea, A.; de Deus Mendonça, R.; Lahortiga-Ramos, F.; Bes-Rastrollo, M. Ultra-processed food consumption and the incidence of depression in a Mediterranean cohort: The SUN Project. Eur. J. Nutr. 2020, 59, 1093–1103. [Google Scholar] [CrossRef]
- Galobardes, B.; Morabia, A.; Bernstein, M.S. Diet and socioeconomic position: Does the use of different indicators matter? Int. J. Epidemiol. 2001, 30, 334–340. [Google Scholar] [CrossRef] [PubMed]
- Marmot, M.; Feeney, A. General explanations for social inequalities in health. Soc. Inequalities Cancer 1997, 138, 207–228. [Google Scholar]


| Variable | N | Mean (SD) |
|---|---|---|
| Age (years) | 58 | 8.6 (4.1) |
| Total energy from ultra-processed foods (%) | 41 | 47.3 (13.5) |
| n (%) | ||
| Sex (female) | 58 | 35 (60.3) |
| Following a gluten-free diet for at least 6 months | 58 | 18 (31.0) |
| Following a gluten-free diet for at least 12 months | 58 | 37 (63.8) |
| Parents’ marital status (married) | 43 | 42 (97.7) |
| Passive smoker | 43 | 3 (7.0) |
| Living with their parents | 43 | 42 (97.7) |
| Mothers’ working status | 58 | |
| Unemployed | 6 (10.3) | |
| Employed | 52 (89.7) | |
| Fathers’ working status | 58 | |
| Unemployed | 2 (3.4) | |
| Employed | 56 (96.6) |
Publisher’s Note: MDPI stays neutral with regard to jurisdictional claims in published maps and institutional affiliations. |
© 2022 by the authors. Licensee MDPI, Basel, Switzerland. This article is an open access article distributed under the terms and conditions of the Creative Commons Attribution (CC BY) license (https://creativecommons.org/licenses/by/4.0/).
Share and Cite
Martín-Masot, R.; Labella, A.; Baena-García, L.; Flor-Alemany, M.; López-Frías, M.; de la Higuera, M.; Maldonado, J.; Nestares, T. Time Following a Gluten-Free Diet, Ultra-Processed Food Consumption and Quality of Life in Children with Celiac Disease. Appl. Sci. 2022, 12, 11680. https://doi.org/10.3390/app122211680
Martín-Masot R, Labella A, Baena-García L, Flor-Alemany M, López-Frías M, de la Higuera M, Maldonado J, Nestares T. Time Following a Gluten-Free Diet, Ultra-Processed Food Consumption and Quality of Life in Children with Celiac Disease. Applied Sciences. 2022; 12(22):11680. https://doi.org/10.3390/app122211680
Chicago/Turabian StyleMartín-Masot, Rafael, Ana Labella, Laura Baena-García, Marta Flor-Alemany, Magdalena López-Frías, Magdalena de la Higuera, José Maldonado, and Teresa Nestares. 2022. "Time Following a Gluten-Free Diet, Ultra-Processed Food Consumption and Quality of Life in Children with Celiac Disease" Applied Sciences 12, no. 22: 11680. https://doi.org/10.3390/app122211680
APA StyleMartín-Masot, R., Labella, A., Baena-García, L., Flor-Alemany, M., López-Frías, M., de la Higuera, M., Maldonado, J., & Nestares, T. (2022). Time Following a Gluten-Free Diet, Ultra-Processed Food Consumption and Quality of Life in Children with Celiac Disease. Applied Sciences, 12(22), 11680. https://doi.org/10.3390/app122211680