Article

Performance of Apple Pomace for Gluten-Free Bread Manufacture: Effect on Physicochemical Characteristics and Nutritional Value

by
Leire Cantero
1,2,
Jesús Salmerón
1,3,4,
Jonatan Miranda
1,3,4,
Idoia Larretxi
1,3,4,5,
María del Pilar Fernández-Gil
3,
María Ángeles Bustamante
3,
Silvia Matias
1,
Virginia Navarro
1,3,4,
Edurne Simón
1,3,4 and
Olaia Martínez
1,3,4,*
1
GLUTEN3S Research Group, Department of Pharmacy and Food Science, University of the Basque Country (UPV/EHU), 01006 Vitoria-Gasteiz, Spain
2
Department of Economic Development, Sustainability and Environment, Basque Government-Eusko Jaurlaritza, 01010 Vitoria-Gasteiz, Spain
3
Gluten Analysis Laboratory of the University of the Basque Country (UPV/EHU), Department of Pharmacy and Food Science, University of the Basque Country (UPV/EHU), 01006 Vitoria-Gasteiz, Spain
4
Nutrition and Food Safety Research Group, Bioaraba Health Research Institute, 01006 Vitoria-Gasteiz, Spain
5
Centro Integral de Atención a Mayores San Prudencio, Ayuntamiento de Vitoria-Gasteiz, 01006 Vitoria-Gasteiz, Spain
*
Author to whom correspondence should be addressed.
Appl. Sci. 2022, 12(12), 5934; https://doi.org/10.3390/app12125934
Submission received: 28 April 2022 / Revised: 3 June 2022 / Accepted: 7 June 2022 / Published: 10 June 2022
(This article belongs to the Special Issue Gluten-Free Foods)

Abstract

:
Apple pomace has been proposed as a quality enhancer for gluten-free bread, but its composition and physicochemical features differ significantly depending on the apple cultivar. The objective of this article was to characterize apple pomace powder (APP) from certain varieties from the Basque Country and to study the feasibility of adding it to gluten-free bread, focusing on physicochemical and nutritional aspects. APP was obtained by washing, drying and grinding, and it was added at 0, 5, 6 and 8%, together with other ingredients, such as gluten-free flours, corn starch and whey protein. APP had a reddish-grey coloration (L* 56.49 ± 1.39, a* 11.07 ± 0.47, b* 27.69 ± 1.76), pH 4.19 ± 0.15 and Aw 0.235 ± 0.084. Pomace powder was used successfully in higher amounts than experiences reported before. Key physicochemical parameters such as specific volume (≥2.5 cm3/g) and cohesiveness or resilience values (0.538 and 0.378, respectively) suggested good acceptability for gluten-free breads with 8% APP. Additionally, breads were a source of antioxidant potential (437.66 ± 38.95 µM DPPHeq/g APP), fiber (80.13 ± 6.07 g/100 g) and micronutrients such as Cu, Mg, Mn and Fe. In conclusion, local apple varieties are a good source of raw material for gluten-free bread manufacture, which offers a solution for environmental pollution and may contribute to boosting the circular economy.

1. Introduction

The high amount of waste generated in the food industry is attracting considerable attention and sustainable solutions are required to change this situation [1]. Reuse of food waste is a strategy aligned with the Sustainable Development Goals and it has been strongly related with circular economy practices [2,3].
Cider has traditionally been consumed and is economically relevant in many regions around the world. In the Basque Country (northern Spanish region) alone, 11,000 tons of apple are used for cider production annually (Eustat, 2021). Nevertheless, a third of the total amount of fruits is discarded as waste in the pressing stage. This residue is a combination of seeds, steams and peels known as apple pomace (AP); it is polluting and brings significant management costs [4,5]. It is composed of substances of nutritional interest, namely fiber and antioxidants [6]. The enrichment of foodstuffs with AP can affect aspects such as specific volume and nutritional value and, therefore, there are plenty of positive experiences adding AP as a value-added ingredient in general food products [4,7,8]. AP could also help to improve texture in gluten-free (GF) products: it has been reported that it helps to structure the food matrix due to its high water absorption and swelling capacity; thus, it could be a suitable alternative to gluten. However, studies addressing AP addition in GF products are still scarce [9].
The GF market has grown rapidly in recent years, and it is expected to continue doing so in the following years [9,10]. These products are not only intended for populations with specific medical needs but also for those who follow a GF diet (GFD) as a health regime. Currently, there are numerous research lines working in this area, where the main objective is to obtain nutritionally appropriate and sensorily attractive products, as close as possible to their gluten-containing homologues [11]. Researchers studying the current GF market in different countries have shown that the nutritional quality of GF products is lower than their gluten-containing homologues [12,13]. Cornicelli et al. [12] stated that Italian patients suffering celiac disease consume a high quantity of simple carbohydrates and fats, and that the celiac diet is frequently poor in fiber, protein and micronutrients; for instance, iron, calcium and selenium deficiencies are common in the celiac population. Similar results were recently obtained in a broader review performed in our research group about possible nutritional imbalances in adult celiac patients [14]. Moreover, there is still a lot of work ahead because of the technological difficulty caused by a lack of gluten. GF bread formulations have several texture deficiencies and some other quality defects associated with color and taste [15]. Indeed, lack of product variety and increased costs make it a challenge to maintain adherence to the GFD [16]. Achieving an acceptable product usually implies a complex list of ingredients including various refined flours and starches, additional fat and sugar and imbalanced energy [9]. Consequently, concern about the unsatisfactory nutritional quality of GFPs is increasing in recent decades [12,13,17].
Considering the possibility of using AP as a quality enhancer for GFPs, it should be noted that its composition and physicochemical features differ significantly depending on the apple cultivar [18]. Skinner et al. [19] identified limitations regarding the nutrient composition of apple pomace based on literature reviews and reference databases, including small sample sizes and lack of consistent reporting of confounding factors such as apple cultivars and varieties. Therefore, specific apple varieties should be studied as a source of AP, in order to define their potential specific uses as an ingredient in food manufacture, so that they can be an actual contribution to the circular economy in the food sector [8]. There are few experiences using apple pomace for GF bread [20,21,22,23] and further knowledge is required to verify the appropriate proportion of apple pomace in different types of bread [24].
In view of the above, the objective of this study was to characterize AP obtained from local apple varieties used for cider production in the Basque Country and to describe the physicochemical characteristics and nutritional aspects of several GF bread formulations adapted to increasing AP concentrations.

2. Materials and Methods

2.1. Materials

2.1.1. Apple Pomace

Apple pomace was collected from a local cooperative involved in the production of cider: Laneko scoop. (Bizkaia, Basque Country, Spain). It was a mixture of several acidic apple varieties (mainly Txistu and Orixa).
Cider production is a stationary activity and it is performed in the last quarter of the year. Thus, sampling was carried out on four different days (batches: A, B, C, D) from October to December 2020, on days when producers accomplished apple pressing. Apple pomace (AP) was immediately stored frozen (−25 °C) until processing.

2.1.2. Bread Making Ingredients (Others Than APP)

The main ingredient was a commercial GF flour blend (Dayelet®, Barcelona, Spain) from a sought-after brand for homemade GF bread making. Rice flour and cornstarch were used. Whey protein (80% purity), bakery yeast (Maizena®, Navarre, Spain), NaCl, virgin olive oil and water were also used. All the ingredients were GF certified.

2.2. Methods

2.2.1. Apple Pomace Powder Production

After defrosting, apple pomace was washed, oven-dried and ground. Washing was performed by stirring AP in water (1:1 proportion w:v) in a stainless steel recipient at room temperature for 10 min. Then, it was dried at 60 ± 2 °C for 72 h in an oven (J.P. Selecta). After that, grinding was carried out in a mill (Imetec Dolcevita) for 2 min until a fine powder was obtained. Finally, it was vacuum-packed (Taurus, VAC-6000, Oliana, Spain) and stored at −25 °C until analysis or use for bread making. The four batches collected were processed sequentially (A, B, C, D), which actually led to longer storage time for the last batches, since the time required to complete apple pomace powder (APP) processing was longer than the time between sampling periods.

2.2.2. Analytical Determinations in APP

  • pH value was measured following the AOAC 981.12 method using a Crison pH meter [25].
  • Fiber was determined by the Rapid Integrated Total Dietary Fiber Assay Kit (k-RINTDF) following the AOAC method 2017.06.
  • Proteins were determined by Kjeldhal (AOAC 920.152) [25].
  • Ash was analyzed by AOAC 940.26 [25].
  • Mineral analysis: Microwave-assisted digestion of samples was carried out in a Speed wave-four equipment (Berghof), mixing 100 mg of the sample and 5 mL nitric acid (65%). The analysis was performed by ICP-MS with a helium collision cell using 24Mg, 43Ca, 55Mn, 56Fe, 63Cu, 66Zn, and 77Se isotopes and e89 as the inner standard. Calibration was performed in a concentration range from 0.05 to 500 ng/mL.

2.2.3. Bread Making Procedure

Five formulations were chosen based on previous experience, including two controls: Ctrl—control bread (without APP) and CP—control with whey protein. Protein was a necessary ingredient in this formulation as it might help to structure dough and to improve bread quality [26]. We wanted to observe the effect of protein independently, and not make the mistake of attributing possible changes only to the pomace. GFB5, GFB6 and GFB8 were GF breads with whey protein added and APP at 5%, 6% and 8%, considering the whole dough (including water). These amounts were selected taking as a reference the Health Claims classification laid down by the Codex Alimentarius Commission [27] of “source of fiber” (≥3%) and “high fiber content” (≥6%), foreseeing that APP amounts higher than 5% will at least achieve those thresholds. GFB with minimum additive addition (containing xanthan gum but no HMPC, hydroxypropyl methylcellulose as a key additive, or other fiber-rich ingredients such as psyllium) was reported to have about 6–8 g fiber per 100 g of product [28]. Table 1 shows the relative amounts of the ingredients used in each formulation. Increasing APP amounts substituted the solid ingredients (mainly flours), as previously reported [7].
APP addition required higher water addition, due to the fiber level in the formulation [29]. Water was adjusted for all the formulations, to a level, which resulted adequate for manipulation. For both controls, hydration level on a dry basis was 96% while in APP formulations, hydration was 102%, which are usual values for gluten-free formulations [30]. This is an unavoidable adaptation [31], which makes it very difficult to study the effect of a key ingredient (i.e., APP) by itself in the final formulation. Indeed, the aim was to explore the feasibility of achieving an acceptable GF bread with high fiber content coming from APP addition, and to characterize the product as a whole.
Breads were prepared (from mixing to baking) in a bread maker (Imetec Zero-Glu) with the conditions proposed by the manufacturer for GF white bread making. First, mild water (22 °C) and yeast were weighted and mixed for 10 min. Meanwhile, GF flour, rice flour, cornstarch, protein and APP were weighed and added to the water–yeast mixture. Salt was added two minutes later, and oil 6 min after that. The whole mixing and kneading process lasted 16 min and fermentation took one hour. Finally, dough was divided into molds to bake for one hour.

2.2.4. Analytical Determinations in Bread

Nutritional composition was estimated from the information reported on the packaging of flours, starches and other ingredients used in the formulations. This information was completed with fiber, protein and mineral analyses in APP, performed in the laboratory.
Physicochemical determinations on bread samples were performed 2 h after elaboration, once breads were at room temperature. These were the determinations performed specifically in bread samples:
  • Specific volume: Breads were weighed with a precision balance (Mettler Toledo) and the volume was measured on a volumetric measuring cylinder by water displacement [32], covering each piece of bread with a plastic film, finely adapted to the loaf shape. As bread is a porous material, the plastic film prevented the samples from getting wet. Specific volume was calculated according to the formula:
    Specific volume (cm3/g) = Volume (cm3)/weight (g).
  • Moisture: This was determined by weight difference [25]; crumb samples (cylinders 1 cm diameter) were weighed and maintained at 105 ± 2 °C (J.P. Selecta) overnight until constant weight. The water content of each sample was calculated according to the formula:
    Moisture (%) = (M − m) × 100/M
    where, M = Initial weight of the sample (g); m = final weight of the sample (g).
  • Crumb texture: This was assessed instrumentally by texture profile analysis with a TA.XT2plus texture analyzer (Stable Micro System, Godalming, UK). Longitudinal cylinders (1 cm diameter) were extracted from the central part of each bread roll, with the aid of a cylindrical core sampler. The crumb sample was recovered from inside the cylinder by pushing it with a plunger. Samples’ lengths were standardized before the assay at 4 cm. Texture profile analysis (50%) was performed twice on 4 pieces of bread (n = 8), perpendicular to the axis of the cylindrical samples. Graphics were analyzed as described by other authors [33,34] and the following parameters were obtained:
    -
    Hardness: The highest force peak of the first compression cycle (N).
    -
    Cohesiveness: Ratio of the areas under the curve of the second compression cycle to the first compression cycle.
    -
    Resilience: Ratio between the areas under the curve of the withdrawal divided by the area under the curve in the downstroke, both in the first compression cycle.
    -
    Springiness: Ratio between the distances the sample is compressed in the second downstroke divided by the first downstroke.
    -
    Chewiness is calculated as cohesiveness × hardness × springiness (N).

2.2.5. Analytical Determinations in Both APP and Bread

  • Water activity (aw): This was measured with a Labmaster-aw device (Novasina, Lachen, Switzerland). When measuring APP, capsules were evenly filled with pomace powder, following technical specifications. For bread samples, aw was measured similarly, by grinding samples (Imetec Dolcevita grinder) and placing the grounded bread in the measuring capsules.
  • Color assessment: L*, a* and b* coordinates were measured with a spectrophotometer (CM-5, Konica Minolta, Spain), using the upper measuring site design for Petri dishes. For APP, 5 g was placed on a Petri plate covering its surface evenly; for bread samples, color measurements were taken for both crumb and crust. Crumbs were crumbled and distributed evenly on a Petri dish. When using the Petri dish to contain samples (APP or crumb), calibration was carried out with an empty Petri dish. Crust color was assessed by direct measurement on the bottom of each loaf of bread.
  • Antioxidant activity: This was measured spectrophotometrically (UV/VIS mini-1240 Shimadzu Europe, Duisburg, Germany) using a modified 2,2-diphenyl-1-picryl-hydrazyl-hydrate (DPPH) method [35]. A DPPH solution (40 ppm) was prepared mixing DPPH and methanol. Samples (APP or grinded crumb) were kept stirring in that solution for 1.5 h, covering the flask with aluminum paper to protect it from the light. The reaction mixture was a mixture of 3.9 mL DPPH in methanol (40 ppm) and 0.1 mL of the extracted solution. Absorbance was read at 515 nm after 180 min (when it was stable). Antioxidant activity was estimated with this formula:
    % antioxidant activity = 100 × (A0 − A1)/A1
    where, A0 = Absorbance of 40 ppm DPPH in methanol solution; A1 = Absorbance of the solution with the sample and 40 ppm DPPH in methanol.
A 65 µM DPPH solution was also prepared to build a standard curve in the range 13–65 µM. The decrease in DPPH concentration was calculated using this standard curve from samples stabilized at 180 min.

2.2.6. Statistical Analyses

Determinations for physicochemical parameters in both APP and bread were performed in triplicate (unless otherwise specified). Data were analyzed using IBM SPSS statistics 26.0. Data from descriptive analysis were expressed as mean values ± standard error. Possible differences between batches were identified by one-way ANOVA, setting statistical significance at 0.05. Homoscedasticity and normality were verified, and Fisher’s Least Significant Difference (LSD) was used as a post hoc test. Pearson correlation analysis was performed to look for a possible relation between variables.

3. Results and Discussion

3.1. Apple Pomace Powder

Table 2 shows physicochemical results for bread formulations.
The English classification of cider apple varieties distinguishes four types: bitter sharp, sharp, bittersweet and sweet [36]. The majority of apples used in the Basque Country for cider production are bitter sharp and sharp, according to Zuriarrain-Ocio et al. [37]; Orixa and Txistu are the main varieties used in Laneko cooperative, whose pH is around 3.5–4.5. These values match the pH results of all the batches analyzed (Table 2), without any notable variation between apples collected on different days.
Obtaining APP included a dehydration step where water was removed. A previous research study showed that low values of aw between 0.2 and 0.4 inhibit fungal growth and chemical reactions leading to deterioration, these results being optimal for product storage [5]. As expected, the dehydration process of apple pomace led to similar results in all batches.
The L, a* and b* color values in Table 2 aligned with color parameter values reported in similar research on several apple varieties [38]. The results of all batches indicated that APP shows reddish-yellowish colorations without significant differences among them.
Data on antioxidant activity from Table 2 show lower values for apple pomace compared to values for fresh apple reported in the literature. Processing decreases antioxidant capacity due to thermal and moisture conditions, which are associated with the browning phenomena of Maillard reactions [39]. Values from all the sampling days were similar, with only slight variations, which might be associated with the storage period prior to APP processing. It was observed that the batch that was stored for a longer time, D, obtained the lowest values for antioxidant activity, whereas batch A (the former processed one) presented the higher antioxidant capacity. In spite of this apparent variability, raw material from every sampling day showed relevant DPPH values, which were in agreement with the literature. However, regarding antioxidant properties, storage time and conditions appeared to be the key variable to obtaining the highest quality standard.
Mineral content, shown in Table 3, is parallel with information from previous studies on dried apple pomace. Some small changes were detected between sampling days (not significant, p > 0.05), probably due to changes in the proportion of distinct apple varieties in the pressing stage [7]. In comparison with mineral values reported by Antonic et al. [7], our APP presented similar values for Mg (439.5–478.0 µg/g), but higher values than the range compiled for Cu (5.5 to 7.27 µg/g compared to 1.1–2.2 µg/g). Our APP had Zn and Mn values around the lower bounds previously reported by Antonic et al. [7] and Skinner et al. [19] (2.2 µg/g and 4.0 µg/g, respectively) and lower than in those previous studies for Ca and Fe.
High molecular weight dietary fiber (HMWDF) content is shown in Table 3, together with its proportion of insoluble dietary fiber (IDF) and soluble dietary fiber that precipitates in the presence of 78% aqueous ethanol (SDFP) portions, describing results similar to other authors [18]. The ratio IDF/SDFP is 2.2:1 and is also in agreement with previous values in the literature [19]. The amount of protein and ash was between 2.81–4.12 g/100 g and 1.35–2.71 g/100 g, respectively, and these resemble previously reported values as well [7]. No significant differences (p < 0.05) were detected between batches in parameters reported in Table 3.

3.2. Nutritional Value of GF Bread

Nutritional information for bread formulations was estimated and is shown in Table 4, so that it can be compared with data from previous studies [12,13,40].
GFB with APP had less simple carbohydrates and fats and more protein, fiber and micronutrients than Ctrl bread, supporting the use of APP as a fortification ingredient in bread. It is worth noting that all the GFB formulations in our study contained a lower amount of carbohydrates and a higher amount of fiber than the amounts declared for most of the commercial GF breads that are currently on the market [41]. Energy contribution tended to be slightly lower than marketed products, while proteins remained similar. Salt content was higher than in general GF commercial formulations. Salt was added at 1.5% to the formulations, based on values observed in commercial products. This was not an objective in this study, so it was maintained at that level in all the samples. However, the authors will keep it as a variable to adapt in the future in order to meet the current daily recommendation of 2 g/day [42].
Nutrient contribution within reference values was expressed in 100 g (two 50 g portions), which could be a realistic daily intake (Table 4). This way, daily energy contribution would be 9.0–9.2%, while carbohydrate, sugar, protein and total lipids were 12.0–12.8%, 1.0–1.12%, 10.2–10.3%, and 4.42–4.48%, respectively, considering the reference intake of an average adult (8400 kJ/2000 kcal) from European Regulation (EU) No 1169/2011 on the provision of food information to consumers [43]. Taking into account a daily average requirement of 25 g fiber [44], our GFB formulations contributed 25–32.6%. APP-supplemented GFB (at 5%, 6% and 8%) contained a higher quantity of fiber than the amount regulated [45] for high-fiber foods (>6 g/100 g), so it can be considered as a high-fiber product.
Fajardo et al. [13] pointed out that to develop nutritionally complete GF bread, natural fortification is recommended with ingredients high in fiber, antioxidants and micronutrients. Our group described possible underestimation of fiber in commercial gluten-free breads [40].
Regarding micronutrients, general deficiencies of cooper, iron and zinc have been described for celiac patients [43]; GFB formulations achieved, respectively, 35%, 5.5% and 1.8% of the amount of dietary reference values considered as significant (15%) for these minerals, as established by Regulation (EU) No 1169/2011 [40]. In addition, iron and Mn tend to be low in GF products [46]. In our case, it was estimated that GFB8 formulation made a notable contribution in Mn, around 10% of the significant dietary reference value. Finally, Mg content reached 6.7% of the significant dietary reference values, which might be relevant as Mg deficiency is common in unbalanced GFD [47], in which it is usually recommended as a supplement.

3.3. Physicochemical Characteristics of GF Bread

Table 5 shows the physicochemical results for bread formulation. Specific volume (SV) increased from the control bread to the 5% APP bread. Nevertheless, this increment did not show a linear tendency: the additions of larger amounts of APP (6–8%) decreased specific volume and gave lower values than GFB5. Similar results were reported by Parafati et al. [48], where the highest specific volumes of bread were described in breads with 10% fiber extract, whilst 15% and 20% addition showed lower values. O’Shea et al. [49] described significantly higher values in fiber-supplemented GF samples compared to the control and increased SV values until 4% orange fiber addition, followed by lowered values from that level onwards. Moreover, results for specific volume in GFB were coherent with values compiled by Rocha Parra et al. [31] for increasing APP addition. The specific volume of GFB has been reported to vary significantly in relation to the ingredients and bread making procedure [30]. In this work, results spanned between 2.4 and 3.1 cm3/g, in agreement with values reported for GFB based on rice flour and starches in previous studies [48,49]. In addition to other factors (dough viscosity, active surface components), fiber content is highly related to alterations in specific volume, because of its high water binding capacity, which might limit fermentation and, thus, gas production. The absence of gluten complicates the retention of CO2 created during fermentation and, according to Rocha Parra et al. [31], high fiber ingredients (such as APP) can make this problem even more critical. In this study, the specific volume was acceptable for all the samples, even though it started to show a declining tendency (GFB6 and GFB8). This was due to the adaptation of water proportion, which tends to equilibrate excess of water absorption by fiber [31]. Djeghim et al. [22] reported specific volumes lower than 2.16 cm3/g in bread formulations with 2.5 to 7.5% added. These values were obtained using an APP with lower fiber content (15.9%) than ours (80.4%). It is relevant to take into account specifically the type of ingredient that is being added, and its composition, so that it can be correlated to the final quality characteristics. The type of fiber will depend on the source (variety of fruit or cereal) as concluded in previous research [7].
The moisture of the GFB did not differ generally among formulations (Table 5), apart from GFB5. As a greater water amount was added in APP-containing samples, GFB5 had the highest moisture values, similarly to previous results described in the literature [4]. However, further addition of APP decreased water content and aw, as has been observed before [50]. Our results suggested a decrease in available water from GFB5 to GFB8, which can be explained by the fact that increasing fiber content enhances the capacity to trap water present in the food matrix.
Antioxidant activity is shown in Table 5, expressed either as percentage or as DPPH equivalents. The literature shows that the antioxidant activity of GFB is negatively affected by bread making [51]. In our study, control breads presented lower antioxidant values, and while additions at 5% and 6% did not differ significantly, 8% additions did. Consequently, and in spite of the losses that bread making provokes, APP addition increased the antioxidant activity of breads, which matches other previous studies [52]. Gumul et al. [23] also described increased antioxidant activity in GF breads with 5 to 15% APP added.

3.4. Bread Color Characteristics

Table 6 shows the results for CIELAB parameters in bread formulations. Whey protein presented a light brown color, which could influence the color parameters of bread, especially CP where the only colored ingredient is whey protein, apart from the basic mix of flours and starches. L* (Luminosity) parameter value decreased in both the crumb and crust of GFB as APP was added in higher doses, similarly to results reported in the literature [6]. Nevertheless, variations were bigger in the crust, where heat treatment has more of an effect than in the crumb, promoting the Maillard reaction [53]. The inner color may reflect the effect of the heat treatment too, but the decrease in the L* value was more significant in the crust. GFB8 had the lowest L* values in the crumb, as previously shown in the crust. Regarding a*, APP addition increased these values for the crumb compared with the Ctrl, as previously described by Wang et al. [6], whilst for the crust, values remained similar. These results might be due to the intensity of the baking phenomenon occurring on the surface of the bread, which might even overlap the coloring effect of APP. In the case of the CP, protein addition might promote the Maillard reaction and, thus, there was a significant difference in comparison to Ctrl, with higher a* values for CP in the crust. Indeed, APP addition appeared to reduce a* values in the bread surface. On the contrary, in the inner part, APP addition had an increasing effect on a* values. In the crumb, CP did not exceed a* values of APP-containing breads. Values for b*, for both crumb and crust, placed APP-supplemented GFB as a brownish color. As for a* values in the samples containing APP, b* tended to decrease for the crust while it increased for the crumb. For both crumb and crust, controls were more yellowish and GFBs were reddish-brownish. Our results presented a similar tendency to the results from Djeghim et al. [22], but our breads were darker and more reddish. In spite of the differences in formulations and APP characteristics, these authors also described reduced L*, a* and b* values with increased APP addition.

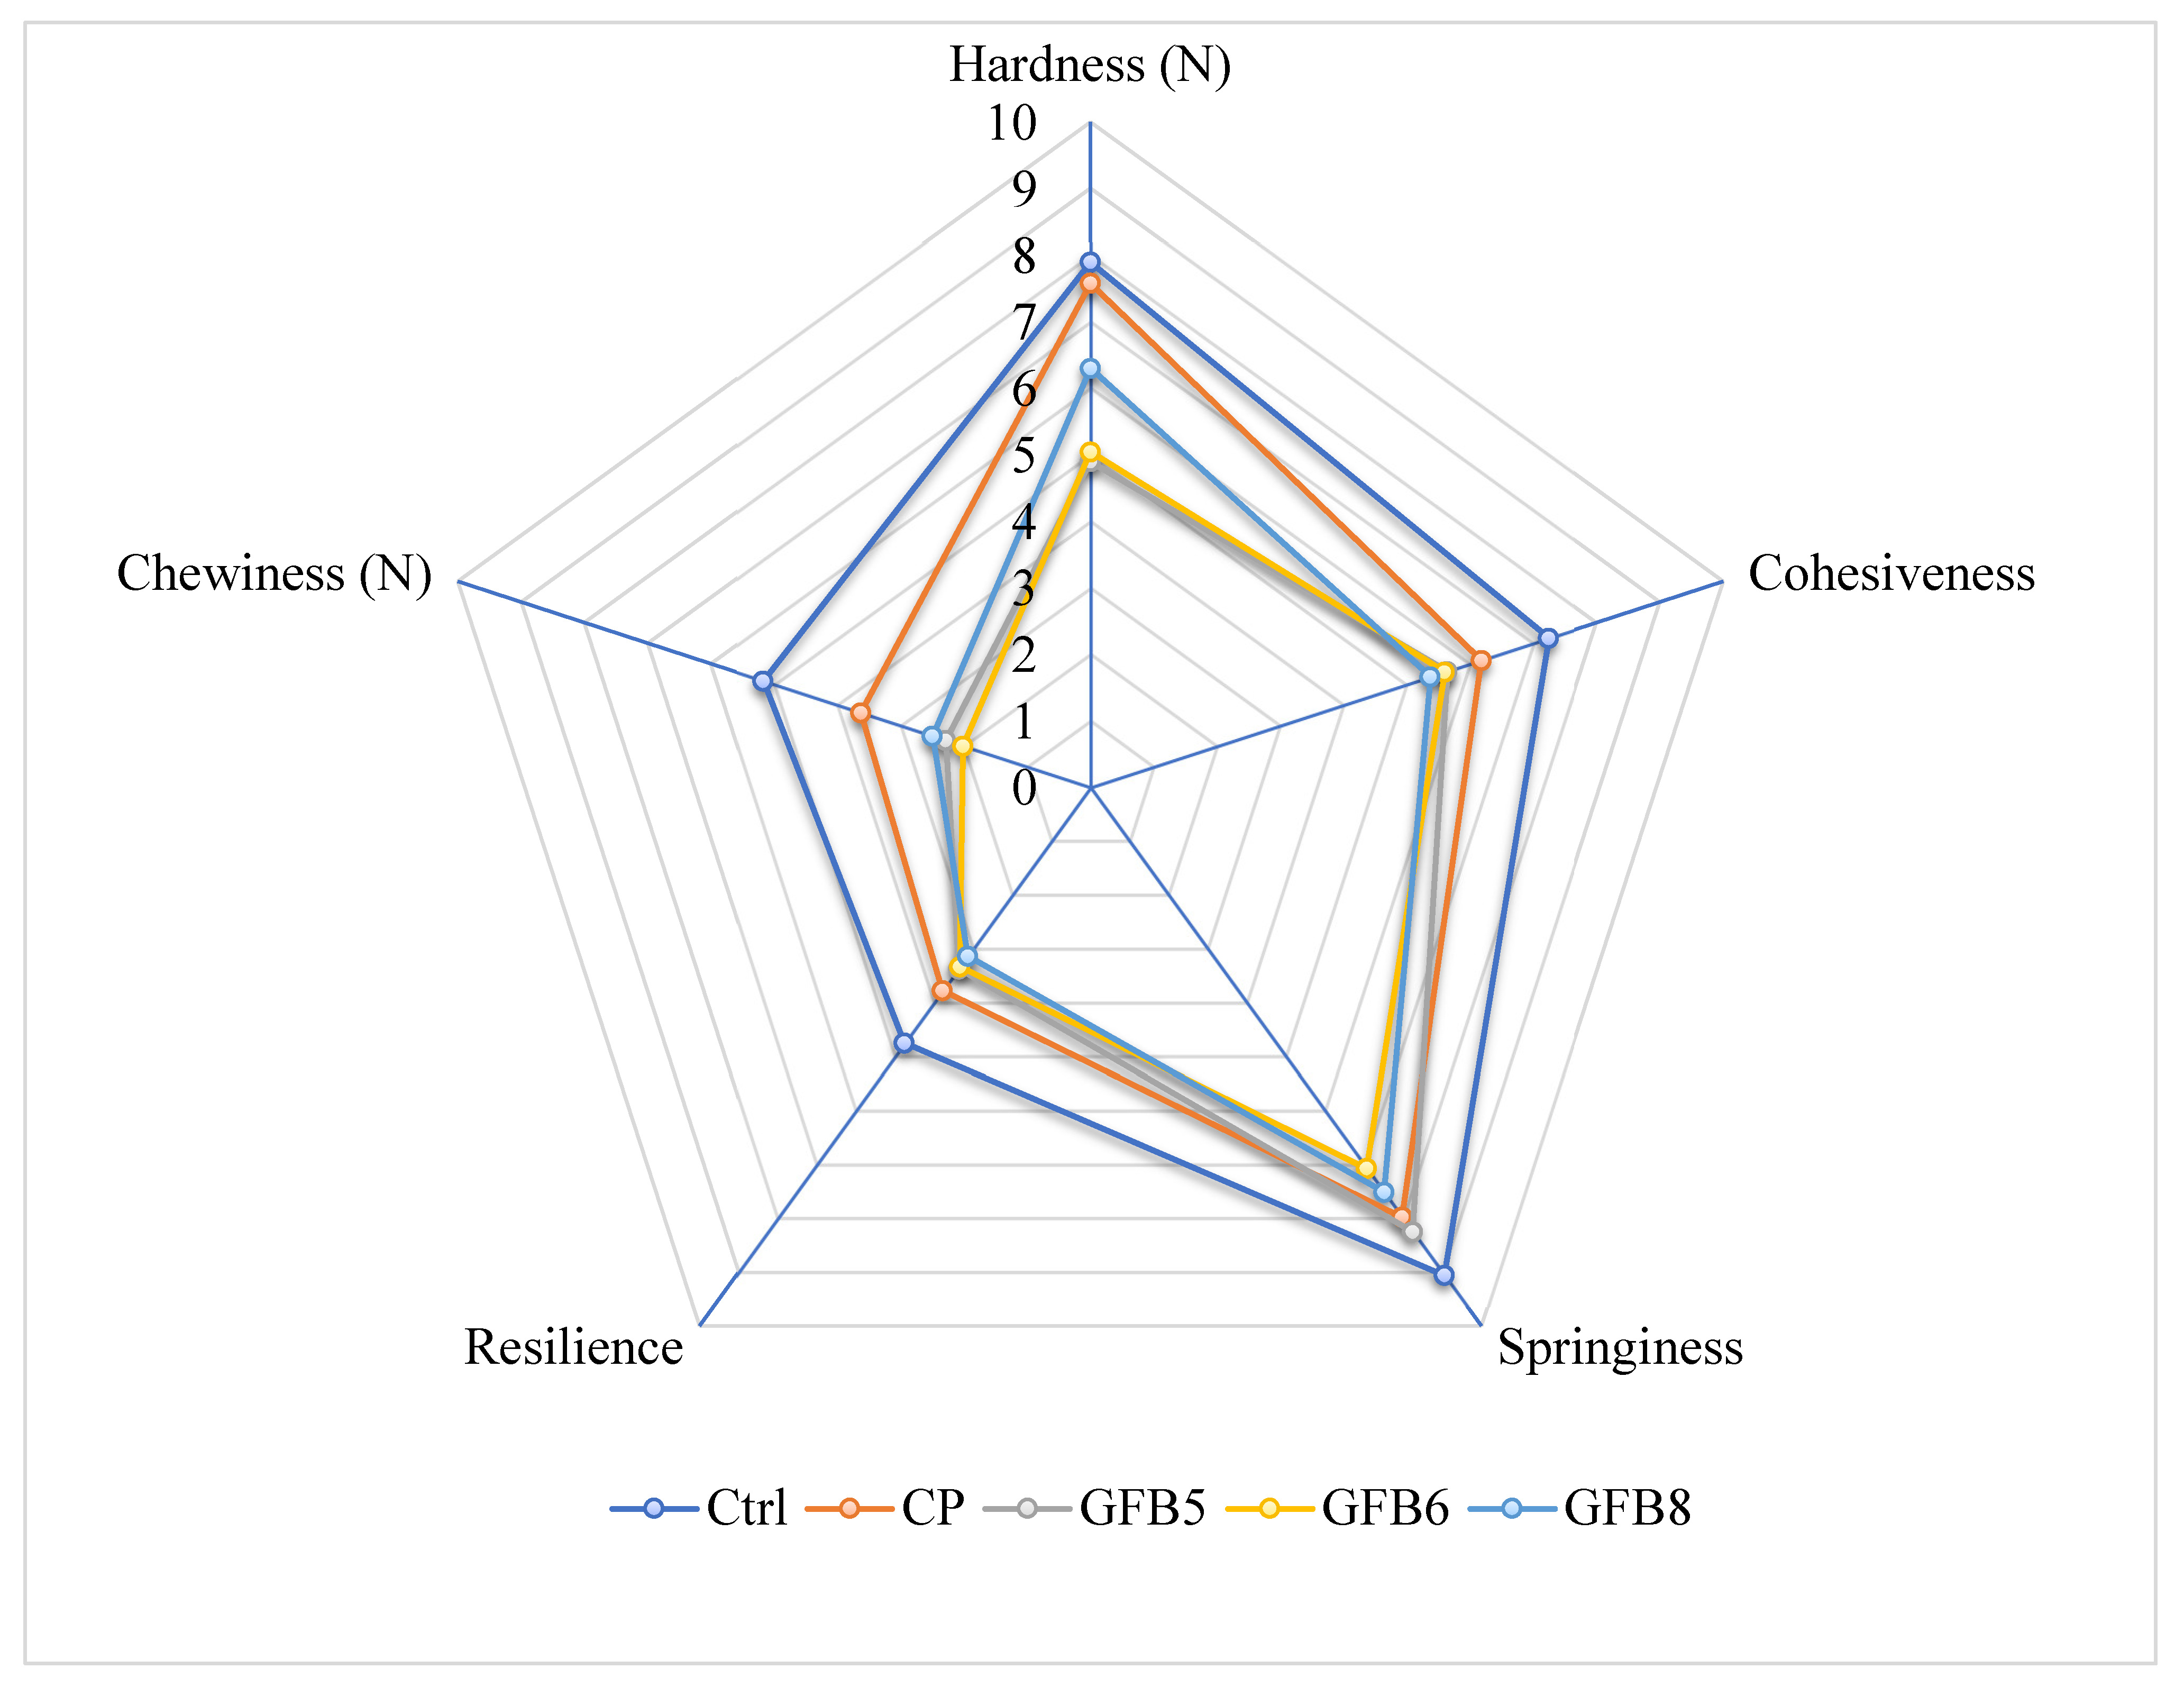
3.5. Texture Profile Analysis of Bread

Results from the texture profile analysis are shown in Figure 1. The main significant changes happened in most of the texture parameters from Ctrl to CP. Protein addition brought a significant (p < 0.05) decrease in most of the parameters, except for hardness. In this parameter, the decrease was not statistically significant, with lower values when APP was added (4.893 ± 0.49 N in 5% formulation) in comparison to CP (7.580 ± 0.883 N). As stated before, hardness tended to increase from GFB5 to GFB8 (0.5040 ± 0.481 N and 6.295 ± 0.539 N, respectively), but this change was not statistically significant. Chewiness had a similar behavior, but with significant differences between Ctrl (5.178 ± 0.539 N), CP (3.628 ± 0.314 N) and GF formulation (values in the range 2.000 ± 0.206–2.491 ± 0.265 N). For chewiness, there were no statistical differences due to APP increase between the three GFB samples. Cohesiveness showed significant changes from Ctrl (0.725 ± 0.002) to CP (0.618 ± 0.023), which continued decreasing significantly with the lowest value registered for GFB8 (0.538 ± 0.030). Springiness decreased significantly (p < 0.05) with protein addition (from 0.906 ± 0.01 for Ctrl to 0.798 in CP) and increased again (p < 0.05) with APP addition at 5% (0.825 ± 0.011); however, further APP addition brought a significant (p < 0.05) decrease in this parameter (0.707 ± 0.024 and 0.751 ± 0.033 for 6% and 8%, respectively). Values for resilience were significantly (p < 0.05) lower when compared to the Ctrl (0.475 ± 0.004), with no significant change among the rest of the samples (p > 0.05), which registered values within the range 0.314 ± 0.015 to 0.378 ± 0.015.
Matos and Rosell [54] concluded that texture parameters are suitable to discriminate between commercial GFBs. However, they described a great variability in texture parameters among marketed products. Our samples were in the lowest range reported by these authors for hardness and chewiness and our cohesiveness and resilience were higher than their mean values. These authors found positive correlation between hydration properties, cohesiveness and resilience; in our case, there was a lowered aw tendency from GFB5 to GFB8, together with a slight decline in those texture parameters. Rocha Parra et al. [31] studied the combined effect of APP and water content on GF formulations on cohesiveness and resilience and they observed that increasing only APP brought decreasing values for both parameters. At the same time, this effect was corrected by increased water addition, as was carried out in this work (Table 1). Values compiled by these authors for cohesiveness and resilience were consistent with the values reported in our samples. However, in our case, chewiness was the clearest attribute discriminating between samples containing or not containing APP, as apple addition significantly decreased values in comparison with both control (highest values) and CP. A similar effect was described for hardness, as well; Jannati et al. [55] evaluated the quality of Sangak bread (a traditional Iranian bread) that included APP (1 to 7% w/w of flour) indicating that adding apple pomace can reduce the hardness of bread texture. Other authors described increasing hardness with higher APP amount in several bakery products [7]. Nevertheless, it should be noted that changes from Ctrl and CP to APP-containing samples are due not only to APP addition, but also to a proportional reduction in flours and increased water content. Increasing APP required more water to be added to the mixture as it had a high water holding capacity and trapped free water, limiting available water for dough manipulation and fermentation. As described by Rocha Parra et al. [31], water addition helps to correct texture parameters when these are modified by increasing APP addition.

3.6. Overall Remarks

Recent works selected 5% APP in GF bread as the best formulation, taking sensory acceptability into account [23,56]. In our experience, if the formulation is adapted in terms of water addition, APP amounts higher than 5% can be added to GF bread. This helps to achieve higher specific volumes and, therefore, texture parameters become more desirable.
Amount of APP added and protein content are the main parameters conditioning GFB formulations in this work. Table S1 (Supplementary data) shows results for correlation analysis between these factors and the main dependent variables assessed. Cautious interpretation should be made in the case of protein, which was added at a constant amount in CP and GFB samples. Nevertheless, results from correlation analysis for APP confirmed some of the main results discussed previously in this article. It is worth noting the positive association found between APP and DPPH. High polyphenol content in APP may be responsible for a higher antioxidant potential, as previously reported by Gumul et al. [23]. Specific volume was also positively correlated to APP, despite the fact that this was a weaker association. On the contrary, APP had an inverse significant correlation with aw. Regarding color, L* and a* in the crumb were correlated strongly (p < 0.01) to APP, negatively to the former and positively to the latter. Correlation analysis with color parameters was concurrent with previous ANOVA analysis, suggesting lightness and yellowness decrease together with an increase in redness with increasing APP addition. For texture parameters, a general significant negative correlation was identified, in agreement with previous analysis, which indicated an overall decrease in texture values with APP increase.

4. Conclusions

Apple pomace powder from cider by-products has proven to be a feasible ingredient for gluten-free bread manufacture, as results of physicochemical quality parameters were concurrent with those described previously in the literature. Moreover, apple pomace powder could make a remarkable contribution to the nutritional quality of gluten-free breads, providing higher amounts of certain micronutrients, which are key factors within a gluten-free diet. These conclusions could be extrapolated to other apple varieties used for cider or juice production elsewhere, if they hold similar raw characteristics. Adjusting the water content of apple-pomace-containing formulations has been confirmed as a necessary step when adding fiber sources to gluten-free formulations. This made it possible to achieve GF breads with 8% APP content, which is higher compared to those judged as optimum previously (at around 5%). Values in key physicochemical characteristics may suggest good acceptability (specific volume ≥ 2.5 cm3/g, cohesiveness 0.538 ± 0.030, springiness 0.751 ± 0.033 and resilience 0.378 ± 0.015). Further studies along this research line should entail sensory analysis to assess consumer acceptance and market analysis involving local producers in order to guarantee that a sustainable circular economy net is established.

Supplementary Materials

The following supporting information can be downloaded at: https://www.mdpi.com/article/10.3390/app12125934/s1, Table S1: Pearson Correlation analysis results (correlation coefficients and p value) between APP or protein content, physicochemical and instrumental sensory attributes (color and texture).

Author Contributions

Conceptualization, J.S., M.d.P.F.-G., M.Á.B., V.N., E.S. and O.M.; methodology, J.M., I.L, V.N. and O.M.; formal analysis, L.C., J.M., I.L., M.d.P.F.-G., M.Á.B., S.M. and O.M.; investigation, L.C., J.S., I.L. and O.M.; resources, M.Á.B., V.N., E.S. and O.M.; writing—original draft preparation, L.C.; writing—review and editing, L.C., J.S., J.M., I.L., M.Á.B., V.N. and O.M.; supervision, J.S., M.d.P.F.-G., E.S. and O.M.; project administration, E.S.; funding acquisition, J.S. and J.M. All authors have read and agreed to the published version of the manuscript.

Funding

This research was developed within a project funded by the Department of Food Quality and Food Industries of the Basque Government (00025-IDA2019-38) and was possible thanks to a grant received for labor costs by the Department of Economic Development, Sustainability and Environment of the same institution.

Institutional Review Board Statement

Not applicable.

Informed Consent Statement

Not applicable.

Data Availability Statement

Data available on request.

Acknowledgments

The authors thank all the members and students at the GLUTEN3S research group who helped, in one way or another, with this work. We thank the Analytic Chemistry laboratory at the Central Service of Analysis in Araba–SGIker of UPV/EHU, as well, for technical and human support provided.

Conflicts of Interest

The authors declare no conflict of interest. The funders had no role in the design of the study; in the collection, analyses, or interpretation of data; in the writing of the manuscript, or in the decision to publish the results.

References

  1. Esposito, B.; Sessa, M.R.; Sica, D.; Malandrino, O. Towards circular economy in the agri-food sector. A systematic literature review. Sustainability 2020, 12, 7401. [Google Scholar] [CrossRef]
  2. Schroeder, P.; Anggraeni, K.; Weber, U. The Relevance of Circular Economy Practices to the Sustainable Development Goals. J. Ind. Ecol. 2019, 23, 77–95. [Google Scholar] [CrossRef] [Green Version]
  3. Teigiserova, D.A.; Hamelin, L.; Thomsen, M. Towards transparent valorization of food surplus, waste and loss: Clarifying definitions, food waste hierarchy, and role in the circular economy. Sci. Total Environ. 2020, 706, 136033. [Google Scholar] [CrossRef] [PubMed]
  4. Nakov, G.; Brandolini, A.; Hidralgo, A. Influence of apple peel powder addition on the phsyco-chemical characteristics and nutritional quality of bread wheat cookies. Food Sci. Technol. Int. 2020, 26, 1–9. [Google Scholar] [CrossRef]
  5. Zlatanović, S.; Ostojić, S.; Micić, D.; Rankov, S.; Dodevska, M.; Vukosavljević, P.; Gorjanović, S. Thermal behaviour and degradation kinetics of apple pomace flours. Thermochim. Acta 2019, 673, 17–25. [Google Scholar] [CrossRef]
  6. Wang, X.; Kristo, E.; LaPointe, G. Adding apple pomace as a functional ingredient in stirred-type yogurt and yogurt drinks. Food Hydrocoll. 2020, 100, 105453. [Google Scholar] [CrossRef]
  7. Antonic, B.; Jancikova, S.; Dordevic, D.; Tremlova, B. Apple pomace as food fortification ingredient: A systematic review and meta-analysis. J. Food Sci. 2020, 85, 2977–2985. [Google Scholar] [CrossRef]
  8. Fernandes, P.A.R.; Ferreira, S.S.; Bastos, R.; Ferreira, I.; Cruz, M.T.; Pinto, A.; Coelho, E.; Passos, C.P.; Coimbra, M.A.; Cardoso, S.M.; et al. Apple pomace extract as a sustainable food ingredient. Antioxidants 2019, 8, 189. [Google Scholar] [CrossRef] [Green Version]
  9. Föste, M.; Verheyen, C.; Jekle, M.; Becker, T. Fibres of milling and fruit processing by-products in gluten-free bread making: A review of hydration properties, dough formation and quality-improving strategies. Food Chem. 2020, 306, 125451. [Google Scholar] [CrossRef]
  10. Makovicky, P.; Makovicky, P.; Caja, F.; Rimarova, K.; Samasca, G.; Vannucci, L. Celiac disease and gluten-free diet: Past, present, and future. Gastroenterol. Hepatol. Bed Bench 2020, 13, 1–7. [Google Scholar] [CrossRef]
  11. Naqash, F.; Gani, A.; Gani, A.; Masoodi, F.A. Gluten-free baking: Combating the challenges—A review. Trends Food Sci. Technol. 2017, 66, 98–107. [Google Scholar] [CrossRef]
  12. Cornicelli, M.; Saba, M.; Machello, N.; Silano, M. Nutritional composition of gluten-free food versus regular food sold in the Italian market. Aliment. Tract 2018, 50, 1305–1308. [Google Scholar] [CrossRef] [PubMed]
  13. Fajardo, V.; González, M.P.; Martínez, M.; Samaniego-Vaesken, M.D.L.; Achón, M.; Úbeda, N.; Alonso-Aperte, E. Updated food composition database for cereal-based gluten-free products in spain: Is reformulation moving on? Nutrients 2020, 12, 2369. [Google Scholar] [CrossRef] [PubMed]
  14. Cardo, A.; Churruca, I.; Lasa, A.; Navarro, V.; Vázquez-Polo, M.; Perez-Junkera, G.; Larretxi, I. Nutritional imbalances in adult celiac patients following a gluten-free diet. Nutrients 2021, 13, 2877. [Google Scholar] [CrossRef]
  15. Krupa-Kozak, U.; Drabińska, N.; Baczek, N.; Šimková, K.; Starowicz, M.; Jeliński, T. Application of broccoli leaf powder in gluten-free bread: An innovative approach to improve its bioactive potential and technological quality. Foods 2021, 10, 819. [Google Scholar] [CrossRef]
  16. Miaja, M.F.; Martín, J.J.D.; Treviño, S.J.; González, M.S.; García, C.B. Study of adherence to the gluten-free diet in coeliac patients. An. Pediatr. 2020, 94, 4–11. [Google Scholar] [CrossRef]
  17. Miranda, J.; Lasa, A.; Bustamante, M.A.; Churruca, I.; Simon, E. Nutritional Differences Between a Gluten-free Diet and a Diet Containing Equivalent Products with Gluten. Plant Foods Hum. Nutr. 2014, 69, 182–187. [Google Scholar] [CrossRef]
  18. Figuerola, F.; Hurtado, M.L.; Estévez, A.M.; Chiffelle, I.; Asenjo, F. Fibre concentrates from apple pomace and citrus peel as potential fibre sources for food enrichment. Food Chem. 2005, 91, 395–401. [Google Scholar] [CrossRef]
  19. Skinner, R.C.; Gigliotti, J.C.; Ku, K.-M.; Tou, J.C. A comprehensive analysis of the composition, health benefits, and safety of apple pomace. Nutr. Rev. 2018, 76, 893–909. [Google Scholar] [CrossRef]
  20. Arslan, M.; Rakha, A.; Xiaobo, Z.; Mahmood, M.A. Complimenting gluten-free bakery products with dietary fiber: Opportunities and constraints. Trends Food Sci. Technol. 2019, 83, 194–202. [Google Scholar] [CrossRef]
  21. Capriles, V.D.; Santos, F.G.; Aguiar, E.V. Innovative gluten-free bread making. In Trends in Wheat and Bread Making; Galanakis, C.H., Ed.; Academic Press: Cambridge, MA, USA; Elsevier: Amsterdam, The Netherlands, 2021; pp. 371–404. [Google Scholar] [CrossRef]
  22. Djeghim, F.; Bourekoua, H.; Różyło, R.; Bieńczak, A.; Tanaś, W.; Zidoune, M.N. Effect of by-products from selected fruits and vegetables on gluten-free dough rheology and bread properties. Appl. Sci. 2021, 11, 4605. [Google Scholar] [CrossRef]
  23. Gumul, D.; Ziobro, R.; Korus, J.; Kruczek, M. Apple pomace as a source of bioactive polyphenol compounds in gluten-free breads. Antioxidants 2021, 10, 807. [Google Scholar] [CrossRef] [PubMed]
  24. Lyu, F.; Luiz, S.F.; Azeredo, D.R.P.; Cruz, A.G.; Ajlouni, S.; Ranadheera, C.S. Apple pomace as a functional and healthy ingredient in food products: A review. Processes 2020, 8, 319. [Google Scholar] [CrossRef] [Green Version]
  25. AOAC. Official Methods of Analysis, 21st ed.; The Association of Official Analytical Chemist: Washington, DC, USA, 2019. [Google Scholar]
  26. Skendi, A.; Papageorgiou, M.; Varzakas, T. High Protein Substitutes for Gluten in Gluten-Free Bread. Foods 2021, 10, 1997. [Google Scholar] [CrossRef]
  27. Codex Alimentarius. Guidelines for the Use of Nutrition and Health Claims. 1997. Available online: https://www.fao.org/ag/humannutrition/32444-09f5545b8abe9a0c3baf01a4502ac36e4.pdf (accessed on 14 February 2022).
  28. Romão, B.; Botelho, R.B.A.; Alencar, E.R.; Silva, V.S.N.D.; Pacheco, M.T.B.; Zandonadi, R.P. Chemical composition and glycemic index of gluten-free bread commercialized in Brazil. Nutrients 2020, 12, 2234. [Google Scholar] [CrossRef]
  29. Roman, L.; Belorio, M.; Gomez, M. Gluten-Free Breads: The Gap Between Research and Commercial Reality. Compr. Rev. Food Sci. Food Saf. 2019, 18, 690–702. [Google Scholar] [CrossRef] [Green Version]
  30. Gómez, M.; Talegón, M.; Hera, E.D.L. Influence of mixing on quality of gluten-free bread. J. Food Qual. 2013, 36, 139–145. [Google Scholar] [CrossRef]
  31. Parra, A.F.R.; Ribotta, P.D.; Ferrero, C. Apple pomace in gluten-free formulations: Effect on rheology and product quality. Int. J. Food Sci. Technol. 2015, 50, 682–690. [Google Scholar] [CrossRef]
  32. Mandala, I.G.; Sotirakoglou, K. Effect of frozen storage and microwave reheating on some physical attributes of fresh bread containing hydrocolloids. Food Hydrocoll. 2005, 19, 709–719. [Google Scholar] [CrossRef]
  33. Bourne, M. Texture profile analysis. Food Technol. 1978, 32, 62–67. [Google Scholar]
  34. Wee, M.S.M.; Goh, A.T.; Stieger, M.; Forde, C.G. Correlation of instrumental texture properties from textural profile analysis (TPA) with eating behaviours and macronutrient composition for a wide range of solid foods. Food Funct. 2018, 9, 5301–5312. [Google Scholar] [CrossRef] [PubMed]
  35. Ferrentino, G.; Morozova, K.; Mosibo, O.K.; Ramezani, M.; Scampicchio, M. Biorecovery of antioxidants from apple pomace by supercritical fluid extraction. J. Clean. Prod. 2018, 186, 253–261. [Google Scholar] [CrossRef]
  36. Jolicoeur, C. The New Cider Maker’s Handbook: A Comprehensive Guide for Craft Producers; Chelsea Green Publishing Company: White River Junction, VT, USA, 2013. [Google Scholar]
  37. Zuriarrain-Ocio, A.; Zuriarrain, J.; Vidal, M.; Dueñas, M.T.; Berregi, I. Antioxidant activity and phenolic profiles of ciders from the Basque Country. Food Biosci. 2021, 41, 100887. [Google Scholar] [CrossRef]
  38. Li, X.; Wu, X.; Bi, J.; Liu, X.; Li, X.; Guo, C. Polyphenols accumulation effects on surface color variation in apple slices hot air drying process. LWT 2019, 108, 421–428. [Google Scholar] [CrossRef]
  39. Sacchetti, G.; Cocci, E.; Pinnavaia, G.; Mastrocola, D.; Rosa, M.D. Influence of processing and storage on the antioxidant activity of apple derivatives. Int. J. Food Sci. Technol. 2008, 43, 797–804. [Google Scholar] [CrossRef]
  40. Larretxi, I.; Churruca, I.; Navarro, V.; Miranda, J.; Lasa, A.; Bustamante, M.Á.; Simon, E. Effect of analytically measured fiber and resistant starch from gluten-free products on the diets of individuals with celiac disease. Nutrition 2020, 70, 110586. [Google Scholar] [CrossRef]
  41. Aguiar, E.V.; Santos, F.G.; Krupa-Kozak, U.; Capriles, V.D. Nutritional facts regarding commercially available gluten-free bread worldwide: Recent advances and future challenges. Crit. Rev. Food Sci. Nutr. 2021, 61, 1–13. [Google Scholar] [CrossRef]
  42. Turck, D.; Castenmiller, J.; Henauw, S.D.; Hirsch-Ernst, K.I.; Kearney, J.; Knutsen, H.K.; Maciuk, A.; Mangelsdorf, I.; McArdle, H.J.; Pelaez, C.; et al. Dietary reference values for sodium. EFSA J. 2019, 17, e05778. [Google Scholar] [CrossRef] [Green Version]
  43. Regulation (EC) No. 1169/2011 of the European Parliament and of the Council of 25 October 2011 on the Provision of Food Information to Consumers. Available online: https://eur-lex.europa.eu (accessed on 2 November 2021).
  44. EFSA. Dietary reference values for nutrients: Summary report. EFSA 2017, 14, e15121. [Google Scholar] [CrossRef] [Green Version]
  45. Regulation (EC), No. 1924/2006 of the European Parliament and of The Council on Nutrition and Health Claims Made on Foods. Available online: https://eur-lex.europa.eu (accessed on 2 November 2021).
  46. Al-Toma, A.; Volta, U.; Auricchio, R.; Castillejo, G.; Sanders, D.S.; Cellier, C.; Mulder, C.J.; Lundin, K.E.A. European Society for the Study of Coeliac Disease (ESsCD) guideline for coeliac disease and other gluten-related disorders. United Eur. Gastroenterol. J. 2019, 7, 583–613. [Google Scholar] [CrossRef]
  47. Rondanelli, M.; Faliva, M.A.; Gasparri, C.; Peroni, G.; Naso, M.; Picciotto, G.; Riva, A.; Nichetti, M.; Infantino, V.; Alalwan, T.A.; et al. Micronutrients dietary supplementation advices for celiac patients on long-term gluten-free diet with good compliance: A review. Medicina 2019, 55, 337. [Google Scholar] [CrossRef] [PubMed] [Green Version]
  48. Parafati, L.; Restuccia, C.; Palmeri, R.; Fallico, B.; Arena, E. Characterization of prickly pear peel flour as a bioactive and functional ingredient in bread preparation. Foods 2020, 9, 1189. [Google Scholar] [CrossRef] [PubMed]
  49. O’Shea, N.; Rößle, C.; Arendt, E.; Gallagher, E. Modelling the effects of orange pomace using response surface design for gluten-free bread baking. Food Chem. 2015, 166, 223–230. [Google Scholar] [CrossRef] [PubMed]
  50. Curti, E.; Carini, E.; Diantom, A.; Vittadini, E. The use of potato fibre to improve bread physico-chemical properties during storage. Food Chem. 2016, 195, 64–70. [Google Scholar] [CrossRef] [PubMed]
  51. Karrar, E.M.A. A review on: Antioxidant and its impact during the bread making process. Int. J. Food Sci. Nutr. 2014, 3, 592–596. [Google Scholar] [CrossRef]
  52. Ahmad, S.; John, S.; Bosco, D.; Ahmad, M. Effect of apple pomace on quality characteristics of brown rice based cracker. J. Saudi Soc. Agric. Sci. 2017, 16, 25–32. [Google Scholar] [CrossRef] [Green Version]
  53. Celik, E.E.; Gokmen, V. Formation of Maillard reaction products in bread crust like model system made of diferent whole cereal fours. Eur. Food Res. Technol. 2020, 246, 1207–1218. [Google Scholar] [CrossRef]
  54. Matos, M.E.; Rosell, C.M. Relationship between instrumental parameters and sensory characteristics in gluten-free breads. Eur. Food Res. Technol. 2012, 235, 107–117. [Google Scholar] [CrossRef] [Green Version]
  55. Jannati, N.; Hojjatoleslamy, M.; Hosseini, E.; Mozafari, H.R.; Siavoshi, M. Effect of apple pomace powder on rheological properties of dought and Sangak bread texture. Carpathian J. Food Sci. Technol. 2018, 10, 77–84. [Google Scholar]
  56. Masoodi, F.A.; Sharma, B.; Chauhan, G.S. Use of apple pomace as a source of dietary fiber in cakes. Plant Foods Hum. Nutr. 2002, 57, 121–128. [Google Scholar] [CrossRef]
Figure 1. Mean values for texture parameters from the instrumental texture profile analysis. Bread formulations (batches): Ctrl, control batch; CP, control with protein added; GFB5, GFB6, and GFB8, gluten-free bread with protein and apple pomace powder added at 5%, 6% or 8%. Resilience, springiness and cohesiveness data must be read as ×10−1.
Applsci 12 05934 g001
Table 1. List of ingredients of each sample batch and their relative amounts, expressed as percentage of the complete dough mixture.
IngredientsFormulations
CtrlCPGFB5GFB6GFB8
Water (%)44.044.047.847.847.8
GF flour (%)40.837.028.327.325.3
Rice Flour (%)4.84.84.84.84.8
Corn starch (%)4.84.84.84.84.8
Whey protein (%)0.03.83.83.83.8
APP (%)0.00.05.06.08.0
Oil (%)2.92.92.92.92.9
Salt (%)1.51.51.51.51.5
Yeast 1 (%)1.21.21.11.11.1
Ctrl, control batch; CP, control with protein added; GFB5, GFB6, and GFB8, gluten-free bread with protein and apple pomace powder added at 5, 6 or 8%. 1 Exact yeast amount for controls and formulations containing APP was 8.2 g per loaf of bread or 2.4 g per gram of solid ingredients.
Table 2. Mean and standard error values of physicochemical parameters of batches of apple pomace powder (APP) collected from October to December, on four different days (A, B, C, D).
Batches
ABCD
ColorL*54.477±0.315 a57.540±0.705 a56.947±0.481 a57.033±1.097 a
a*10.897±0.227 a10.483±0.472 a11.497±0.125 a11.443±0.499 a
b*25.483±0.550 a27.057±1.390 a29.007±0.490 a29.207±0.514 a
pH 3.967±0.038 b4.233±0.133 ab4.260±0.021 a4.287±0.034 a
aw 0.211±0.048 a0.180±0.012 a0.359±0.145 a0.189±0.021 a
DPPH % 30.171±0.777 a27.399±0.274 ab27.716±1.189 ab24.232±0.274 b
DPPH (µMol eq./g APP) 482.280±12.424 a437.973±4.384 ab443.040±19.00 ab387.343±4.384 b
Significant differences between batches (p < 0.05) are identified with different letters (a,b).
Table 3. Mineral and fiber mean content (standard deviation) of A–C apple pomace powder (APP) batches, collected in four different days from October to December.
Batches
ABCD
Minerals
(µg/g)
Mg 475.00(25.792)478.00(33.651)440.00 (30.4785)439.50 (10.911)
Ca221.00(9.370)210.00(16.107)227 (20.031)241.00 (16.383)
Mn4.030(0.029)4.01(0.189)4.055 (0.268)4.510 (0.166)
Fe18.10(3.058)11.10(1.276)22.50 (1.456)37.20 (1.528)
Cu6.79(0.368)6.69(0.254)5.540 (0.323)7.270 (0.265)
Zn3.44(0.330)3.57(0.375)6.330 (0.466)7.405 (0.331)
Se<LOQ <LOQ <LOQ <LOQ
Protein (%) 3.85(0.38)3.73(0.12)2.98(0.17)3.47(0.28)
Ash (%) 1.55(0.27)2.37(0.48)1.94(0.41)1.55(0.12)
Fiber fractionsHMWDF (g/100 g) 75.000(1.414)89.000(1.414)74(1.414)82.5(2.121)
IDF (%)65.31 73.07 68.93 64.88
SDFP (%)34.69 26.93 31.07 35.12
Lowest quantification limit (LOQ) for Se was 1 µg/g. IDF (insoluble dietary fiber) and SDFP (soluble dietary fiber that precipitates in the presence of 78% aqueous ethanol) are expressed as fraction (%) of HMWDF (total high molecular weight dietary fiber).
Table 4. Nutritional values for Ctrl, CP, GFB5, GFB6 and GFB8.
Energy and Nutrient Values (per 100 g of Bread)Formulations
CtrlCPGFB5GFB6GFB8
Energy (kcal)202.15203.64184.30183.29181.49
Carbohydrates (g)42.2439.1033.2932.6031.43
Sugars (g)1.311.221.020.990.94
Dietary fiber (g) 13.653.306.236.928.15
Protein (g)2.715.595.155.145.12
Total lipid (g)3.493.443.143.133.11
Saturated fat (g)0.510.500.450.450.45
Magnesium (mg) 2NDND2.352.863.78
Calcium (mg) 2NDND1.061.291.71
Iron (mg) 2NDND0.070.090.11
Manganese (mg) 2NDND0.020.020.03
Copper (mg) 2NDND0.030.040.05
Zinc (mg) 2NDND0.020.020.03
Salt (g)1.571.561.441.441.44
Ctrl, control batch; CP, control with protein added; GFB5, GFB6, and GFB8, gluten-free bread with protein and apple pomace powder added at 5%, 6% or 8%. ND, not determined as it was not reported in the ingredients added. 1 Takes into account fiber amount reported for raw ingredients and fiber determined for apple pomace powder. 2 For formulations containing apple pomace powder, mineral contents are those determined analyzing apple pomace powder, but not any other raw materials.
Table 5. Mean values ± standard error of physicochemical parameters performed in bread formulations.
BatchSV (cm3/g)WC (%)AwDPPH (%)DPPH Eq.
(µM/g Bread)
Ctrl2.517±0.019 c48.597±1.296 ab0.900±0.019 a5.319±0.408 b77.108±5.902 b
CP2.383±0.042 c47.220±0.443 b0.835±0.005 a6.150±0.479 ab73.249±5.707 b
GFB53.026±0.102 a50.242±0.309 a0.830±0.008 a6.508±0.139 ab77.513±1.666 b
GFB62.498±0.063 c48.145±0.335 ab0.767±0.013 a6.493±0.103 ab77.359±1.221 b
GFB82.723±0.037 b49.454±0.341 ab0.618±0.083 b6.755±0.333 a114.286±5.611 a
Ctrl, control batch; CP, control with protein added; GFB5, GFB6, and GFB8, gluten-free bread with protein and apple pomace powder added at 5%, 6% or 8%. SV, specific volume; WC, water content; AW, water activity. Significant differences between batches (p < 0.05) are identified with different letters (a–c).
Table 6. Mean values ± standard error of CIELAB coordinates (L*, a*, b*) in crust and crumb for each bread formulation.
Color Parameters
BatchZoneL*a*b*
CtrlCrust65.873±0.540 a15.689±0.452 b44.943±0.231 a
Crumb78.004±0.394 α2.278±0.203 ε26.186±0.407 α
CPCrust54.398±0.300 b18.280±0.061 a36.886±0.225 b
Crumb65.996±0.240 β4.391±0.136 δ24.016±0.255 β
GFB5Crust47.209±0.686 c14.911±0.262 bc27.876±0.239 c
Crumb47.164±0.814 γ9.044±0.120 γ19.722±0.258 δ
GFB6Crust41.549±0.529 d14.939±0.222 bc23.583±0.658 d
Crumb47.267±0.547 γ9.866±0.112 β21.853±0.138 γ
GFB8Crust35.643±1.130 e13.969±0.355 c18.725±0.556 e
Crumb41.776±0.662 δ12.781±0.148 α23.848±0.586 β
Ctrl, control batch; CP, control with protein added; GFB5, GFB6, and GFB8, gluten-free bread with protein and apple pomace powder added at 5%, 6% or 8%. Different letters in a column (a–e) stand for significant (α < 0.05) differences in the crust between formulations. Different letters in a column (α, β, γ, δ, ε) stand for significant (α < 0.05) differences in the crumb between formulations.
Publisher’s Note: MDPI stays neutral with regard to jurisdictional claims in published maps and institutional affiliations.

