Article

Power Profile Index: An Adjustable Metric for Load Monitoring in Road Cycling

by
Manuel Mateo-March
1,2,
José Ramón Lillo-Beviá
3,
Gabriel della Mattia
4,
Xabier Muriel
5,
David Barranco-Gil
2,
Mikel Zabala
6,
Javier Courel-Ibáñez
7,* and
José Antonio Salas-Montoro
6
1
Sport Sciences Department, Universidad Miguel Hernández, 03202 Elche, Spain
2
Faculty of Sport Sciences, Universidad Europea de Madrid, 28670 Madrid, Spain
3
Polytechnic School, University of Alicante, 03690 Alicante, Spain
4
EDNacore AI, AGMT2 Human Performance, Pompano, FL 33062, USA
5
Human Performance and Sports Science Laboratory, Faculty of Sport Sciences, University of Murcia, 30720 San Javier, Spain
6
Department of Physical Education and Sport, Faculty of Sport Sciences, University of Granada, 18011 Granada, Spain
7
Department of Physical Education and Sports, Faculty of Education and Sport Sciences, University of Granada, C/Santander 1, 52005 Melilla, Spain
*
Author to whom correspondence should be addressed.
Appl. Sci. 2022, 12(21), 11020; https://doi.org/10.3390/app122111020
Submission received: 15 August 2022 / Revised: 11 October 2022 / Accepted: 28 October 2022 / Published: 31 October 2022
(This article belongs to the Special Issue Progresses in Resistance Training)

Abstract

:
Workload is calculated from exercise volume and intensity. In endurance sports, intensity has been measured using heart rate or RPE, giving rise to load indexes such as sRPE or TRIMP. In cycling, the advent of power meters led to new indexes, such as TSS. All these indexes have limitations, especially for high intensity exercise. Therefore, a new index for cycling is proposed, the Power Profile Index (PPi), which includes a weighting factor obtained from the relative exercise intensity and stage type. Using power data from 67 WorldTour cyclists and fatigue records in different stage types from 102 road cyclists, weighting factors for intensity and stage type were determined. Subsequently, the PPi was computed and compared to current indexes using data from a WorldTour team during the 2018 Tour de France. The proposed index showed a strong correlation with perceived fatigue as a function of stage type (R2 = 0.9996), as well as no differences in the load quantification in different types of stage profiles (p = 0.292), something that does not occur with other indexes such as TSS, RPE, or eTRIMP (p < 0.001). Therefore, PPi is a new index capable of quantifying the high intensity efforts that produce greater fatigue, as well as considering the stage type.

1. Introduction

Thanks to technological advances in sport sciences, it is currently possible to directly measure the mechanical workload (external load) performed by an athlete during training or competition [1]. An objective workload data collection informs the training process and facilitates the coach’s decision making in adjusting preparation plans based on metabolic efficiency, energy expenditure, cumulative fatigue, or readiness to perform [1,2]. Particularly in road cycling, the development of sensor-equipped cranks or pedals to quantify power output (PO) as a measure of external load [3,4,5] is probably one of the biggest milestones in sport sciences in recent years. Prior to this, athletes, coaches, and scientists had to use subjective scales, such as the rating of perceive exertion (RPE), combined with physiological measurements, such as heart rate (HR) or blood lactate, and volume data (e.g., duration) [6]. Combining these variables, some indexes based on the exercise intensity and volume emerged, such as the training impulse index (TRIMP), which involves exercise duration, HR average, and an exponential factor to weight the intensity [7,8,9], and the individualized TRIMP (TRIMPi), which links individual HR to the individual blood lactate curve [10].
Although HR-based methods are easy to use and HR could be an equally useful variable as PO when planning training, it should be noted that a minimum duration is needed to reach a target HR due to a delay in HR response [11], which is not the case for PO, which is instantaneous. Therefore, despite a large body of published research using HR to analyze the physiologic demands of competition, it has been suggested that HR data is not capable of quantifying high-intensity interval training or non-steady state exercise [12,13]. In addition, HR is influenced by external variables (e.g., temperature, dehydration, and cardiovascular drift) [14,15] or stored fatigue, especially at the end of long-duration competitions [16]. In fact, overtraining [17] or acute fatigue may have effects on resting HR [18,19,20], submaximal HR [19,21,22], and even HRmax [23]. Moreover, there can be large differences in HR at the same intensity between race and non-competitive conditions [14]. For these reasons, the usefulness of any kind of HR-based TRIMP equations for quantifying training load may be limited [7,8,9,10]. More recently, heart rate variability (HRV), another HR-based metric, has proven useful for assessing daily fatigue and recovery to monitor training status [24,25]. Therefore, combined with other methods of load quantification, it can be of great help. To overcome the drawbacks of TRIMP, traditional approaches, such as session-RPE (sRPE) [26], have been used in elite cycling [27]. However, RPE lacks an objective external intensity factor and relies solely on cyclists’ perceptions. While RPE represents a reliable method of measuring workloads [13,28], the convoluted interplay of different factors affecting the personal perception of physical exertion must be considered. Moreover, Robinson et al. did not observe a correlation between the average effort scores and the average relative training speed between athletes, suggesting that RPE scales might be useful for comparing or prescribing training intensities individually, but not for comparisons between different athletes [29].
The training load can be divided into two components: internal load (e.g., HR or RPE) and external load (e.g., power) [30], with the ideal being the combined use of both [31]. The introduction of power meters in road cycling allowed for the monitoring of PO. This led to important advances in the real quantification of effort during training or competition, allowing for changes in performance to be examined throughout the season [32], or even along a session or race [33]. Furthermore, power profiles can be automatically updated from training software databases without the need of performing specific tests, resulting in a better description of reality (describing the current athlete status based on the actual work performed during training or competition during a desired time window), as well as time savings. A new external load index based on PO outcomes, the Training Stress Score (TSS), was also developed with power meters. This value is obtained from an estimate of Functional Threshold Power (FTP), the maximum power a cyclist can maintain at a near constant pace for approximately one hour [34]. Nonetheless, the TSS presents important limitations, one of its main problems being that it does not sufficiently weight intensity with respect to volume. Because of this, short, high-intensity exercises (e.g., time trials) score much lower than longer, very low-intensity exercises, as PO and time are directly related in a hyperbolic way [35]. Moreover, the TSS cannot be individualized nor adjusted to a particular exercise intensity zone, both being critical factors for an accurate management of the relationship between training dose and training outcome or response [32]. In addition, while FTP has been suggested as a non-invasive and practical alternative for estimating physiologically relevant events, such as maximal lactate steady state (MLSS) [36], recent investigations demonstrate a large variability between traditionally established events (e.g., ventilatory and lactate thresholds) [37,38]. Thus, two individuals cycling at 80% of their FTP could, be exercising at dissimilar physiological levels, resulting in different intensity, adaptations, fatigue, and recovery times [39,40].
A plausible approach to make the index adjustable could be the use of the theoretical available time to exhaustion (TTE) at different cycling physiological events, namely maximal oxygen uptake (VO2max), respiratory compensation point (RCP), MLSS, and first ventilatory threshold (VT1) [38,41,42,43,44,45,46,47]. It has also been suggested to use the hyperbolic energy production curve for different times of efforts in order to contemplate changes in energy production during the exercise session [48]. However, this proposal has not yet been incorporated into a training intensity quantification method. Besides, adding an exponential factor to weight intensity based on the stage type (e.g., high mountain, middle mountain, flat, long time trials, or prologues) could help to increase the accuracy of the estimations.
This study proposes a new quantification metric, the Power Profile Index (PPi), which includes a weighting factor based on the individual PO profile, relative exercise intensity, and stage type. The study comprised two experiments with data from professional cyclists (1) to validate the weighting factors, and (2) to cross-validate the PPi against current load quantification methods.

2. Materials and Methods

2.1. Experimental Design

The PPi design process involved three phases: first, the variables and formula were determined by the researchers; then, data from high-level cyclists in competition were used to simulate PPi and determine weighting factors; finally, data from a professional WorldTour team competing in the 2018 Tour de France were used to compute PPi and compare the records against the current indexes.

2.2. Participants

The first experiment (PPi weighting factors) involved PO data from 67 WorldTour professional cyclists (VO2max: 77.33 ± 6.02 mL·kg·min−1 [49]; age: 26.95 ± 5.70 years, weight: 64.9 ± 7.8 kg) and records of fatigue incurred during different stage types from 102 road cyclists (41 professional, 13 elite, and 48 under 23; VO2max: 67.25 ± 8.21 mL·kg·min−1 [49]; age: 23.45 ± 9.01 years, weight: 68.0 ± 2.8 kg). The second experiment (PPi comparison against other indices) involved performance records of 8 professional cyclists (VO2max: 81.19 ± 3.82 mL·kg·min−1 [49]; age: 32.89 ± 4.54 years, weight: 67.0 ± 7.1 kg) during the 2018 Tour de France (3-week tracking metrics), all from the same WorldTour professional cycling team. All participants volunteered to take part in this study and provide a written consent, according to the Declaration of Helsinki.

2.3. Power Profile Index (PPi) Equation

The PPi was computed as
PP i = i = 1 6 [ ( % t Z i ) · ( % d i f Z i ) · K + t ] 100
where % t Z i are the percentages of time relative to total exercise duration spent in each of the six intensity zones, % d i f Z i are the percentage differences that each intensity represents, referring to the previous intensity, K is the weighting factor for the stage type, and t is the total exercise duration (in minutes). The % d i f Z i was computed, taking the peak PO as reference (100%), and then calculating the percentage power loss of each zone with respect to the previous one. For example, for peak PO of 20.35 W·kg−1 and mean PO values of 17.81 W·kg−1 (5 s effort, upper limit of Z6) and 12.27 W·kg−1 (30 s effort, lower limit of Z6), the % d i f Z 6 shall be the average of the percentage power loss of the two limits (12.5% and 27.3% respectively), resulting 19.9%. These differences are multiplied by the stage weighting factor ( K ), which is a mathematical constant introduced in the algorithm with the aim of obtaining the best possible result in the correlation analysis between PPi and perceived fatigue (Figure 1). Each value of K is the number that best adjusts the PPi results with perceived fatigue in the four types of stages analyzed.

2.4. Data Collection

A power meter (Power2Max, Type S, Nieder Seifersdorf, Waldhufen, Germany) was used to record PO (W) and cadence (rpm) [50] and an HR strap (HRM Dual band, Garmin International, Inc., Olathe, KS, USA) was used to record HR (bpm). Data for PO, HR, and cadence were transmitted to a unit display (Garmin Edge 1000, Garmin International, Inc., Olathe, KS, USA). During every stage of the 2018 Tour de France, HR and PO were continuously recorded (1 Hz). Prior to every stage, cyclists performed zero-offset, according to the manufacturers’ power meter instructions. Finally, 30 min after completing the stages, RPE was collected using a Borg CR-10 scale [51].
Additionally, the fatigue incurred during four different stage types (high-mountain: 4.5 h race, cumulative slope 3000–4000 m; flat: 4.5 h race, cumulative slope < 1000 m; time trial: ~35 km race; and prologues: ~10 km race) from 102 road cyclists was recorded retrospectively using a 0–10 Likert scale [52].

2.5. Data Analysis

Potential spikes were checked and removed using specific software (Data Spike ID and FIX chart, WKO5 Build 576; TrainingPeaks LLC, Boulder, CO, USA). Data were extracted using the specialized software WKO5 (Peaksware LLC, Lafayette, CO, USA).
Values of PO were divided into six intensity zones, according to the TTE associated with each physiological event: Zone 1 (Z1): 2 h to 5 h, exercise intensity around VT1 [44,53]; Zone 2 (Z2): 30 min to 2 h, efforts near the MLSS [38,46,54]; Zone 3 (Z3): 10 min to 30 min, exercise intensity near to RCP [38,45,55,56]; Zone 4 (Z4): 2 min to 10 min; efforts slightly above or below maximal aerobic power (MAP) [38,42,43,45]; Zone 5 (Z5): 30 s to 2 min, efforts slightly above or below the anaerobic capacity [57,58]; Zone 6 (Z6): 5 s to 30 s, exercise intensity near to maximal anaerobic power [57,59,60]. Values of HR were divided into five intensity zones, according to their percentage of the maximum heart rate (HRmax), as follows: Z1 < 60% of HRmax; Z2 = 60% to 70% of HRmax; Z3 = 70% to 80% of HRmax; Z4 = 80% to 90% of HRmax; and Z5 = 90% to 100% of HRmax.
For each stage, different intensity scores (internal and external) were calculated as a function of RPE, PO, HR, and duration: (1) sRPE was computed by multiplying the stage duration (min) by the RPE [26]; (2) mean power was shown in absolute (W) and relative (W·kg−1) terms; (3) mechanical energy spent was calculated in absolute terms (kJ), as follows, and in relative terms (kJ·km−1); (4) TSS was calculated as follows, where t is the time spent (in seconds), NP is the normalized power, IF is an intensity factor (calculated as the ratio between NP of the race stage and the individuals’ FTP) [34], and FTP was determined as 95% of the highest 20 min mean power achieved during the last 6 weeks prior to the start of the Tour de France; (5) Edward’s TRIMP (eTRIMP) [9] was calculated, using the accumulated time in the five HR intensity zones ( t Z i ), as follows:
A b s o l u t e   m e c h a n i c a l   e n e r g y = P a v ( W ) · r i d e   l e n g t h   ( s ) 1000   ( k J )
TSS = t · NP · IF FTP · 3600 · 100
eTRIMP = i = 1 5 t Z i · i

2.6. Statistical Analysis
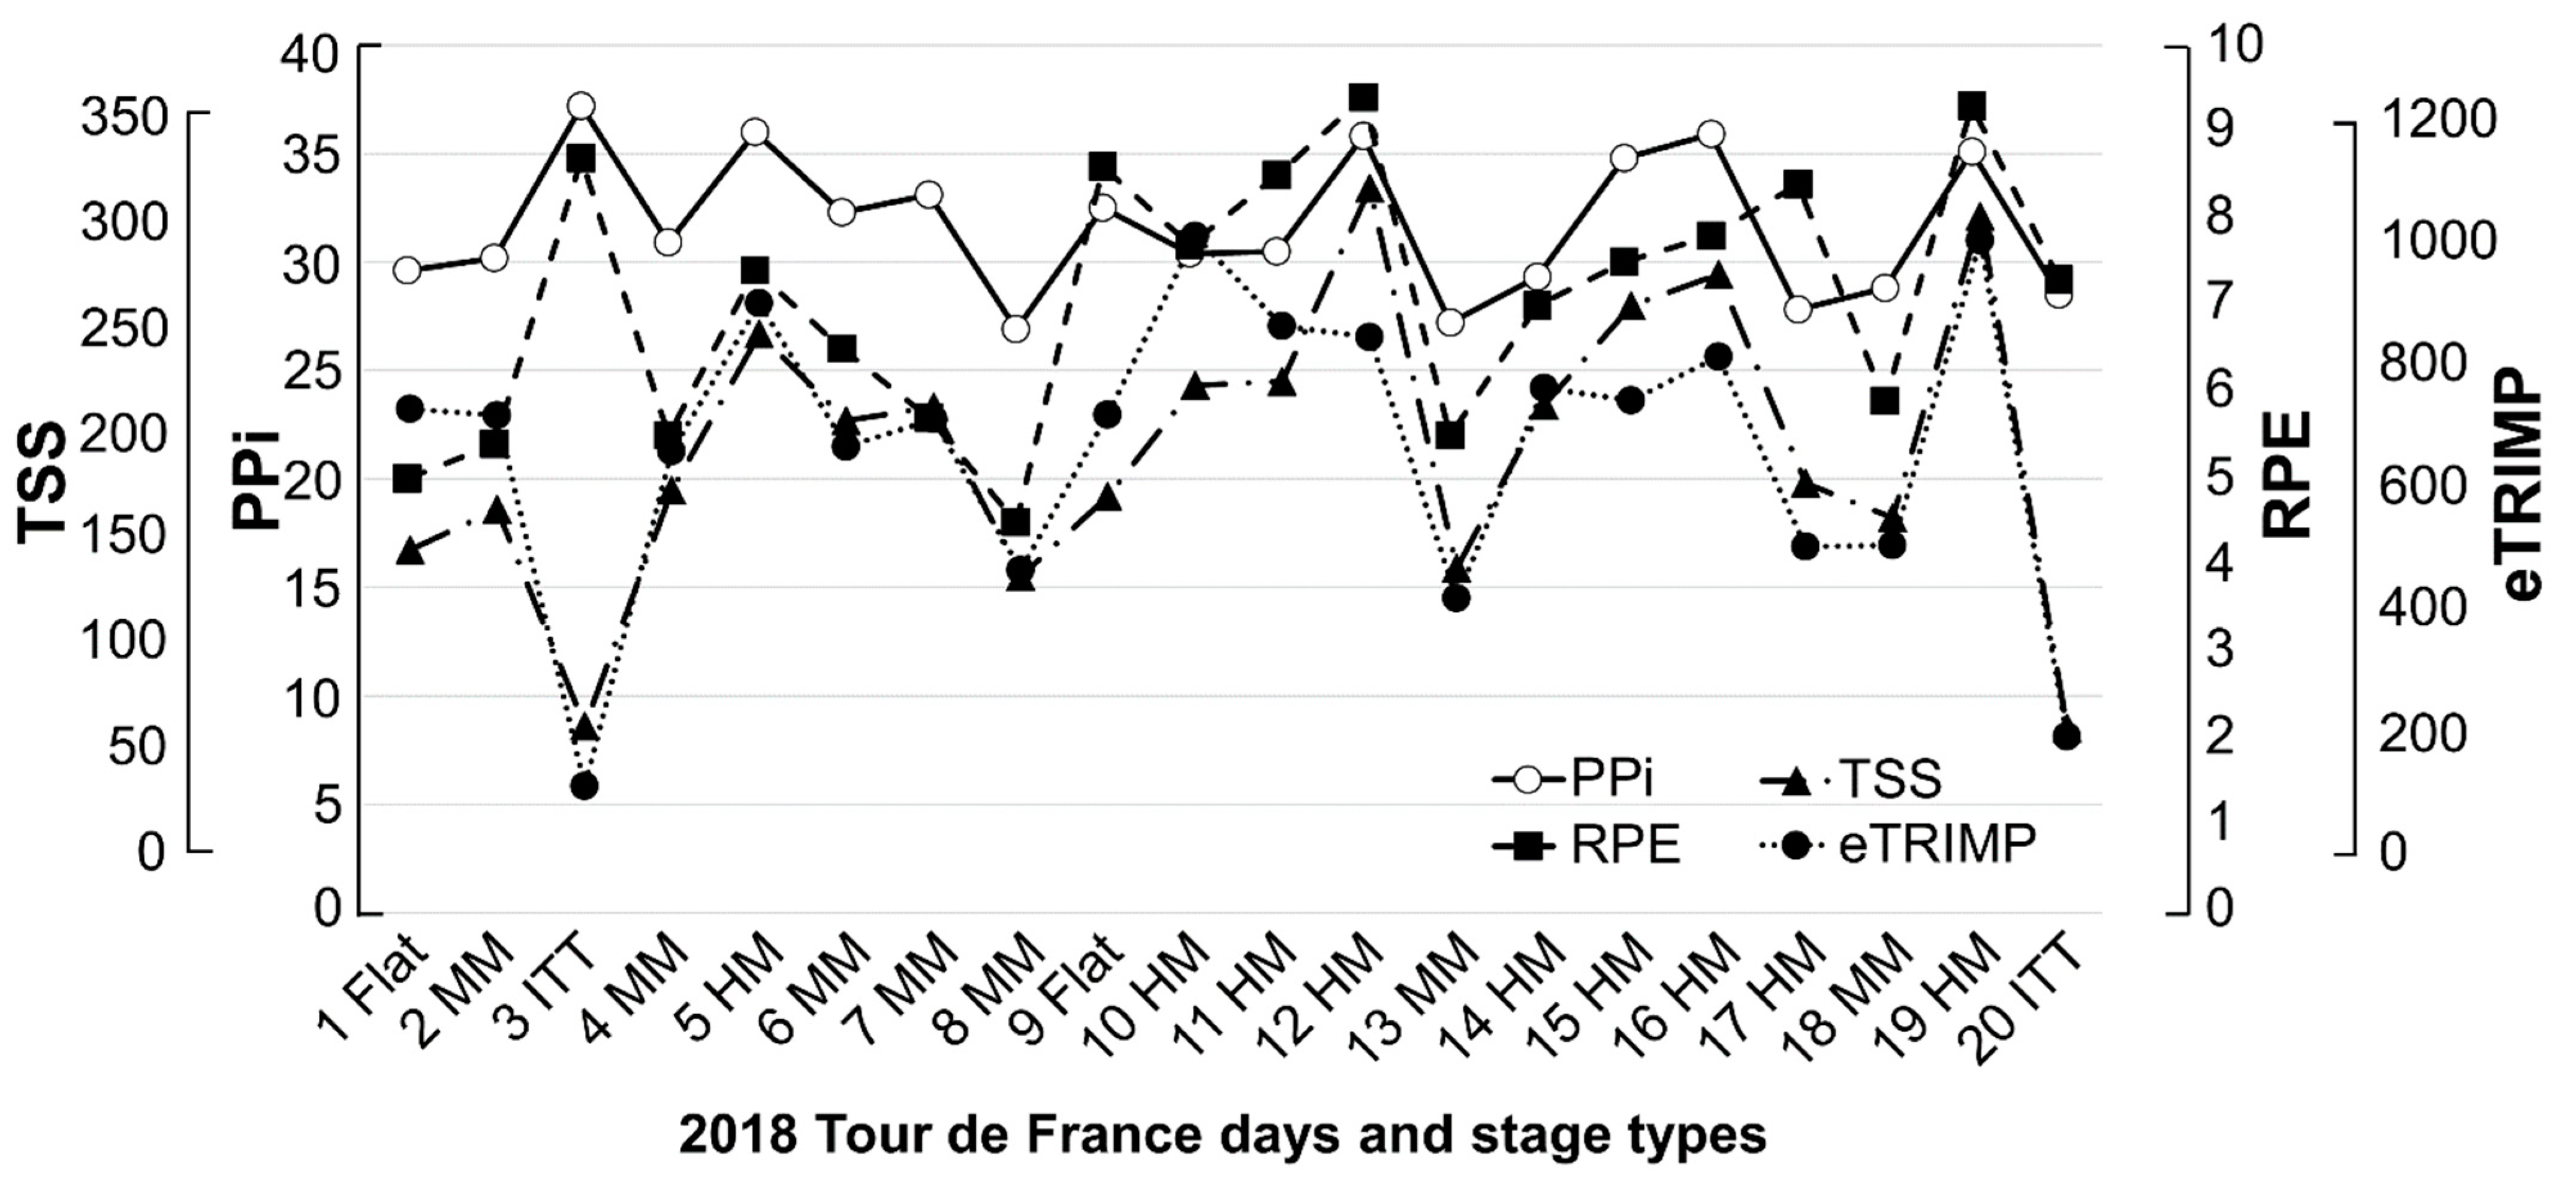
Descriptive analysis included means, standard deviations (SD) and range (minimum and maximum). Normal distribution was checked by the Shapiro–Wilk test. Associations between the perceived fatigue and PPi and between the different load quantification indices analyzed (eTRIMP, RPE, sRPE, TSS, and PPi) were examined by Pearson’s correlation coefficient. One-way ANOVA was used to assess the differences between the intensity quantification indexes and the Tour de France stage type. The coefficient of variation (CV) was calculated as the ratio of the SD to the mean, expressed as a percentage. Calculations were performed using JASP (version 0.14.1).

3. Results

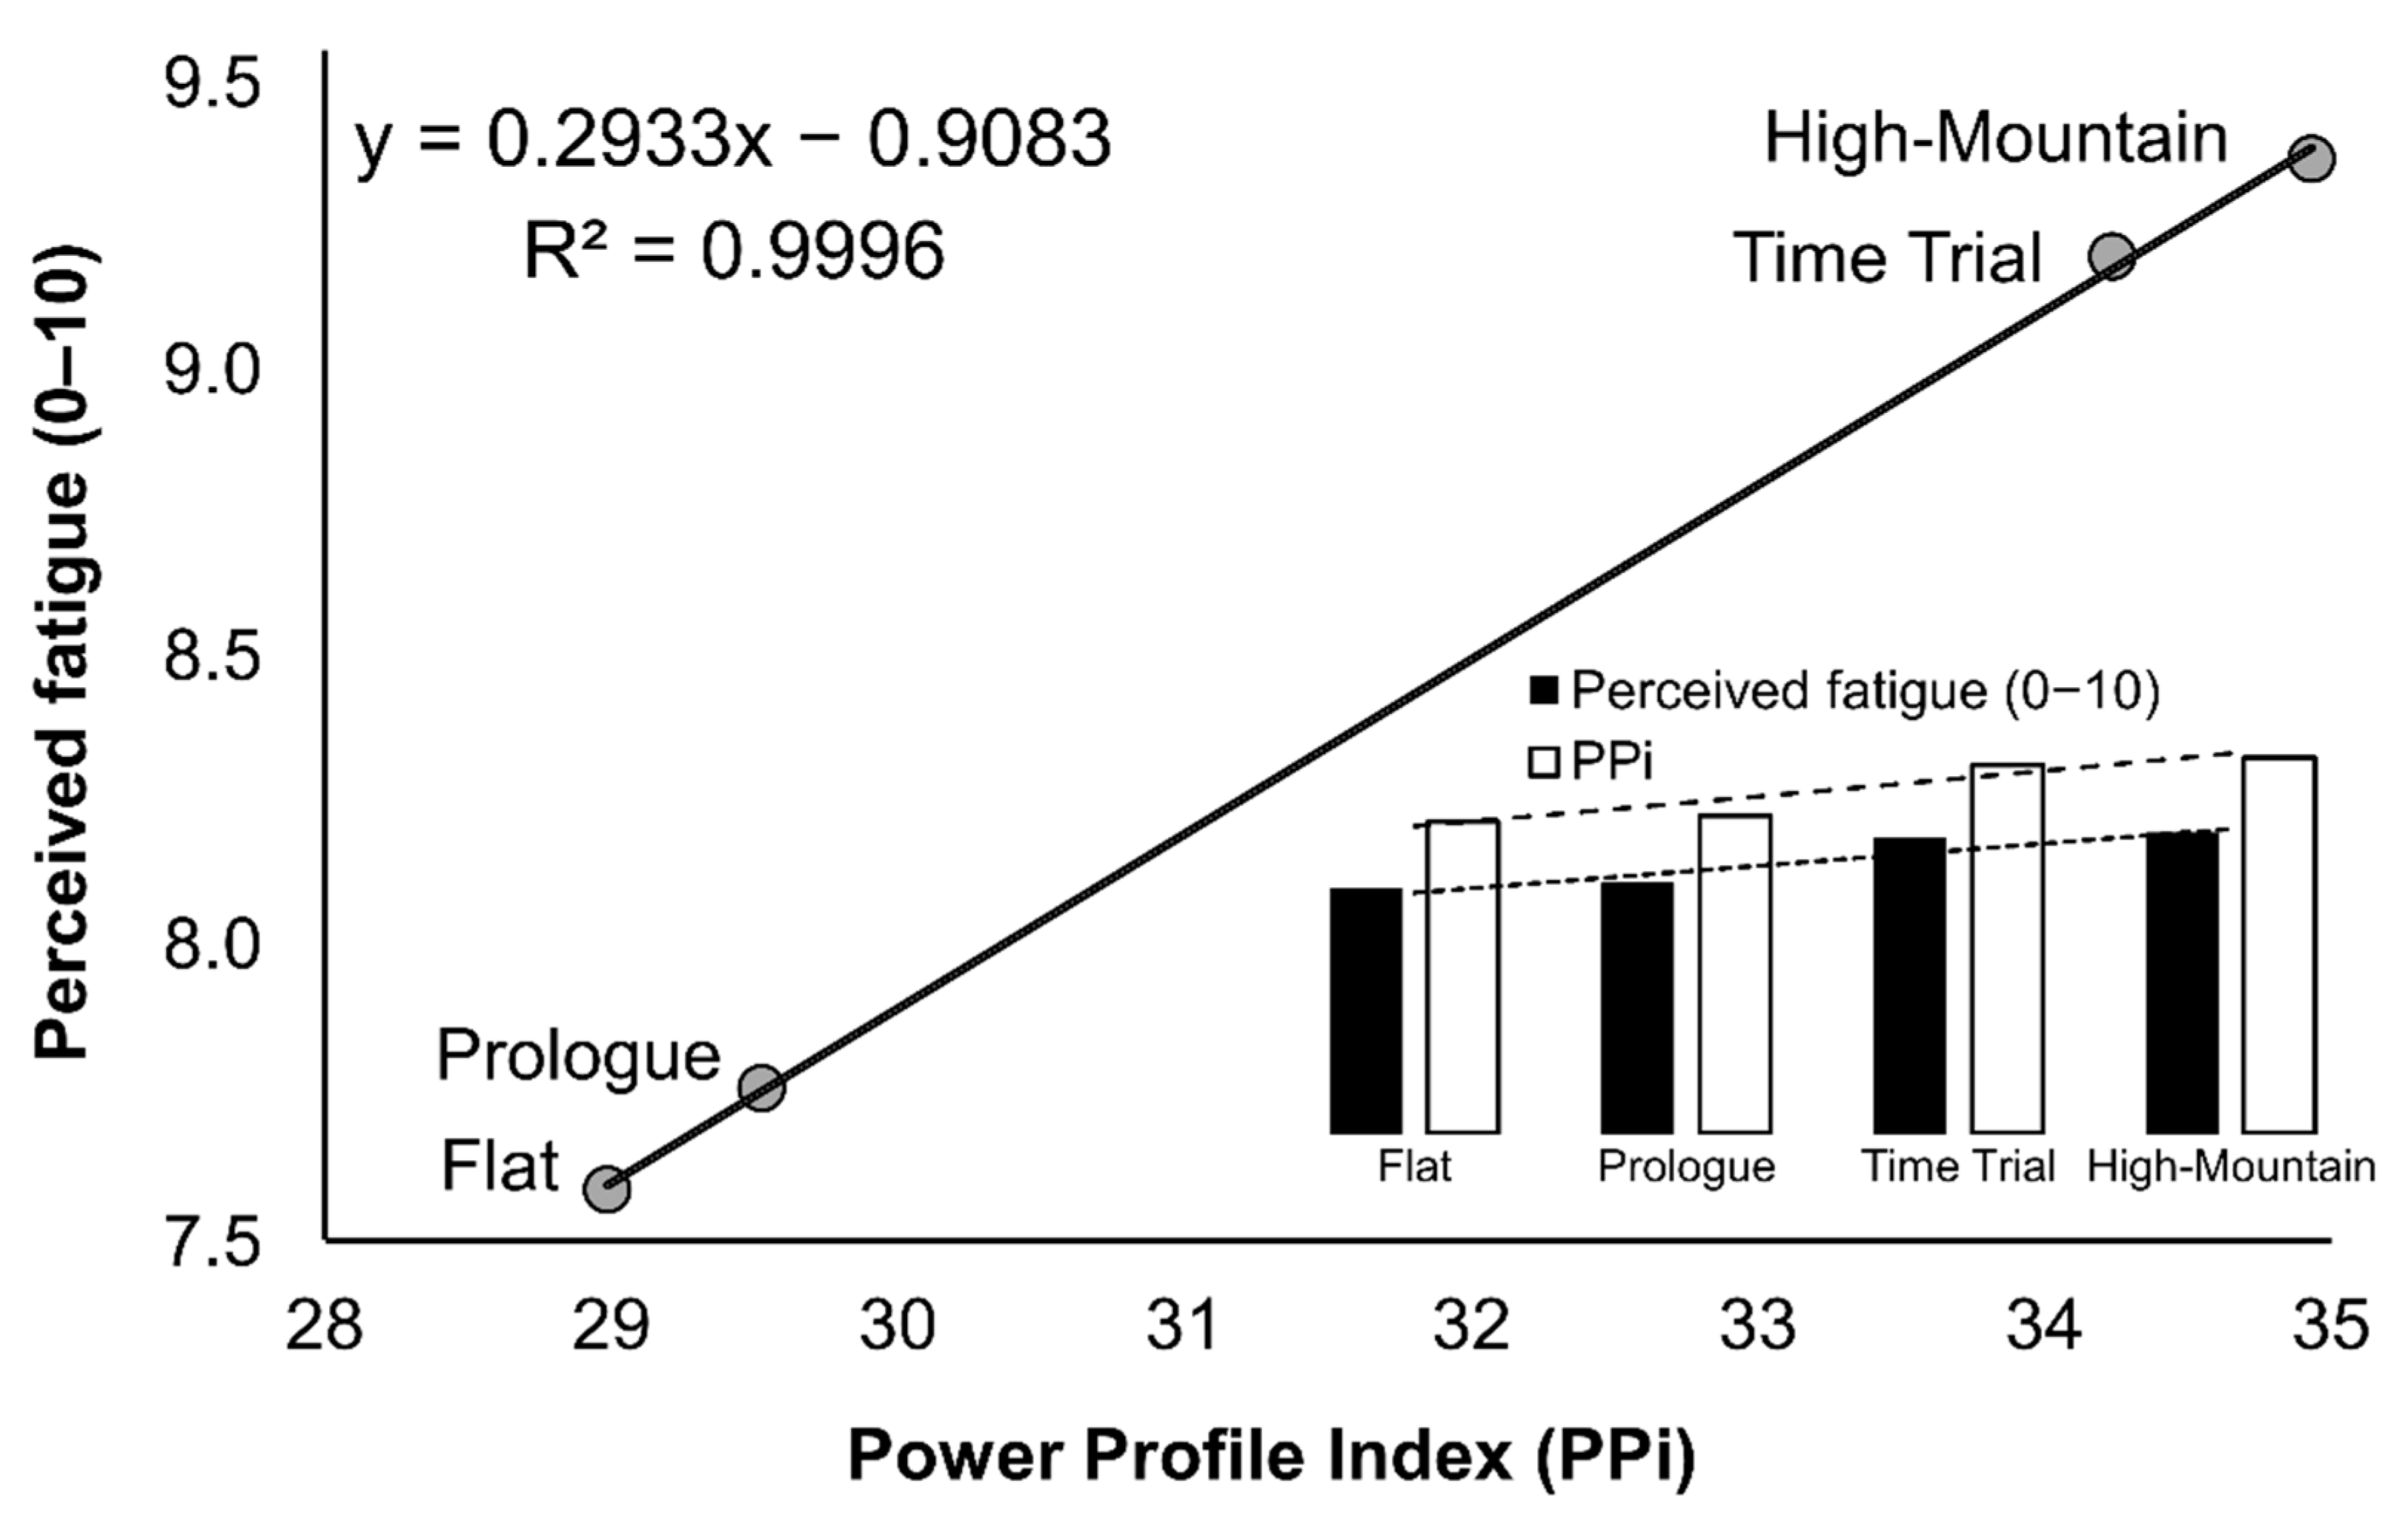
3.1. Experiment 1: PPi Weighting Factors

The mean PO and the resulting % d i f Z i from professional cyclists for the six exercise intensity zones, according to physiological events, are shown in Table 1, while % t Z i in each of the four stage types is shown in Table 2. Simulations of PPi using the population data yielded a weighting stage factor ( K ) of 3.9 for high-mountain, flat, and time trials, and 2.3 for prologues, for a strong correlation (R = 0.9998) (Figure 1).

3.2. Experiment 2: PPi Comparison against Other Indices

The average daily data from the 2018 Tour de France were 3.4 ± 0.8 W·kg−1, 3189 ± 115 kJ, 2202 ± 1395 m elevation, volume of 245 ± 83 min, and average HR of 139 ± 17 bpm. Different values of intensity scores (e.g., PPi, sRPE, TSS, eTRIMP, etc.) for each stage of competition, as well as their duration and stage type, are shown in Table 3. Overall daily average data for the indexes were: PPi = 31.6 ± 3.2 (range 26.9–37.3), RPE = 7.1 ± 1.5 (range of 4.6–9.4), TSS = 172.45 ± 24.55 (range of 57.43–314.71), and eTRIMP = 657.6 ± 239.8 (range of 102.4–1001.2). ANOVA revealed that for the load indices analyzed, the quantification of intensity differed by stage type (p < 0.001), except for PPi (Table 4). For this index, the load values were similar for all stage types (p = 0.292). Figure 2 displays the tracking of the resulting intensity quantification for PPi and the rest of indexes during the Tour de France. There was a significant correlation with a medium or low effect size of PPi with TSS, RPE, and sRPE, while there was no significance with eTRIMP (Table 5).

4. Discussion

This study proposed PPi, a new multifactorial method for quantifying cycling exercise load (i.e., intensity × volume) based on the individual power profile. This index is intended to overcome some of the limitations found in other load quantification indices currently in use, such as TRIMP or TSS. For example, TRIMP is not able to reflect short, very high intensity efforts due to the delayed HR response [13], while TSS does not sufficiently weight intensity to volume (e.g., a maximum effort in one hour, such as the UCI Hour Record, which causes great fatigue, is 100 TSS, while a light effort of 3 h at 60% of the FTP is 106 TSS).
The PPi has been designed as a new index capable of quantifying the high intensity efforts made by cyclists during a training session or competition, considering the time spent at a given PO and weighting the intensity according to power zones (Z1 to Z6) and the type of competition. The comparison against current methods suggested that PPi may be a more stable index to quantify cycling exercise load. This could help coaches in the process of load quantification and training planning by providing a more comprehensive view of high-intensity efforts.
To the best of our knowledge, this is the first index adjusted by stage type (prologue, time trial, flat, and high mountain) in an attempt to solve existing problems inherent in the current indexes in discriminating maximal efforts, regardless of the type of competition. In addition, because the PPi is based on a cyclist’s power profile, data can be automatically obtained in an individualized manner from real athlete performance and adjusted at a preferred time window. For this purpose, we provide an open-access chart in the specialized software WKO5 to easily calculate the PPi.

4.1. Based on Improvements

The PPi proposal was inspired by previous studies such as that by Pinot and Grape [60] who attempted to calculate, for the first time (to our knowledge), the intensity zones from the peak PO achieved by the cyclist for a given time of effort. Notwithstanding, PPi may represent a further step in the quantification of intensity from power outcomes by including training zones based on TTE. In addition, the PPi uses an exponential factor ( % d i f Z i ) to adjust and weight exercise intensity (power) against volume (time of effort), based on the well-known described exponential rise in blood lactate, which occurs when exercise intensity exceeds the lactate threshold [61,62,63].
Another contribution of PPi is its ability to weight intensity by stage type. This is important given that, according to our results, previously available indexes (e.g., TSS, eTRIMP, and sRPE) showed large variability when quantifying different stage types (Table 3). Certainly, these differences can be expected considering that the effort performed, and fatigue incurred will depend on the competition, training session [63], and the stage type, and are not merely related to the cyclists’ skills and thus, to their race performance profile (e.g., sprinters, climbers, and flat specialists) [64].
Regarding what Borresen and Lambert suggested about the need to measure markers that reflect how athletes adapt to training their global capacity [65], the main advantage of the PPi is that values will be self-adjustable to the cyclists’ PO, thus providing a more realistic picture of their fitness level and to the type of cyclist they are, according to their strengths and weaknesses in performance. This is an important point, since exercise intensity zones might be different according to the cyclist’s categories and their physical skills [60,64]. Accordingly, for validation purposes, factors based on data from professional cyclists were used first (Table 1).

4.2. Understanding the Differences Compared to Other Load Metrics

The large variability found between the different quantification indexes (Table 4 and Figure 2) could be explained by the items used in the respective equations. In this sense, as it is well known, RPE, sRPE, eTRIMP, or TSS have their strengths and also different weaknesses. While TRIMP, RPE, and TSS are able to identify differences in loading for different stage types, PPi is shown to be a more stable index. This could be interpreted negatively for PPi, as it would not be able to identify differences between stage types. However, we believe that this stability in its values is due to the higher weighting of high intensity with respect to volume, which is not the case for TRIMP, TSS, and sRPE. The differences between stages identified by the rest of the indices are mainly due to the duration of the effort. Hence, the flat stage (although the RPE for this stage is clearly lower than for the rest of the stages), obtains much higher score values via TRIMP, sRPE, and TSS compared to the time trials. In fact, the high intensity of a time trial causes fatigue comparable to mountain stages. While the other indices are not able to adequately quantify the workload of a time trial and its consequent fatigue, PPi is more consistent. These similarities between TRIMP, sRPE, and TSS can be seen in the strong correlation between the three indices (Table 5). In all three, a common element that may explain the strong correlation is the importance of volume in their calculation. On the other hand, the higher weighting of volume over intensity in the calculation of these three indices may explain the lack of statistical significance in the correlation between them and the RPE (Table 5), which is greater in high-intensity efforts such as time trials. In contrast, PPi shows a strong correlation with RPE, while it also moderately correlates with TSS and sRPE. This could be interpreted as a strength of the PPi and would be a consequence of integrating the RPE into its calculation, weighting high intensity efforts more heavily in relation to volume. The lack of a significant correlation between PPi and eTRIMP could be due to the difficulty of this index to identify short and high intensity efforts because of the HR delay [11], as well as the excessive weighting of volume in its calculation.
According to Passfield et al., using power-based metrics to quantify cycling intensity provides solid advantages compared to other methods (e.g., TRIMP). These include the possibility for mechanical power to be analyzed in depth from the data available at any time during training or competition, including the evaluation of the cyclists’ endurance capacity outside laboratory conditions [66]. Nevertheless, power-based metrics have associated limitations. These include the influence that some factors (e.g., drafting, team tactics, environmental conditions, or terrain types) may have on the fact that the highest PO recorded (in competition or training) may not be the maximum achievable by the cyclist [60]. Moreover, differences between subjects in their ability to attenuate fatigue-induced declines in mean maximal power (MMP) values, which is a key determinant for endurance performance [33], must be considered. Therefore, we cannot claim that the use of power to quantify workload is better than the HR or RPE methods. In fact, the ideal would be to integrate or consider all indices, including the HRV. This will provide an overview of the external and internal loading and the balance between fatigue and recovery. However, we do believe that PPi corrects some aspects existing in other indices, such as TSS or eTRIMP, although at no time do we claim that it is better than the rest, but just another index to consider. One of its advantages lies in combining elements of external load (power) and internal load (perceived fatigue). The strength of this approach is supported by the strong correlation between PPi and fatigue incurred in different stage types (Figure 1) as an independent subjective indicator of workload, as well as by the differences found with respect to the other quantification methods analyzed (i.e., eTRIMP and TSS). Based on the results shown, it could be concluded that TSS or eTRIMP do not adequately reflect the workload of a high intensity, short duration session, such as time trials or prologues. This can have a major impact on the quantification of workload, the fatigue produced, as well as the assimilation of training.

4.3. Limitations

As data were collected from professional cyclists, there may be some limitations to this study. Twenty MMP were recorded during competitions and accordingly, it is uncertain that these marks are the best possible in a specific test. Additionally, basing the calculation of HR zones on recorded HRmax, rather than the actual HR zones from individualized thresholds obtained in an incremental test, could have interfered with the actual values recorded for the eTRIMP. Unfortunately, it was not possible to schedule controlled laboratory tests due to the needs of the cycling teams.
Likewise, the same PO may entail a different effort or workload depending on the accumulated fatigue during training or competition (e.g., 10 min of FTP at the beginning of the stage or after 4 h). This difference arose from the individual characteristics of each cyclist to resist fatigue. However, we do not know how this could be taken into account to quantify the workload.
Finally, because the PPi proposal has been analyzed using professional cyclists, we cannot claim that the weighting factors of this index can be generalized to non-elite cyclists.

5. Conclusions

This study offers coaches and practitioners a robust methodology to quantify professional cyclists’ workloads in order to monitor the produced fatigue and possible adaptations during training or competitions. It is based on the constantly updated individual power profile, at different training zones (Z1 to Z6), and specifically considering the type of competition (i.e., prologue, time trial, flat, and high mountain).
Therefore, it will help both coaches and athletes to better understand the fatigue generated by a given training session or stage. This does not occur with the current indexes in some cases (for example, in time trials). Consequently, the proposed index will help to adjust successive training loads by being able to assess very intense efforts more accurately.

Author Contributions

Conceptualization, M.M.-M., J.R.L.-B. and M.Z.; methodology, M.M.-M., J.C.-I., J.R.L.-B. and M.Z.; investigation, G.d.M., X.M., D.B.-G. and J.A.S.-M.; formal analysis, J.C.-I. and M.M.-M.; data curation, M.M.-M., G.d.M., X.M., D.B.-G. and J.A.S.-M.; writing—original draft preparation, J.C.-I. and M.M.-M.; writing—review and editing, J.R.L.-B., G.d.M., X.M., D.B.-G., J.A.S.-M. and M.Z. All authors have read and agreed to the published version of the manuscript.

Funding

This research received no external funding.

Institutional Review Board Statement

The study was conducted in accordance with the Declaration of Helsinki and approved by the Institutional Review Board of the University of Granada (protocol code 1608/CEIH/2020, 10 July 2020).

Informed Consent Statement

Informed consent was obtained from all subjects involved in the study.

Data Availability Statement

Not applicable.

Conflicts of Interest

The authors declare no conflict of interest.

References

  1. Bourdon, P.C.; Cardinale, M.; Murray, A.; Gastin, P.; Kellmann, M.; Varley, M.C.; Gabbett, T.J.; Coutts, A.J.; Burgess, D.J.; Gregson, W.; et al. Monitoring Athlete Training Loads: Consensus Statement. Int. J. Sport. Physiol. Perform. 2017, 12, S2-161–S2-170. [Google Scholar] [CrossRef] [PubMed]
  2. Halson, S.L. Monitoring Training Load to Understand Fatigue in Athletes. Sport. Med. 2014, 44, 139–147. [Google Scholar] [CrossRef] [PubMed] [Green Version]
  3. Passfield, L.; Doust, J.H. Changes in Cycling Efficiency and Performance after Endurance Exercise. Med. Sci. Sport. Exerc. 2000, 32, 1935–1941. [Google Scholar] [CrossRef] [Green Version]
  4. Rodríguez-Rielves, V.; Lillo-Beviá, J.R.; Buendía-Romero, Á.; Martínez-Cava, A.; Hernández-Belmonte, A.; Courel-Ibáñez, J.; Pallarés, J.G. Are the Assioma Favero Power Meter Pedals a Reliable Tool for Monitoring Cycling Power Output? Sensors 2021, 21, 2789. [Google Scholar] [CrossRef]
  5. Rodríguez-Rielves, V.; Martínez-Cava, A.; Buendía-Romero, Á.; Lillo-Beviá, J.R.; Courel-Ibáñez, J.; Hernández-Belmonte, A.; Pallarés, J.G. Reproducibility of the Rotor 2INpower Crankset for Monitoring Cycling Power Output: A Comprehensive Analysis in Different Real-Context Situations. Int. J. Sport. Physiol. Perform. 2021, 17, 120–125. [Google Scholar] [CrossRef] [PubMed]
  6. Sanders, D.; Abt, G.; Hesselink, M.K.C.; Myers, T.; Akubat, I. Methods of Monitoring Training Load and Their Relationships to Changes in Fitness and Performance in Competitive Road Cyclists. Int. J. Sport. Physiol. Perform. 2017, 12, 668–675. [Google Scholar] [CrossRef] [PubMed] [Green Version]
  7. Lucía, A.; Hoyos, J.; Santalla, A.; Earnest, C.; Chicharro, J.L. Tour de France versus Vuelta a España: Which Is Harder? Med. Sci. Sport. Exerc. 2003, 35, 872–878. [Google Scholar] [CrossRef]
  8. Padilla, S.; Mujika, I.; Orbañanos, J.; Angulo, F. Exercise Intensity during Competition Time Trials in Professional Road Cycling. Med. Sci. Sport. Exerc. 2000, 32, 850–856. [Google Scholar] [CrossRef]
  9. Edwards, S. The Heart Rate Monitor Book; Feet Fleet Press: Sacramento, CA, USA, 1993; ISBN 978-0-9634633-0-2. [Google Scholar]
  10. Manzi, V.; Iellamo, F.; Impellizzeri, F.; D’ottavio, S.; Castagna, C. Relation between Individualized Training Impulses and Performance in Distance Runners. Med. Sci. Sport. Exerc. 2009, 41, 2090–2096. [Google Scholar] [CrossRef]
  11. Swart, J.; Lamberts, R.P.; Derman, W.; Lambert, M.I. Effects of High-Intensity Training by Heart Rate or Power in Well-Trained Cyclists. J. Strength Cond. Res. 2009, 23, 619–625. [Google Scholar] [CrossRef]
  12. Wallace, L.K.; Slattery, K.M.; Impellizzeri, F.M.; Coutts, A.J. Establishing the Criterion Validity and Reliability of Common Methods for Quantifying Training Load. J. Strength Cond. Res. 2014, 28, 2330–2337. [Google Scholar] [CrossRef] [PubMed]
  13. Foster, C.; Florhaug, J.A.; Franklin, J.; Gottschall, L.; Hrovatin, L.A.; Parker, S.; Doleshal, P.; Dodge, C. A New Approach to Monitoring Exercise Training. J. Strength Cond. Res. 2001, 15, 109–115. [Google Scholar]
  14. Lambert, M.I.; Mbambo, Z.H.; Gibson, A.S.C. Heart Rate during Training and Competition for Longdistance Running. J. Sport. Sci. 1998, 16, 85–90. [Google Scholar] [CrossRef] [PubMed]
  15. Lehmann, M.; Foster, C.; Dickhuth, H.-H.; Gastmann, U. Autonomic Imbalance Hypothesis and Overtraining Syndrome. Med. Sci. Sport. Exerc. 1998, 30, 1140–1145. [Google Scholar] [CrossRef] [PubMed]
  16. Lucía, A.; Díaz, B.; Hoyos, J.; Fernández, C.; Villa, G.; Bandrés, F.; Chicharro, J.L. Hormone Levels of World Class Cyclists during the Tour of Spain Stage Race. Br. J. Sport. Med. 2001, 35, 424–430. [Google Scholar] [CrossRef] [Green Version]
  17. Snyder, A.C.; Kuipers, H.; Cheng, B.; Servais, R.; Fransen, E. Overtraining Following Intensified Training with Normal Muscle Glycogen. Med. Sci. Sport. Exerc. 1995, 27, 1063–1070. [Google Scholar] [CrossRef]
  18. Uusitalo, A.L.; Uusitalo, A.J.; Rusko, H.K. Exhaustive Endurance Training for 6-9 Weeks Did Not Induce Changes in Intrinsic Heart Rate and Cardiac Autonomic Modulation in Female Athletes. Int. J. Sport. Med. 1998, 19, 532–540. [Google Scholar] [CrossRef]
  19. Wilmore, J.H.; Stanforth, P.R.; Gagnon, J.; Rice, T.; Mandel, S.; Leon, A.S.; Rao, D.C.; Skinner, J.S.; Bouchard, C. Heart Rate and Blood Pressure Changes with Endurance Training: The HERITAGE Family Study. Med. Sci. Sport. Exerc. 2001, 33, 107–116. [Google Scholar] [CrossRef]
  20. Wilmore, J.H.; Stanforth, P.R.; Gagnon, J.; Leon, A.S.; Rao, D.C.; Skinner, J.S.; Bouchard, C. Endurance Exercise Training Has a Minimal Effect on Resting Heart Rate: The HERITAGE Study. Med. Sci. Sport. Exerc. 1996, 28, 829–835. [Google Scholar] [CrossRef]
  21. Hedelin, R.; Kenttä, G.; Wiklund, U.; Bjerle, P.; Henriksson-Larsén, K. Short-Term Overtraining: Effects on Performance, Circulatory Responses, and Heart Rate Variability. Med. Sci. Sport. Exerc. 2000, 32, 1480–1484. [Google Scholar] [CrossRef]
  22. Skinner, J.S.; Gaskill, S.E.; Rankinen, T.; Leon, A.S.; Rao, D.C.; Wilmore, J.H.; Bouchard, C. Heart Rate versus %VO2max: Age, Sex, Race, Initial Fitness, and Training Response—HERITAGE. Med. Sci. Sport. Exerc. 2003, 35, 1908–1913. [Google Scholar] [CrossRef] [PubMed]
  23. Zavorsky, G.S. Evidence and Possible Mechanisms of Altered Maximum Heart Rate with Endurance Training and Tapering. Sport. Med. 2000, 29, 13–26. [Google Scholar] [CrossRef] [PubMed]
  24. Barrero, A.; Schnell, F.; Carrault, G.; Kervio, G.; Matelot, D.; Carré, F.; Lahaye, S.L.D. Daily Fatigue-Recovery Balance Monitoring with Heart Rate Variability in Well-Trained Female Cyclists on the Tour de France Circuit. PLoS ONE 2019, 14, e0213472. [Google Scholar] [CrossRef] [PubMed]
  25. Bellenger, C.R.; Fuller, J.T.; Thomson, R.L.; Davison, K.; Robertson, E.Y.; Buckley, J.D. Monitoring Athletic Training Status Through Autonomic Heart Rate Regulation: A Systematic Review and Meta-Analysis. Sport. Med. 2016, 46, 1461–1486. [Google Scholar] [CrossRef]
  26. Foster, C.; Daines, E.; Hector, L.; Snyder, A.C.; Welsh, R. Athletic Performance in Relation to Training Load. Wis. Med. J. 1996, 95, 370–374. [Google Scholar]
  27. Pinot, J.; Grappe, F. A Six-Year Monitoring Case Study of a Top-10 Cycling Grand Tour Finisher. J. Sport. Sci. 2015, 33, 907–914. [Google Scholar] [CrossRef]
  28. Scherr, J.; Wolfarth, B.; Christle, J.W.; Pressler, A.; Wagenpfeil, S.; Halle, M. Associations between Borg’s Rating of Perceived Exertion and Physiological Measures of Exercise Intensity. Eur. J. Appl. Physiol. 2013, 113, 147–155. [Google Scholar] [CrossRef]
  29. Robinson, D.M.; Robinson, S.M.; Hume, P.A.; Hopkins, W.G. Training Intensity of Elite Male Distance Runners. Med. Sci. Sport. Exerc. 1991, 23, 1078–1082. [Google Scholar] [CrossRef]
  30. Impellizzeri, F.M.; Marcora, S.M.; Coutts, A.J. Internal and External Training Load: 15 Years On. Int. J. Sport. Physiol. Perform. 2019, 14, 270–273. [Google Scholar] [CrossRef]
  31. West, S.W.; Clubb, J.; Torres-Ronda, L.; Howells, D.; Leng, E.; Vescovi, J.D.; Carmody, S.; Posthumus, M.; Dalen-Lorentsen, T.; Windt, J. More than a Metric: How Training Load Is Used in Elite Sport for Athlete Management. Int. J. Sport. Med. 2021, 42, 300–306. [Google Scholar] [CrossRef]
  32. Sanders, D.; Myers, T.; Akubat, I. Training-Intensity Distribution in Road Cyclists: Objective Versus Subjective Measures. Int. J. Sport. Physiol. Perform. 2017, 12, 1232–1237. [Google Scholar] [CrossRef] [PubMed] [Green Version]
  33. Mateo-March, M.; Valenzuela, P.L.; Muriel, X.; Gandia-Soriano, A.; Zabala, M.; Lucia, A.; Pallares, J.G.; Barranco-Gil, D. The Record Power Profile of Male Professional Cyclists: Fatigue Matters. Int. J. Sport. Physiol. Perform. 2022, 17, 926–931. [Google Scholar] [CrossRef] [PubMed]
  34. Allen, H.; Coggan, A. Training and Racing with a Power Meter, 2nd ed.; VeloPress: Boulder, CO, USA, 2012; ISBN 978-1-937716-15-8. [Google Scholar]
  35. Monod, H.; Scherrer, J. The Work Capacity of a Synergic Muscular Group. Ergonomics 1965, 8, 329–338. [Google Scholar] [CrossRef]
  36. Borszcz, F.K.; Tramontin, A.F.; Costa, V.P. Is the Functional Threshold Power Interchangeable with the Maximal Lactate Steady State in Trained Cyclists? Int. J. Sport. Physiol. Perform. 2019, 14, 1029–1035. [Google Scholar] [CrossRef]
  37. Pallarés, J.G.; Morán-Navarro, R.; Ortega, J.F.; Fernández-Elías, V.E.; Mora-Rodriguez, R. Validity and Reliability of Ventilatory and Blood Lactate Thresholds in Well-Trained Cyclists. PLoS ONE 2016, 11, e0163389. [Google Scholar] [CrossRef] [Green Version]
  38. Pallarés, J.G.; Lillo-Bevia, J.R.; Morán-Navarro, R.; Cerezuela-Espejo, V.; Mora-Rodriguez, R. Time to Exhaustion during Cycling Is Not Well Predicted by Critical Power Calculations. Appl. Physiol. Nutr. Metab. 2020, 45, 753–760. [Google Scholar] [CrossRef]
  39. Guio de Prada, V.; Ortega, J.F.; Ramirez-Jimenez, M.; Morales-Palomo, F.; Pallares, J.G.; Mora-Rodriguez, R. Training Intensity Relative to Ventilatory Thresholds Determines Cardiorespiratory Fitness Improvements in Sedentary Adults with Obesity. Eur. J. Sport. Sci. 2019, 19, 549–556. [Google Scholar] [CrossRef]
  40. Gaskill, S.E.; Walker, A.J.; Serfass, R.A.; Bouchard, C.; Gagnon, J.; Rao, D.C.; Skinner, J.S.; Wilmore, J.H.; Leon, A.S. Changes in Ventilatory Threshold with Exercise Training in a Sedentary Population: The Heritage Family Study. Int. J. Sport. Med. 2001, 22, 586–592. [Google Scholar] [CrossRef]
  41. Lillo-Beviá, J.R.; Courel-Ibáñez, J.; Cerezuela-Espejo, V.; Morán-Navarro, R.; Martínez-Cava, A.; Pallarés, J.G. Is the Functional Threshold Power a Valid Metric to Estimate the Maximal Lactate Steady State in Cyclists? J. Strength Cond. Res. 2022, 36, 167–173. [Google Scholar] [CrossRef]
  42. Laursen, P.B.; Shing, C.M.; Jenkins, D.G. Reproducibility of the Cycling Time to Exhaustion at in Highly Trained Cyclists. Can. J. Appl. Physiol. 2003, 28, 605–615. [Google Scholar] [CrossRef] [Green Version]
  43. Billat, V.; Faina, M.; Sardella, F.; Marini, C.; Fanton, F.; Lupo, S.; Faccini, P.; de Angelis, M.; Koralsztein, J.P.; Dalmonte, A. A Comparison of Time to Exhaustion at VO2 Max in Élite Cyclists, Kayak Paddlers, Swimmers and Runners. Ergonomics 1996, 39, 267–277. [Google Scholar] [CrossRef] [PubMed]
  44. Coyle, E.F.; Coggan, A.R.; Hemmert, M.K.; Ivy, J.L. Muscle Glycogen Utilization during Prolonged Strenuous Exercise When Fed Carbohydrate. J. Appl. Physiol. 1986, 61, 165–172. [Google Scholar] [CrossRef] [PubMed]
  45. Moral-González, S.; González-Sánchez, J.; Valenzuela, P.L.; García-Merino, S.; Barbado, C.; Lucia, A.; Foster, C.; Barranco-Gil, D. Time to Exhaustion at the Respiratory Compensation Point in Recreational Cyclists. Int. J. Environ. Res. Public Health 2020, 17, 6352. [Google Scholar] [CrossRef] [PubMed]
  46. Baron, B.; Noakes, T.D.; Dekerle, J.; Moullan, F.; Robin, S.; Matran, R.; Pelayo, P. Why Does Exercise Terminate at the Maximal Lactate Steady State Intensity? Br. J. Sport. Med. 2008, 42, 828–833. [Google Scholar] [CrossRef]
  47. Grossl, T.; de Lucas, R.D.; de Souza, K.M.; Guglielmo, L.G.A. Time to Exhaustion at Intermittent Maximal Lactate Steady State Is Longer than Continuous Cycling Exercise. Appl. Physiol. Nutr. Metab. 2012, 37, 1047–1053. [Google Scholar] [CrossRef]
  48. Cejuela, R.; Esteve-Lanao, J. Training Load Quantification in Triathlon. J. Hum. Sport Exerc. 2011, 6, 218–232. [Google Scholar] [CrossRef] [Green Version]
  49. Sitko, S.; Cirer-Sastre, R.; Corbi, F.; López-Laval, I. Five-Minute Power-Based Test to Predict Maximal Oxygen Consumption in Road Cycling. Int. J. Sport. Physiol. Perform. 2022, 17, 9–15. [Google Scholar] [CrossRef]
  50. Maier, T.; Schmid, L.; Müller, B.; Steiner, T.; Wehrlin, J.P. Accuracy of Cycling Power Meters against a Mathematical Model of Treadmill Cycling. Int. J. Sport. Med. 2017, 38, 456–461. [Google Scholar] [CrossRef] [Green Version]
  51. Borg, G. Psychophysical Scaling with Applications in Physical Work and the Perception of Exertion. Scand. J. Work Environ. Health 1990, 16, 55–58. [Google Scholar] [CrossRef]
  52. Borg, G.; Hassmén, P.; Lagerström, M. Perceived Exertion Related to Heart Rate and Blood Lactate during Arm and Leg Exercise. Eur. J. Appl. Physiol. Occup. Physiol. 1987, 56, 679–685. [Google Scholar] [CrossRef]
  53. Laursen, P.B.; Rhodes, E.C.; Langill, R.H.; McKenzie, D.C.; Taunton, J.E. Relationship of Exercise Test Variables to Cycling Performance in an Ironman Triathlon. Eur. J. Appl. Physiol. 2002, 87, 433–440. [Google Scholar] [CrossRef] [PubMed]
  54. Faude, O.; Hecksteden, A.; Hammes, D.; Schumacher, F.; Besenius, E.; Sperlich, B.; Meyer, T. Reliability of Time-to-Exhaustion and Selected Psycho-Physiological Variables during Constant-Load Cycling at the Maximal Lactate Steady-State. Appl. Physiol. Nutr. Metab. 2017, 42, 142–147. [Google Scholar] [CrossRef] [PubMed]
  55. Bergstrom, H.C.; Housh, T.J.; Zuniga, J.M.; Traylor, D.A.; Lewis, R.W.J.; Camic, C.L.; Schmidt, R.J.; Johnson, G.O. Differences Among Estimates of Critical Power and Anaerobic Work Capacity Derived from Five Mathematical Models and the Three-Minute All-Out Test. J. Strength Cond. Res. 2014, 28, 592–600. [Google Scholar] [CrossRef] [PubMed]
  56. Valenzuela, P.L.; Alejo, L.B.; Montalvo-Pérez, A.; Gil-Cabrera, J.; Talavera, E.; Lucia, A.; Barranco-Gil, D. Relationship Between Critical Power and Different Lactate Threshold Markers in Recreational Cyclists. Front. Physiol. 2021, 12, 676484. [Google Scholar] [CrossRef] [PubMed]
  57. Pallarés, J.G.; Morán-Navarro, R. Methodological Approach to the Cardiorespiratory Endurance Training. J. Sport Health Res. 2012, 4, 119–136. [Google Scholar]
  58. Green, S. Measurement of Anaerobic Work Capacities in Humans. Sport. Med. 1995, 19, 32–42. [Google Scholar] [CrossRef]
  59. Sanders, D.; van Erp, T. The Physical Demands and Power Profile of Professional Men’s Cycling Races: An Updated Review. Int. J. Sport. Physiol. Perform. 2021, 16, 3–12. [Google Scholar] [CrossRef]
  60. Pinot, J.; Grappe, F. The Record Power Profile to Assess Performance in Elite Cyclists. Int. J. Sport. Med. 2011, 32, 839–844. [Google Scholar] [CrossRef]
  61. Seiler, S. What Is Best Practice for Training Intensity and Duration Distribution in Endurance Athletes? Int. J. Sport. Physiol. Perform. 2010, 5, 276–291. [Google Scholar] [CrossRef]
  62. Seiler, S.; Tønnessen, E. Intervals, Thresholds, and Long Slow Distance: The Role of Intensity and Duration 368 in Endurance Training. Sportscience 2009, 13, 32–53. [Google Scholar]
  63. van Erp, T.; Hoozemans, M.; Foster, C.; de Koning, J.J. The Influence of Exercise Intensity on the Association Between Kilojoules Spent and Various Training Loads in Professional Cycling. Int. J. Sport. Physiol. Perform. 2019, 14, 1395–1400. [Google Scholar] [CrossRef] [PubMed]
  64. Sallet, P.; Mathieu, R.; Fenech, G.; Baverel, G. Physiological Differences of Elite and Professional Road Cyclists Related to Competition Level and Rider Specialization. J. Sport. Med. Phys. Fit. 2006, 46, 361–365. [Google Scholar]
  65. Borresen, J.; Lambert, M.I. The Quantification of Training Load, the Training Response and the Effect on Performance. Sport. Med. 2009, 39, 779–795. [Google Scholar] [CrossRef]
  66. Passfield, L.; Hopker, J.G.; Jobson, S.; Friel, D.; Zabala, M. Knowledge Is Power: Issues of Measuring Training and Performance in Cycling. J. Sport. Sci. 2017, 35, 1426–1434. [Google Scholar] [CrossRef] [PubMed]
Figure 1. Correlation analysis between perceived fatigue measured with a 0–10 Likert Scale and the Power Profile Index (PPi) for each of the four stage types when applying the weighting stage factor ( K ) of 3.9 for high-mountain, flat, and time trials, and 2.3 for prologues. Perceived fatigue data obtained retrospectively from 102 professional cyclists, and PPi computed from 67 WorldTour cyclists.
Applsci 12 11020 g001
Figure 2. Comparison of the Power Profile Index against current intensity quantification methods. Data from 2018 Tour de France. TSS, training stress score; PPi, power profile index; RPE, rate of perceive exertion; eTRIMP, Edward’s training impulse; MM, medium mountain; HM, high mountain; ITT, individual time trial.
Applsci 12 11020 g002
Table 1. Mean power outputs for different exercise durations, showing the power intensity zones and the calculation of the differential factor of each zone with respect to the previous one. Average data from 67 WorldTour cyclists.
ZONE 6ZONE 5ZONE 4ZONE 3ZONE 2ZONE 1
Time of Effort1 s5 s30 s1 min2 min5 min10 min20 min30 min60 min120 min180 min240 min
Power (W·kg−1)20.3517.8112.279.898.287.236.606.115.805.304.714.474.28
% Power100.0087.5460.2848.6140.7035.5232.4230.0328.5226.0523.1621.9521.05
% Power Lost0.0012.4627.2511.677.915.183.102.391.512.462.891.210.90
%difZi19.8619.466.552.741.991.67
Table 2. Average percentage time spent at a given zone ( % t Z i ) in each of the four stage types. Data from professional WorldTour cyclists.
Power Intensity ZonesFlat (n = 63)HM (n = 56)TT (n = 49)Prologue (n = 43)
Zone 145.1270.339.4211.64
Zone 28.125.592.871.36
Zone 326.0311.4229.576.84
Zone 47.424.6829.4723.82
Zone 58.514.4422.2238.55
Zone 62.963.264.4015.42
IGNORE (add to Zone 1)0.040.060.000.10
Data are percentages (%). HM, high mountain; TT, time trial.
Table 3. Quantification load during 2018 Tour de France (n = 8).
Stage TypePPiRPEsRPEPavg (W)Pavg
(W·kg−1)
Energy
(kJ)
Energy
(kJ·km−1)
TSSNP
(W)
IFHRavg
(bpm)
eTRIMPElevation
(m)
Volume
(min)
Day 1Flat29.655.081341.71184.862.722921.131.04142.25228.880.57132.8719616.25264.51
Day 2MM30.255.431341.88192.312.832851.131.02161.63251.750.62134.8708.441403.88247.47
Day 3ITT37.298.71361.93343.795.1848.880.358.5370.630.92179.5102.41307.7541.26
Day 4MM30.915.571488.61194.252.8631101.11170.63248.50.62125.2649.781236267.25
Day 5M36.017.432172.58217.983.243819.131.37245.38283.880.71137.25892.052729.63292.9
Day 6MM32.316.571705.01215.123.183257.751.16204.13280.380.7131.75657.141988.63258.61
Day 7MM33.195.791975.3168.082.483435.631.23210.75243.130.61118.6702.262270.63341.9
Day 8MM26.914.571212.73162.572.423320.84129.63226.630.56112.5454.81300.88265.28
Day 9Flat32.598.671738.58235.33.462839.860.86168.142860.7157.75709.43729.43201.52
Rest day 1
Day 10M30.437.752200.07236.033.53604.431.09220.86291.140.72148.751001.233656281.09
Day 11M30.538.51958.66272.634.0537301.13222.863110.771548543696.29227.72
Day 12M35.879.423183.43261.473.8752501.59314.71304.710.75145.33836.364871.57336.14
Day 13MM27.235.581262.78176.892.612398.860.73133.86241.570.6117409.951095.14226.26
Day 14M29.3172076.53208.953.133687.171.12211.17263.170.66128.4752.842948.43297.62
Day 15M34.857.582085.55244.523.584041.141.23258.86304.860.75137.2732.572801.29276.23
Rest day 2
Day 16M35.957.832311.17250.083.684413.141.33273.71302.140.74141.8804.183001.29297.44
Day 17M27.828.421331.27303.324.512715.430.82174.14338.710.83159.6493.662931.29155.24
Day 18MM28.885.921351.87204.23.012774.140.84157.86262.430.64124.6495.521273.86228.16
Day 19M35.159.33283.24253.133.774903.571.49301.433030.75144.6994.264645.86348.87
Day 20ITT28.537.33332.48331.034.91844.140.2657.43362.860.89156.5183.56537.5746.51
Day 21 Fainal day Paris, loss data
PPi, Power Profile Index; RPE, Rate of Perceive Exertion; sRPE, Session-RPE; Pavg, Average power; TSS, Training Stress Score; NP, Normalized Power; IF, Intensity Factor; HRavg, Average Heart Rate; eTRIMP, Edward’s Training Impulse; MM, Medium Mountain; ITT: Individual Time Trial; M, Mountain.
Table 4. Differences in the intensity quantification indexes regarding the stage type during the 2018 Tour de France.
Time TrialFlatMedium MountainHigh Mountainp
PPi32.9 ± 6.2
(18.8%)
29.9 ± 2.3
(7.7%)
32.5 ± 3.4
(10.5%)
32.9 ± 3.3
(10.0%)
0.292
RPE8.0 ± 1.0
(12.5%)
5.8 ± 1.2
(20.7%)
7.0 ± 0.5
(7.1%)
8.4 ± 0.8
(9.5%)
<0.001
TSS58.0 ± 0.8
(1.4%)
159.3 ± 25.8
(16.2%)
220.2 ± 22.0
(10.0%)
252.3 ± 49.6
(19.7%)
<0.001
eTRIMP143.0 ± 57.3
(40.1%)
606.1 ± 130.2
(21.5%)
767.3 ± 118.1
(15.4%)
816.6 ± 172.7
(21.1%)
<0.001
Data are presented as Mean ± SD, with CV in parentheses. PPi, power profile index; RPE, rate of perceived exertion; TSS, training stress score; eTRIMP, Edward’s training impulse.
Table 5. Values of Pearson correlation between PPi, eTRIMP, TSS, RPE, and sRPE.
PPieTRIMPTSSRPE
PPi
eTRIMP0.294
TSS0.494 *0.863 ***
RPE0.582 **0.2300.421
sRPE0.456 *0.874 ***0.969 ***0.430
PPi, power profile index; eTRIMP, Edward’s training impulse; TSS, training stress score; RPE, rate of perceived exertion; sRPE, session-RPE. * p < 0.05; ** p < 0.01; *** p < 0.001.
Publisher’s Note: MDPI stays neutral with regard to jurisdictional claims in published maps and institutional affiliations.

