Article

Analysis of Surface Profile Error of Ultra-Precision Diamond Planing Based on Power Spectral Density

1
State Key Laboratory of Precision Electronic Manufacturing Technology and Equipment, Guangdong University of Technology, Guangzhou 510006, China
2
Guangdong Provincial Key Laboratory for Micro-Nano Manufacturing Technology and Equipment, School of Electro-Mechanical Engineering, Guangdong University of Technology, Guangzhou 510006, China
*
Author to whom correspondence should be addressed.
Appl. Sci. 2022, 12(21), 11022; https://doi.org/10.3390/app122111022
Submission received: 6 October 2022 / Revised: 24 October 2022 / Accepted: 25 October 2022 / Published: 31 October 2022

Abstract

:
Vibration in ultra-precision machining is an inherent physical phenomenon and a key factor affecting surface generation. However, the influence of the vibration characteristics of aerostatic guideways on the machining morphology has not been fully studied. In this article, a diamond micro-planing experiment was carried out on an oxygen-free copper workpiece using a homemade three-axis machine tool, and a white-light interferometer was used to measure the surface topography of the planing surface. The power spectral density of the surface topography was analyzed, and the spatial wavelength components of the surface topography were extracted. Then, the vibration characteristics of the aerostatic guideway were measured in both the space domain and the time domain. A comprehensive analysis of the main components of the workpiece surface error morphology and the vibration characteristics of the guideway shows that the time-domain vibration of the aerostatic guideway is the main factor causing the surface topography error of the workpiece.

1. Introduction

Ultra-precision planing is a critical ultra-precision machining method. Compared with ultra-precision milling, it has some advantages in machining linear structures [1]. Christian Brecher et al. [2] developed an ultra-precision hydrostatic guideway with a large stroke and high dynamic stiffness for machining optical linear structures. A six-axis computer-aided machining system developed by Y. Takeuchi et al. [3] can be used to machine linear or curvilinear microgrooves or certain devices with optical properties. At the same time, due to the low material removal speed in the planing process, the processing efficiency is low, and the processing time is relatively long, which puts forward higher requirements for the stability of the machine tool.
During the machining process of the machine tool, vibrations between the tool tip and the workpiece are unavoidable. Vibrations with different frequencies will form corresponding texture features on the workpiece surface and affect the workpiece surface quality. Cheung, C. F. et al. [4] used the power spectral density method to analyze the influence of the feed rate, tool geometry, spindle runout, and vibration between the tool and the workpiece on a diamond turning surface, and their research results showed that the vibration between the tool and workpiece had an important influence on the surface roughness of the optical element.
Luo, X. et al. [5] analyzed an ultra-precision diamond turning surface with the power spectral density method and studied the influence of factors such as the feed rate, built-up edge, regeneration vibration, and spindle runout on the surface morphology. Kim, D. S. et al. [6] identified the vibration frequency information of the tool during machining by performing a spectrum analysis on the measured data of the workpiece surface. At the same time, some scholars have carried out related research on the micro-vibrations of aerostatic components. T. Kawai et al. [7] found that laminarization effectively improved surface quality in ultra-precision micromachining. The nano-scale micro-vibration of the bearing was suppressed. Tomotaka Yoshimura [8] clarified the mechanism of nano-waves in surface-compensation aerostatic thrust bearings. Nano-waves are pressure fluctuations caused by turbulent flow at the outlet, and the amount of fluctuation depends on the Reynolds number, that is, the air-flow rate. However, it does not explain how the flow turbulence at the outlet leads to the stability of the flow in the air-film gap. K.J. Stout [9] proposed that in order to obtain nanometer-level precision, the machine tool needs to further reduce the air-film gap. Therefore, higher requirements for the inlet pressure, restrictor structure selection, manufacturing accuracy, and air source filtration have been put forward. Yujie Zhou [10] used a hybrid numerical simulation method to divide the flow field into two parts: the inner region and the outer region near the choke; the hybrid solution method can accurately capture the complex flow regime near the throttle while considering its efficiency. Yifei Li [11] conducted a numerical study on the flow field in the air film of a circular flat-plate aerostatic bearing with a single-hole restrictor. The formation process of reaching the sonic speed region and the shock wave was studied, and the mechanism of vortex generation was revealed. On the basis of flow analysis, the maximum Mach number was taken as the constraint condition of the bearing dynamic stability benchmark, and the transient flow calculation verified its rationality through optimization modeling.
Aoyama et al. [12] studied the micro-amplitude vibration characteristics of the small-hole throttle aerostatic guideway. Through numerical simulations, the turbulent energy at the exit of the orifice with two different small-hole structures was compared and verified by experiments. Chen et al. [13] proposed a small-hole throttling aerostatic bearing structure with butterfly spring compensation for several problems existing in the aerostatic guideway in the PCB drilling machine tool. Aoyama et al. [14] studied the transient characteristics of small-hole throttle aerostatic bearings passing through rectangular grooves and proposed a cross-groove bearing surface structure to suppress the transient pressure drop when passing through the grooves. Zhu et al. [15] used the compressible turbulent large-eddy model to simulate the flow field of the pinhole throttling aerostatic bearing, which explained the relationship between the bearing’s micro-vibration and the change in the micro-flow field to a certain extent. Zhang et al. [16] established a five-degree-of-freedom dynamic model of the aerostatic spindle and studied the spindle vibration under the action of the cutting force and its influence on the generation of ultra-precision diamond turning surfaces.
In summary, there are relatively few studies on the relationship between aerostatic guideways and machining topography errors. In this study, a diamond micro-planing experiment was carried out on a self-developed three-axis machine tool. The BRUKER white-light interferometer was used to measure the surface of the workpiece, and the spatial power spectral density distribution of the surface error was analyzed. Combined with the space and time domain errors in the vertical direction of the machine tool, the contour error was analyzed and identified. We found that the low-frequency vibration characteristic of the vacuum-preloaded aerostatic bearing is the main factor that causes planing surface contour errors.

2. Dynamic Characteristics Analysis and Vibration Characteristics of Machine Tool in the Vertical Direction

The three-axis machine tool includes three linear axes in total, including the X-axis and Y-axis, which move horizontally, and the Z-axis, which moves vertically. The three linear axes all are porous aerostatic guideways. The basic arrangement of the X-axis and Y-axis is shown in Figure 1. The bottom pad of the X-axis is a single block vacuum-preloaded (VPL) porous aerostatic bearing; its bearing surface is directly supported on a precision marble plane, and two symmetrically arranged porous aerostatic bearings support the bottom surface of the Y-axis. The pressure bearing is on the same precision marble plane. The left and right bearings of the X-axis are preloaded with each other. Linear motors drive both the X-axis and the Y-axis, and there are no other intermediate force transmission links.
The aerostatic guideway moves under the suspension support of the high-pressure air film, and the bottom VPL porous aerostatic bearing only supports the X-axis slide in the vertical direction. Now, the X-axis slide is considered a rigid body, and the dynamic characteristics of the slide in the vertical direction can be studied. In order to facilitate the analysis and calculation, the vertical dynamic model of the X-axis slide was simplified to a two-degree-of-freedom system composed of rigid rods, springs, and dampers, as shown in Figure 2. Then, the kinetic equation matrix can be expressed as:
[ m 0 0 I ] [ x ¨ c θ ¨ c ] + [ c A + c B c B l B c c A l A c c B l B c c A l A c c B l B c 2 + c A l A c 2 ] [ x ˙ c θ ˙ c ] + [ k A + k B k B l B c k A l A c k B l B c k A l A c k B l B c 2 + k A l A c 2 ] [ x c θ c ] = [ F c M c ]
In the figure, A and B are points A and B of the simplified porous aerostatic bearing back force point; C is the center of mass of the slide; kA and cA are the equivalent stiffness and damping of the porous aerostatic bearing at point A; kB and cB are the equivalent stiffness and damping of the porous aerostatic bearing at point B; Fc and Mc are the interference force and the interference moment reduced to the center of mass; and xc and θc are the vibration displacement and rotation angle of the slide at the cutting point.
Since the damping of the air film was small, and the processing method used in this study was one-way planing processing, the dynamic equation was approximated and simplified. The kinetic model can be simplified to:
x ¨ c ( t ) + k A + k B M x c ( t ) = 1 M F c ( t )
Knowing that the mass of the slide is M = 28 kg and that the stiffness of the aerostatic bearing kA = kB = 625,000 N/mm, the natural frequency of the slide can be obtained as ωn = 207.02 Hz.
The structure of the vacuum-preloaded porous aerostatic bearing consists of a rectangular vacuum cavity in the center of the bearing and a porous restrictor surrounding the vacuum cavity. Therefore, the interference force acting on the slide mainly includes three components, one of which is generated by the vacuum cavity. The second is the disturbance of the bearing thrust caused by the fluctuation of the air supply pressure, and the third is a disturbance outside the system (such as cutting force). The direction of action of the interference force at the center of mass of the slide is the normal direction of the thrust surface of the bearing. Assuming that the X-axis slide is only subjected to external sinusoidal disturbances from the vertical direction,
F c ( t ) = F 0 s i n ω t
Assuming t = 0, x(0) = x0, and v(0) = v0, the solution for the forced vibration of the slide is:
x c = x 0 c o s ω n t + v 0 ω n s i n ω n t B λ 1 λ 2 s i n ω n t + B 1 λ 2 s i n ω t
where λ = ω ω n ,   B = F c k A + k B .
According to the above dynamic model of the slide, assuming that the initial speed of the slide is x(0) = x0 = 0 and v(0) = v0 = 0, the solution for the forced vibration of the slide can be simplified as:
x c = B λ 1 λ 2 s i n ω n t + B 1 λ 2 s i n ω t
When ω << ωn, Equation (5) can be simplified as:
x c = B s i n ω t

3. Experiment of Diamond Micro-Planing and Power Spectral Density Analysis of Surface Profile

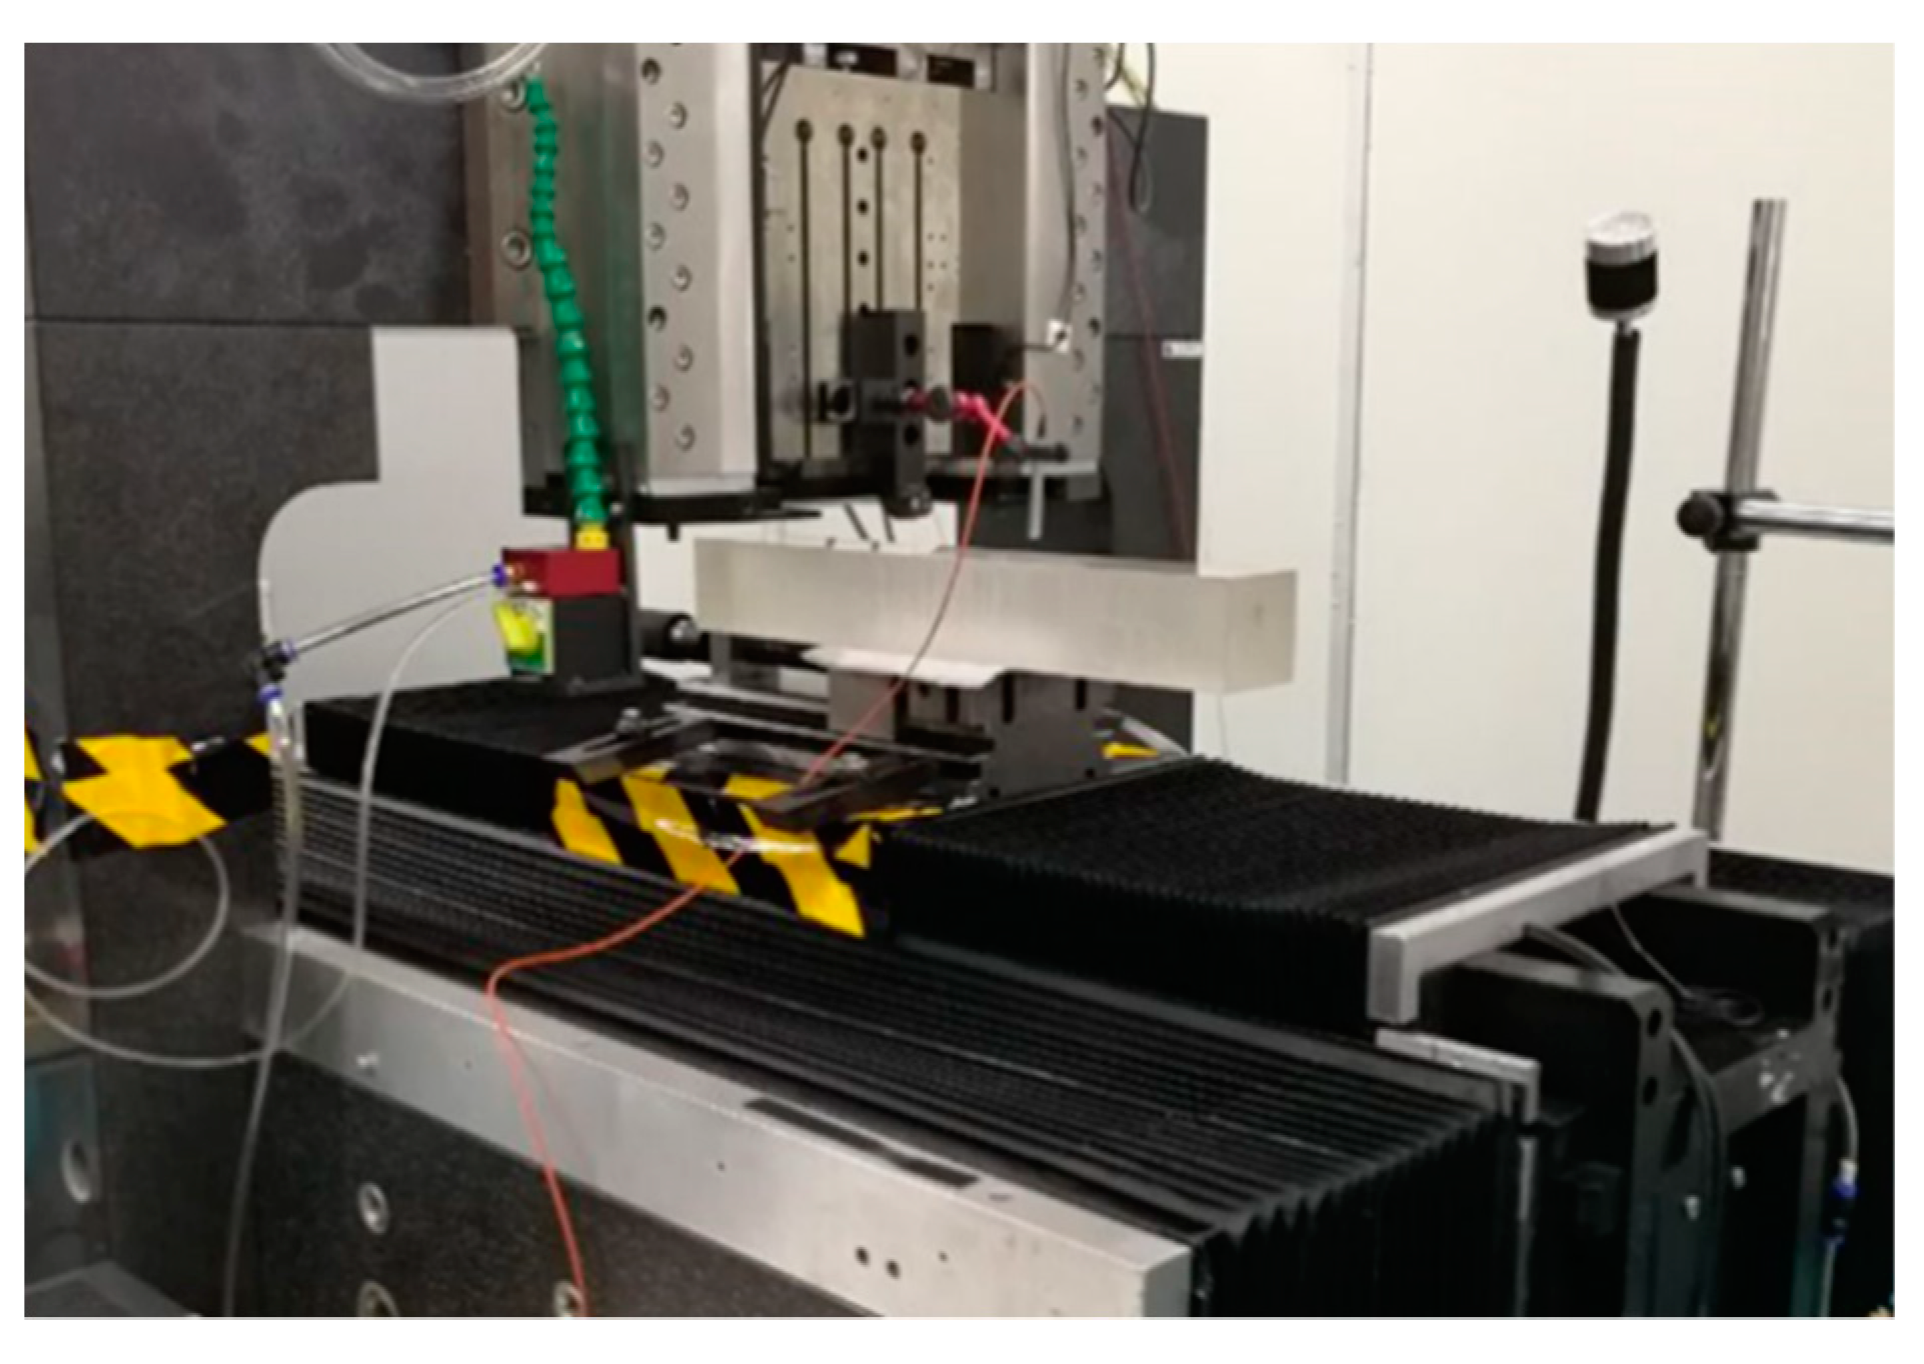
In this study, a self-developed three-axis machine tool was used as the platform, and a micro-planing experiment was carried out on the surface of oxygen-free copper using natural diamond tools, as shown in Figure 3. The diamond tool was clamped on the Z-axis, and the oxygen-free copper workpiece was clamped on the X-axis worktable by a vice. The size of the workpiece to be processed was 15 × 22 mm. The tool parameters and basic parameters of planing are shown in Table 1. The selected tool-tip radius is large, suitable for rough and semi-finished machining, and the machining efficiency is relatively high. Diamond tools can generally process nonferrous metals, and oxygen-free copper, as a common optical mold material, was used as the material to be machined in this work.
During the planing process, the X-axis was used as the planing direction, and the Y-axis was used as the feed direction. In the tool setting step, after the relative positions of the tool and the workpiece in the Z direction were determined, the Z-axis remained at the given target position and was always in the servo state. After a single planing action was completed, the X and Y-axis motions were used to complete the tool retraction and feed action. The G-code command of the WHILE cycle was used to complete the planing process for oxygen-free copper by the cyclic tool path processing method. The influence of the Z-axis on machining can be excluded. The tool path trajectory is shown in Figure 4. This processing method can ensure that the processing time for each groove is equal and the processing interval between two adjacent grooves is equal, and it is convenient for the subsequent analysis of the relative vibration between the tool tip and the workpiece time-domain characteristics.
According to the parameters in Table 2, it can be calculated that the single complete planing cycle T0 is 18.000 s, the corresponding frequency f0 is 0.056 Hz, and the contact time t between the tool and the workpiece is 2.640 s. When the machine tool is processing, the relative vibration between the tool tip and the workpiece will be reflected on the surface of the workpiece, and its manifestations are spatial ripples of different amplitudes and wavelengths. To study the relationship between the relative vibration and the surface morphology of the workpiece, it is necessary to establish the relationship between the vibration frequency (time domain) and the spatial wavelength of the ripples on the workpiece surface (spatial domain). The surface morphology of planing is determined by the ratio of the vibration frequency ft between the tool tip and the workpiece and the cycle tool path frequency f0:
f t f 0 = I + D
In the formula, I is the integer part of the frequency ratio; D is the fractional part of the frequency ratio; and I represents the number of times that a relative vibration between the tool and the workpiece is completed per cycle of the tool path. The absolute value of |D| represents the phase lag between the tool and the workpiece that cannot complete the entire vibration cycle for each cycle of the tool path. The phase difference in vibration lines between adjacent tool paths of the workpiece is:
φ = 2 π D
The spatial wavelength λ of the ripples formed by the vibration between the tool tip and the workpiece on the workpiece surface along the tool feed direction is
λ = 2 π | φ | f = f | D |
where f is a single cycle feed.
Figure 5 shows the use of a BRUGER white-light interferometer to detect the three-dimensional contour of the workpiece, with a measurement area of 2.5 mm × 1.9 mm. It can be seen in Figure 6 that there are obvious “ripples” with ups and downs in the feed direction, and the PV values of these lines are about 100~120 nm. According to the machining and tool parameters, the theoretical roughness Ra is 4.97 nm, so it can be judged that the wave is not a sharp point left by the continuous feeding of the tool, so it is speculated that the cause of the lines is the relative movement between the tool and the workpiece in the vertical direction.
Figure 7 shows the one-dimensional power spectral density curve in the feed direction. In the figure, it can be seen that the spatial wavelength has an obvious peak at λ0 = 0.281 mm. However, in other ranges, the power spectral density curve is relatively flat, and the wavelength 
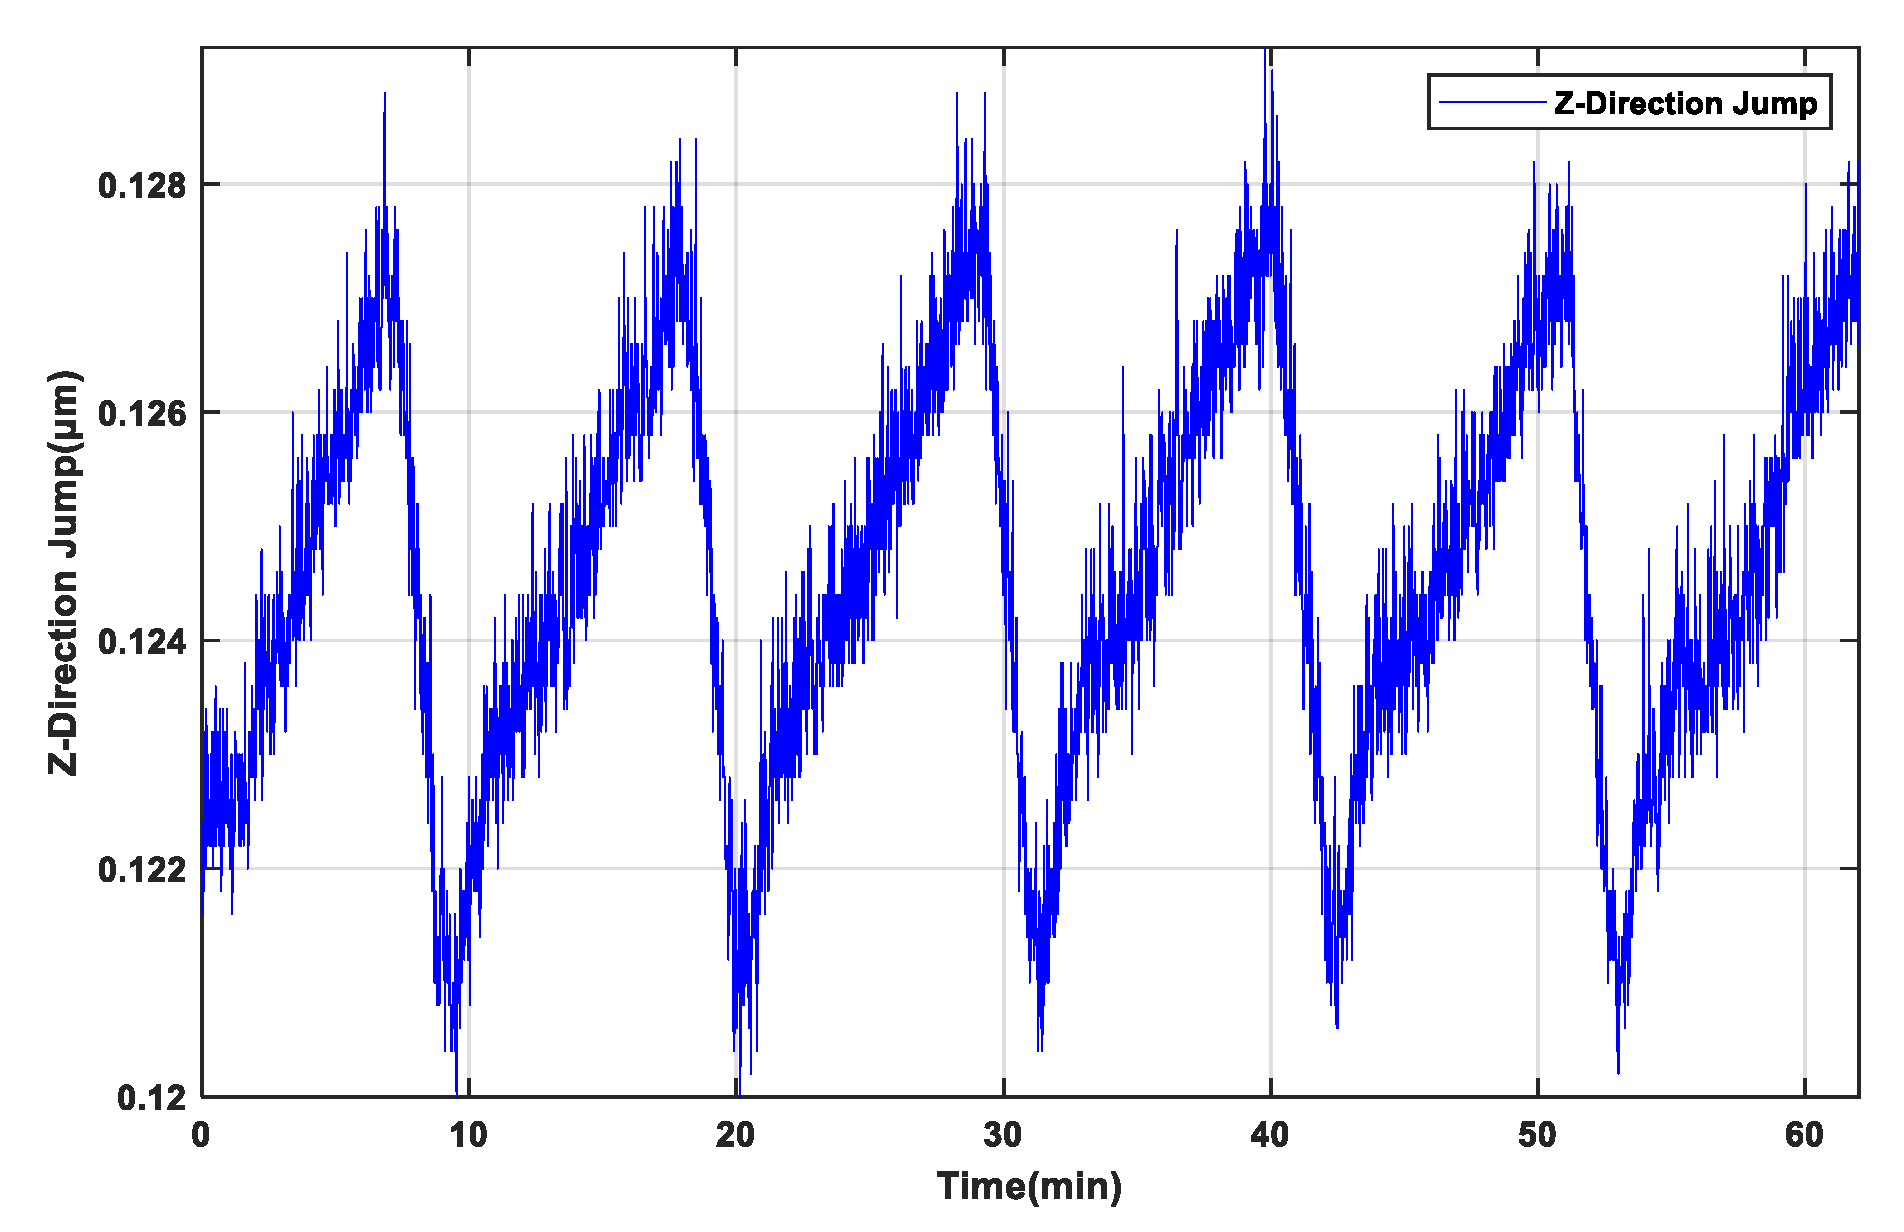
λ0 accounts for 60.1% of the original surface, which greatly affects the machining surface shape error. According to a single complete planing cycle, it can be calculated that the period T corresponding to the wavelength λ0 is 10.54 min, and the frequency f is 0.00158 Hz. The vibration frequency corresponding to this error was extremely low, which exceeded the measurement range of the piezoelectric vibration sensor. Therefore, the vibration was measured and identified by other means. Subsequently, the same processing parameters and the same diamond tool were used on the machine tool, but the X-axis was used as the feed direction, and the Y-axis was used as the cutting direction; the same situation as above occurred on the machined surface.

4. Machine Tool Error Measurement Experiment

A measurement experiment was designed to verify the existence of the disturbance in Equation (3) and find the cause of the “ripple” on the machined surface. In this experiment, the vibration characteristics of the machine tool in the vertical direction were measured from the perspectives of the space domain and the time domain. The space domain measurement was used to measure the straightness error in the vertical direction of the linear axis of the machine tool, and the time domain was used to measure the X-axis slide. The time-domain vibration characteristics of the straight direction were measured.

4.1. X-Axis and Y-Axis Vertical Straightness Error Measurement

This study used the scanning probe method to measure the straightness of the linear axis of the machine tool, and the measurement standard is in accordance with ISO230-1-2012. A spectral confocal sensor (resolution of 3 nm; maximum sampling frequency of 66 kHz) was used to scan a flat crystal (surface accuracy PV = 0.074 µm; RMS = 0.011 µm), and the position synchronization trigger method was used to collect data. Data were collected using the position synchronization trigger method. The basic principle of the trigger is based on the same displacement interval triggering the sensor data collection. The platform position and sensor data can be collected synchronously. The spectral confocal sensor was measured after 30 min of booting, and the experimental environment temperature was controlled at 20 ± 0.1 °C. The straightness measurement schemes of the X-axis and Y-axis in the vertical direction are shown in Figure 8 and Figure 9, respectively. The flat crystal was placed on the worktable, and the spectral confocal sensor was fixed on the Z-axis. The measurement was repeated three times, and the measurement results are shown in the figure. As shown in Figure 10a and Figure 11a, the three sets of straightness results on the two linear axes have good repeatability. The straightness error in the X-axis vertical direction is 300 nm/250 mm, and the straightness error in the Y-axis vertical direction is 150 nm/180 mm. Due to the small machining area, the straightness data of the processed coordinate area were analyzed according to the corresponding machine tool coordinate values during planing. As shown in Figure 10b and Figure 11b, the X-axis straightness measurement result is less than ±15 nm/20 mm, and the Y-axis straightness measurement result is less than ±25 nm/20 mm.
The scanning method was used to complete the measurement of the straightness of the full stroke within 10 s. According to the measurement and analysis results of the straightness, it can be seen that the amplitude and period of the vertical straightness error in the machining area do not match the results presented on the surface of the workpiece to be machined, and the corresponding periods are quite different. Therefore, it can be concluded that the amplitude and frequency of the straightness errors in the X-axis and Y-axis vertical directions are significantly different from the contour errors.

4.2. Time-Domain Runout Measurement in the Vertical Direction of the X-Axis Slide

As shown in Figure 12, an optical flat crystal with a diameter of 90 mm (surface accuracy PV = 52 nm) was placed on the worktable, and a spectral confocal sensor was also used to measure the time-domain runout of the machine tool in the vertical direction. During the measurement process, the X-axis, Y-axis, and Z-axis were all kept in a servo state.
The time-domain vibration measurement results in the vertical direction are shown in Figure 13. It can be seen from the figure that there is relatively regular vibration in the vertical direction, the vibration period T is 11.1 min, and the vibration amplitude is ±50 nm. According to the measured vibration characteristics in the vertical direction, it can be calculated that the spatial wavelength λ of the ripple formed by the vibration between the tool tip and the workpiece on the workpiece surface along the tool feed direction is 0.296 mm. The results of the surface power spectral density, λ0 = 0.281 mm, are in good agreement, as the error between them is 5.3%, and the vibration amplitude in the vertical direction is also in good agreement with the measurement results of the surface topography.

5. Three-Dimensional Profile Simulation of Micro-Planing

The processing method used in this study was cyclic continuous planing processing, in which the relationship between the X, Y motion trajectory and the processing time can be expressed as:
x ( t ) = { 0 , [ t 1 + i T , t 2 + i T ] 0 , [ t 2 + i T , t 3 + i T ] f x t , [ t 3 + i T , t 4 + i T ] 35 , [ t 4 + i T , t 5 + i T ] 35 f x t , [ t 5 + i T , t 6 + i T ] ,   y ( t ) = { f y 1 t , [ t 1 + i T , t 2 + i T ] 15.992 + f y 2 ( t t 2 ) , [ t 2 + i T , t 3 + i T ] 16 , [ t 3 + i T , t 4 + i T ] 16 f y 1 ( t t 4 ) , [ t 4 + i T , t 5 + i T ] - 0.008 i , [ t 5 + i T , t 6 + i T ]
Among them, t1, t2, t3, t4, t5, and t6 represent the times when the linear axis of the machine tool reaches the corresponding tool path points 1, 2, 3, 4, 5′, and 1′ for the first time; i represents the i-th planing tool path cycle; T is the time of a single planing process; and fx and fy represent the feed rates of the X-axis and Y-axis, respectively.
From the analysis of the measurement results in the previous section, it is found that there is vibration in the vertical direction of the X-axis slide. Considering the vibration characteristics, the three-dimensional contour of the planing process will also be affected. Taking into account the machining tool path, tool parameters, and vertical vibration, the three-dimensional contour of the planed workpiece was obtained through simulations, as shown in Figure 14, and the two-dimensional contour in the feed direction is shown in Figure 15.
Comparing the above three-dimensional profile with the results of the white-light interferometer, it can be seen that the profile vibration amplitude and period in the feed direction are in good agreement. From the simulation point of view, it is verified that the vertical vibration of the slide is an important factor that causes the periodic error of the planing surface.
Since the vibration characteristics in the vertical direction were obtained based on the sinusoidal periodic disturbance, the two-dimensional profile curve cannot completely match the actual measurement results. Therefore, it is necessary to further analyze the generation mechanism of the external disturbance on the slide and establish an accurate external disturbance model. Then, more accurate output displacement characteristics of the slider can be obtained.

6. Conclusions

In this study, a dynamic model of a porous aerostatic guideway in the vertical direction was established. Secondly, an oxygen-free copper micro-planing experiment of the machine tool was carried out, the three-dimensional topography of the planing surface was measured, the features of the surface topography were extracted by the PSD method, and the main mode shapes of the surface shape errors of the workpiece were obtained by analysis. Then, the straightness error measurement on the X-axis and Y-axis in the vertical direction and the time-domain runout measurement in the vertical direction of the X-axis were carried out using the three-axis machine tool. The main conclusions are as follows:
  • On the basis of the vertical dynamic model of the slide established in this paper, the output displacement of the slide subjected to a sinusoidal disturbance at a lower frequency was obtained.
  • By analyzing the PSD of the contour of the planed workpiece, the spatial frequency of the contour error was obtained and is in good agreement with the contour errors in the feed direction of the workpiece.
  • The processing area’s vertical straightness error measurement results were analyzed. The X-axis straightness measurement results corresponding to the processing area are less than ±15 nm/20 mm, and the Y-axis straightness measurement results are less than ±25 nm/20 mm. The magnitude and frequency of the straightness errors in the X-axis and Y-axis vertical directions are quite different from the contour errors.
  • According to the vibration characteristics of the time domain of the X-axis slide, the calculated spatial wavelength of the ripples formed on the workpiece surface along the tool feed direction is in good agreement with the analysis results of the PSD.
  • Based on the machining tool path, considering the output displacement of the slide plate subjected to external disturbance, the obtained theoretical three-dimensional contour of the planing process is in good agreement with the workpiece measurement results. The time-domain runout in the vertical direction of the X-axis slide of the machine tool is the main factor causing the “ripple” error of the workpiece morphology.

Author Contributions

Conceptualization, J.Y. and Z.Y.; methodology, J.Y.; software, J.Y.; validation, Z.Y.; formal analysis, J.Y.; investigation, J.Y.; resources, J.Y. and Y.G.; data curation, J.Y.; writing—original draft preparation, Z.Y.; writing—review and editing, Z.Y.; visualization, Y.G.; supervision, Z.Y.; project administration, Z.Y.; funding acquisition, Z.Y. All authors have read and agreed to the published version of the manuscript.

Funding

This work is supported in part by the Science and Technology Program of Guangzhou, China under Grant 201804020040 and in part by the National Natural Science Foundation of China under Grant 51575520.

Institutional Review Board Statement

Not applicable.

Informed Consent Statement

Not applicable.

Data Availability Statement

Not applicable.

Conflicts of Interest

The authors declare no conflict of interest.

References

  1. Brinksmeier, E.; Gläbe, R.; Schönemann, L. Review on diamond-machining processes for the generation of functional surface structures. CIRP J. Manuf. Sci. Technol. 2012, 5, 1–7. [Google Scholar] [CrossRef]
  2. Brecher, C.; Baum, C.; Winterschladen, M.; Wenzel, C. Dynamic long axis for ultra-precision machining of optical linear structures. Prod. Eng. 2007, 1, 315–319. [Google Scholar] [CrossRef]
  3. Takeuchi, Y.; Yoneyama, Y.; Ishida, T.; Kawai, T. 6-Axis control ultraprecision microgrooving on sculptured surfaces with non-rotational cutting tool. CIRP Ann. 2009, 58, 53–56. [Google Scholar] [CrossRef]
  4. Cheung, C.F.; Lee, W.B. Characterisation of nanosurface generation in single-point diamond turning. Int. J. Mach. Tool. Manu. 2001, 41, 851–875. [Google Scholar] [CrossRef]
  5. Luo, X.; Cheng, K.; Ward, R. The effects of machining process variables and tooling characterisation on the surface generation. Int. J. Adv. Manuf. Technol. 2005, 25, 1089–1097. [Google Scholar] [CrossRef] [Green Version]
  6. Kim, D.; Chang, I.; Kim, S. Microscopic topographical analysis of tool vibration effects on diamond turned optical surfaces. Precis. Eng. 2002, 26, 168–174. [Google Scholar] [CrossRef]
  7. Kawai, T.; Ebihara, K.; Takeuchi, Y. Improvement of Machining Accuracy of 5-Axis Control Ultraprecision Machining by Means of Laminarization and Mirror Surface Finishing. CIRP Ann.—Manuf. Technol. 2005, 54, 329–332. [Google Scholar] [CrossRef]
  8. Yoshimura, T.; Hanafusa, T.; Kitagawa, T.; Hirayama, T.; Matsuoka, T.; Yabe, H. Clarifications of the mechanism of nano-fluctuation of aerostatic thrust bearing with surface restriction. Tribol. Int. 2012, 48, 29–34. [Google Scholar] [CrossRef]
  9. Stout, K.J.; Barrans, S.M. The design of aerostatic bearings for application to nanometre resolution manufacturing machine systems. Tribol. Int. 2000, 33, 803–809. [Google Scholar] [CrossRef]
  10. Zhou, Y.; Chen, X.; Chen, H. A hybrid approach to the numerical solution of air flow field in aerostatic thrust bearings. Tribol. Int. 2016, 102, 444–453. [Google Scholar] [CrossRef]
  11. Yifei, L.; Yihui, Y.; Hong, Y.; Xinen, L.; Jun, M.; Hailong, C. Modeling for optimization of circular flat pad aerostatic bearing with a single central orifice-type restrictor based on CFD simulation. Tribol. Int. 2017, 109, 206–216. [Google Scholar] [CrossRef]
  12. Aoyama, T.; Kakinuma, Y.; Kobayashi, Y. Numerical and Experimental Analysis for the Small Vibration of Aerostatic Guideways. CIRP Ann. 2006, 55, 419–422. [Google Scholar] [CrossRef]
  13. Chen, M.F.; Huang, W.L.; Chen, Y.P. Design of the aerostatic linear guideway with a passive disk-spring compensator for PCB drilling machine. Tribol. Int. 2010, 43, 395–403. [Google Scholar] [CrossRef]
  14. Aoyama, T.; Koizumi, K.; Kakinuma, Y.; Kobayashi, Y. Numerical and experimental analysis of transient state micro-bounce of aerostatic guideways caused by small pores. CIRP Ann. 2009, 58, 367–370. [Google Scholar] [CrossRef]
  15. Zhu, J.; Chen, H.; Chen, X. Large eddy simulation of vortex shedding and pressure fluctuation in aerostatic bearings. J. Fluid. Struct. 2013, 40, 42–51. [Google Scholar] [CrossRef]
  16. Zhang, S.J.; To, S.; Wang, H.T. A theoretical and experimental investigation into five-DOF dynamic characteristics of an aerostatic bearing spindle in ultra-precision diamond turning. Int. J. Mach. Tools Manuf. 2013, 71, 1–10. [Google Scholar] [CrossRef]
Figure 1. The basic arrangement of the X-axis and Y-axis of a three-axis machine tool.
Applsci 12 11022 g001
Figure 2. Dynamic model of vertical direction of X-axis slide.
Applsci 12 11022 g002
Figure 3. Diamond planing experiment.
Applsci 12 11022 g003
Figure 4. Planing cycle tool path diagram.
Applsci 12 11022 g004
Figure 5. Planing surface topography.
Applsci 12 11022 g005
Figure 6. Two-dimensional contour curve in the feed direction.
Applsci 12 11022 g006
Figure 7. One-dimensional power spectral density curve in the feed direction.
Applsci 12 11022 g007
Figure 8. Straightness measurement in X-axis vertical direction.
Applsci 12 11022 g008
Figure 9. Straightness measurement in Y-axis vertical direction.
Applsci 12 11022 g009
Figure 10. (a) Straightness error in the X-axis vertical direction. (b) Straightness error of machining position in X-axis vertical direction.
Applsci 12 11022 g010
Figure 11. (a) Straightness error in the Y-axis vertical direction. (b) Straightness error of machining position in Y-axis vertical direction.
Applsci 12 11022 g011
Figure 12. Time-domain vibration measurement in the vertical direction.
Applsci 12 11022 g012
Figure 13. Time-domain vibration measurement results in the vertical direction.
Applsci 12 11022 g013
Figure 14. Three-dimensional profile simulation results of planing machining.
Applsci 12 11022 g014
Figure 15. Two-dimensional profile of simulation results in the feed direction.
Applsci 12 11022 g015
Table 1. Parameters of diamond tool and workpiece.
Tool Rake Angle
(°)
Tool Clearance Angle
(°)
Tool Radius
(mm)
Tool Sharp Corner (°)Single Feed—f
(mm/Cycle)
Depth of Cut (mm)
0151.61600.0080.005
Table 2. Parameters of diamond planing.
PositionLength (mm)Feed Velocity (mm/min)Action
1–215.992200Feeding
2–30.0085Feeding
3–435500Planing
4–5′15.992200Retracting
5′–1′35500Retracting
Publisher’s Note: MDPI stays neutral with regard to jurisdictional claims in published maps and institutional affiliations.

